Embed Size (px)
Citation preview
Abstract
Objectives
Methodology
Conclusions
Siddhesh Salunke and Hosahalli S. RamaswamyMcGill University Dept. of Food Science and Agricultural Chem., Ste-Anne-de-Bellevue, QC Canada
References
The following work was carried out with following sub-
objectives:
1. To evaluate the influence of extrusion process
variables (F, O, P and W) on physical properties of
dried extrudates, using response surface
methodology (RSM) to understand the nature of the
process and identify system variables.
2. To compare the quality parameters (sensory attributes
as well as physical characteristics) of extruded-dried
products (stable for storage and marketing) following
frying in oil versus microwave roasting.
Protein rich extruded snack product prepared from finger millet flour based blends
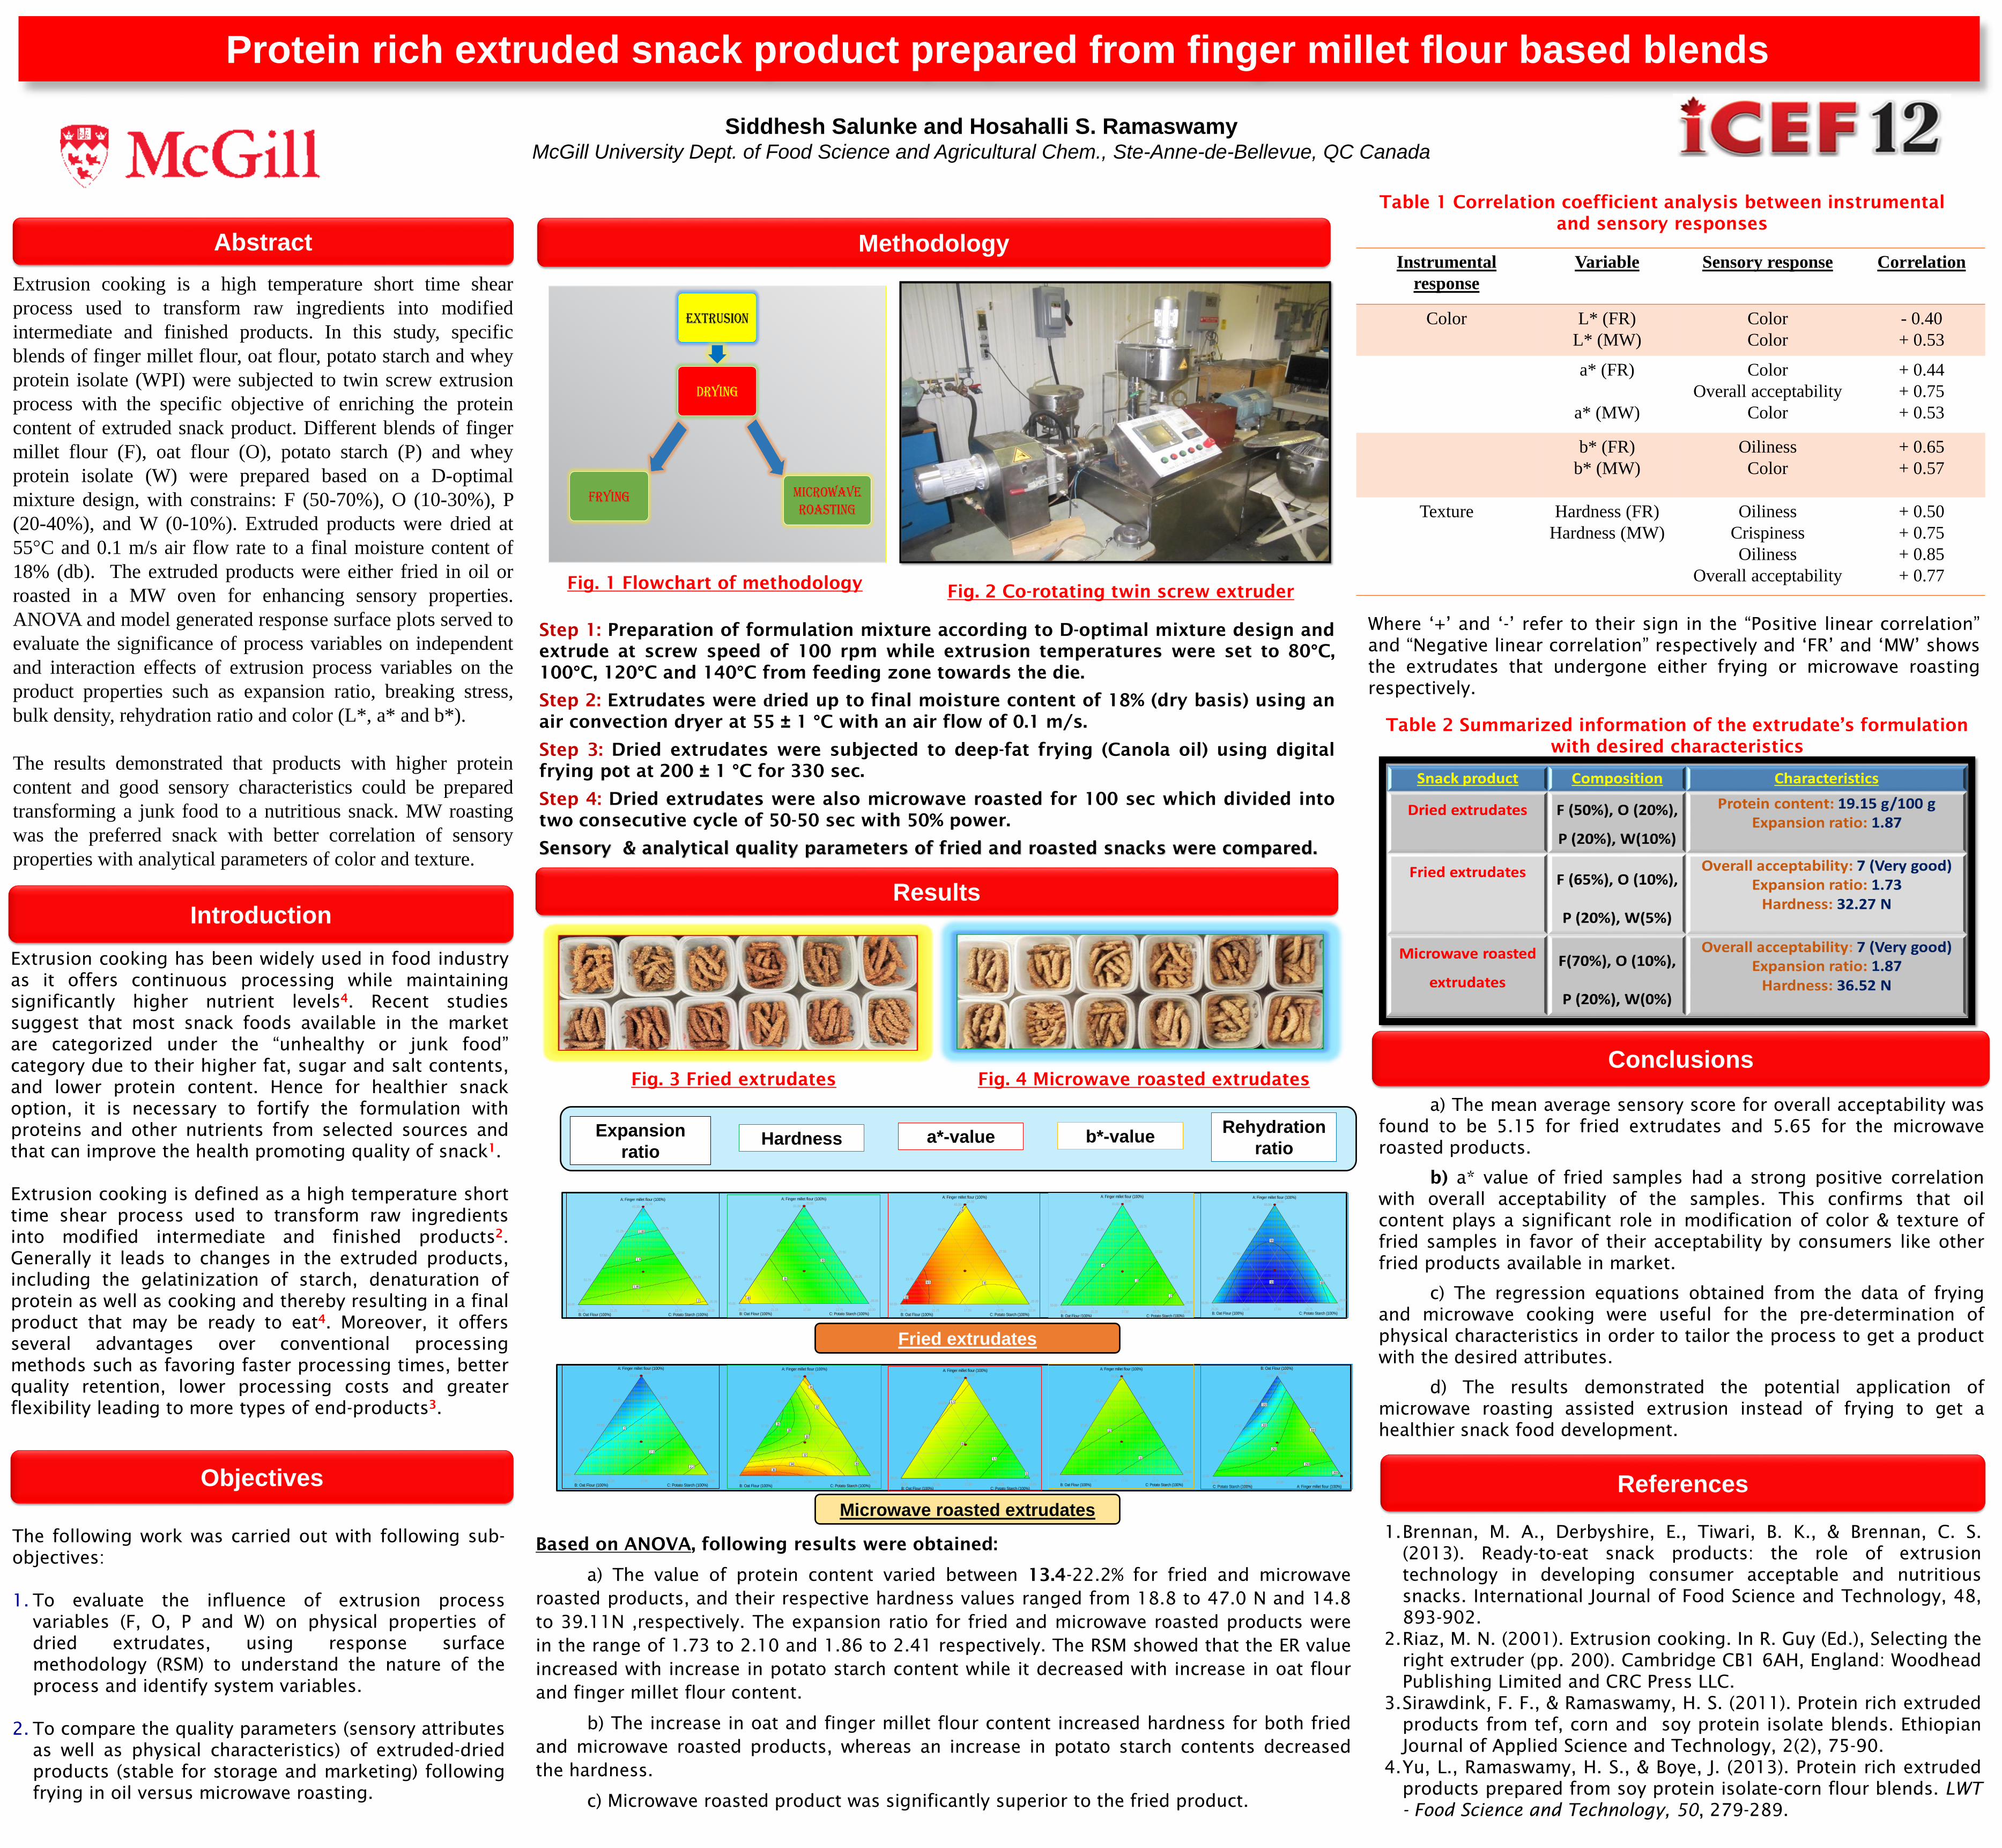
Results
Where ‘+’ and ‘-’ refer to their sign in the “Positive linear correlation”
and “Negative linear correlation” respectively and ‘FR’ and ‘MW’ shows
the extrudates that undergone either frying or microwave roasting
respectively.
1.Brennan, M. A., Derbyshire, E., Tiwari, B. K., & Brennan, C. S.
(2013). Ready-to-eat snack products: the role of extrusion
technology in developing consumer acceptable and nutritious
snacks. International Journal of Food Science and Technology, 48,
893-902.
2.Riaz, M. N. (2001). Extrusion cooking. In R. Guy (Ed.), Selecting the
right extruder (pp. 200). Cambridge CB1 6AH, England: Woodhead
Publishing Limited and CRC Press LLC.
3.Sirawdink, F. F., & Ramaswamy, H. S. (2011). Protein rich extruded
products from tef, corn and soy protein isolate blends. Ethiopian
Journal of Applied Science and Technology, 2(2), 75-90.
4.Yu, L., Ramaswamy, H. S., & Boye, J. (2013). Protein rich extruded
products prepared from soy protein isolate-corn flour blends. LWT
- Food Science and Technology, 50, 279-289.
Expansion
ratioHardness a*-value b*-value
Rehydration
ratio
Fried extrudates
Microwave roasted extrudates
Design-Expert® SoftwareComponent Coding: ActualExpansion Ratio (After frying)
Design Points2.1
1.73
X1 = A: Finger millet flourX2 = B: Oat FlourX3 = C: Potato Starch
Actual ComponentD: WPI = 5.00
A: Finger millet flour (100%)
B: Oat Flour (100%) C: Potato Starch (100%)
Expansion Ratio
65.00
25.00
35.00
61.25
21.25
31.25
57.50
17.50
27.50
53.75
13.75
23.75
50.00
10.00
20.00
1.85
1.9
1.95
2
Design-Expert® SoftwareComponent Coding: ActualHardness ((N))
Design Points46.96
18.78
X1 = A: Finger millet flourX2 = B: Oat FlourX3 = C: Potato Starch
Actual ComponentD: WPI = 5.00
A: Finger millet flour (100%)
B: Oat Flour (100%) C: Potato Starch (100%)
Hardness ((N))
65.00
25.00
35.00
61.25
21.25
31.25
57.50
17.50
27.50
53.75
13.75
23.75
50.00
10.00
20.00
30
35
40
Design-Expert® SoftwareComponent Coding: Actuala * value
Design Points7.72
3.16
X1 = A: Finger millet flourX2 = B: Oat FlourX3 = C: Potato Starch
Actual ComponentD: WPI = 5.00
A: Finger millet flour (100%)
B: Oat Flour (100%) C: Potato Starch (100%)
a * value
65.00
25.00
35.00
61.25
21.25
31.25
57.50
17.50
27.50
53.75
13.75
23.75
50.00
10.00
20.00
5
5.5
6
6.5
Design-Expert® SoftwareComponent Coding: Actuala * value
Design Points9.7
6.87
X1 = A: Finger millet flourX2 = B: Oat FlourX3 = C: Potato Starch
Actual ComponentD: WPI = 5.00
A: Finger millet flour (100%)
B: Oat Flour (100%) C: Potato Starch (100%)
a * value
65.00
25.00
35.00
61.25
21.25
31.25
57.50
17.50
27.50
53.75
13.75
23.75
50.00
10.00
20.00
9
9
9.5
10
Design-Expert® SoftwareComponent Coding: Actualb * value
Design Points2.78
-8.16
X1 = A: Finger millet flourX2 = B: Oat FlourX3 = C: Potato Starch
Actual ComponentD: WPI = 5.00
A: Finger millet flour (100%)
B: Oat Flour (100%) C: Potato Starch (100%)
b * value
65.00
25.00
35.00
61.25
21.25
31.25
57.50
17.50
27.50
53.75
13.75
23.75
50.00
10.00
20.00
-4
-3
-2
Design-Expert® SoftwareComponent Coding: Actualb * value
Design Points15.21
7.82
X1 = A: Finger millet flourX2 = B: Oat FlourX3 = C: Potato Starch
Actual ComponentD: WPI = 5.00
A: Finger millet flour (100%)
B: Oat Flour (100%) C: Potato Starch (100%)
b * value
65.00
25.00
35.00
61.25
21.25
31.25
57.50
17.50
27.50
53.75
13.75
23.75
50.00
10.00
20.00
11
12
Design-Expert® SoftwareComponent Coding: ActualRehydration Ratio (Percent (%))
Design Points423
95.15
X1 = B: Oat FlourX2 = C: Potato StarchX3 = A: Finger millet flour
Actual ComponentD: WPI = 5.00
B: Oat Flour (100%)
C: Potato Starch (100%) A: Finger millet flour (100%)
Rehydration Ratio (Percent (%))
25.00
35.00
65.00
21.25
31.25
61.25
17.50
27.50
57.50
13.75
23.75
53.75
10.00
20.00
50.00
150
200
200
250
250
300
Design-Expert® SoftwareComponent Coding: ActualRehydration Ratio (Percent (%))
Design Points87.96
51.09
X1 = A: Finger millet flourX2 = B: Oat FlourX3 = C: Potato Starch
Actual ComponentD: WPI = 5.00
A: Finger millet flour (100%)
B: Oat Flour (100%) C: Potato Starch (100%)
Rehydration Ratio (Percent (%))
65.00
25.00
35.00
61.25
21.25
31.25
57.50
17.50
27.50
53.75
13.75
23.75
50.00
10.00
20.00
50
55
60
Design-Expert® SoftwareComponent Coding: ActualHardness ((N))
Design Points39.11
14.78
X1 = A: Finger millet flourX2 = B: Oat FlourX3 = C: Potato Starch
Actual ComponentD: WPI = 5.00
A: Finger millet flour (100%)
B: Oat Flour (100%) C: Potato Starch (100%)
Hardness ((N))
65.00
25.00
35.00
61.25
21.25
31.25
57.50
17.50
27.50
53.75
13.75
23.75
50.00
10.00
20.00
26
28
30
30
32
32
34
34
36
Design-Expert® SoftwareComponent Coding: ActualExpansion Ratio
Design Points2.41
1.86
X1 = A: Finger millet flourX2 = B: Oat FlourX3 = C: Potato Starch
Actual ComponentD: WPI = 5.00
A: Finger millet flour (100%)
B: Oat Flour (100%) C: Potato Starch (100%)
Expansion Ratio
65.00
25.00
35.00
61.25
21.25
31.25
57.50
17.50
27.50
53.75
13.75
23.75
50.00
10.00
20.00
2
2.1
2.2
Step 1: Preparation of formulation mixture according to D-optimal mixture design and
extrude at screw speed of 100 rpm while extrusion temperatures were set to 80°C,
100°C, 120°C and 140°C from feeding zone towards the die.
Step 2: Extrudates were dried up to final moisture content of 18% (dry basis) using an
air convection dryer at 55 ± 1 °C with an air flow of 0.1 m/s.
Step 3: Dried extrudates were subjected to deep-fat frying (Canola oil) using digital
frying pot at 200 ± 1 °C for 330 sec.
Step 4: Dried extrudates were also microwave roasted for 100 sec which divided into
two consecutive cycle of 50-50 sec with 50% power.
Sensory & analytical quality parameters of fried and roasted snacks were compared.
Fig. 2 Co-rotating twin screw extruder Fig. 1 Flowchart of methodology
Table 1 Correlation coefficient analysis between instrumental
and sensory responses
Table 2 Summarized information of the extrudate’s formulation
with desired characteristics
Fig. 3 Fried extrudates Fig. 4 Microwave roasted extrudates
Introduction
Extrusion cooking has been widely used in food industry
as it offers continuous processing while maintaining
significantly higher nutrient levels4. Recent studies
suggest that most snack foods available in the market
are categorized under the “unhealthy or junk food”
category due to their higher fat, sugar and salt contents,
and lower protein content. Hence for healthier snack
option, it is necessary to fortify the formulation with
proteins and other nutrients from selected sources and
that can improve the health promoting quality of snack1.
Extrusion cooking is defined as a high temperature short
time shear process used to transform raw ingredients
into modified intermediate and finished products2.
Generally it leads to changes in the extruded products,
including the gelatinization of starch, denaturation of
protein as well as cooking and thereby resulting in a final
product that may be ready to eat4. Moreover, it offers
several advantages over conventional processing
methods such as favoring faster processing times, better
quality retention, lower processing costs and greater
flexibility leading to more types of end-products3.
a) The mean average sensory score for overall acceptability was
found to be 5.15 for fried extrudates and 5.65 for the microwave
roasted products.
b) a* value of fried samples had a strong positive correlation
with overall acceptability of the samples. This confirms that oil
content plays a significant role in modification of color & texture of
fried samples in favor of their acceptability by consumers like other
fried products available in market.
c) The regression equations obtained from the data of frying
and microwave cooking were useful for the pre-determination of
physical characteristics in order to tailor the process to get a product
with the desired attributes.
d) The results demonstrated the potential application of
microwave roasting assisted extrusion instead of frying to get a
healthier snack food development.
Instrumental
response
Variable Sensory response Correlation
Color L* (FR)
L* (MW)
Color
Color
- 0.40
+ 0.53
a* (FR)
a* (MW)
Color
Overall acceptability
Color
+ 0.44
+ 0.75
+ 0.53
b* (FR)
b* (MW)
Oiliness
Color
+ 0.65
+ 0.57
Texture Hardness (FR)
Hardness (MW)
Oiliness
Crispiness
Oiliness
Overall acceptability
+ 0.50
+ 0.75
+ 0.85
+ 0.77
Extrusion cooking is a high temperature short time shear
process used to transform raw ingredients into modified
intermediate and finished products. In this study, specific
blends of finger millet flour, oat flour, potato starch and whey
protein isolate (WPI) were subjected to twin screw extrusion
process with the specific objective of enriching the protein
content of extruded snack product. Different blends of finger
millet flour (F), oat flour (O), potato starch (P) and whey
protein isolate (W) were prepared based on a D-optimal
mixture design, with constrains: F (50-70%), O (10-30%), P
(20-40%), and W (0-10%). Extruded products were dried at
55°C and 0.1 m/s air flow rate to a final moisture content of
18% (db). The extruded products were either fried in oil or
roasted in a MW oven for enhancing sensory properties.
ANOVA and model generated response surface plots served to
evaluate the significance of process variables on independent
and interaction effects of extrusion process variables on the
product properties such as expansion ratio, breaking stress,
bulk density, rehydration ratio and color (L*, a* and b*).
The results demonstrated that products with higher protein
content and good sensory characteristics could be prepared
transforming a junk food to a nutritious snack. MW roasting
was the preferred snack with better correlation of sensory
properties with analytical parameters of color and texture.
Based on ANOVA, following results were obtained:
a) The value of protein content varied between 13.4-22.2% for fried and microwave
roasted products, and their respective hardness values ranged from 18.8 to 47.0 N and 14.8
to 39.11N ,respectively. The expansion ratio for fried and microwave roasted products were
in the range of 1.73 to 2.10 and 1.86 to 2.41 respectively. The RSM showed that the ER value
increased with increase in potato starch content while it decreased with increase in oat flour
and finger millet flour content.
b) The increase in oat and finger millet flour content increased hardness for both fried
and microwave roasted products, whereas an increase in potato starch contents decreased
the hardness.
c) Microwave roasted product was significantly superior to the fried product.