Embed Size (px)
Citation preview

SI – 2124PENGANTAR SISTEM
TRANSPORTASI
Harun al-Rasyid LUBIS
Prodi Teknik Sipil
FTSL - ITB
(KULIAH KE-15)

ONOx
HC
Mexico City: the “ideal factory” for ozone producti on
O3 x
2200 meters above sea level

Ambient Air Quality StandardsPollutant Duration of Jakarta National WHO* EPA
Measurement
Sulfur dioxide (SO2) 1 hour 900 900 N/A N/A
24 hours 260 365 125 365
1 year 60 60 50 80
Carbon monoxide (CO) 1 hour 26,000 30,000 30,000 40,000
8 hour N/A N/A 10,000 10,000
24 hours 9,000 10,000 N/A N/A
Nitrogen dioxide (NO2) 1 hour 400 400 200 N/A
24 hours 92.5 150 N/A N/A
1 year 60 100 40 100
Oxidant (O3) 1 hour 200 235 N/A 235
8 hour N/A N/A 120 157
1 year 30 50 N/A N/A
Hydrocarbons 3 hours 160 160 N/A N/A
Particulates < 10 µm (PM10) 24 hours 150 150 N/A 150
1 year N/A N/A N/A 50
Total Suspended Particulates 24 hours 230 230 N/A N/A
(TSP) 1 year 90 90 N/A N/A
Lead (Pb) 1 year N/A 1 0.5 N/A
Note: Unit: in µg/m3. Values are based on the atmospheric conditions at 25oC and pressure 1 atm.
* WHO air quality guidelines

Objectives
• to review recent transport plan and traffic management schemes in DKI Jakarta
• to prepare sustainable transport and traffic management action planning for DKI Jakarta

Main Issues• The social cost of traffic
congestions• Land use plan and control• Road building agenda Vs • Road building agenda Vs
emissions• Public transport promotion and
problems• Resources & Capacity building
BIAYA SOSIAL KEMACETAN
– Kemacetan lalulintas jalan: • Menyebar ke semua waktu • Menyebar hampir ke
semua ruas jalan– Biaya kemacetan:– Biaya kemacetan:
• Pemborosan waktu ; • Pemborosan bok
Bandung (2002) : Rp 1,2 triliun / th ; Rp 1, 8 milyard / hr
Jakarta (2003) : Rp 17,2 triliun / th ; Rp 47 milyard / hr
Jabodetabek (SITRAMP, 2003) : Rp 5,4 trilliun/ th ; 14.8 milyard /hr

Air pollution sources
• Private cars satisfy only 21% of the total transport demand of transport total transport demand of transport but contribute with 35% of transport-related emissions
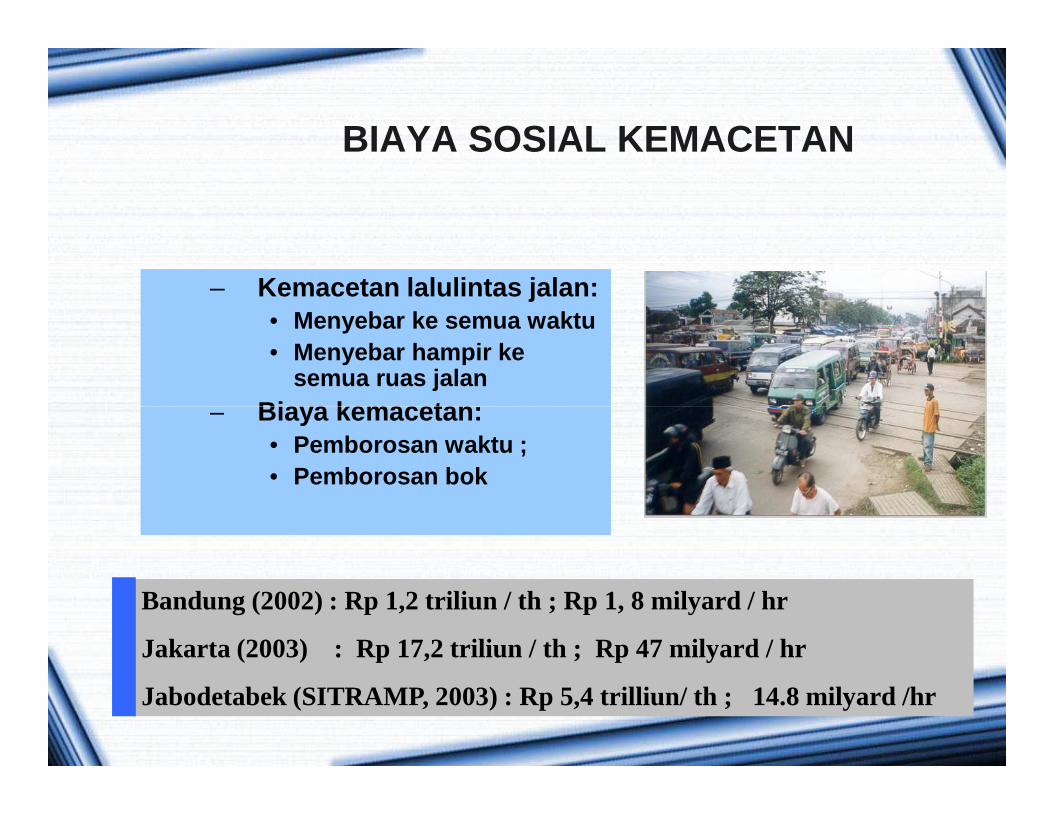
• Most emissions come from aged vehicles (1985-models and older = 70% pollution)
Emission contribution by vehicle model/year
70
80
90
100
% y
ear
/ mod
el 92 and older
total vehicle flleet
0
10
20
30
40
50
60
0 10 20 30 40 50 60 70 80 90 100
% y
ear
/ mod
el
% emisssions
79 and older
85 and older

Factory23%
Un-survey factory
Vehicle(re-suspend)
50%
320(ppb)
Factory55%
Un-survey factory
13%
Household6%
Vehicle(exhoust gas)
28%Factory
31%
Un-survey factory
8%
Household12%
Vehicle49%
Pencemaran Udara Jakarta (2003)
Komposisi Sumber SOx Komposisi Sumber NOx
Sektor transportasi menyumbang dominant emisi NOx sebanyak 49% dan TSP sebanyak 50%. Emisi SOx dominan disumbang oleh pabrik dan secondary kontributor adalah sektor
factory8%
Household8%
50%
Vehicle(exhoust gas)
11% 0(ppb)
90(ppb)
0(ppb)
122(ug/m 3)
2(ug/m3)
Komposisi Sumber TSP Sebaran Spasial SOx
Sebaran Spasial NOx Sebaran Spasial TSP
kontributor adalah sektor transportasi sebanyak 28%
Distribusi spasial pencemaran udara menunjukkan ada beberapa spot area di pusat kota memiliki tingkat polusi yang sangat tinggi

Tata Ruang: Alternatif Penyebaran / formasi kota
PENATAAN HORIZONTAL….

Emission Indicators

Penataan vertikal :The sky city 1000(Takenaka with Shizuo Harada of ESCO Co., Ltd)

STRATEGI & SKENARIO:
MANAJEMEN TRANSPORTASI KOTA
TDM Strategies Scenarios JMTS JORR
Toll Road Arterial Road
Bus- Way
Land Use
Traffic Management
Scenario 1: Do-nothing - - - - - - Scenario 1: Do-nothing - - - - - -
Scenario 2: Business as usual (BAU) - - � - - -
Scenario 3: Land use - - � - � -
Scenario 4: T D M - - � - � �
Scenario 5: Road development - � � - � -
Scenario 6: Mass rapid transit (MRT) � - � � � -
Scenario 7: All Scenarios � � � � � �
Annotation: (�) included (-) not included

SIMULATION RESULTS(1): Traffic Indicators
1200
1500
1800
2100
2400
2700
3000
1995 2000 2005 2010 2015 2020
1,00
0,00
0 p
cu t
rip
/yea
rDo nothingBAU
Land UseTraffic ManagementRoad Development
MRTAll Scenarios
4
6
8
10
12
14
16
1995 2000 2005 2010 2015 2020
km/h
ou
r
Do nothingBAU
Land UseTraffic ManagementRoad Development
MRTAll Scenarios
TRAVELDEMAND
AVERAGESPEED
1995 2000 2005 2010 2015 2020Year 1995 2000 2005 2010 2015 2020Year
15000
20000
25000
30000
35000
40000
1995 2000 2005 2010 2015 2020Year
1,00
0,00
0 p
cu.k
m/y
ear
Do nothingBAU
Land UseTraffic ManagementRoad Development
MRTAll Scenarios
0
1000
2000
3000
4000
5000
6000
7000
1995 2000 2005 2010 2015 2020Year
1,00
0,00
0 p
cu.h
ou
r/ye
ar
Do nothingBAU
Land UseTraffic ManagementRoad Development
MRTAll Scenarios
SYSTEM’STRAVELLENGTH
SYSTEM’STRAVEL TIME

1500
2000
2500
3000
3500
4000
4500
5000
5500
6000
1995 2000 2005 2010 2015 2020
1,00
0,00
0 li
ters
/yea
r
Do nothingBAU
Land UseTraffic ManagementRoad Dev elopment
MRTAll Scenarios
4000000
6000000
8000000
10000000
12000000
14000000
16000000
ton
/yea
r
Do nothingBAU
Land UseTraffic ManagementRoad Dev elopment
MRTAll Scenarios
TOTAL FUELCONSUMPTION
TOTALEMISSION
SIMULATION RESULTS(2): Environment Indicators
1995 2000 2005 2010 2015 2020Year 1995 2000 2005 2010 2015 2020Year
300,000
400,000
500,000
600,000
700,000
800,000
900,000
1995 2000 2005 2010 2015 2020Year
Ton
CO (Do-nothing)CO (BAU)CO (Land Use)CO (Traffic Management)CO (Road Development)CO (MRT)CO (All Scenarios)
40,000
50,000
60,000
70,000
80,000
90,000
100,000
110,000
120,000
1995 2000 2005 2010 2015 2020Year
Ton
NOx (Do-nothing)NOx (BAU)NOx (Land Use)NOx (Traffic Management)NOx (Road Dev elopment)NOx (MRT)NOx (All Scenarios)
COEMISSION
NOxEMISSION

SIMULATION RESULTS(3): Environment Indicators
HCEMISSION
SOx
EMISSION
40,000
50,000
60,000
70,000
80,000
90,000
100,000
110,000
120,000
130,000
1995 2000 2005 2010 2015 2020
Ton
HC (Do-nothing)HC (BAU)HC (Land Use)HC (Traffic Management)HC (Road Dev elopment)HC (MRT)HC (All Scenarios)
2,000
3,000
4,000
5,000
6,000
7,000
Ton
SO2 (Do-nothing)SO2 (BAU)SO2 (Land Use)SO2 (Traffic Management)SO2 (Road Development)SO2 (MRT)SO2 (All Scenarios)
1995 2000 2005 2010 2015 2020Year 1995 2000 2005 2010 2015 2020
Year
SPMEMISSION
CO2
EMISSION
1,000
1,500
2,000
2,500
3,000
3,500
1995 2000 2005 2010 2015 2020Year
Ton
SPM (Do-nothing)SPM (BAU)SPM (Land Use)SPM (Traffic Management)SPM (Road Development)SPM (MRT)SPM (All Scenarios)
5,000,000
6,000,000
7,000,000
8,000,000
9,000,000
10,000,000
11,000,000
12,000,000
13,000,000
14,000,000
15,000,000
1995 2000 2005 2010 2015 2020Year
Ton
CO2 (Do-nothing)CO2 (BAU)CO2 (Land Use)CO2 (Traffic Management)CO2 (Road Development)CO2 (MRT)CO2 (All Scenarios)
Tahun 2000 dari 6 juta ton/tahun total emisi, CO2 menyumbang 90,5% ;
sisanya 9.5% atau sekitar 560 ribu ton/tahun dari emisi lainnya.

Emission by type of vehicles
Gambar 1 Komposisi Sumbangan Emisi Kendaraan di Kota Jakarta
30% 40% 50% 60% 70% 80% 90%
100% Buatan Tahun 1995-1999 Buatan Tahun 1985-1994 Buatan Tahun 1984 ke bawah Sepeda motor
Gambar 2 Komposisi Sumbangan Emisi Kendaraan di Kota Bandung
30% 40% 50% 60% 70% 80% 90%
100% Buatan Tahun 1995-1999 Buatan Tahun 1985-1994 Buatan Tahun 1984 ke bawah Sepeda motor
0% 10% 20%
Jumlah kendaraan Sumbangan emisi 0%
10% 20%
Jumlah kendaraan Sumbangan emisi
• Mobil tua (buatan tahun 1984 ke bawah) bersama-sam a sepeda motor menyumbang emisi 72% di Jakarta dan 90% di Bandung.
• Di Jakarta dengan populasi sepeda motor 52,3%, sumb angan emisinya 57,3%. Bandung sedikit di bawahnya, berkisar 50%.
• Tingginya tingkat emisi sepeda motor diakibatkan po pulasi sepeda motor 2 tak saat ini masih cukup besar.
• Perbandingannya, sepeda motor 2 tak kira-kira memil iki tingkat emisi 3 kali lipat sepeda motor 4 tak.

Conclusions
• The simulation results for Jakarta shows that the MRT provision and land use control options give a higher performance on reducing the system’s travel time, travel distance, fuel consumption and emission
• Road based policy, such as road construction and management, apparently can not reduce the environmental effect of road operation in the both of study areas
• Above all it seems desirable to recommend that effort to reduce trip for road travel were the most effective solution for mitigating the environmental effect of urban road transport system operation. But this policy should be equitable in its implementation.

Proposed ActionIntervention Proposed Action
1. Re-enforce land use control to comply with the DKI Jakarta land use master plan
a. Evaluate the existing land use master plan and prepare a revised version for upto 2010
b. Conduct public hearings on draft regulations for revised
land use under the master plan, through seminars, printed material and electronic media
c. Develop and rationalise urban pricing (land and property tax or incentives) as part of macro economic policy to support and control more sustainable urban system
d. Control new development area so as to function as a self-contained sub center
e. Land improvement should function as mixed-use facilities.
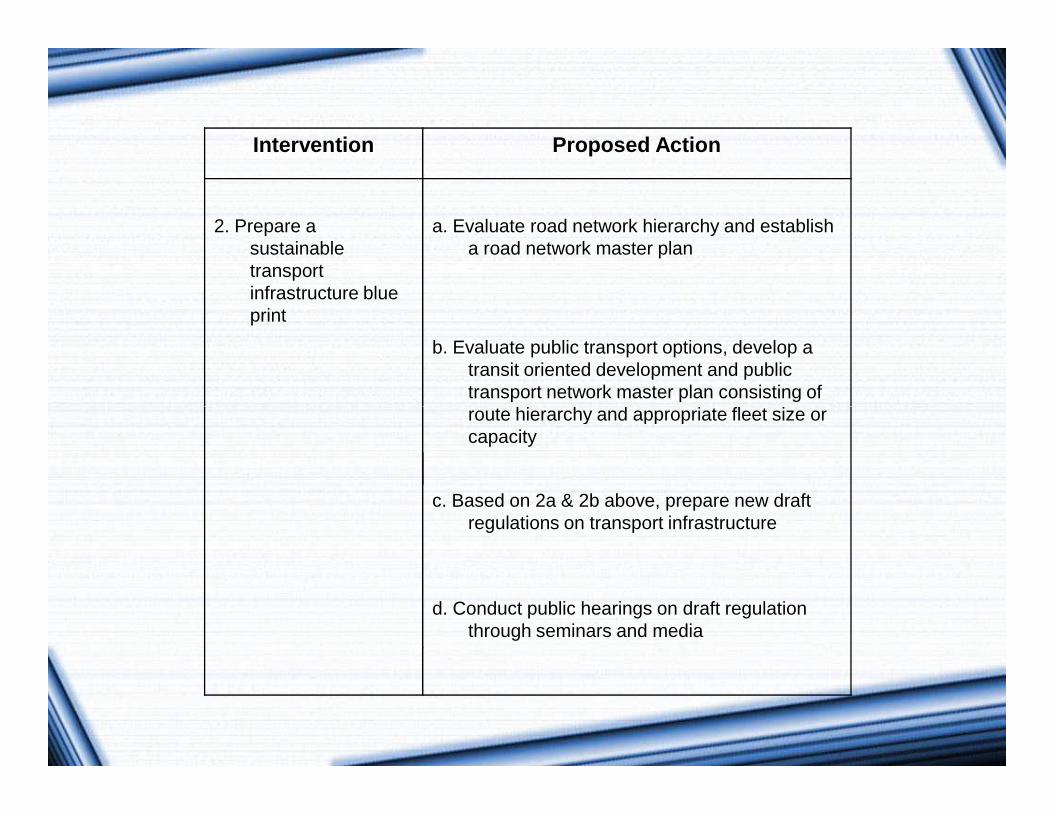
Intervention Proposed Action
2. Prepare a sustainable transport infrastructure blue print
a. Evaluate road network hierarchy and establish a road network master plan
b. Evaluate public transport options, develop a transit oriented development and public transport network master plan consisting of route hierarchy and appropriate fleet size or route hierarchy and appropriate fleet size or capacity
c. Based on 2a & 2b above, prepare new draft regulations on transport infrastructure
d. Conduct public hearings on draft regulation through seminars and media

Intervention Proposed Action
3. Encourage public transport options
a. Continue the promotion of bus rapid transit (bus way) extension plan as well as priority bus initiatives
b. Based on 2b, develop a more competitive licensing mechanism and subsidy mechanism as well as preparing public transport operation planning
c. Conduct public hearings on public transport operation planning
d. Based on 3b and 3c, eventually reform the existing public d. Based on 3b and 3c, eventually reform the existing public transport operation and route hierarchy as well as fleet or vehicle conversion, such angkot to buses
e. Conduct a study on public transport integrated ticketing system
f. Support the spinning-off of the Jabotabek Railway and link the management with the rest of public transport operators in DKI Jakarta
g. Conduct a study to extend the bus way coverage to reach the east and north DKI Jakarta

Intervention Proposed Action4. Develop a comprehensive Travel Demand Management (TDM) scheme
a. Rationalize parking policy so as to restrict car use and
access to central area.
b. Reinforce and expand the coverage of “three in one” policy.
c. Prepare a study on congestion charging, and use the revenues for public transport service improvement
d. Restrict heavy vehicles access to central area during the
day time - loading and unloading only allowed in the
evening or early morning.
e. Introduce car scrappage policy both for public and private vehicles

Intervention Proposed Action
5. Improve pedestrian access and facilities
a. Improve elderly and disabled supported facilities and access
b. Increase the provision of safer and more assessable
pedestrian facilities.

Intervention Proposed Action
6. Improve monitoring, education
a. Widen public involvement in service quality monitoring
and training through the establishment of a hotline or city traffic forum.
b. Upgrade and modernize the Area Traffic Control system.
c. Establish the Council for Jakarta Transport, as independent transport and traffic regulator accountable to the Governor of DKI Jakarta
d. Conduct a pilot project for “traffic discipline area” in some d. Conduct a pilot project for “traffic discipline area” in some main roads, monitored by independent traffic observers, consisting of Dishub, Traffic Police, City Court or Justice unit and civil society
e. Promote and conduct school kids traffic education
f. Develop modules and conduct transport and traffic training for transport administrators, operators as well as public transport drivers.
f. Conduct annual car free day campaign


Transport GeographyChapter 8 – Transportation and the
EnvironmentConcepts
Copyright © 1999-2004, Jean-Paul Rodrigue, Dept. of Economics & Geography, Hofstra University, Hempstead, NY, 11549 [email protected]@hofstra.eduYou may use the figures within for educational purposes only. No modification or redistribution permitted.For more information: http://people.hofstra.edu/geotrans

Concept 1
The Emerging Issue of Transport and the Environment
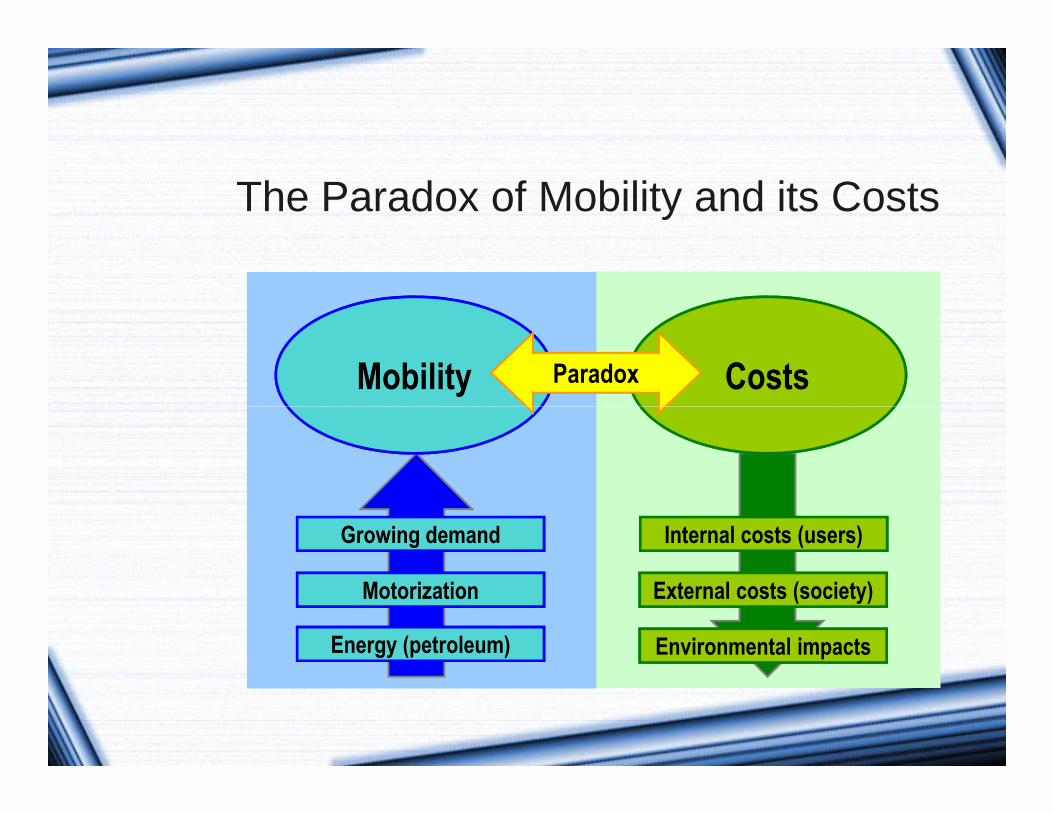
The Paradox of Mobility and its Costs
Mobility CostsParadox
Growing demand
Motorization
Energy (petroleum)
Internal costs (users)
External costs (society)
Environmental impacts
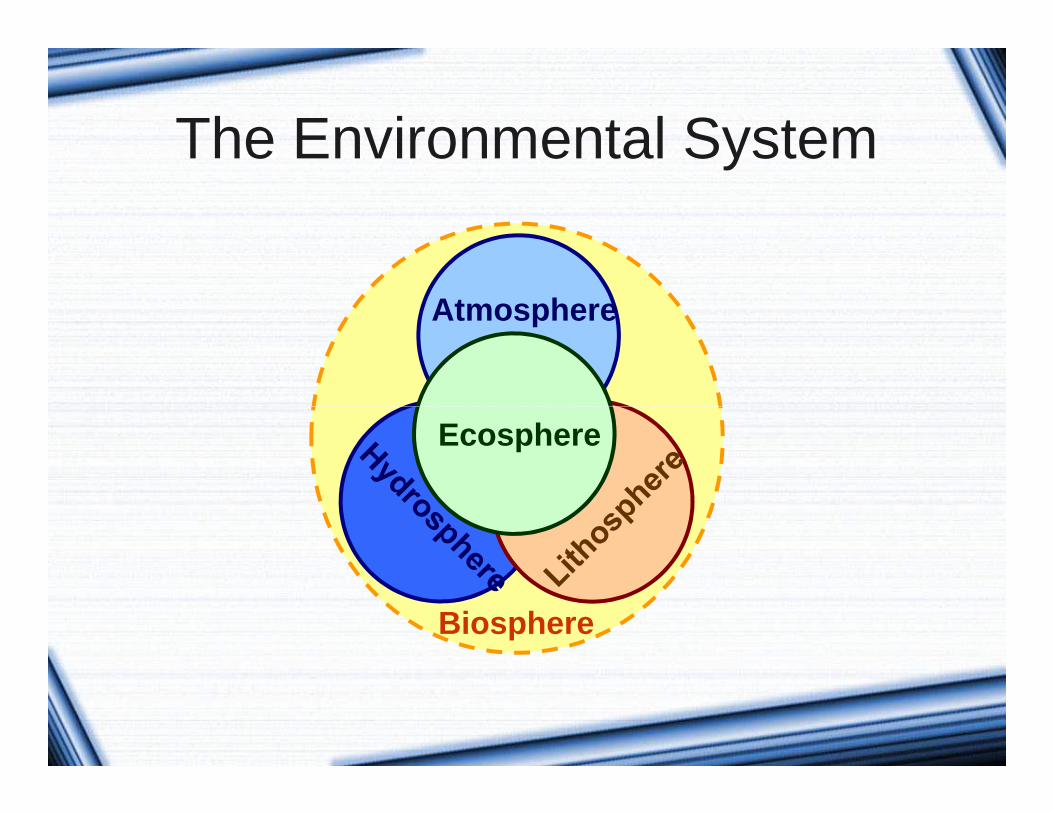
The Environmental System
Atmosphere
Ecosphere
Biosphere

4. ECOSPHERE
4.1 AQUATIC ECOSPHERE
Alteration of ecosystems in unforeseeable ways.
Disappearance of vulnerable species and proliferation of tolerant
ones.
Reduction of bacterial treatment of organic matter by nitrification.
Reduction of available nutrients to aquatic species.
Reproductive impediments.
4.2 LAND ECOSPHERE
Damages over the vegetation modifying:hydric cycles.
1. ATMOSPHERELarge scale diffusion of pollutants.
High growth on a short term basis of the concentration of pollutants because
of local conditions (e.g. smog).
Photochemical reactions caused by ultraviolet rays, notably over ozone,
sulfur dioxide and nitrogen dioxide.
Climatic changes (global warming).
Acid rain.
Synergetic effects when pollutants are combined (e.g. smog and greenhouse
gases).
2. HYDROSPHEREDiffusion of pollutants in a dissolved or colloidal state.
The Environmental Impacts of Transportation
hydric cycles.
the level of underground water resources.
soil erosion.
air purification capacity of the ecosphere.
food sources (agriculture).
entertainment and tourism.
Reduction of the vital space.
Reduction of the genetic potential of species.
Reduction of the food supply and alteration of the food chain.
Consumption of resources.
4.3 HUMAN ECOSPHERE
Odors.
Noise.
Cardiovascular and respiratory problems.
Susceptibility to infection.
Drops in life expectancy.
Injuries, incapacity, hospitalization, death.
Damage to structures:loss of useful life. (amortization)
loss of property values.
corrosion of metal structures (bronze, steel, etc.).
destruction of historical and cultural monuments.
Diffusion of pollutants in a dissolved or colloidal state.
Acidification and loss of neutralizing potential of ground and underground
water.
Drops of pH following snow melting (aquatic organism are particularly
vulnerable).
Growth in the solubility of several metals because of acidification.
Additions of organic compounds, aluminum, manganese, calcium,
magnesium and potassium by runoffs.
Contamination of ground and underground water by nitrates.
3. LITHOSPHEREAcid depositions.
Liberation of toxic metallic ions (aluminum, cadmium, etc.) through
acidification.
Loss of nutrients, notably calcium and magnesium.
Inhibition of the miniralization of nitrogen.
Modifications in the compositions and the depth of decomposition gradient.
Inhibition of decomposition.
Loss of the soil flora and fauna.
Fixation by plants of heavy metals (e.g. lead) and contamination.
Removal and consumption of land.
Extraction of raw materials like mineral products and energy.

Estimated Automobile Costs
32%32%
23%
45% External cost
Internal fixed costs
Internal variable costs
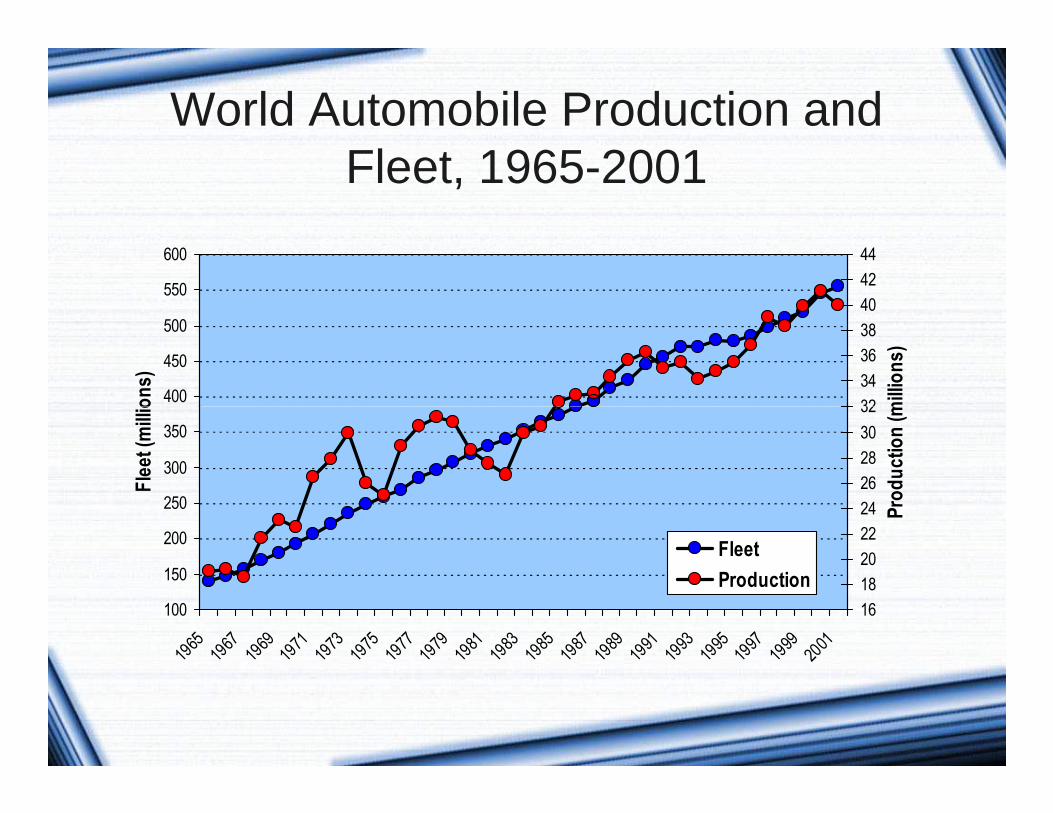
World Automobile Production and Fleet, 1965-2001
400
450
500
550
600
Fle
et (m
illio
ns)
32
34
36
38
40
42
44
Pro
du
ctio
n (m
illio
ns)
100
150
200
250
300
350
196519
6719
6919
7119
7319
7519
7719
7919
8119
8319
8519
8719
8919
9119
9319
9519
9719
9920
01
Fle
et (m
illio
ns)
16
18
20
22
24
26
28
30
32
Pro
du
ctio
n (m
illio
ns)
Fleet
Production
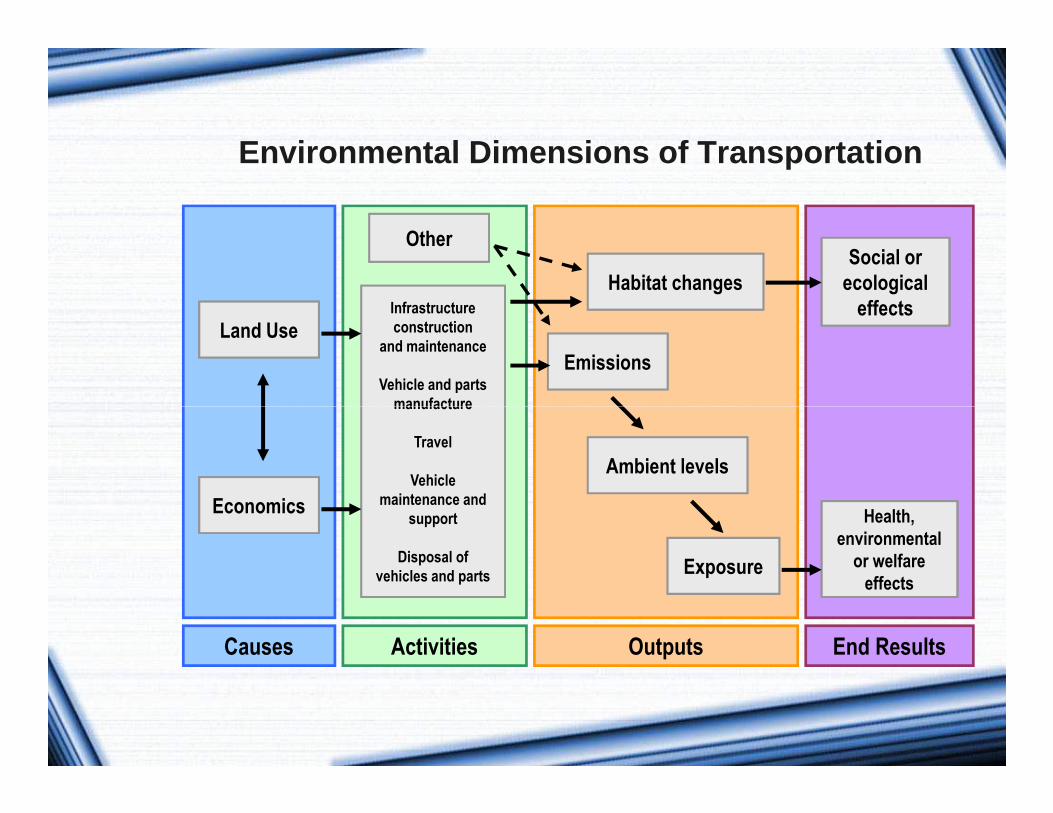
Environmental Dimensions of Transportation
Land Use
Other
Infrastructureconstruction
and maintenance
Vehicle and partsmanufacture
Habitat changes
Emissions
Social orecological
effects
Economics
manufacture
Travel
Vehiclemaintenance and
support
Disposal ofvehicles and parts
Ambient levels
Exposure
Health,environmental
or welfareeffects
Causes Activities Outputs End Results

Transportation Activities Affecting the Environment
Infrastructure
Road
Activity Mode Traffic
Vehicle manufacture
Vehicle travel
Vehicle maintenance
Vehicle disposal
Road
Rail
Maritime
Air
Passengers
Freight

Transportation Systems and the Environment
Diffused networkCentralized network
Netw
ork
Localized emissionsEnergy efficient
Diffused emissionsHigh energy use
TrafficLevel of emissionsLevel of energy consumption
Mode
CarBusWalkingRail
Nature of emissionsNature of energy consumption
Netw
ork
TrafficM
od
e

Spatial and Durational Environmental Effects
CO2
Global
Space
Duration
Noise
Lead
Particulates
NOX
Local
Regional
Global

Atmosphere
Respiration and assimilation
Respiration and assimilation
Respiration
Respiration
Emission
The Carbon Cycle
Fossil fuels
Limestone
Animal activities
Decomposition
Human activities
Lithosphere
Ecosphere
Hydrosphere
Transportation
Vegetation

Total costs
The Concept of Externalities
C(E)
Level of intervention
Optimal cost
Intervention costs
Externalities
LL(O)0 L1
C(L1)
C(O)
E(L1)
∆E(L1)
∆C(L1)
Concept 2
Transportation and Energy

Sources of Energy
Chemical• Fossil fuels (Combustion)
Nuclear• Uranium (Fission of atoms)
Chemical• Fossil fuels (Combustion)
Nuclear• Uranium (Fission of atoms)
EnergyEnergy
Non-RenewableNon-Renewable
ChemicalChemicalEnergyEnergy
RenewableRenewable
Chemical• Muscular (Oxidization)
Nuclear• Geothermal (Conversion)• Fusion (Fusion of hydrogen)
Gravity• Tidal, hydraulic (Kinetic)
Indirect Solar• Biomass (Photosynthesis)• Wind (Pressure differences)
Direct Solar• Photovoltaic cell (Conversion)
Chemical• Muscular (Oxidization)
Nuclear• Geothermal (Conversion)• Fusion (Fusion of hydrogen)
Gravity• Tidal, hydraulic (Kinetic)
Indirect Solar• Biomass (Photosynthesis)• Wind (Pressure differences)
Direct Solar• Photovoltaic cell (Conversion)
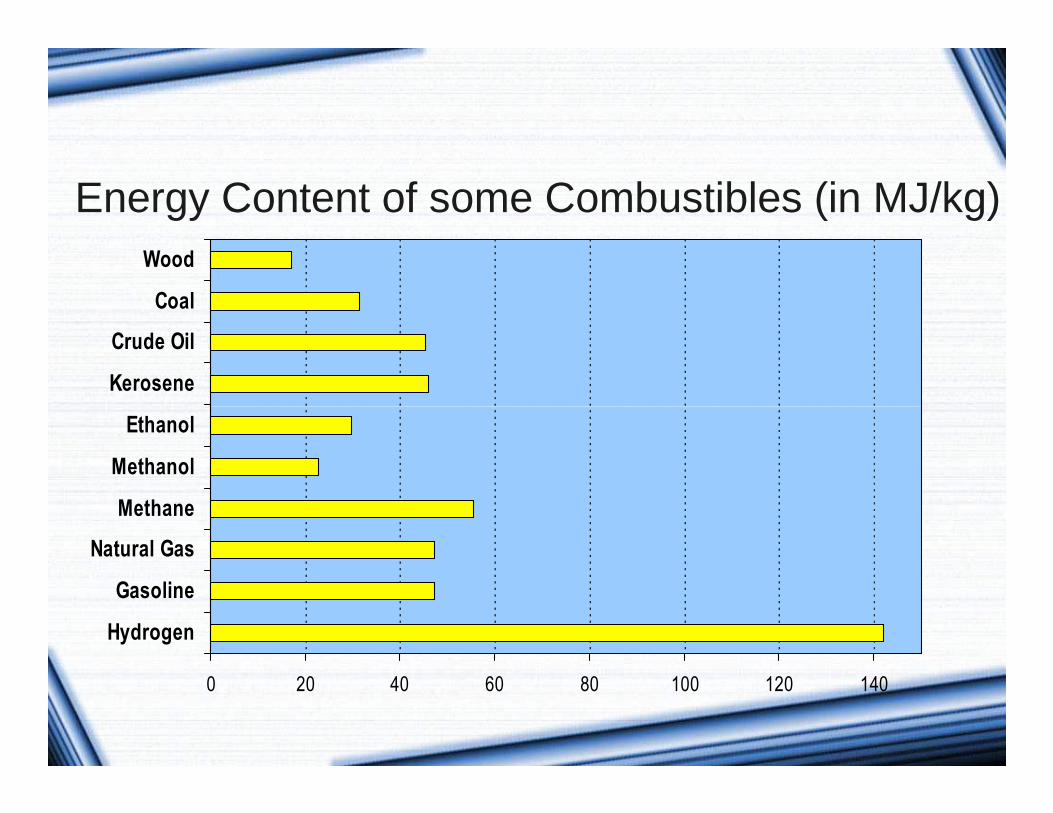
Energy Content of some Combustibles (in MJ/kg)
Kerosene
Crude Oil
Coal
Wood
0 20 40 60 80 100 120 140
Hydrogen
Gasoline
Natural Gas
Methane
Methanol
Ethanol
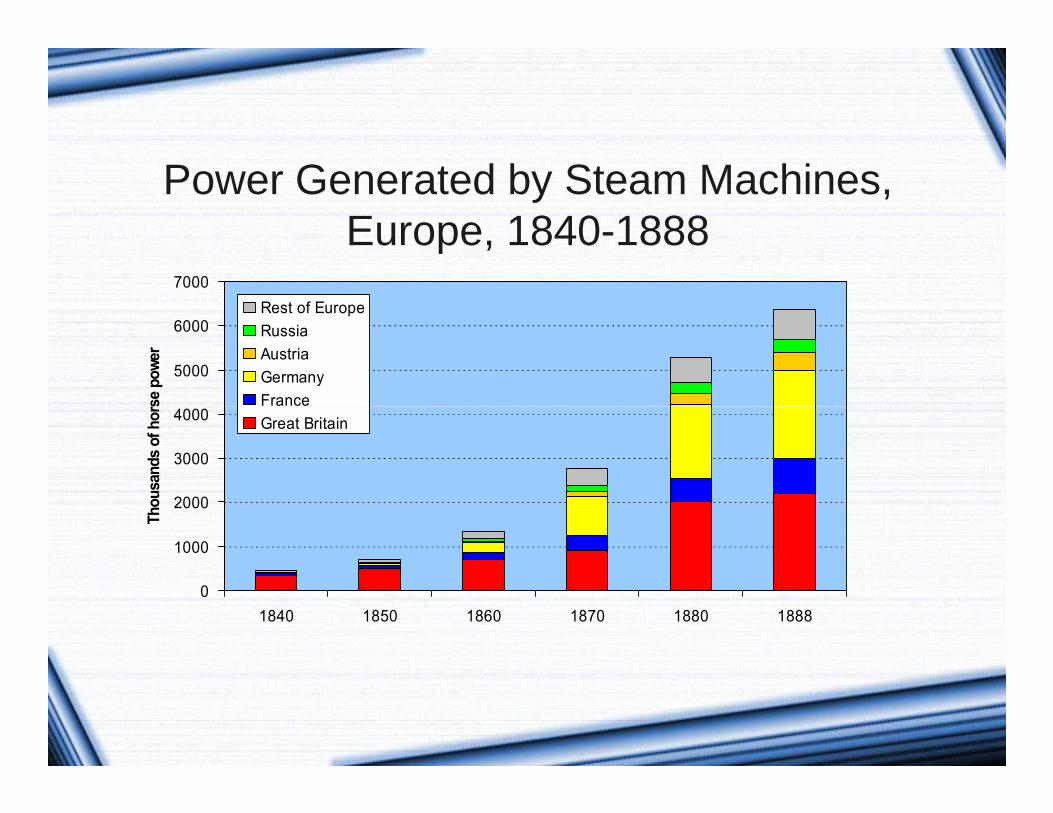
Power Generated by Steam Machines, Europe, 1840-1888
4000
5000
6000
7000
Thou
sand
s of ho
rse
pow
er
Rest of Europe
Russia
Austria
Germany
France
0
1000
2000
3000
4000
1840 1850 1860 1870 1880 1888
Thou
sand
s of ho
rse
pow
er
France
Great Britain

Evolution of Energy Sources
Early 20th Century
Late 20th Century
Mid 21st Century
Animal
Biomass
Coal
Oil
0% 20% 40% 60% 80% 100%
15th Century
Mid 19th Century
Early 20th Century Oil
Natural Gas
Nuclear
Hydrogen
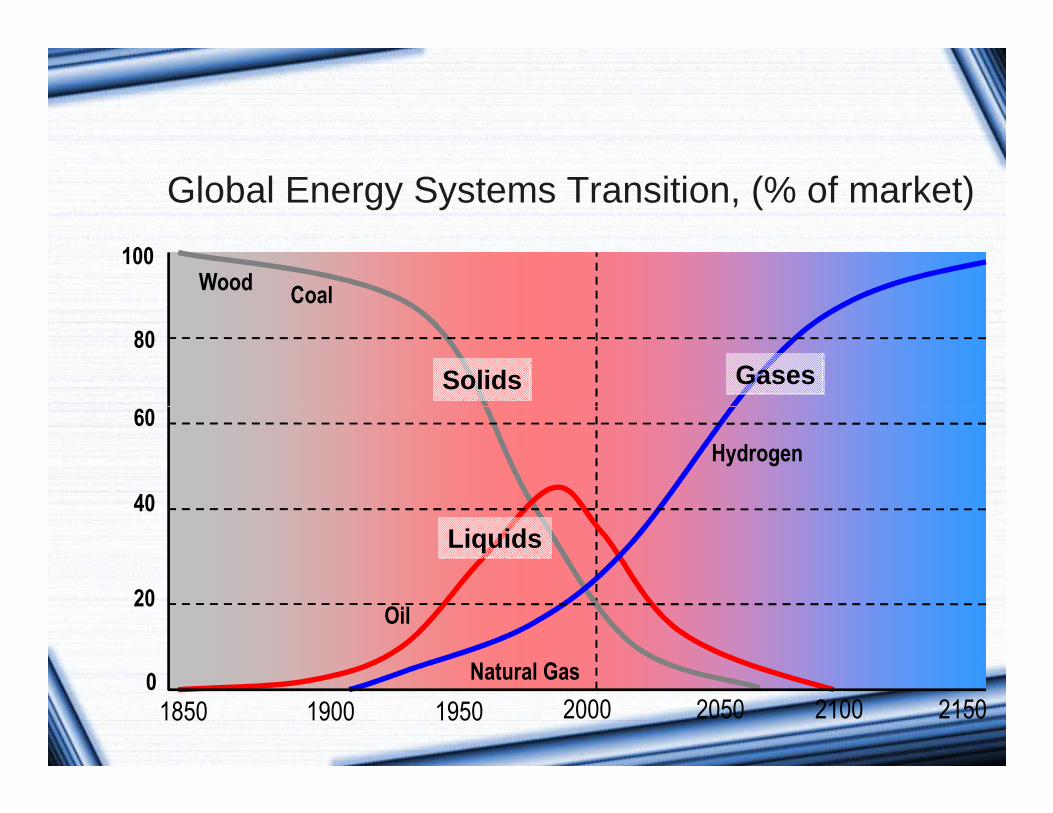
Global Energy Systems Transition, (% of market)
100
80
60
Solids Gases
WoodCoal
20001850 21502050 210019501900
60
40
20
0
Liquids
Oil
Natural Gas
Hydrogen

World Fossil Fuel Consumption per Source, 1950-1998 (in million of tons of equivalent oil)
6000
7000
8000
Natural Gas
Oil
Coal
0
1000
2000
3000
4000
5000
1950 1955 1960 1965 1970 1975 1980 1985 1990 1995 1998

World Energy Consumption, 1990-2020
240
260
280
300
100
120
140
160
180
200
220
240
1990 1995 2000 2005 2010 2015 2020
Quadrillion Btu
Developed Countries
Developing Countries

Energy Consumption in the Transportation Sector, G7 Countries, 1995
70
80
90
100
Transportation Consumption
Other Energy Consumption
0
10
20
30
40
50
60
Canada France Germany Italy Japan UK USA
Exa
jou
les
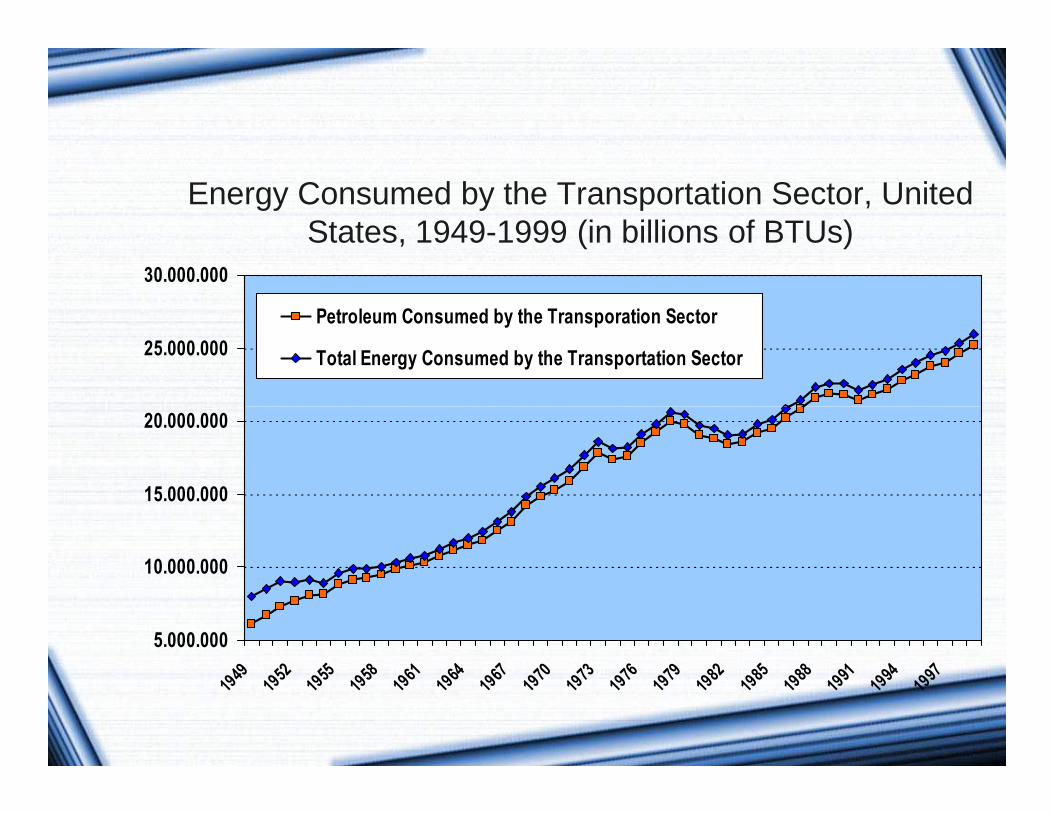
Energy Consumed by the Transportation Sector, United States, 1949-1999 (in billions of BTUs)
25.000.000
30.000.000
Petroleum Consumed by the Transporation Sector
Total Energy Consumed by the Transportation Sector
5.000.000
10.000.000
15.000.000
20.000.000
1949
1952
1955
1958
1961
1964
1967
1970
1973
1976
1979
1982
1985
1988
1991
1994
1997

Energy Flows, United States 1999

1
10
Truck
Cargo plane
Bic
ycle
Bus
Train
Car
Helicopter
Propellerplane
Jetplane
Supersonicplane
En
erg
y co
sts
Gaspipeline
Energy Efficiency by Transportation Mode
.1
.01
.00210 30 100 300 1000
Speed (m/sec)
Tanker
Oil
Pip
elin
eB
icyc
le
Train
Freight
Passengers
En
erg
y co
sts
Container ship

Energy Used by the Transportation System
5%
17%Vehicle operation
Vehicle maintenance
Vehicle manufacture
66%4%
1%
7%
Vehicle manufacture
Infrastructure provision
Raw materialmanufacture
Energy generation
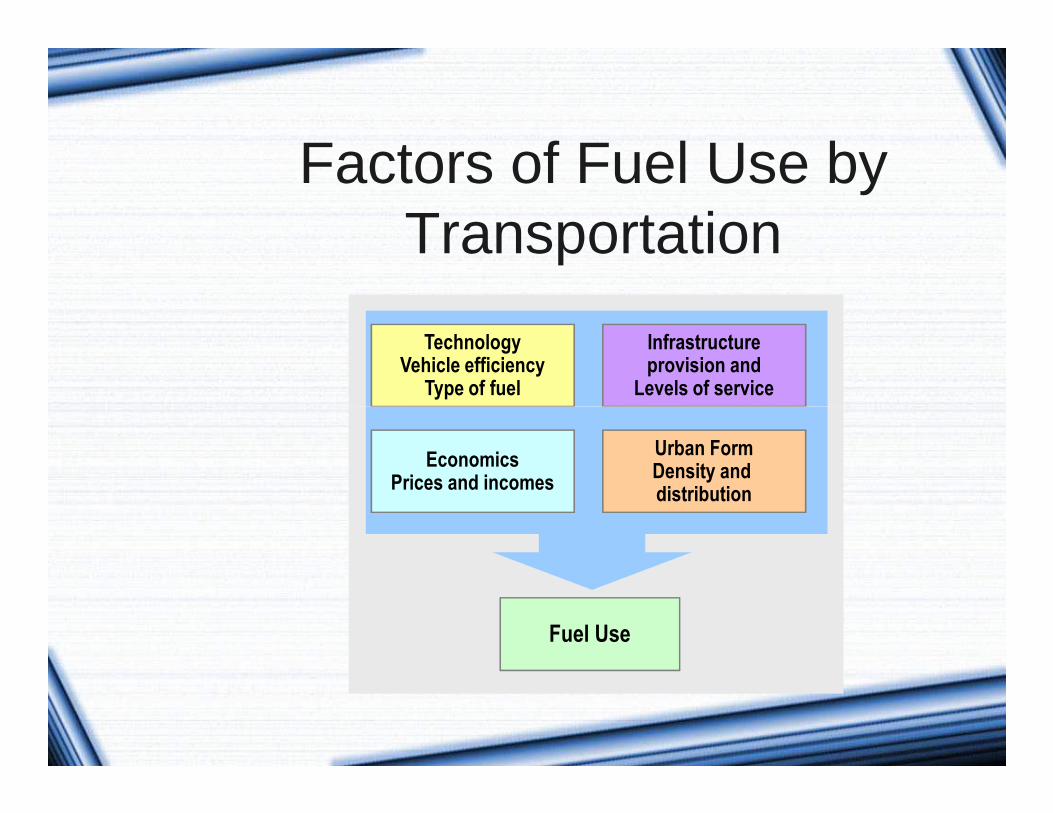
Factors of Fuel Use by Transportation
TechnologyVehicle efficiency
Type of fuel
Infrastructureprovision and
Levels of service
EconomicsPrices and incomes
Urban FormDensity and distribution
Fuel Use

Typical Energy Use for a Car
12%
13%
6%
8%
Momentum
Exhaust
Cylinder cooling
32%
29%
Cylinder cooling
Engine friction
Transmission and axles
Braking

World Oil Energy Consumption by Sector, 1973-2000
20,1 57,7 5,9 16,32000Industry
26,2 42,2 6,4 25,2
0% 20% 40% 60% 80% 100%
1973
Industry
Transport
Non-energy
Other sectors
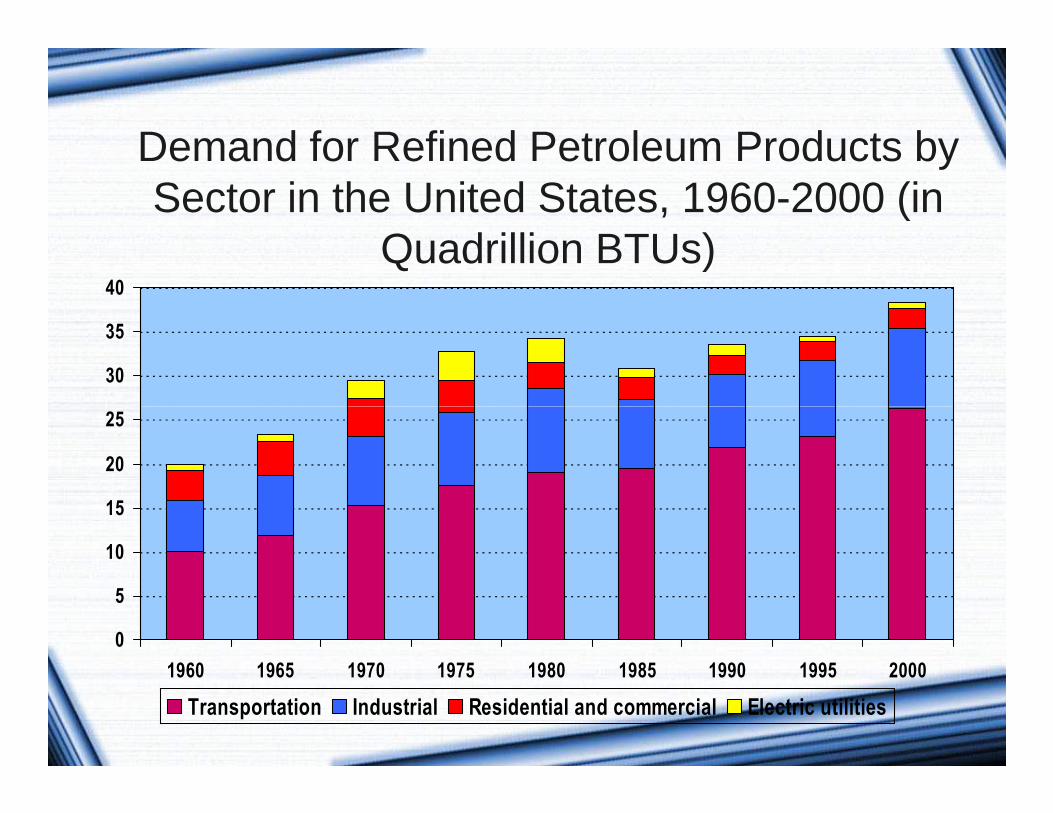
Demand for Refined Petroleum Products by Sector in the United States, 1960-2000 (in
Quadrillion BTUs)
25
30
35
40
0
5
10
15
20
25
1960 1965 1970 1975 1980 1985 1990 1995 2000
Transportation Industrial Residential and commercial Electric utilities
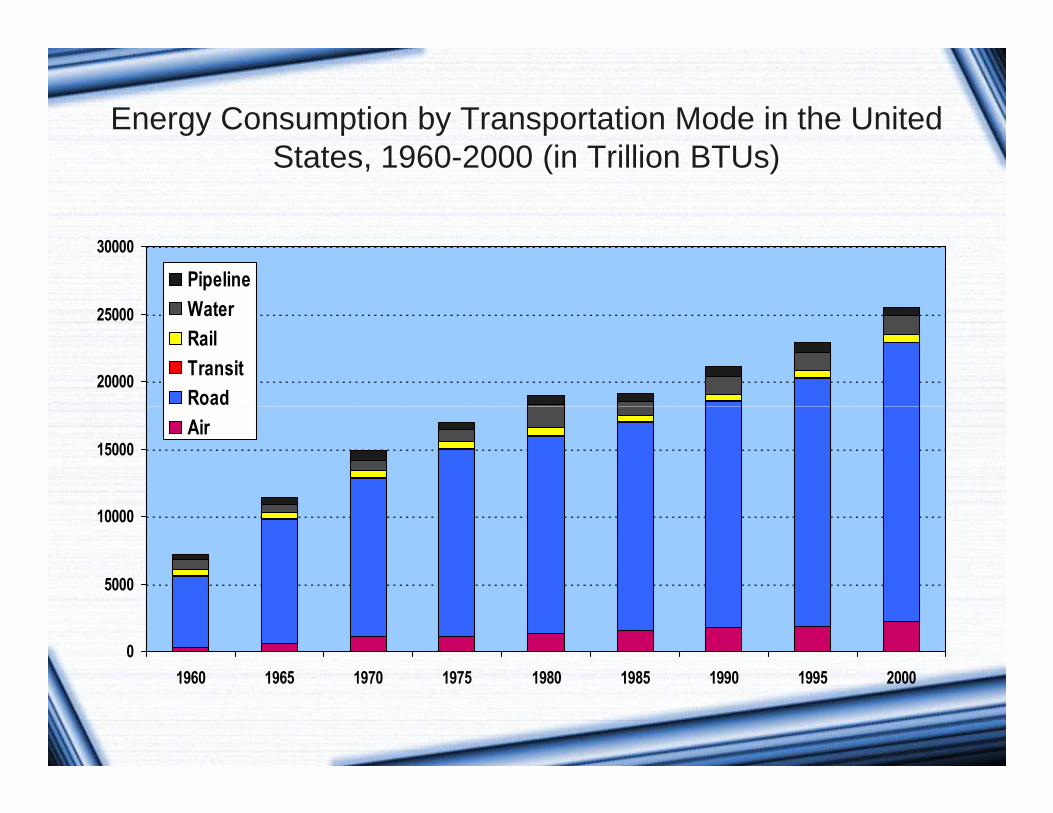
Energy Consumption by Transportation Mode in the United States, 1960-2000 (in Trillion BTUs)
20000
25000
30000
Pipeline
Water
Rail
Transit
Road
0
5000
10000
15000
1960 1965 1970 1975 1980 1985 1990 1995 2000
Road
Air
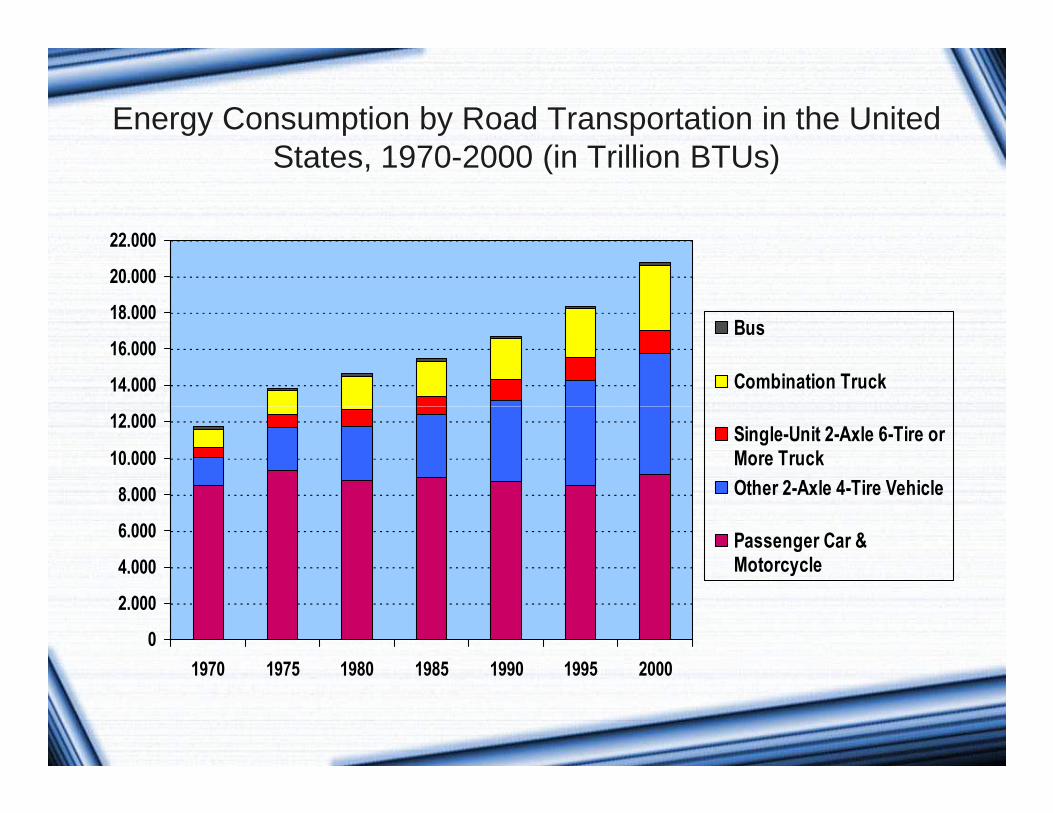
Energy Consumption by Road Transportation in the United States, 1970-2000 (in Trillion BTUs)
14.000
16.000
18.000
20.000
22.000
Bus
Combination Truck
0
2.000
4.000
6.000
8.000
10.000
12.000
1970 1975 1980 1985 1990 1995 2000
Single-Unit 2-Axle 6-Tire orMore Truck
Other 2-Axle 4-Tire Vehicle
Passenger Car &Motorcycle
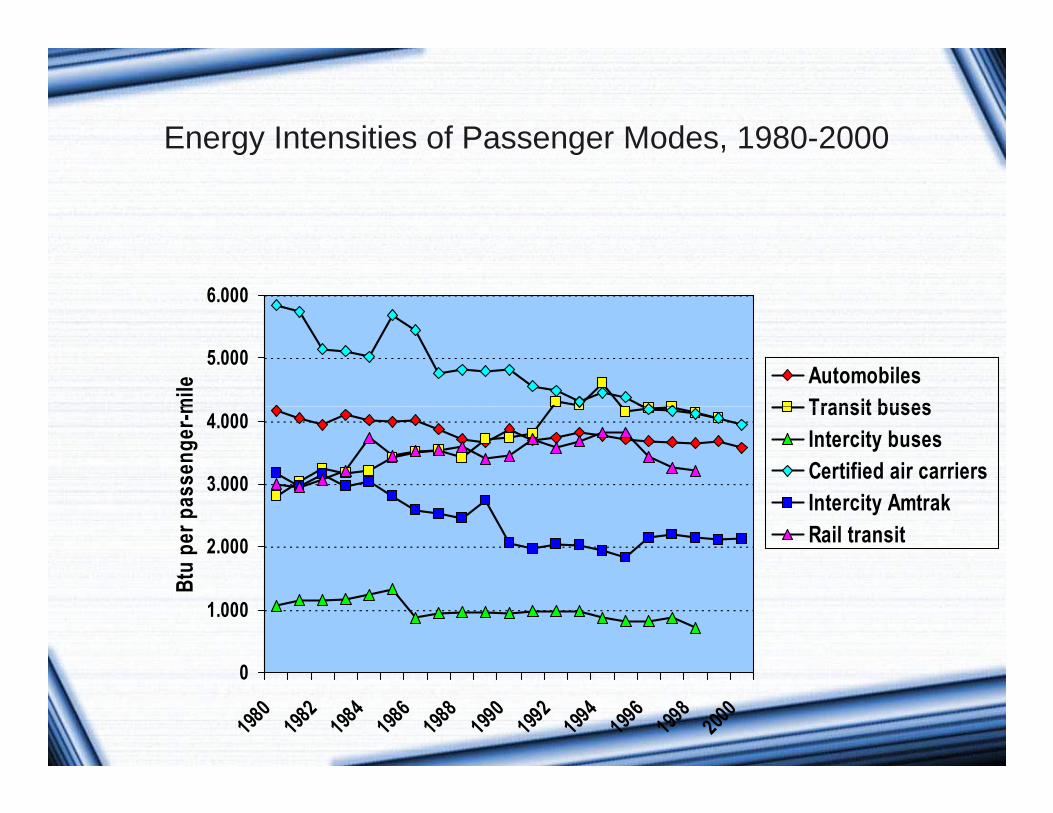
Energy Intensities of Passenger Modes, 1980-2000
5.000
6.000
Btu
per
pas
sen
ger
-mile
Automobiles
Transit buses
0
1.000
2.000
3.000
4.000
1980
1982
1984
1986
1988
1990
1992
1994
1996
1998
2000
Btu
per
pas
sen
ger
-mile
Transit buses
Intercity buses
Certified air carriers
Intercity Amtrak
Rail transit

Fuel Consumption and Travel by Certificated Air Carriers in the United States, 1960-2000
800
1200
Mile
s flo
wn
8.000
10.000
12.000
14.000
16.000
Mile
s p
er g
allo
n
0
400
1960 1965 1970 1975 1980 1985 1990 1995 2000
Mile
s flo
wn
0
2.000
4.000
6.000
8.000
Mile
s p
er g
allo
n
Average Miles Flown Per Aircraft (thousands) Miles per gallon for domestic operations
Miles per gallon for international operations

Average Miles per Gallon Traveled by Road Vehicle in the United States, 1980-2000
Heavy trucks
Average 2000
1990
1980
0 5 10 15 20 25 30
Passenger cars
Buses
Light trucks

Average Gasoline Consumption for New Vehicles, United States, 1972-2003 (in miles per gallon)
24
26
28
30
10
12
14
16
18
20
22
1972
1974
1976
1978
1980
1982
1984
1986
1988
1990
1992
1994
1996
1998
2000
2002
Cars
Light Trucks
Average

Light-Duty Vehicles Sales in the United States, 1975-2003 (in 1,000s)
12000
14000
16000
18000Trucks
Cars
0
2000
4000
6000
8000
10000
1975
1977
1979
1981
1983
1985
1987
1989
1991
1993
1995
1997
1999
2001
2003

Change in Average Vehicle Characteristics, 1981-2003 (in %)
Horsepower
Acceleration
0 20 40 60 80 100
Fuel Economy
Weight
Horsepower

Automobile Emission Factors
100
1000
Em
issi
on
s (g
ram
s)
10
15
20
% o
f V
ehic
le-k
m
HC
CO
NOx
1
10
5 10 20 30 35 45 55 60 70 80 85 95 100Speed (in km/hr)
Em
issi
on
s (g
ram
s)
0
5
10
% o
f V
ehic
le-k
m

Total Motor Vehicle Fuel Consumption and Travel in the United States, 1960-2000
18
20
22
24
Ave
rag
e M
ilesT
rave
led
per
Gal
lon
650
700
750
800
Ave
rag
e F
uel
Co
nsu
med
per
Veh
icle
(G
allo
ns)
10
12
14
16
18
1960 1965 1970 1975 1980 1985 1990 1995 2000
Ave
rag
e M
ilesT
rave
led
per
Gal
lon
400
450
500
550
600
Ave
rag
e F
uel
Co
nsu
med
per
Veh
icle
(G
allo
ns)
Average Miles Traveled per Gallon
Average Fuel Consumed per Vehicle (liters)

Cost of Gasoline, United States, 1999
14% Crude Oil
37%
36%
13%Federal and State Taxes
Refining costs andprofits
Distribution, retail &marketing costs andprofits

Gasoline Prices, 1978-2002 Selected Countries (current dollars per gallon)
4
5
Japan
France
0
1
2
3
1975 1980 1985 1990 1995 2000
France
United Kingdom
Germany
Canada
United States
China

Gasoline Price and Use, Western Industrial Countries, 1994
1
1,2
1,4
Do
llar
s p
er l
iter
Portugal
R2 = 0,7704
0
0,2
0,4
0,6
0,8
0 200 400 600 800 1000 1200 1400 1600 1800
Liters per person
Do
llar
s p
er l
iter
United States
Canada
AustraliaJapan

Gas Consumption Tax in the United States, 1999 (in $ per mile per gallon per vehicle)
Between 16.5 and 15.5
Between 15.5 and 14.5
Between 15.5 and 13.5
Between 13.5 and 12.5
Less than 12.5
0 1000 2000 3000 4000 5000 6000 7000 8000
More than 22.5
Between 22.5 and 21.5
Between 21.5 and 20.5
Between 20.5 and 19.5
Between 19.5 and 18.5
Between 18.5 and 17.5
Between 17.5 and 16.5

Concept 3
Transportation Pollutants and Environmental Externalities
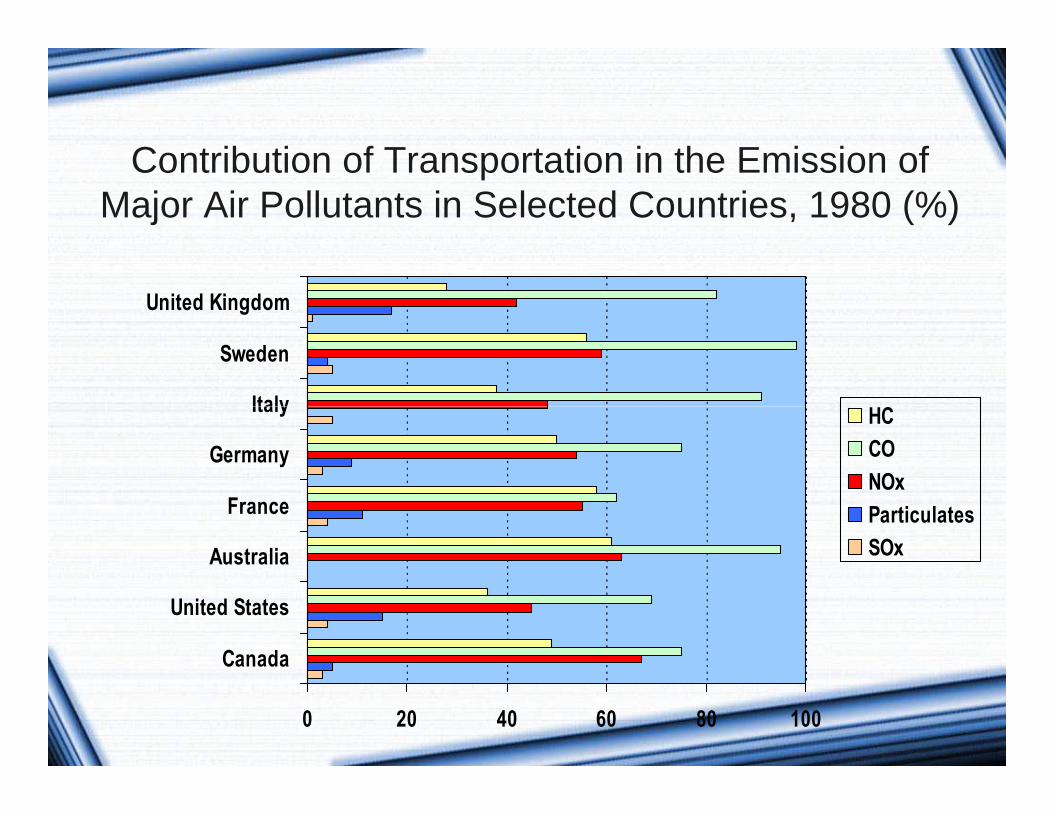
Contribution of Transportation in the Emission of Major Air Pollutants in Selected Countries, 1980 (%)
Italy
Sweden
United Kingdom
HC
0 20 40 60 80 100
Canada
United States
Australia
France
Germany
ItalyHC
CO
NOx
Particulates
SOx

Emissions of Major Air Pollutants in the US by Transportation (in million short tons), 1970-1998
Particulates (PM-10)
Nitrogen oxides
Lead (in thousand metric tons)
0 25 50 75 100 125 150 175
Carbon monoxide
Sulphur oxides
VOC
Particulates (PM-10)
1998
1990
1980
1970

Distance Driven and Carbon Emissions, U.S. Automobile Fleet,
1970-2000
250
300
350
Mill
ion
met
ric
ton
s
3
3,5
4
Carbon Emissions
Distance Driven
0
50
100
150
200
250
1970
1972
1974
1976
1978
1980
1982
1984
1986
1988
1990
1992
1994
1996
1998
2000
Mill
ion
met
ric
ton
s
0
0,5
1
1,5
2
2,5
Tri
llio
n K
M

120
100
80
90
110
Busy crossroads
Lorry, motorcycle, underground train
Pneumatic drill at 1 meter
Aircraft at take off
dB (A)
Noise Levels (in decibels)
0
20
30
40
50
60
70
80
Desert10
Broadcasting studio
Quiet room
Busy street through closed windows
Busy street through open windows
Noise level near a motorway
Busy crossroads

Hazmat Accidents in the United States, 1975-2000
50.000
60.000
Total Accidents
Property Damage (1,000s of $)
0
10.000
20.000
30.000
40.000
1975 1980 1985 1990 1995 2000

Concept 4
Transportation, Land Use and the Environment

Land Area Consumed by the Car in Selected Countries
United Kingdom
SwedenTotal land used by the car per capita
% of total land area used by the car
0 0,01 0,02 0,03 0,04 0,05 0,06 0,07 0,08
United States
Canada
Mexico
Japan
France
Germany

Current and Potential Car Fleet in India and China
640China
8
13
513
0 100 200 300 400 500 600 700
India
China
Millions
Vehicle Fleet Size for Industrialized Vehicle Ownership Level
Current Size of Vehicle Fleet (1999)

For
m
Spatial Form, Pattern and Interaction and the Environmental Impacts of Transportation
Pat
tern
Inte
ract
ions
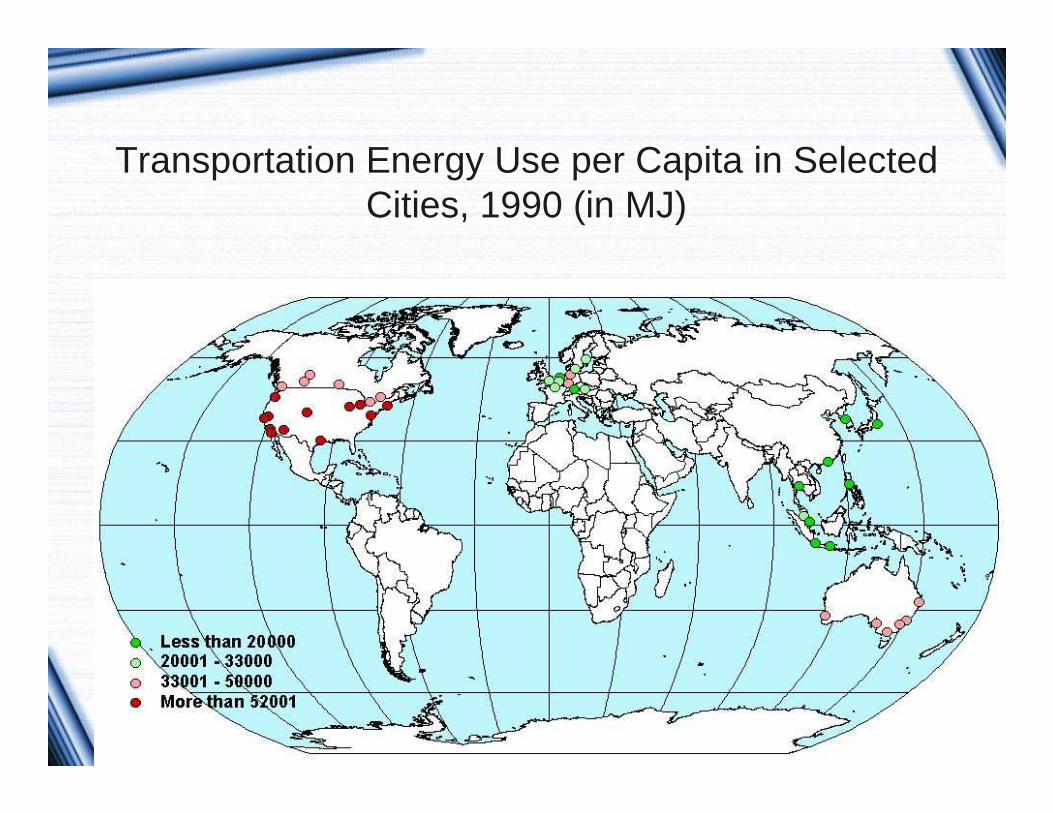
Transportation Energy Use per Capita in Selected Cities, 1990 (in MJ)

80
60 Los Angeles
United States
Houston
PhoenixDetroitDenver
En
erg
y co
nsu
mp
tio
n p
er c
apit
a (1
,000
mill
ion
s o
f jo
ule
s)
Transport Energy Consumption and Density in Major Metropolitan Areas, 1990
40
20
20 60 30040 80 100
Sydney
LondonSingapore
Australia and Canada
EuropeAsia
Hong Kong
Chicago
AdelaideMelbourne
Toronto
New York
Vienna
ParisBerlin
Tokyo
En
erg
y co
nsu
mp
tio
n p
er c
apit
a (1
,000
mill
ion
s o
f jo
ule
s)
Population density (people per hectare)

Fuel Prices in Indonesia
2002(January)
2003(May)
Increase(January) (May)
In Indonesian Rupiah
In Indonesian Rupiah
Gasoline (Premium)
1550 1810 16.77%
Diesel 1150 1650 43.48%CNG 450 450 00.00%