Embed Size (px)
Citation preview

HANSA TRUST
February 2018

2
Hansa Trust is a proprietor based investment trust blending best‐in‐class third party funds, a global equity portfolio and a strategic holding in Ocean Wilsons Holdings
Managed by Hansa Capital Partners the trust adopts a long‐term approach, ignoring short‐term noise, with a focus on the growth and preservation of capital.
We are fully aligned with our investors, with significant internal money under management, in addition to third‐party mandates
This patient approach to managing money leads to natural bias towards equities albeit one that is dynamically dialled up and down as influenced by the economic cycle
The strategic holding in Wilson Sons, held through the stake in Ocean Wilsons Holdings, gives access to the large and growing Brazilian logistics and container industries. Wilsons has created significant economic value through time which has been reflected in exceptional long‐term share price performance

3
HANSA TRUSTIndex
• History of Hansa & Strategic Review
• Performance Review
• Portfolio Positioning & Characteristics
• Ocean Wilsons Holdings
• Market Outlook
• Appendix

History of Hansa & Strategic Review
4

5
HANSA TRUSTHansa timeline
A history of buying and selling large strategic stakes
Hansa Trust began life as the Alto Parano Company in 1912 and later changing its name to Scottish & Mercantile Investment Company
Rea Brothers was formedThe Salomon Family obtain control of
Rea Brothers
Rea Brothers acquire the management of a number of
invesment companies, including Scottish & Mercantile
Rea Brothers purchases 58% of Ocean Wilsons
Holdings Limited on behalf of its clients including Scottish & Mercentile Scottish & Mercantile
becomes Finsbury Trust
Rea Brothers was sold
Finsbury Trust becomes Hansa Trust
Ocean Wilsons successfully floats 41.75% of Wilson Sons Limited on the Sao Paulo and the Luxembourg Stock Exchanges
Strategic review of Hansa Trust initiated
1900 1920 1940 1960 1980 2000 2020

6
HANSA TRUSTCorporate structure

HANSA TRUSTStrategic Review
7
Description Portfolio Weight
Core Regional Silo
Regional exposure based on the output of the HansaHouse View.
34.6%
Global Equities Equity exposure through direct global holdings 15.5%
Thematic & Diversifying Silo
A silo including two elements: Diversifying. As business cycles mature we
seek to dynamically shift to those asset classes and sectors which will add portfolio protection
Thematic Growth sectors such as biotechnology and technology
28.6%
Strategic Stakes
Wilson Sons – Brazilian operating assets 19.8%
The ‘Four Silo Approach’ ‐ By blending assets and managers with different characteristics we aim to develop the optimal portfolio
Description Portfolio Weight
UK Equities
Special situation UK equities but also included larger UK holdings
65%
Strategic Stakes
Wilson Sons – Brazilian operating assets
(includes Ocean Wilsons Investment portfolio)
35%
Hansa TrustJanuary 2014
Hansa TrustDecember 2017

Performance Review
8

HANSA TRUSTPerformance to end December 2017
9
Source: Hansa Trust internal, unaudited data: Bloomberg, FTSE
Financial YTD* One year 5 years (p.a.) 15 years (p.a.)
NAV Performance TR 8.5% 11.2% 8.2% 12.3%NAV Performance ex. OWHL TR 9.0% 13.2% 9.5% 9.6%Ordinary Share TR 21.6% 27.7% 9.5% 12.6%‘A’ Ordinary Share TR 17.9% 21.2% 8.1% 12.3%
‐100%
0%
100%
200%
300%
400%
500%
600%
Dec‐02
May‐03
Oct‐03
Mar‐04
Aug‐04
Jan‐05
Jun‐05
Nov
‐05
Apr‐06
Sep‐06
Feb‐07
Jul‐0
7
Dec‐07
May‐08
Oct‐08
Mar‐09
Aug‐09
Jan‐10
Jun‐10
Nov
‐10
Apr‐11
Sep‐11
Feb‐12
Jul‐1
2
Dec‐12
May‐13
Oct‐13
Mar‐14
Aug‐14
Jan‐15
Jun‐15
Nov
‐15
Apr‐16
Sep‐16
Feb‐17
Jul‐1
7
Dec‐17
NAV Cum Income TR Ord Share TR A Ord Share TR
31 Dec 2017 –16 Feb 2018
NAV Performance TR ‐2.2%NAV Performance ex. OWHL TR ‐1.3%Ordinary Share TR ‐3.5%‘A’ Ordinary Share TR 0.8%
* Financial YTD refers to end of March to date
10
HANSA TRUSTPerformance of the different silos one year to 31 December 2017
0%
5%
10%
15%
20%
25%
Core Regional Funds Global Equities Thematic Diversifying (ex OWHL) Ocean WilsonsHoldings Limited
Cash/FX

37,091
,971
3,65
3,59
21,80
6,42
41,72
4,10
31,61
1,98
51,03
6,73
697
3,09
387
5,24
076
8,11
673
2,55
351
7,65
246
5,42
445
8,47
228
6,04
191
,161
45,911 2,42
6,73
21,19
3,59
994
7,17
533
9,43
730
7,79
226
3,94
726
1,79
519
3,99
115
0,04
013
9,21
598
,276
69,705
45,441
26,874
15,948 2,63
9,77
82,29
8,81
529
3,73
527
,149
722,91
417
1,14
111
6,09
346
,375
12,756
28,567
12,049
11,118
,114
237,94
418
2,63
5
525,41
3
23,630
31,942
146,68
016
6,82
220
7,53
325
8,11
534
5,40
2
4,81
810
5,55
124
3,34
3
25,711
257,60
4
£‐
£5,000,000
£10,000,000
£15,000,000
£20,000,000
£25,000,000
£30,000,000
£35,000,000
£40,000,000
Goo
dhart: Ha
njo
SISF Asia
n To
tal R
eturn
Find
lay Pa
rk American
Indu
s Jap
an Lon
g Only
Adelph
i Eur Select E
quity
BlackR
ock Eu
r Hed
gePrince Stree
t Inst
Select Equ
ity Offs
hore
Vulcan
Value
Equ
ityVa
ngua
rd Dev Eur ex UK
NTA
sian Discov
ery
BlackR
ock Fron
tiers
iSha
res E
uro Stoxx
Ode
y Ab
solute Return
SR Globa
l Frontiers
Pershing
Squ
are
Hansteen
Holding
sInteractive Brok
ers
Hilto
n Fo
odAlph
abet
NCC
Group
Berkshire
Hatha
way
Samsung
CBRE
Orio
n En
gine
ered
Carbo
nsBroo
ks M
acdo
nald
UBM
Nutrie
nIridium
Bayer A
GHo
ward Hu
ghes Corp
Softba
nkCK
Hutchison
Exor
Libe
rty Globa
lWhite M
ountains
CVS He
alth
Tripad
visor
Equitie
s So
ld During Pe
riod
GAM
Star T
ech
SPDR
MSC
I World Fins
Worldwide Hea
lthcare
Globa
l Event Partners L
tdKe
ynes Dynam
ic B Strategy
GAM
Core Macro
CZ Abs Alpha
UCITS
Hudson
Bay
Schrod
er GAIA Blue
Tren
dMKP
Opp
Offs
hore
Field Street Offs
hore
Gladw
yne GBP
BNY Ab
s Return Bo
nd Fun
dJLP Cred
it Opp
Ocean
Wilson
s Holding
sDV
4 Ltd
Cash/FX
Fund
Holding
s sold du
ring pe
riod
Total
11
Private Equity
Global Equities DiversifyingCore Regional Funds
HANSA TRUSTPerformance Contribution 1 Year to end December 2017
OWHL
Thematic

12
Private Equity
Global Equities DiversifyingCore Regional Funds
HANSA TRUSTPerformance Contribution 3 Years to end December 2017 OWHL
Thematic
72,978
,390
4,49
9,60
44,12
5,27
73,69
1,65
53,66
9,93
32,89
3,27
92,41
7,56
21,80
7,04
01,59
8,05
21,24
0,49
671
2,45
871
2,33
445
8,47
228
6,04
145
,911
3,99
6,10
73,80
7,82
91,91
3,33
01,27
1,74
61,19
3,59
997
4,30
333
9,43
726
3,94
726
1,79
525
0,50
719
3,99
115
0,04
069
,705
45,441
26,874
15,948 4,10
4,90
64,55
9,19
529
3,73
527
,149
890,12
443
7,69
042
3,55
116
1,49
711
6,09
346
,375
35,477
667,59
649
,752
28,567
20,886
,596
1,00
7,62
461
9,07
3
574,81
42,22
2,88
8
23,630
31,942
146,68
016
6,82
220
7,53
325
8,11
534
5,40
2
154,50
9
176,98
5
£‐
£10,000,000
£20,000,000
£30,000,000
£40,000,000
£50,000,000
£60,000,000
£70,000,000
£80,000,000
Goo
dhart: Ha
njo
Find
lay Pa
rk American
SISF Asia
n To
tal R
eturn
Select Equ
ity Offs
hore
Vulcan
Value
Equ
ityIndu
s Jap
an Lon
g Only
BlackR
ock Eu
r Hed
geAd
elph
i Eur Select E
quity
Prince Stree
t Inst
NTA
sian Discov
ery
Vang
uard Dev Eur ex UK
BlackR
ock Fron
tiers
iSha
res E
uro Stoxx
SR Globa
l Frontiers
Ode
y Ab
solute Return
Pershing
Squ
are
UBM
Hansteen
Holding
sHilto
n Fo
odBroo
ks M
acdo
nald
Interactive Brok
ers
NCC
Group
Alph
abet
Berkshire
Hatha
way
Samsung
Acertec
CBRE
Orio
n En
gine
ered
Carbo
nsNutrie
nIridium
Bayer A
GHo
ward Hu
ghes Corp
Softba
nkCK
Hutchison
Exor
Libe
rty Globa
lWhite M
ountains
CVS He
alth
Tripad
visor
Equitie
s So
ld During Pe
riod
GAM
Star T
ech
SPDR
MSC
I World Fins
Worldwide Hea
lthcare
Globa
l Event Partners L
tdField Street Offs
hore
Hudson
Bay
Keynes Dynam
ic B Strategy
GAM
Core Macro
CZ Abs Alpha
UCITS
MKP
Opp
Offs
hore
Schrod
er GAIA Blue
Tren
dJLP Cred
it Opp
BNY Ab
s Return Bo
nd Fun
dGladw
yne GBP
Ocean
Wilson
s Holding
sDV
4 Ltd
Cash/FX
Fund
Holding
s sold du
ring pe
riod
Total

8.6%6.3%
1.8% 1.8%
‐15.0%
‐10.0%
‐5.0%
0.0%
5.0%
10.0%
15.0%
20.0%
25.0%
Performan
ce (G
BP)
13
HANSA TRUSTPerformance of less correlated funds 1 June 2016 to 31 December 2017A basket of lower‐correlated funds was purchased in June/July 2016. The performance since has been positive and outperformed bonds and cash.

14
HANSA TRUSTTransactions 1 January 2017 to 31 December 2017
• Equity Purchases £36.4m:
– CK Hutchison £2.8m– Berkshire Hathaway £2.7m– Exor NV £2.7m– Samsung £2.6m– Softbank £2.5m– Alphabet £2.4m– Liberty Global £2.3m– Bayer AG £2.1m– CVS Health £2.1m– Interactive Brokers £2.1m– White Mountains Insurance Group £2.1m– Howard Hughes Corp £1.9m– Orion Engineered Carbons £1.9m– Nutrien £1.8m– CBRE Group Inc. £1.7m– TripAdvisor £1.4m– Iridium Communications Inc. £1.3m
• Fund Purchases £23.2m:
– iShares EURO STOXX Mid UCITS ETF £5.1m– Blackrock Frontiers Investment Trust £3.9m– SPDR MSCI World Financials ETF £3.1m– SSgA GBP Liquidity Fund £2.7m– SR Global Fund Frontier Markets £2.6m– Worldwide Healthcare Trust £1.6m– Pareturn Gladwyne Absolute Credit UCITS GBP £1.6m– CZ Absolute Alpha UCITS Fund £1.3m– GAM Systematic Core Macro Fund £1.3m
• Equity Sales £41.9m:
– Galliford Try PLC ‐ £7.8m (profit of £4.1m)– NCC Group ‐ £6.8m (profit of £4.5m)– Experian Group Limited £6.3m (profit of £4.1m)– UBM PLC ‐ £5.5m (profit of £1.9m)– Cape PLC £4.1m (loss of £0.5m)– Brooks Macdonald Group PLC £2.7m (profit of £1.0m)– Goals Soccer Centres £2.3m (loss of £0.5m)– Hargreaves Services £2.3m (loss of 49k)– Altitude Group PLC ‐ £1.8m (profit of £0.8m)– Cairn Energy PLC ‐ £1.1m (loss of £2.1m)– ImmuPharma ‐ £0.6m (loss of £0.3m)– Rhythmone PLC ‐ £0.2m (loss of £0.9m)– RedT Energy PLC ‐ £0.2m (loss of £1.1m)– CAP‐XX Ltd ‐ £0.1m (loss of £1.7m)– Gordon Dadds Group £64k (loss of £1.1m)
• Fund Sales £18.6m:
– iShares Core EM IMI UCITS ETF ‐ £4.5m (profit of £71k)– SSgA GBP Liquidity Fund ‐ £3.8m (profit of 3k)– JLP Credit Opportunity Fund £2.3m (profit of £0.3m)– Schroder ISF Asian Total Return Fund ‐ £2.2m (profit of £0.6m)– Argentiere Fund ‐ £1.7m (loss of £0.2m)– Global Event Partners £1.6m (profit of £0.2m)– Cantab CCP Core Macro Fund £1.3m (profit of £29k)– BlackRock European Hedge Fund ‐ £0.6m (profit of £0.2m)– Odey Absolute Return Fund ‐ £0.6m (loss of £54k)

15
HANSA TRUSTGlobal Equities – performance by size of holding 31 December 2017
Security NameInitial Purchase
Date
Value 31/12/17
(GBP)
% of Total NAV
% of Global Equity Silo
1 YearPerformance
(or since initial
purchase)
3 YearPerformance
(or since initial
purchase)
Hansteen Holdings PLC 25/11/2005 5,103,275 1.5% 10.0% 34.2% 59.3%
Interactive Brokers Group Inc 05/04/2017 3,282,636 1.0% 6.4% 56.9% 56.9%
Hilton Food Group PLC 23/04/2014 3,149,950 1.0% 6.2% 42.2% 142.1%
Berkshire Hathaway Inc 03/04/2017 2,930,514 0.9% 5.7% 9.9% 9.9%
Samsung Electronics Co Ltd 08/08/2017 2,879,444 0.9% 5.6% 10.0% 10.0%
UBM PLC 15/10/2010 2,840,843 0.9% 5.6% 5.6% 70.7%
CK Hutchison 01/12/2017 2,781,587 0.8% 5.5% ‐1.1% ‐1.1%
Alphabet Inc ‐ A Shares 18/04/2017 2,725,384 0.8% 5.3% 14.2% 14.2%
EXOR NV 05/09/2017 2,585,390 0.8% 5.1% ‐5.2% ‐5.2%
SoftBank Group Corp 08/05/2017 2,457,905 0.7% 4.8% ‐1.0% ‐1.0%
Liberty Global Plc 05/04/2017 2,118,865 0.6% 4.2% ‐7.3% ‐7.3%
Bayer AG 05/04/2017 2,072,053 0.6% 4.1% 1.2% 1.2%
Orion Engineered Carbons SA 17/07/2017 1,986,990 0.6% 3.9% 5.0% 5.0%
Howard Hughes Corp 10/04/2017 1,940,716 0.6% 3.8% 0.8% 0.8%
CBRE Group Inc 12/07/2017 1,920,905 0.6% 3.8% 11.2% 11.2%
White Mountains Insurance 11/04/2017 1,875,266 0.6% 3.7% ‐10.7% ‐10.7%
Nutrien 29/11/2017 1,829,955 0.6% 3.6% 4.0% 4.0%
CVS Health Corp 10/04/2017 1,822,147 0.6% 3.6% ‐12.3% ‐12.3%
Iridium Communications Inc 12/07/2017 1,308,397 0.4% 2.6% 2.8% 2.8%
Brooks Macdonald Group PLC 21/03/2012 1,168,294 0.4% 2.3% ‐0.2% 41.3%
NCC Group PLC 09/07/2004 1,109,946 0.3% 2.2% 31.7% 19.3%
TripAdvisor Inc 11/09/2017 1,069,559 0.3% 2.1% ‐24.9% ‐24.9%
Acertec Limited 10/05/2006 11,699 0.0% 0.0% 0.0% 8.7%
Total Global Equities Silo 55,418,822 16.5% 100.0%
Primary Exchange or Equity Index
FTSE 250, 15.6%
FTSE Small Cap, 10.7%
S&P 500, 20.5%NASDAQ,
16.8%
Russell 1000, 7.5%
Kospi, 11.1%
Nikkei 225, 4.8%
Borsa Italiana, 5.1%
DAX, 4.1% NYSE, 3.9%

HANSA TRUSTThe transition from UK Equities to Global as at end December 2017
Sales % of holding sold
Galliford Try 100%Experian 100%Cape 100%Hargreaves Services 100%Cairn Energy 100%Immupharma 100%Cap‐XX 100%RedT Energy 100%Goals Soccer Centres 100%Altitude 100%UBM 67%NCC 65%Hansteen Holdings 50%Brooks Macdonald 14%Hilton Food Group 0%Acertec 0%
Purchases Berkshire Hathaway Liberty GlobalInteractive Brokers BayerCVS HealthHoward Hughes CorpWhite Mountains Alphabet Softbank CBRE Group IncEXOR NVIridium Communications PLCOrion Engineered Carbons SASamsung Electronics Co LtdTripAdvisor IncNutrienCK Hutchison
Europe 41%
US40%
Asia 19%
Geographic Exposure by Listing
0%
2%
4%
6%
8%
10%
12%
World Index FTSE 100 Global Equities Performance
Performance 1 April 2017 to 31 December 2017
16

Portfolio Positioning & Characteristics
17

18
HANSA TRUSTCurrent Positioning (as at 31 December 2017)
13.2%
7.0% 6.4%
3.7% 3.2%1.1%
8.4%
4.1%
1.4% 1.6%3.8%
1.0% 0.5%
11.1%
6.9%
3.6%1.8%
19.8%
1.5%
0%
5%
10%
15%
20%
25%

19
HANSA TRUSTPortfolio Characteristics (as at 31 December 2017)
Look‐through analysis of Hansa Trust portfolio, including holdings in Ocean Wilson (Investments) Ltd*
Note: The exposures are based on the underlying holdings of the investments*Exposures in Ocean Wilson (Investments) Ltd. are based on the top 30 positions. These are subsequently grossed up to 100%.
41.3%
31.0%
15.1%
5.3% 3.6% 3.6%
Dealing Frequency
Daily > 1 year Monthly Quarterly Weekly Fixed Life Investment Period Complete
48.2%
19.8%
15.5%
6.9%
3.6% 2.7% 1.8%1.5%
Asset Type
Long Only Wilson Sons Direct Equities Market Neutral
Private Equity Long‐Short Fixed Income Cash
18.2%
14.0%
13.7%9.9%
7.7%
7.2%
6.5%
6.4%6.2%
4.6%2.4%
2.3% 0.8%
Sector Exposure
Information Technology Financials Consumer DiscretionaryDiversifying Hedge Funds Real Estate Health CareConsumer Staples Industrials MaterialsTelecommunications Energy Cash/Liquidity FundsUtilities
35.7%
13.4%11.3%10.5%
10.4%
9.6%2.9%
2.3% 2.3%1.5%
Geographic Exposure
North America Asia Pacific ex Japan UKDeveloped Europe ex UK Diversifying Hedge Funds JapanMiddle East & Africa Latin America Cash/Liquidity FundsEmerging Europe

20
HANSA TRUSTOther Portfolio Characteristics (as at 31 December 2017)
Weighted average management fee = 1.18%. This includes management fees paid to third parties and to Hansa Capital Partners LLP.
Cash2%
1 Week35%
1 month9%3 months
11%
6 months5%
> 6 months4%
Fixed34%
Liquidity
0%40.2%
0 < x ≤ 1%50.7%
1 < x ≤ 1.5%4.6%
1.5 < x ≤ 2%4.5%
Annual 3rd Party Management Fees on Underlying Holdings
The position in Ocean Wilsons Holdings Ltd is categorised as ‘fixed’ for liquidity purposes.

21
HANSA TRUSTDividend ProfileDividend Policy
The Trust’s dividend policy was updated in 2014, and it is now to pay two similar interim dividends each year.Barring unforeseen circumstances, the dividend is expected to grow over time reflecting the longer term returnsof the portfolio. Under certain circumstances a final extra dividend may be proposed.
0.0%
0.5%
1.0%
1.5%
2.0%
2.5%
3.0%
0
5
10
15
20
25
30
2005 2006 2007 2008 2009 2010 2011 2012 2013 2014 2015 2016 2017
12 m
onth yield
Net dividen
d (pen
ce)
Dividend Payments and Annual Yield
Net dividends paid during calendar year (LHS) 12 month yield (RHS)

22
HANSA TRUSTDiscount
A significant discount to asset value both absolute and relative to the broader investment trust sector. Even more so on a look through basis
‐50%
‐45%
‐40%
‐35%
‐30%
‐25%
‐20%
‐15%
‐10%
‐5%
0%
Dec‐07
Jun‐08
Dec‐08
Jun‐09
Dec‐09
Jun‐10
Dec‐10
Jun‐11
Dec‐11
Jun‐12
Dec‐12
Jun‐13
Dec‐13
Jun‐14
Dec‐14
Jun‐15
Dec‐15
Jun‐16
Dec‐16
Jun‐17
Dec‐17
Hansa Trust Ord and A combined
Discount Look‐through discount
‐45%‐40%‐35%‐30%‐25%‐20%‐15%‐10%‐5%0%5%
10%
May‐08
Nov
‐08
May‐09
Nov
‐09
May‐10
Nov
‐10
May‐11
Nov
‐11
May‐12
Nov
‐12
May‐13
Nov
‐13
May‐14
Nov
‐14
May‐15
Nov
‐15
May‐16
Nov
‐16
May‐17
Nov
‐17
Hansa Trust Ord and A combined (relative to AIC overall average discount)
Discount Look‐through discount

Ocean Wilsons Holdings
23

24
HANSA TRUSTOcean Wilsons Holdings
Ocean Wilsons Holdings is a Bermudian investment holding company whose main assets are a controlling interest in Wilsons Sons and an international investment portfolio, both run with a long‐term view. The Oceans holding is controlled by the Hansa Trust board

25
HANSA TRUSTWilson Sons
Wilson Sons is among Brazil’s largest and oldest port, maritime and logistics services companies
Revenue EBITDA

26
HANSA TRUSTWilson Sons
Despite the challenges faced in Brazil in recent years, Wilsons has generated significant economic value
27
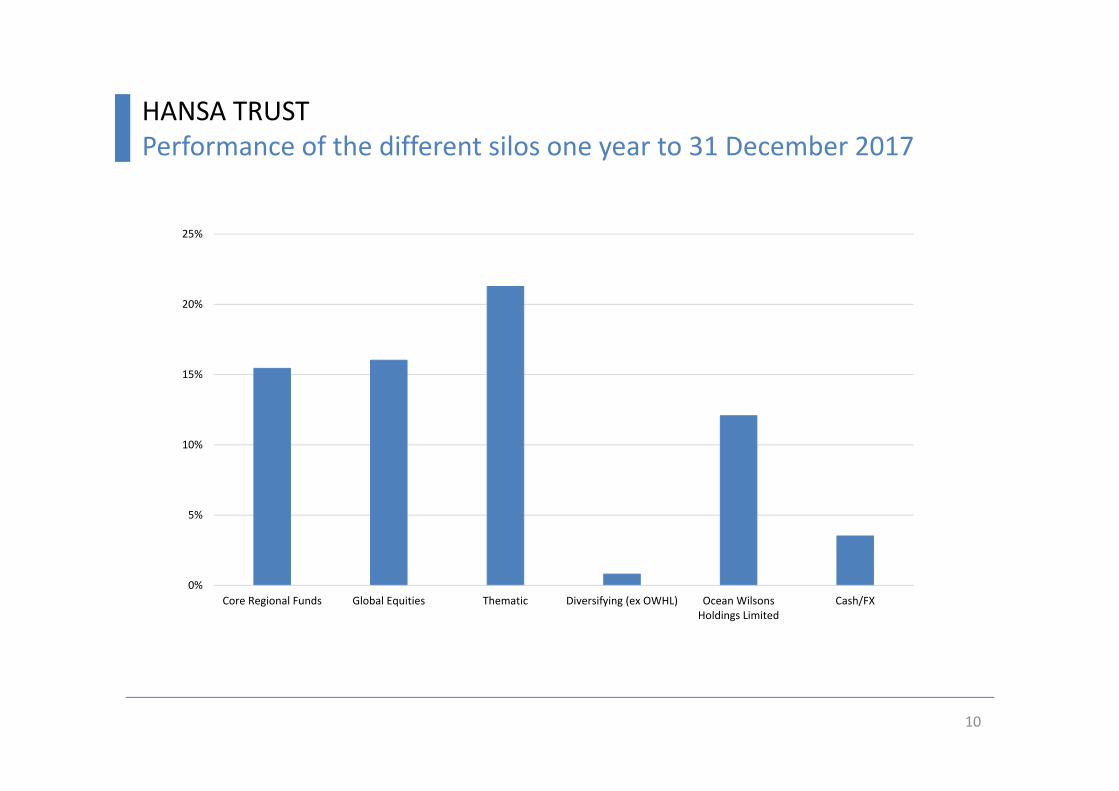
HANSA TRUSTWilson Sons
Wilson Sons operates in a market with significant structural growth potential

28
HANSA TRUSTOcean Wilsons Investments (Limited) as at 31 December 2017
Ocean Wilsons Investments (Limited) is an investment portfolio focused on achieving long‐term returns while emphasising capital generation and possessing an emerging market bias
13.3%
9.4%8.2%
6.5% 6.4%
3.0% 2.1% 2.0%
28.8%
3.2% 2.7% 2.3%1.0% 1.0%
6.6%
0.5% 0.4%2.6%
0%
5%
10%
15%
20%
25%
30%

Market Outlook
29

HANSA TRUSTMarket outlook…..a choppy to start to the year
…….markets raced ahead in January only to collapse in late January and early February. Net little change
30
Source: Bloomberg; MSCI
LC Returns as of 16 Feb 2018Start of year (1 Jan 2018) to Peak (26 Jan 2018)
Peak (26 Jan 2018) to Trough (9 Feb 2018) YTD
Equities ‐ RegionsMSCI ACWI + FM NR USD 7.3 ‐8.9 2.0MSCI World (Developed) NR USD 7.0 ‐8.8 1.8MSCI EM (Emerging Markets) NR USD 10.0 ‐10.2 3.7MSCI Frontier Markets NR USD 6.6 ‐6.0 3.5MSCI EM Asia NR USD 9.5 ‐10.5 2.1MSCI EM ex Asia NR USD 11.5 ‐9.4 8.0MSCI Europe NR EUR 2.9 ‐8.0 ‐2.2
Equities ‐ CountriesMSCI North America NR USD 7.2 ‐8.7 2.1MSCI United Kingdom NR GBP ‐0.2 ‐7.4 ‐4.7MSCI Japan NR JPY 3.8 ‐7.6 ‐3.8MSCI China NR USD 14.5 ‐13.4 5.9MSCI India NR INR 5.0 ‐5.7 ‐1.9MSCI Brazil NR BRL 12.5 ‐5.5 11.1MSCI Russia NR USD 12.3 ‐7.3 11.0Equities ‐ SectorMSCI ACWI Financials NR USD 8.5 ‐8.4 3.7MSCI ACWI Energy NR USD 7.2 ‐12.5 ‐3.3MSCI ACWI Information Technology NR USD 9.1 ‐9.1 5.0MSCI ACWI Health Care NR USD 9.1 ‐10.1 2.6MSCI ACWI Biotech NR USD 12.9 ‐10.6 5.5Fixed IncomeiBoxx USD Treasuries TR ‐1.2 ‐0.9 ‐2.3iBoxx USD Liquid IG ‐1.0 ‐2.0 ‐3.1iBoxx USD Liquid HY 0.8 ‐2.4 ‐0.6FTSE UK Gilts All Stocks TR GBP ‐1.7 ‐0.9 ‐2.5FTSE UK Govt Index Linked All Stocks TR GBP ‐2.0 ‐1.9 ‐3.4iBoxx GBP Non‐Gilts TR ‐0.6 ‐1.4 ‐2.0JPM GBI‐EM Global Diversified TR USD 4.7 ‐2.5 4.6JPM EMBI Global TR USD 0.1 ‐2.7 ‐2.2JPM Corp EMBI USD 0.1 ‐1.2 ‐1.0CommoditiesBloomberg Commodity Index TR USD 3.1 ‐5.6 0.2Gold Bullion USD 3.6 ‐2.5 3.4Copper Index USD ‐2.9 ‐5.2 ‐1.4European Dated Brent Index USD 5.1 ‐11.0 ‐3.0WTI Cushing CR USD 9.5 ‐10.5 2.1

HANSA TRUSTMarket outlook…..reasons for volatility
….the catalyst for the correction appeared to be disappointing inflation numbers. Certainly the market had started to bake in persistently low inflation but a key factor is also market complacency
31
Source: FactSetSource: Deutsche Bank

HANSA TRUSTMarket outlook……correction or crash?
……under a wide range of valuation measures, equity markets are increasingly fully valued, especially the US stock market
0%10%20%30%40%50%60%70%80%90%
100%
P/E to Growth EV/Sales EV/EBITDA Price/Book Forward P/E FCF yield Cyclicallyadjusted P/E
Aggregate Index Historical Percentile
S&P500 STOXX600
32
Source: Goldman Sachs

HANSA TRUSTMarket outlook……correction or crash?
…….economic growth is largely improving in both developed and emerging markets. No sign of recession any time soon
33
Source: Deutsche Bank
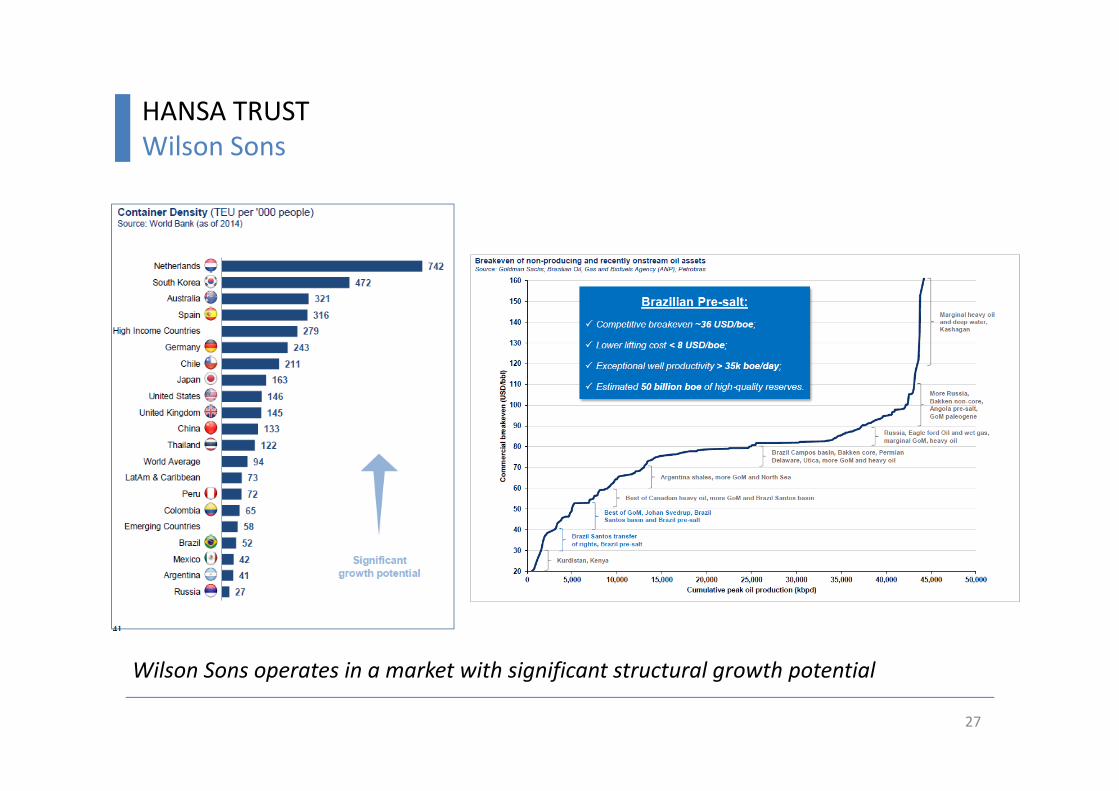
HANSA TRUSTMarket outlook……correction or crash?
…..stronger economic growth is feeding through to improved corporate profitability.
34
Source: Standard & Poors. Thompson Financial. FactSet. Credit Suisse

HANSA TRUSTMarket outlook……correction or crash?
……clearly we are at an inflection point in the liquidity cycle but still a huge amount of liquidity is being pumped into the system. A significant jump in yields may limit equity returns
35

HANSA TRUSTMarket outlook……correction or crash?
………some tentative signs that excess & exuberance are re‐entering the system but not at the extremes normally associated with a downturn
Arguments for….. Arguments against…..Pockets of consumer excess in areas such auto debt
Mortgage debt, which is far more important, is well under control
Overall country debt levels still high in developed economies and also in China
Banks are key to healthy economies and they appear well controlled
Some signs that retail investors are increasingly viewing equities as the ‘best asset class’
Investors still feel the pain of previous bear markets and are keen to forecast the next downturn
Volatility low Fund manager cash levels still high (4.7% on Merrill Lynch fund manager survey)
Bitcoin – market manias
36
Excess & Exuberance

Global Financial Crisis Liquidity
pumped into the system via zero
interest rate policies and
QE
The avoidance of a global collapse in economies and the banking system saw valuations normalise across asset classes
Bond yields collapse through zero interest
rate policies and massive demand
via QE
Equities rise as investors forced up the risk spectrum in pursuit of returns
Liquidity cycle inflects
?
HANSA TRUSTMarket outlook……correction or crash?
…..much has happened in this cycle. The question is, how close are we to the end?
37

HANSA TRUSTPositioning……technology and innovation
38
……despite the strong performance, valuations remain attractive, especially if growth is taken into consideration. Tech has important implications geographically and for existing industries
Source: GAM. New RelicSource: Financial Times
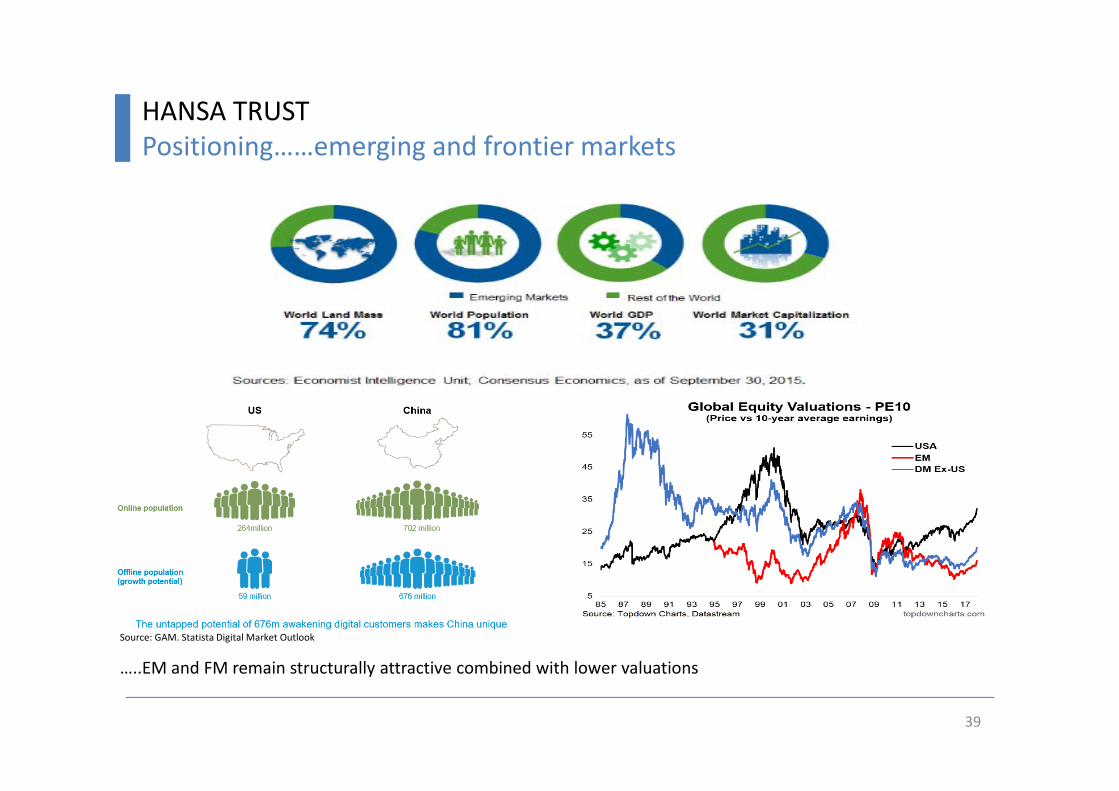
HANSA TRUSTPositioning……emerging and frontier markets
39
…..EM and FM remain structurally attractive combined with lower valuations
Source: GAM. Statista Digital Market Outlook

HANSA TRUSTPositioning……bonds
…..bonds remain unattractive albeit we watch the current rise in yields
40
Source: Financial Times

Equities57.5%
Directional Hedge Funds4.0% Private Equity
7.1%
Bonds2.2%
Cash1.8%
Hedge Funds (non
directional)7.6%
Wilson Sons19.8%
HANSA TRUSTSummary as at 31 December 2017
Riskier Assets
Lower Risk Assets
Strategic Allocation
…..we’re currently running 12% in defensive assets. We’re minded to progressively increase this albeit with the provision of identifying the right assets
41

HANSA TRUSTConclusion
42
• Clearly markets are in the more mature stages of their lifecycle
• Higher valuations remove the safety net and can lead to higher portfolio volatility and being susceptible to disappointment
• For this reason we are getting prepared to add to more defensive positions as the cycle evolves
• It is also the case though that for now we see continued upside in equities…….often the later, momentum stages of stock market cycles can represent powerful periods for performance

Appendix
43

44
HANSA TRUSTPerformance of the different silos three years to 31 December 2017
0%
10%
20%
30%
40%
50%
60%
Core Regional Funds Global Equities Thematic Diversifying (ex OWHL) Ocean Wilsons HoldingsLimited
Cash/FX

IMPORTANT NOTICE
This presentation pack is issued by Hansa Capital Partners LLP, which is authorised and regulated by theFinancial Conduct Authority.
Hansa Capital Partners LLP is the Portfolio Manager and Company Secretary to Hansa Trust PLC.
Investment Trusts are UK Public Listed companies and are not authorised or regulated by the FinancialConduct Authority.
The staff at Hansa Capital Partners LLP and/or the Directors of Hansa Trust PLC may hold positions inthe securities mentioned in this presentation or may buy, sell or offer to make a purchase or sale of suchsecurities from time to time.
This presentation pack is not a prospectus, does not contain any representations, and does not constituteor form part of any offer or invitation to buy, underwrite or solicit any offer to purchase securities, norshall it or any part of it form the basis of or be relied upon in connection with any contract therefore.
This presentation pack has been solely supplied for your information and you may not be reproduce it,distribute it to another person or publish it, in any case in whole and in part, for any purpose.The information contained in this pack is selective, is for background purposes only and is subject toamendment.
Past performance is not necessarily a guide to future performance. The price of shares and incomegenerated may fall as well as rise. An investor may not get back the amount invested.
45