Embed Size (px)
Citation preview
© 2015 E3 Alliance
School Readiness
1
2015 CENTRAL TEXAS EDUCATION PROFILE
Made possible through the investment of:
© 2015 E3 Alliance
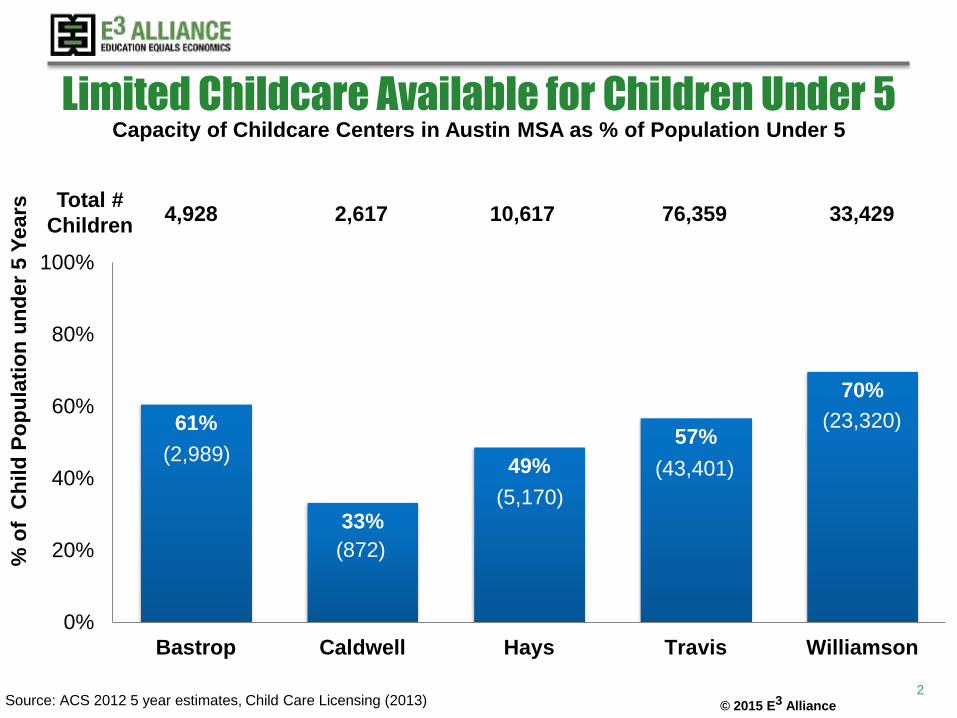
61%
33%
49%
57%
70%
0%
20%
40%
60%
80%
100%
Bastrop Caldwell Hays Travis Williamson
% o
f C
hild
Po
pu
lati
on
un
der
5 Y
ears
4,928 2,617 10,617 76,359 33,429 Total #
Children
Source: ACS 2012 5 year estimates, Child Care Licensing (2013)
Limited Childcare Available for Children Under 5
2
(2,989)
(872)
(5,170)
(43,401)
(23,320)
Capacity of Childcare Centers in Austin MSA as % of Population Under 5

© 2015 E3 Alliance
Growth in District Pre-K Enrollment Declined
Beginning in 2012
-2%
0%
2%
4%
6%
8%
10%
12%
14%
16%
18%
20%
2004 2005 2006 2007 2008 2009 2010 2011 2012 2013 2014
An
nu
al
Rate
of
Gro
wth
Annual Enrollment Growth by Year, 2003 through 2014
Central Texas Texas
Source: E3 Alliance analysis of Texas Education Agency AEIS data
3

© 2015 E3 Alliance
3 out of 4 Low Income Children Attend Public Pre-K
22%
29%
48%
1%
At Home/Relative Public Pre-K Private Pre-K Head Start
4
13%
75%
9%
3%
E3 Alliance Analysis of Ready,Set,K! weighted data 2010-2014, Central Texas
Low Income Non-Low Income
Experience Year Prior to Kindergarten
© 2015 E3 Alliance
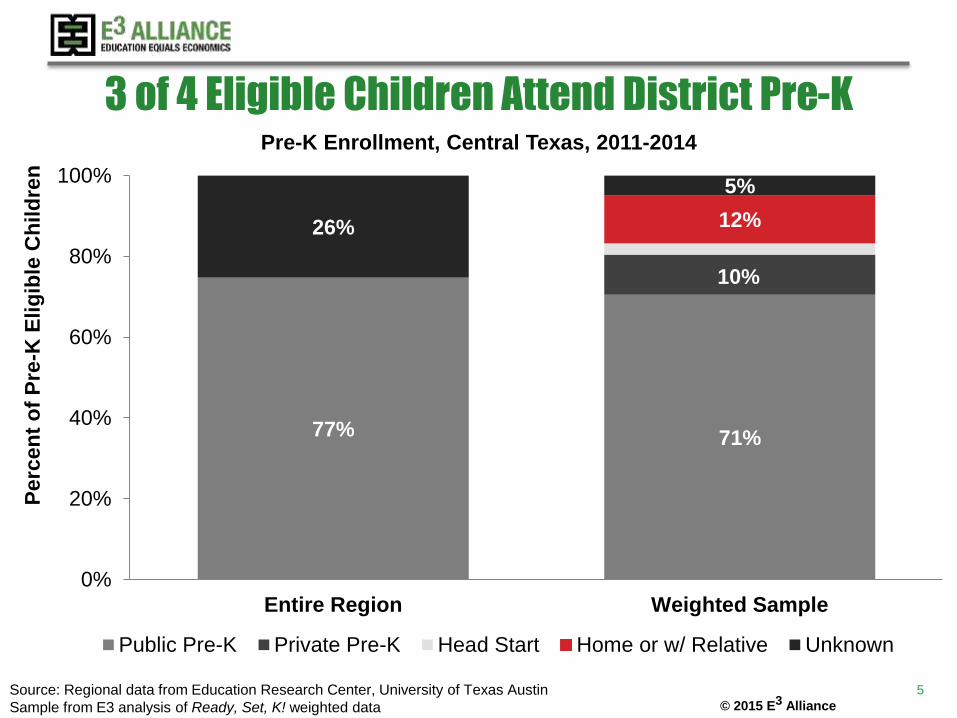
3 of 4 Eligible Children Attend District Pre-K
77% 71%
10%
12% 26%
5%
0%
20%
40%
60%
80%
100%
Entire Region Weighted Sample
Perc
en
t o
f P
re-K
Elig
ible
Ch
ild
ren
Pre-K Enrollment, Central Texas, 2011-2014
Public Pre-K Private Pre-K Head Start Home or w/ Relative Unknown
Source: Regional data from Education Research Center, University of Texas Austin
Sample from E3 analysis of Ready, Set, K! weighted data
5
© 2015 E3 Alliance
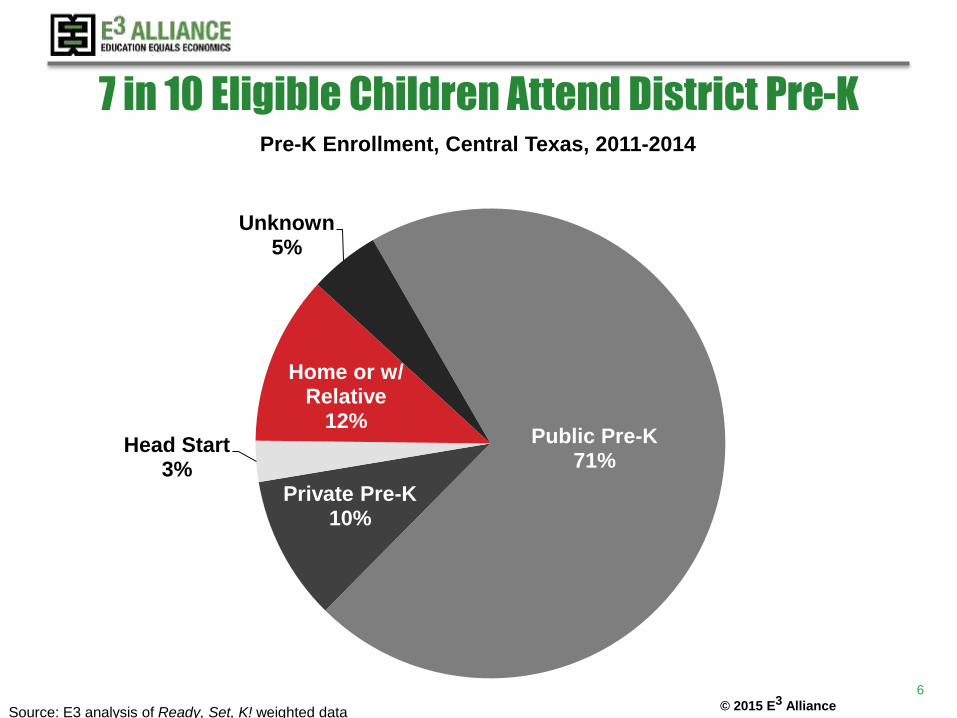
7 in 10 Eligible Children Attend District Pre-K
Public Pre-K 71%
Private Pre-K 10%
Head Start 3%
Home or w/ Relative
12%
Unknown 5%
Pre-K Enrollment, Central Texas, 2011-2014
Source: E3 analysis of Ready, Set, K! weighted data
6

© 2015 E3 Alliance
Eligible White Students Enrolled in Public Pre-K
in Lowest Proportion
71% 79%
54%
11% 6%
24%
14% 12% 18%
0%
20%
40%
60%
80%
100%
Black (N=196) Hispanic (N=1,415) White (N=285)
Perc
en
t o
f P
re-K
Elig
ible
Ch
ild
ren
Pre-K Enrollment, Central Texas, 2010-11 to 2014-15
Public Pre-K Private Pre-K Head Start Home or with Relative
E3 Analysis of Ready, Set, K! weighted data 7

© 2015 E3 Alliance
Most Children Not in Pre-K are Hispanic
Black 10%
Hispanic 62%
Other 7%
Asian 2%
White 19%
Children not attending any Pre-K, Central Texas, 2010-2014
E3 Analysis of Ready, Set, K! weighted data 8

© 2015 E3 Alliance
Proportionally More Eligible White and Fewer
Hispanic Students Not in Pre-K
Black 10%
Hispanic 62%
Other 7%
Asian 2%
White 19%
Kindergartners with No Pre-K
E3 Analysis of Ready, Set, K! weighted data for Central Texas, 2010-11 to 2014-15 9
Black 9%
Hispanic 68%
Other 4%
Asian 5%
White 14%
All Kindergarten Students
© 2015 E3 Alliance
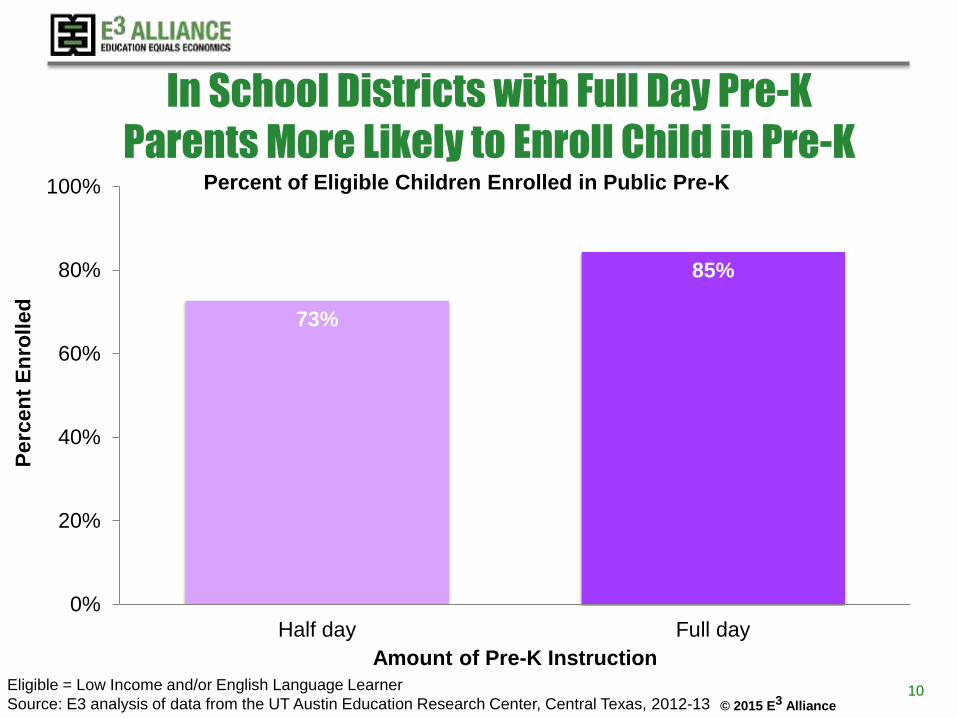
In School Districts with Full Day Pre-K
Parents More Likely to Enroll Child in Pre-K
73%
85%
0%
20%
40%
60%
80%
100%
Half day Full day
Amount of Pre-K Instruction
Percent of Eligible Children Enrolled in Public Pre-K
Perc
en
t E
nro
lled
10 Eligible = Low Income and/or English Language Learner
Source: E3 analysis of data from the UT Austin Education Research Center, Central Texas, 2012-13

© 2015 E3 Alliance
Students in Full Day Public Pre-K
Miss 5 Fewer Days of School on Average
154
159
130
135
140
145
150
155
160
165
170
175
Half day Full day
Amount of Pre-K Instruction
Number of Days Eligible Children Attended Public Pre-K
Nu
mb
er
of
Days i
n A
tten
dan
ce
11 Eligible = Low Income and/or English Language Learner
Source: E3 analysis of data from the UT Austin Education Research Center, Central Texas, 2012-13

© 2015 E3 Alliance
Return on Investment Over Time From Enrolling each
Cohort of Children Who Are Eligible But Not Enrolled
Source: Taylor et al. (2006) Bush School of Government and Public Service Texas A&M University Based on 2011-2012 E3 Analysis of ERC and K-Readiness Data
$30 Million
12

© 2015 E3 Alliance
Decrease of $7.93 Million to Region for Pre-K
Source: Region XIII and E3 Alliance Surveys 2010; 2012
27%
73%
82%
0%
20%
40%
60%
80%
100%
Reduced Pre-KCoordination
Increased Student toTeacher Ratio
Increased Class Size
% o
f D
istr
icts
Par
tici
pat
ing
in S
tud
y
Changes in District Pre-K Practices Between 2010 and 2012
13

© 2015 E3 Alliance
Low Ratio is <= 15 students per teacher; High Ratio is > 15 students per teacher
Source: E3 Alliance analysis of TAPR data and ESC Region 13 Pre-K Survey, CTX 2012-13
Few Students in Full Day Pre-K
with Low Student-Teacher Ratio
17%
28%
51%
5% 0%
20%
40%
60%
80%
100%
Half Day, High Ratio Half Day, Low Ratio Full Day,High Ratio Full Day, Low Ratio
Perc
en
t E
nro
lled
Public Pre-K Type
Pre-K Enrollment by Amount of Instruction and Student-Teacher Ratio
14

© 2015 E3 Alliance
Kindergarten Readiness
15
© 2015 E3 Alliance
Measuring School Readiness
• Developed by early childhood education
providers and researchers from the University of
Texas at Austin and Texas State University
• Helps teachers organize what they know about
individual students
• Leads to individualized teaching and instruction
16

© 2015 E3 Alliance
Measuring School Readiness
• Developed regionally with experts
• Representative of the 2008 Texas Pre-K Guidelines
• Aligned to Texas Essential Knowledge and Skills
• Developmentally appropriate and measurable
• Predictive of later school success
• Measures Multiple Components of readiness
• Validated
• Supports continuous improvement process
17

© 2015 E3 Alliance
Ready Set K! is a Valid and Reliable Assessment
of School Readiness
• Representative of the 2008 Texas Pre-K
Guidelines
• Developmentally appropriate and measurable
• Aligned to Texas Essential Knowledge and Skills
• Multidimensional
• Validated
18

© 2015 E3 Alliance
Ready Set K! - Completed by Trained Teachers
Teachers organize data and information from
• Observations of students in everyday interactions
• Work samples from class activities
• Data from one-on-one assessments
• TPRI
• reading assessments
• teacher made assessments
19

© 2015 E3 Alliance
Support Provided to Teachers Completing the
Assessment
• Training and Materials
• Guidelines for authentic assessment
• Data collection tools
• Process for organization of findings
• Teachers evaluate the assessment, materials
and the training
• Following completion of training, collection of data, and reflection
• The resulting information is used to improve the training and materials
20
© 2015 E3 Alliance
Ready Set K! Results Help Teachers Customize
Curriculum and Instruction
Response to Intervention (RTI)
• Example: Instructional Suggestion for
Intervention and Differentiation
To help a child associate the concept of alike and
different to sound discrimination, encourage her to
match pairs of plastic eggs filled with like items—e.g.
sand, pennies, etc.—that make distinctive sounds.
Use pictorial icons for the child to sort the plastic eggs
by alike and different
21
© 2015 E3 Alliance
Pre-K Factors Related to Readiness
• Amount of Instruction
State pays for half day instruction in Pre-K
Some districts choose to have full day Pre-K
• Student-Teacher Ratio – based on two
factors
Class size
Number of teachers per class
22

© 2015 E3 Alliance
Assessing Kindergarten Readiness
• Five years data collection (2010-11 to 2014-15)
• 12 Central Texas School Districts, 53 schools
• 3,847 Kindergarten students
• 2% Asian
• 12% Black
• 58% Hispanic
• 26% White
• 67% Low Income
• 34% English Language Learners
• Data weighted to represent region
Ready, Set, K! participants 2010-11 to 2014-15 23

© 2015 E3 Alliance
Just Over Half of Central Texas Students
Ready to Succeed in School
Ready 53%
Not Ready 47%
Kindergarten Readiness, Central Texas, 2010-11 to 2014-15
Source: E3 Alliance Analysis of Ready,Set,K! weighted data 24
© 2015 E3 Alliance
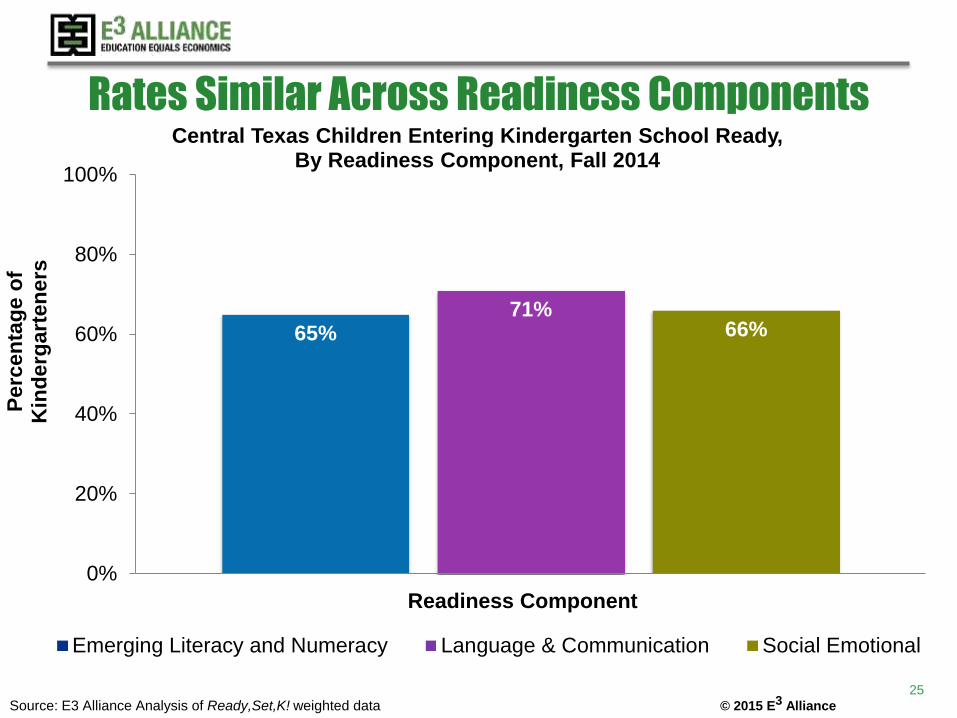
Rates Similar Across Readiness Components
65% 71%
66%
0%
20%
40%
60%
80%
100%
Perc
en
tag
e o
f
Kin
derg
art
en
ers
Central Texas Children Entering Kindergarten School Ready, By Readiness Component, Fall 2014
Emerging Literacy and Numeracy Language & Communication Social Emotional
Readiness Component
Source: E3 Alliance Analysis of Ready,Set,K! weighted data 25
© 2015 E3 Alliance
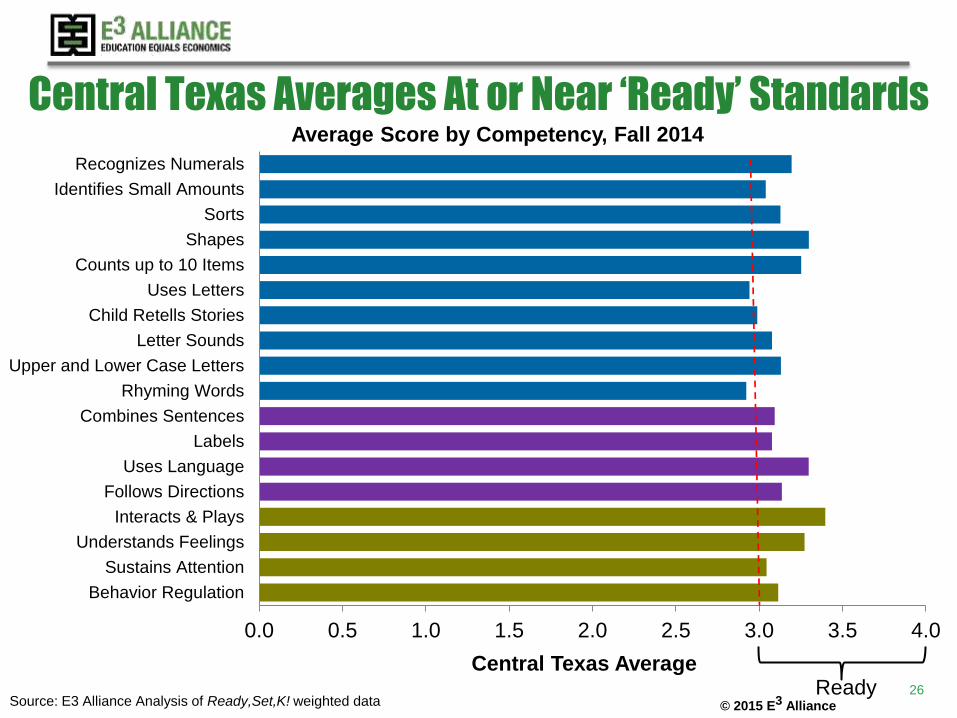
Central Texas Averages At or Near ‘Ready’ Standards
0.0 0.5 1.0 1.5 2.0 2.5 3.0 3.5 4.0
Behavior Regulation
Sustains Attention
Understands Feelings
Interacts & Plays
Follows Directions
Uses Language
Labels
Combines Sentences
Rhyming Words
Upper and Lower Case Letters
Letter Sounds
Child Retells Stories
Uses Letters
Counts up to 10 Items
Shapes
Sorts
Identifies Small Amounts
Recognizes Numerals
Average Score by Competency, Fall 2014
Ready Central Texas Average
Source: E3 Alliance Analysis of Ready,Set,K! weighted data 26

© 2015 E3 Alliance
Fewer Low Income Students Kindergarten Ready
42%
64%
0%
20%
40%
60%
80%
100%
Low Income Non-Low Income
Perc
en
tag
e o
f K
ind
erg
art
ners
Kindergarten Readiness, Central Texas, 2010 to 2014
Source: E3 Alliance Analysis of Ready,Set,K! weighted data 27

© 2015 E3 Alliance
Readiness Rate Differ Across Income and Ethnicity
62%
39% 40%
48%
76%
52%
58%
66%
0%
20%
40%
60%
80%
100%
Asian Black Hispanic White
Pe
rce
nta
ge
of
Kin
derg
art
ners
Kindergarten Readiness, Central Texas, 2010-11 to 2014-15
Low Income Non-Low Income
2020 School Readiness Objective for All Children = 70%
Source: E3 Alliance Analysis of Ready,Set,K! weighted data 28

© 2015 E3 Alliance
More Students with Pre-K Ready for School
20%
54%
46%
68%
0%
20%
40%
60%
80%
100%
Low Income Non-low Income
Perc
en
tag
e o
f K
ind
erg
art
ners
R
ead
y
Kindergarten Readiness, Central Texas, 2010-11 to 2014-15
Home or with Relative
Enrolled in Pre-K
Status Prior to Kindergarten
E3 Alliance Analysis of Ready,Set,K! weighted data
PK enrollment includes Public and Private Pre-K programs
29

© 2015 E3 Alliance
Low Income Kindergartners with Pre-K Experience
Almost 4x More Likely To Be Ready for School
1X 2X 3X 4X
Low Income
Non-Low Income
All
Odds of Kindergarten Readiness
Odds of Kindergarten Readiness Based on Pre-K Enrollment Status, Central Texas, 2010-2014
E3 Alliance analysis of Ready,Set,K! weighted data; odds ratios (as relative risk) from logistic
regression by income status with Pre-K enrollment (Public & Private) and gender as predictors 30

© 2015 E3 Alliance
English Language Learners Ready at Same Rate
as Their Economic Peers
42%
62%
42%
65%
0%
20%
40%
60%
80%
100%
Low Income Non-low Income
Perc
en
tag
e o
f K
ind
erg
art
ners
R
ead
y
Kindergarten Readiness, Central Texas, 2010-11 to 2014-15
ELL Non-ELL
E3 Alliance Analysis of Ready,Set,K! weighted data
PK enrollment includes Public and Private Pre-K programs
31
© 2015 E3 Alliance
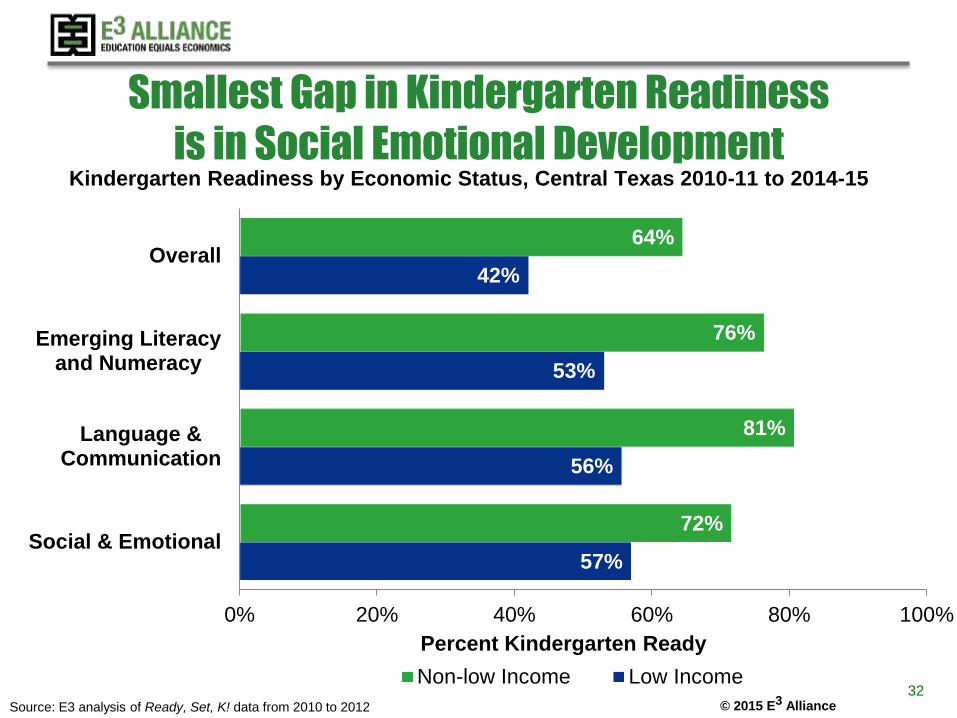
Smallest Gap in Kindergarten Readiness
is in Social Emotional Development
57%
56%
53%
42%
72%
81%
76%
64%
0% 20% 40% 60% 80% 100%
Social & Emotional
Language &Communication
Emerging Literacyand Numeracy
Overall
Percent Kindergarten Ready
Non-low Income Low Income
Kindergarten Readiness by Economic Status, Central Texas 2010-11 to 2014-15
32 Source: E3 analysis of Ready, Set, K! data from 2010 to 2012

© 2015 E3 Alliance
For all Readiness Components
More Students Ready with Pre-K Experience
56%
59%
49%
40%
66%
70%
68%
56%
0% 20% 40% 60% 80%
Social & Emotional
Language &Communication
Emerging Literacyand Numeracy
Overall
Percent Kindergarten Ready
Enrolled in Pre-K At Home or with Relative
Kindergarten Readiness by Pre-K Experience, Central Texas 2010-11 to 2014-15
33 Source: E3 Alliance analysis of Ready,Set,K! data
Enrollment includes Public and Private Pre-K programs

© 2015 E3 Alliance
More Girls Ready for Kindergarten
48%
57%
0%
20%
40%
60%
80%
100%
Boys Girls
Perc
en
tag
e K
ind
erg
art
ners
Kindergarten Readiness, Central Texas, 2010 to 2013
Source: E3 Alliance Analysis of Ready,Set,K! weighted data 34

© 2015 E3 Alliance
Kindergartners With Pre-K Experience
3X More Likely To Be Ready for School
1X 2X 3X 4X
Emerging Literacy &Numeracy
Language & Communication
Social-Emotional
Overall Readiness
Odds of Kindergarten Readiness
Odds of Kindergarten Readiness Based on Pre-K Enrollment Status, Central Texas, 2010-2014
E3 Alliance analysis of Ready,Set,K! weighted data; odds ratios (as relative risk) from
logistic regression with Pre-K enrollment (Public & Private), income status and gender as predictors 35

© 2015 E3 Alliance
Greater readiness than other groups, p = .002
Eligible = Low income and/or English Language Learner; Low Ratio is <=15 students/teacher
Source: E3 Alliance analysis of Central Texas Ready,Set,K! data from 2010-11 to 2014-15
Greatest Language Readiness with Full Day Pre-K and
Low Student-Teacher Ratio
61% 61% 61%
69%
0%
20%
40%
60%
80%
100%
Half Day, High Ratio Half Day, Low Ratio Full Day, High Ratio Full Day, Low Ratio
Avera
ge R
ead
iness P
rop
ort
ion
Public Pre-K Type
Readiness in Language and Communication for Eligible Children by Amount of Instruction and Student-Teacher Ratio
*
36
© 2015 E3 Alliance
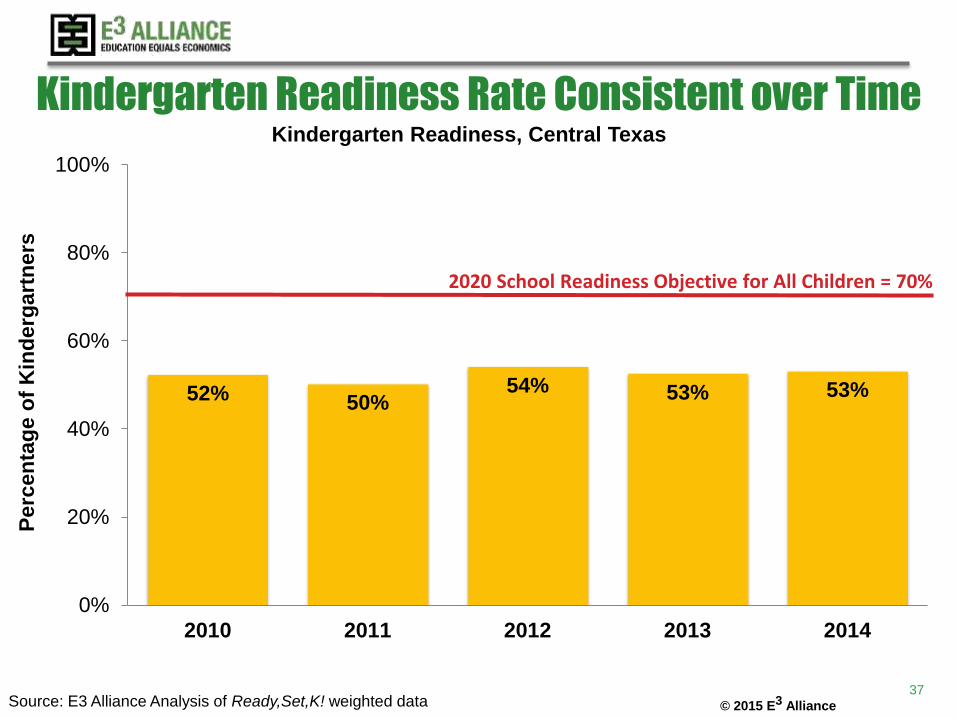
Kindergarten Readiness Rate Consistent over Time
52% 50% 54% 53% 53%
0%
20%
40%
60%
80%
100%
2010 2011 2012 2013 2014
Perc
en
tag
e o
f K
ind
erg
art
ners
Kindergarten Readiness, Central Texas
2020 School Readiness Objective for All Children = 70%
Source: E3 Alliance Analysis of Ready,Set,K! weighted data 37
© 2015 E3 Alliance
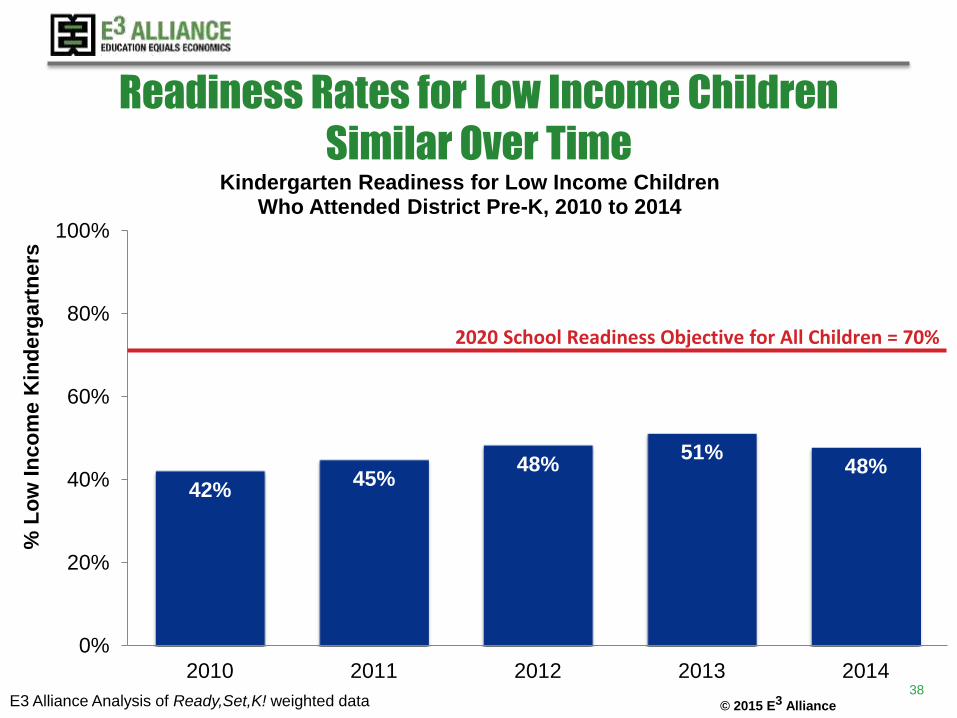
Readiness Rates for Low Income Children
Similar Over Time
42% 45%
48% 51%
48%
0%
20%
40%
60%
80%
100%
2010 2011 2012 2013 2014
% L
ow
In
co
me K
ind
erg
art
ners
Kindergarten Readiness for Low Income Children Who Attended District Pre-K, 2010 to 2014
2020 School Readiness Objective for All Children = 70%
E3 Alliance Analysis of Ready,Set,K! weighted data 38

© 2015 E3 Alliance
www.e3alliance.org
The conclusions of this research do not necessarily reflect the opinions or official position of the
Texas Education Agency, the Texas Higher Education Coordinating Board, or the State of Texas.
E3 Alliance