Embed Size (px)
Citation preview

Ready for Kindergarten: Maryland’s Early Childhood
Comprehensive Assessment System
The 2016-2017 Kindergarten Readiness
Assessment Report
January 2017
R E A DINE S S
M AT T ERS I N F O R M I N G T H E F U T U R E
M A R Y L A N D S TAT E B O A R D O F
E DU C AT I O NLarry J. Hogan, Jr., Governor
Andrew R. Smarick, President
Chester E. Finn, Jr., Ed.D, Vice President
Laurie Halverson
Michele Jenkins Guyton, Ph.D.
Stephanie R. Iszard
Dr. Rose Maria Li
Jannette O’Neil-Gonzalez
Barbara J. Shreeve
Mrs. Madhu Sidhu
Guffrie M. Smith, Jr.
Laura E. Weeldreyer
David Edimo, Student Member
Karen B. Salmon, Ph.D. Secretary-Treasurer of the Board
State Superintendent of Schools
Elizabeth Kelley Acting Assistant State Superintendent
Division of Early Childhood Development
1 A Message from Maryland’s State Superintendent of Schools
2 Ready for Kindergarten
6 Statewide Kindergarten Readiness Highlights
12 Jurisdictional Kindergarten Readiness Data
36 A Call to Action
C O N T E N T S
Karen B. Salmon, Ph.D. State Superintendent of Schools 200 West Baltimore Street, Baltimore, MD 21201 410-767-0100 410-333-6442 TTY/TDD
Dear Colleagues, Community Leaders, and Parents:
As part of Maryland’s ongoing commitment to early learning and school readiness, our comprehensive Kindergarten Readiness Assessment (KRA) was administered for the third time this year. This assessment is part of our Ready for Kindergarten: Maryland’s Early Childhood Comprehensive Assessment System (R4K) that was developed to align to our more rigorous PreK-12 College and Career-Ready Standards.
For the past fifteen years, Maryland has shared the school readiness results of our children. These results are used to: • Support teachers and schools by providing them rich information about each child’s skills, knowledge, and behaviors,
as well as any learning gaps so that teachers can make data-based decisions to better guide their instructional planning and intervention with students.
• Advise early childhood programs and school leaders so they can address the achievement gaps of children, inform professional development, and make curricula enhancements.
• Inform families by providing them with an Individual Student Report with suggestions on ways to support their child’s strengths and areas of need.
• Instruct community leaders and policy makers on how well-prepared children in their communities are for kindergarten, which helps them make well-informed programmatic, policy, and funding decisions.
Readiness Matters: The 2016-2017 Kindergarten Readiness Assessment Report shares the school readiness results of Maryland’s children - statewide, by subgroups, and for each of Maryland’s 24 local jurisdictions. Based on Maryland’s Prekindergarten standards, the results for this third year are: • 43% of entering kindergarteners in school year 2016-2017 are demonstrating that they possess the foundational skills
and behaviors that prepare them for the curriculum that is based on Maryland’s more rigorous kindergarten standards.• 50% of females are demonstrating readiness compared with 36% of the males. • 50% of Asian kindergarteners and 53% of white kindergarteners are demonstrating readiness above the state average
(43%). American Indian/Alaska Native (26%), African American (37%), Native Hawaiian/Pacific Islander (33%) and Hispanic (27%) kindergarteners are below the state average of kindergarteners demonstrating readiness.
• Kindergarteners with disabilities (19%), those learning the English language (21%), and those from low-income households (32%) have many fewer students demonstrating readiness than Maryland kindergarteners as a whole.
• Children who attended child care centers (51%) and non-public nursery schools (64%) the year prior to entering kindergarten exceed the statewide readiness average.
I firmly believe that we can close the school readiness gap and prepare our children for college and careers through high-quality early learning experiences, but we have more work to do - especially among children most at risk, including children from low-income households, English Learners and children with disabilities. That is why Maryland is continuing to make substantial investments in early care and education through Preschool Development Grant funding.
On behalf of Maryland’s young children, thank you for being a key partner in our efforts.
Karen B. Salmon, Ph.D. State Superintendent of Schools
2
R E A DY F O R K I N D E R G A R T E N
ON TRACK FOR SCHOOL SUCCESSPrekindergarten and kindergarten mark the start of a child’s
formal education. How prepared children are when they first
enter school often determines whether their school experience
is successful.
Students who demonstrate age-appropriate knowledge, skills,
and behaviors in math, reading, and social interaction at the
start of kindergarten continue developing on track throughout
their academic careers.1 They are more likely than their
peers to enjoy later academic success, attain higher levels of
education, and secure employment.2
The absence of these kindergarten readiness skills may
contribute to even greater disparities throughout students’
school years. For example, gaps in math, reading, and
vocabulary skills evident at kindergarten account for at least
half of the racial gap in high school achievement scores.3
These school readiness outcomes suggest that students who do
not enter kindergarten with age-appropriate abilities will need
support to further develop their skills to keep them on track
for school, career, and life success.
ABOUT READY FOR KINDERGARTEN (R4K)Evidence suggests that data-based decision-making improves
teaching practice and students’ learning. More than 25 states,
including Maryland, use readiness assessments as a means
of providing teachers with a snapshot of students’ skills and
abilities at kindergarten entry.4
In 2014-2015, Maryland introduced Ready for Kindergarten
(R4K): Maryland’s Early Childhood Comprehensive Assessment
System to align with the State’s rigorous PreK-12 College &
Career-Ready Standards. R4K builds on the success of the
Maryland Model for School Readiness (MMSR), which was the
statewide kindergarten assessment tool in use from 2001
to 2013.
R4K provides a single coordinated system for measuring
the learning progress (knowledge, skills, and behaviors)
and identifying the needs of young children. R4K has two
components:
1. The Early Learning Assessment (ELA) measures the progress
of learning in young children, 36 to 72 months (3 to 6 years
old), across nine levels in seven domains. The ELA allows
early educators, teachers, and families to look at a child’s
development, skills, and abilities and to create individualized
learning opportunities and plan interventions, if needed, to
ensure that each child is making progress in his/her learning.
This assessment can be administered in child care programs,
Head Start programs, public PreK, and kindergarten
classrooms. This is a voluntary formative assessment available
at no cost for all Maryland programs.
2. The Kindergarten Readiness Assessment (KRA) is a
developmentally appropriate assessment tool administered
to incoming public school kindergarteners that measures
school readiness across four learning domains. Administered
by kindergarten teachers prior to October 1, the KRA looks
at the knowledge, skills, and behaviors necessary to be
successful in kindergarten.
1 Rachel R. Schachter, Ph.D., Tara M. Strang, M.S., & Shayne B. Piasta, “Using the New Kindergarten Readiness Assessment” (The Schoenbaum Family Center and Crane Center for Early Childhood Research and Policy, The Ohio State University, Fall 2015).
2“ Early School Readiness: Indicators on Children and Youth” (Child Trends Data Bank, July 2015).
3“Early School Readiness: Indicators on Children and Youth.”4Schachter.
MEASURING KINDERGARTEN READINESSMaryland’s Kindergarten Readiness Assessment (KRA) measures
the knowledge, skills, and behaviors that children bring with
them to school and should have mastered prior to entering
kindergarten.
Kindergarten readiness levels are identified as:
• Demonstrating Readiness – a child demonstrates the
foundational skills and behaviors that prepare him/her for
curriculum based on the kindergarten standards.
• Approaching Readiness – a child exhibits some of the
foundational skills and behaviors that prepare him/her for
curriculum based on the kindergarten standards.
• Emerging Readiness – a child displays minimal foundational
skills and behaviors that prepare him/her for curriculum
based on the kindergarten standards.
Children whose readiness knowledge, skills, and behaviors
are “approaching” and/or “emerging” require differentiated
instruction, as well as targeted supports or interventions to be
successful in kindergarten.
The KRA indicates overall kindergarten readiness levels, as
well as readiness levels in each of the four domains and by
specific sub-groups, including: gender, race/ethnicity, disability
status, English proficiency status, free and reduced price meals
(FARMs) status, and prior care setting.
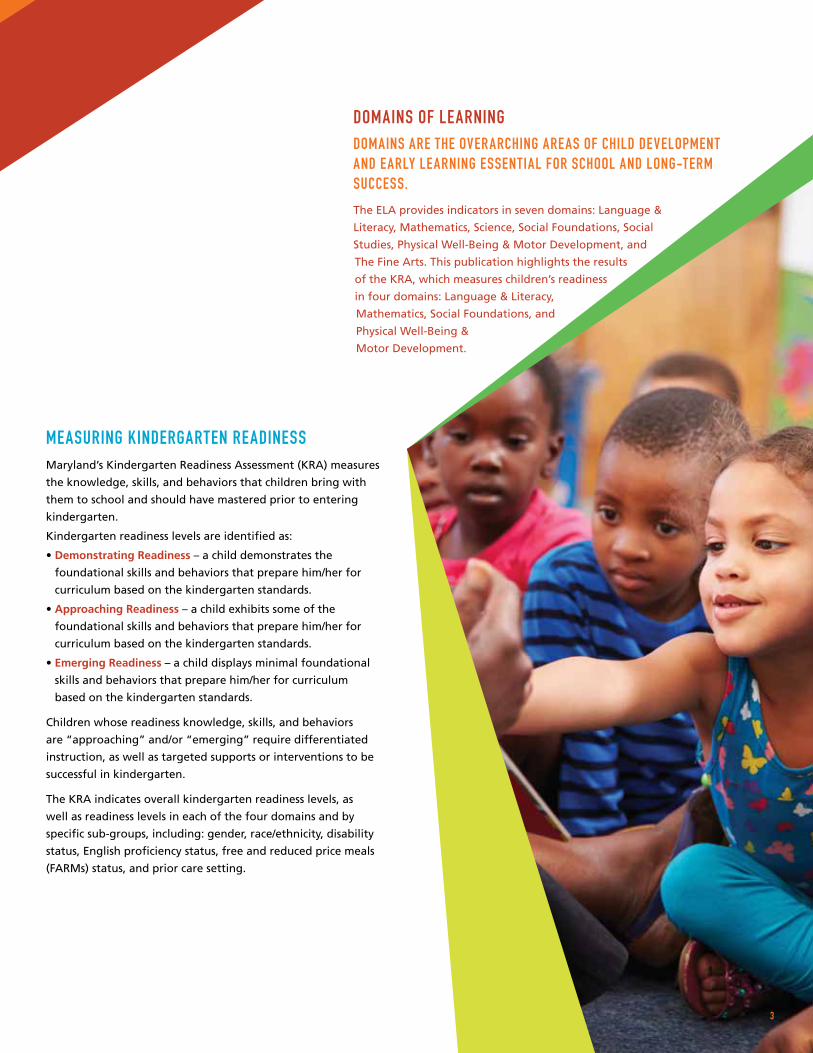
DOMAINS OF LEARNINGDOMAINS ARE THE OVERARCHING AREAS OF CHILD DEVELOPMENT AND EARLY LEARNING ESSENTIAL FOR SCHOOL AND LONG-TERM SUCCESS.
The ELA provides indicators in seven domains: Language &
Literacy, Mathematics, Science, Social Foundations, Social
Studies, Physical Well-Being & Motor Development, and
The Fine Arts. This publication highlights the results
of the KRA, which measures children’s readiness
in four domains: Language & Literacy,
Mathematics, Social Foundations, and
Physical Well-Being &
Motor Development.
3
4
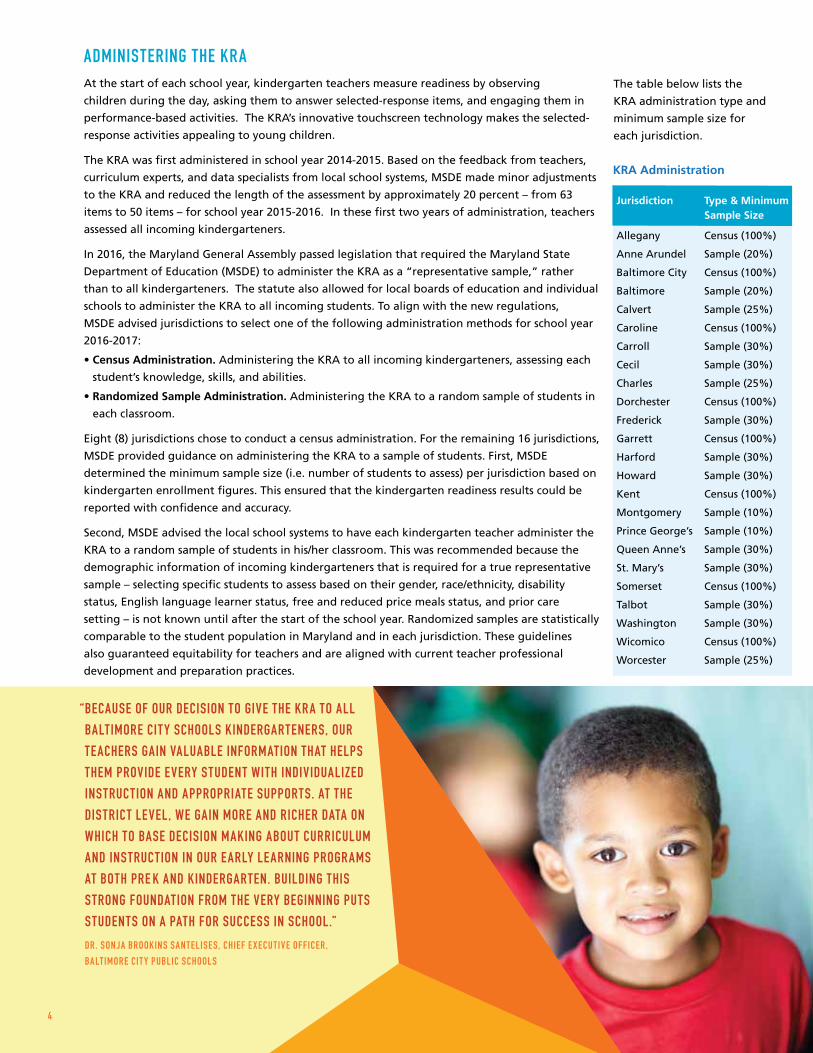
KRA Administration
ADMINISTERING THE KRAAt the start of each school year, kindergarten teachers measure readiness by observing
children during the day, asking them to answer selected-response items, and engaging them in
performance-based activities. The KRA’s innovative touchscreen technology makes the selected-
response activities appealing to young children.
The KRA was first administered in school year 2014-2015. Based on the feedback from teachers,
curriculum experts, and data specialists from local school systems, MSDE made minor adjustments
to the KRA and reduced the length of the assessment by approximately 20 percent – from 63
items to 50 items – for school year 2015-2016. In these first two years of administration, teachers
assessed all incoming kindergarteners.
In 2016, the Maryland General Assembly passed legislation that required the Maryland State
Department of Education (MSDE) to administer the KRA as a “representative sample,” rather
than to all kindergarteners. The statute also allowed for local boards of education and individual
schools to administer the KRA to all incoming students. To align with the new regulations,
MSDE advised jurisdictions to select one of the following administration methods for school year
2016-2017:
• Census Administration. Administering the KRA to all incoming kindergarteners, assessing each
student’s knowledge, skills, and abilities.
• Randomized Sample Administration. Administering the KRA to a random sample of students in
each classroom.
Eight (8) jurisdictions chose to conduct a census administration. For the remaining 16 jurisdictions,
MSDE provided guidance on administering the KRA to a sample of students. First, MSDE
determined the minimum sample size (i.e. number of students to assess) per jurisdiction based on
kindergarten enrollment figures. This ensured that the kindergarten readiness results could be
reported with confidence and accuracy.
Second, MSDE advised the local school systems to have each kindergarten teacher administer the
KRA to a random sample of students in his/her classroom. This was recommended because the
demographic information of incoming kindergarteners that is required for a true representative
sample – selecting specific students to assess based on their gender, race/ethnicity, disability
status, English language learner status, free and reduced price meals status, and prior care
setting – is not known until after the start of the school year. Randomized samples are statistically
comparable to the student population in Maryland and in each jurisdiction. These guidelines
also guaranteed equitability for teachers and are aligned with current teacher professional
development and preparation practices.
Jurisdiction Type & Minimum Sample Size
Allegany Census (100%)
Anne Arundel Sample (20%)
Baltimore City Census (100%)
Baltimore Sample (20%)
Calvert Sample (25%)
Caroline Census (100%)
Carroll Sample (30%)
Cecil Sample (30%)
Charles Sample (25%)
Dorchester Census (100%)
Frederick Sample (30%)
Garrett Census (100%)
Harford Sample (30%)
Howard Sample (30%)
Kent Census (100%)
Montgomery Sample (10%)
Prince George’s Sample (10%)
Queen Anne’s Sample (30%)
St. Mary’s Sample (30%)
Somerset Census (100%)
Talbot Sample (30%)
Washington Sample (30%)
Wicomico Census (100%)
Worcester Sample (25%)
“ BECAUSE OF OUR DECISION TO GIVE THE KRA TO ALL BALTIMORE CIT Y SCHOOLS KINDERGARTENERS, OUR TEACHERS GAIN VALUABLE INFORMATION THAT HELPS THEM PROVIDE EVERY STUDENT WITH INDIVIDUALIZED INSTRUCTION AND APPROPRIATE SUPPORTS. AT THE DISTRICT LEVEL, WE GAIN MORE AND RICHER DATA ON WHICH TO BASE DECISION MAKING ABOUT CURRICULUM AND INSTRUCTION IN OUR EARLY LEARNING PROGRAMS AT BOTH PRE K AND KINDERGARTEN. BUILDING THIS STRONG FOUNDATION FROM THE VERY BEGINNING PUTS STUDENTS ON A PATH FOR SUCCESS IN SCHOOL.”
DR. SON JA BROOKINS SANTELISES, CHIEF E XECUTIVE OFFICER,
BALT IMORE CIT Y PUBLIC SCHOOLS
The table below lists the
KRA administration type and
minimum sample size for
each jurisdiction.
KRA OFFERS CRITICAL GUIDANCEThe KRA provides vital information about the knowledge,
skills, and behaviors of children entering kindergarten
classrooms. The KRA:
Benefits Children. Assessing students at the start of
kindergarten is one way to identify the strengths and
challenges of individual children. The information obtained
enables teachers to effectively instruct each student and
provide additional supports and interventions, where needed.
Assists Teachers. The KRA gives teachers rich information
about each child’s knowledge, skills, abilities, and learning
needs. The data help teachers monitor student progress
toward the achievement of Maryland’s standards. The KRA
enables Maryland’s teachers to differentiate instruction,
provide support and practice where it is needed, address
identified learning gaps of an individual child or groups of
children, and better communicate with family members about
their children.
Informs Families. Each assessed child’s readiness for school
is described in the Kindergarten Readiness Assessment’s
Individual Student Report (ISR). Teachers can use the ISR to
INTERPRETING THE RESULTSWhile the KRA data are reported with confidence and
accuracy, and the findings are statistically comparable to the
student population in Maryland and in each jurisdiction, it is
important to use caution in interpreting the results.
First, this year’s flat readiness levels do not mean that
kindergarteners are less prepared than students from previous
years. Maryland faces many challenges in pursuing school
readiness for all kindergarteners. Among them are an ever
diversifying population, with higher numbers of students from
low income households and with language barriers.
Second, Maryland’s PreK-12 College & Career Ready
Standards are much more rigorous than in previous years and
recognize the substantive changes in the expectations for
kindergarteners. Over the last 15 years, for example, we’ve
moved from a prevailing view that incoming kindergarteners
require little in the way of cognitive knowledge and skills,
to a standard that demands that kindergarteners are
equipped with the skills required to learn to read and initiate
basic algebraic problem-solving, among others, at school entry.
The academic risk factors, coupled with the new kindergarten
standards and other challenges, contribute to the current
school readiness data. It will take time to improve these
numbers and see the benefits of Maryland’s strategic
investments in early learning. Fortunately, Maryland remains
deeply committed to making improvements so that more
children will enter school ready to succeed.
In addition, it must be reiterated that the current KRA
administration process, which assesses only a sample of
Maryland’s kindergarten (34%), limits the value and use of the
data. Local school boards – and more importantly teachers and
families – do not have an accurate academic baseline for
every child entering the public school system.
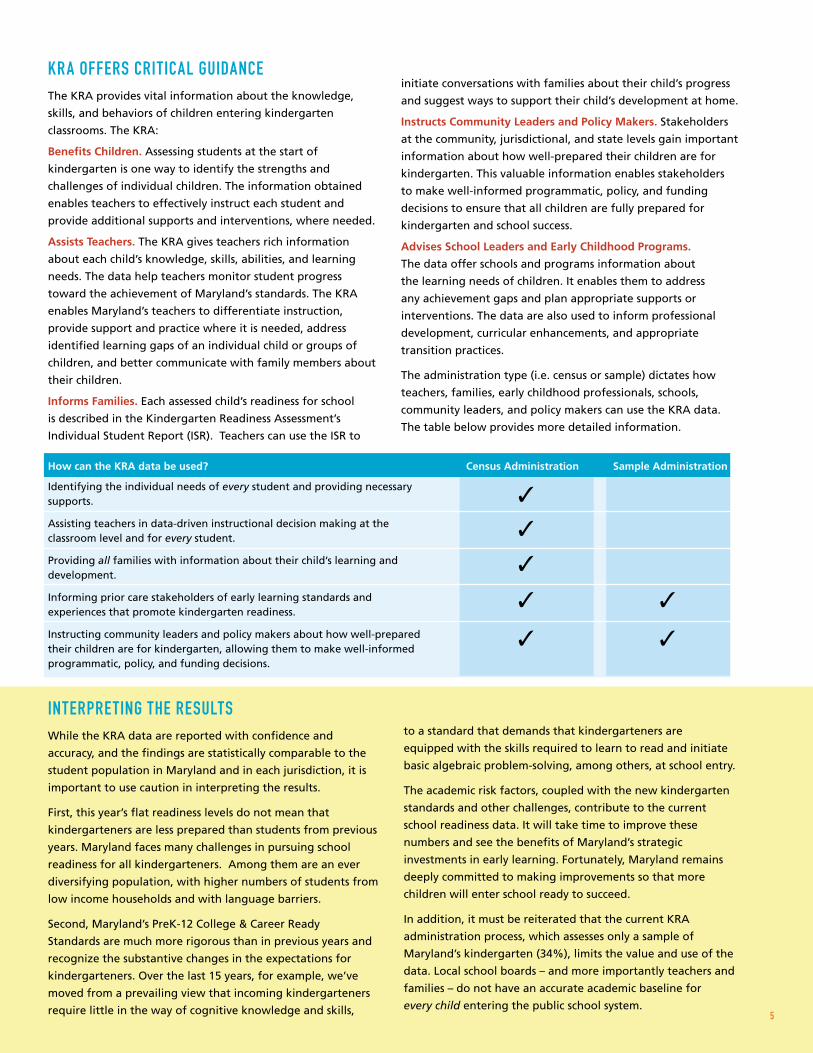
How can the KRA data be used?
Identifying the individual needs of every student and providing necessary supports.
Assisting teachers in data-driven instructional decision making at the classroom level and for every student.
Providing all families with information about their child’s learning and development.
Informing prior care stakeholders of early learning standards and experiences that promote kindergarten readiness.
Instructing community leaders and policy makers about how well-prepared their children are for kindergarten, allowing them to make well-informed programmatic, policy, and funding decisions.
✓
✓
✓
✓ ✓
✓ ✓
Census Administration Sample Administration
5
KRA Administration
initiate conversations with families about their child’s progress
and suggest ways to support their child’s development at home.
Instructs Community Leaders and Policy Makers. Stakeholders
at the community, jurisdictional, and state levels gain important
information about how well-prepared their children are for
kindergarten. This valuable information enables stakeholders
to make well-informed programmatic, policy, and funding
decisions to ensure that all children are fully prepared for
kindergarten and school success.
Advises School Leaders and Early Childhood Programs.
The data offer schools and programs information about
the learning needs of children. It enables them to address
any achievement gaps and plan appropriate supports or
interventions. The data are also used to inform professional
development, curricular enhancements, and appropriate
transition practices.
The administration type (i.e. census or sample) dictates how
teachers, families, early childhood professionals, schools,
community leaders, and policy makers can use the KRA data.
The table below provides more detailed information.
6
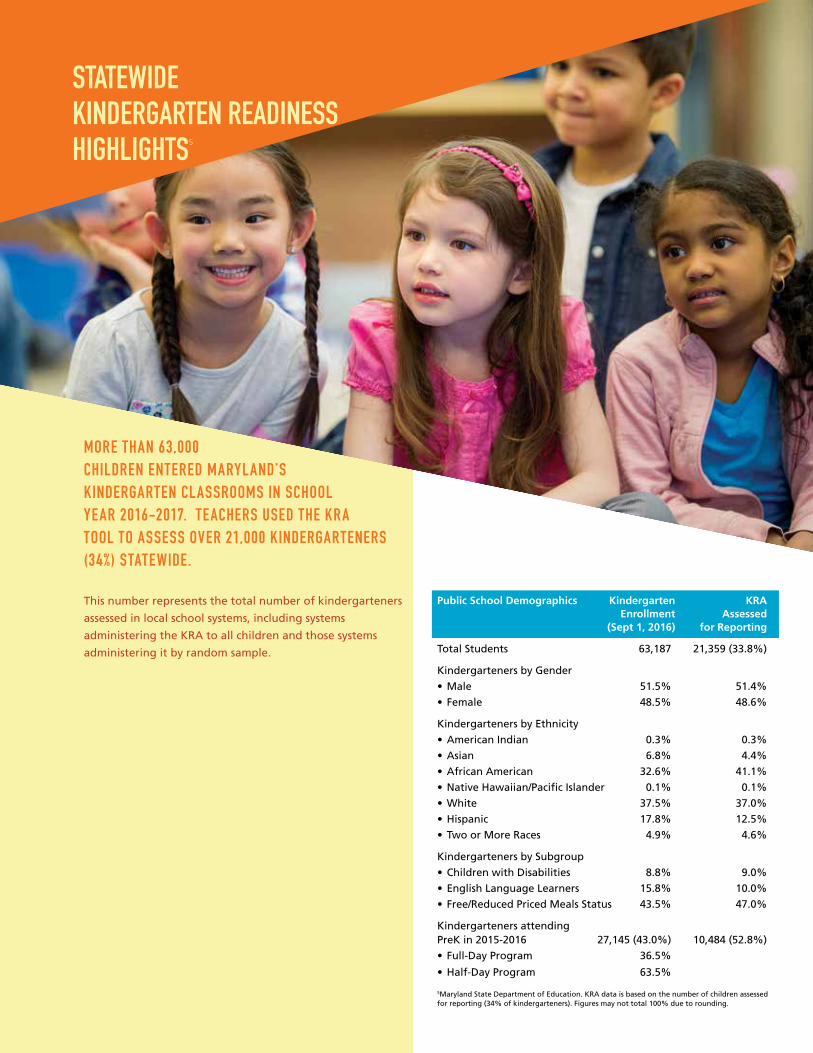
Public School Demographics Kindergarten KRA Enrollment Assessed (Sept 1, 2016) for Reporting
Total Students 63,187 21,359 (33.8%)
Kindergarteners by Gender
• Male 51.5% 51.4%
• Female 48.5% 48.6%
Kindergarteners by Ethnicity
• American Indian 0.3% 0.3%
• Asian 6.8% 4.4%
• African American 32.6% 41.1%
• Native Hawaiian/Pacific Islander 0.1% 0.1%
• White 37.5% 37.0%
• Hispanic 17.8% 12.5%
• Two or More Races 4.9% 4.6%
Kindergarteners by Subgroup
• Children with Disabilities 8.8% 9.0%
• English Language Learners 15.8% 10.0%
• Free/Reduced Priced Meals Status 43.5% 47.0%
Kindergarteners attending PreK in 2015-2016 27,145 (43.0%) 10,484 (52.8%)
• Full-Day Program 36.5%
• Half-Day Program 63.5%
5Maryland State Department of Education. KRA data is based on the number of children assessed for reporting (34% of kindergarteners). Figures may not total 100% due to rounding.
STATEWIDE KINDERGARTEN READINESS HIGHLIGHTS5
MORE THAN 63,000 CHILDREN ENTERED MARYLAND’S KINDERGARTEN CLASSROOMS IN SCHOOL YEAR 2016-2017. TEACHERS USED THE KRA TOOL TO ASSESS OVER 21,000 KINDERGARTENERS (34%) STATEWIDE.
This number represents the total number of kindergarteners
assessed in local school systems, including systems
administering the KRA to all children and those systems
administering it by random sample.
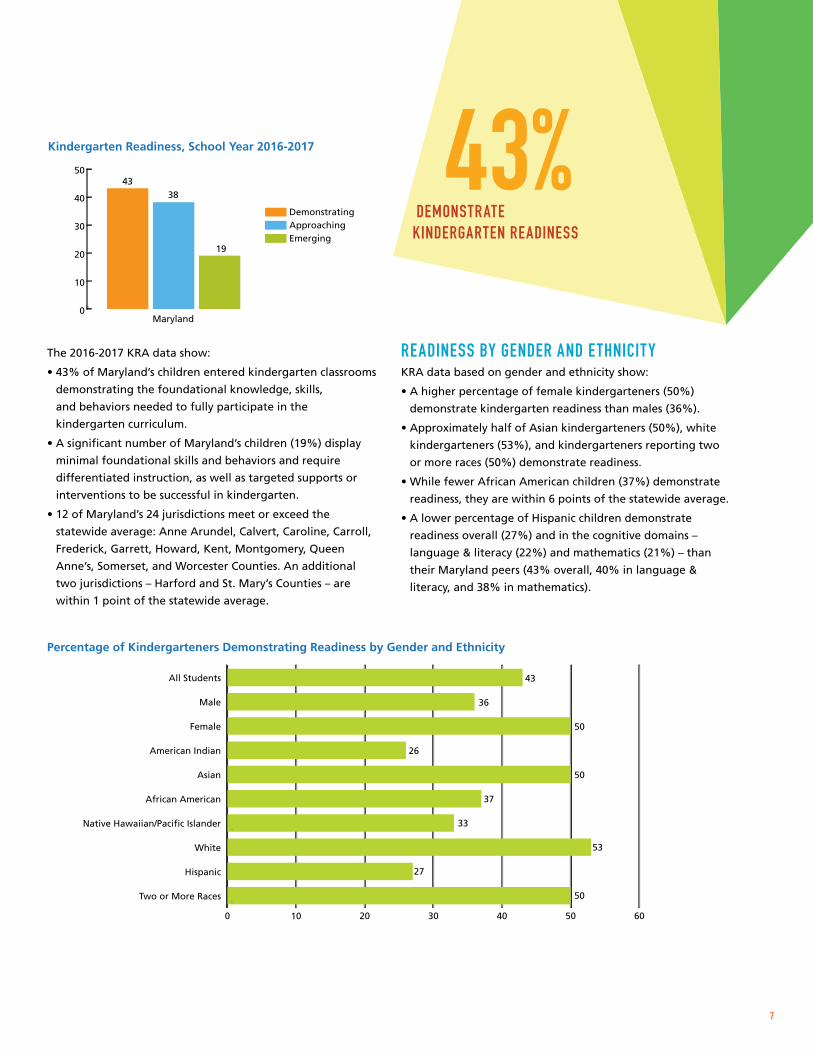
The 2016-2017 KRA data show:
• 43% of Maryland’s children entered kindergarten classrooms
demonstrating the foundational knowledge, skills,
and behaviors needed to fully participate in the
kindergarten curriculum.
• A significant number of Maryland’s children (19%) display
minimal foundational skills and behaviors and require
differentiated instruction, as well as targeted supports or
interventions to be successful in kindergarten.
• 12 of Maryland’s 24 jurisdictions meet or exceed the
statewide average: Anne Arundel, Calvert, Caroline, Carroll,
Frederick, Garrett, Howard, Kent, Montgomery, Queen
Anne’s, Somerset, and Worcester Counties. An additional
two jurisdictions – Harford and St. Mary’s Counties – are
within 1 point of the statewide average.
0 10 20 30 40 50 60
Two or More Races
Hispanic
White
Native Hawaiian/Pacific Islander
African American
Asian
American Indian
Female
Male
All Students
-
-
43
36
50
26
50
37
33
53
27
50
READINESS BY GENDER AND ETHNICITYKRA data based on gender and ethnicity show:
• A higher percentage of female kindergarteners (50%)
demonstrate kindergarten readiness than males (36%).
• Approximately half of Asian kindergarteners (50%), white
kindergarteners (53%), and kindergarteners reporting two
or more races (50%) demonstrate readiness.
• While fewer African American children (37%) demonstrate
readiness, they are within 6 points of the statewide average.
• A lower percentage of Hispanic children demonstrate
readiness overall (27%) and in the cognitive domains –
language & literacy (22%) and mathematics (21%) – than
their Maryland peers (43% overall, 40% in language &
literacy, and 38% in mathematics).
Percentage of Kindergarteners Demonstrating Readiness by Gender and Ethnicity
Kindergarten Readiness, School Year 2016-2017
43
38
19
Maryland0
10
20
30
40
50
DemonstratingApproachingEmerging
DEMONSTRATE KINDERGARTEN READINESS
7
8
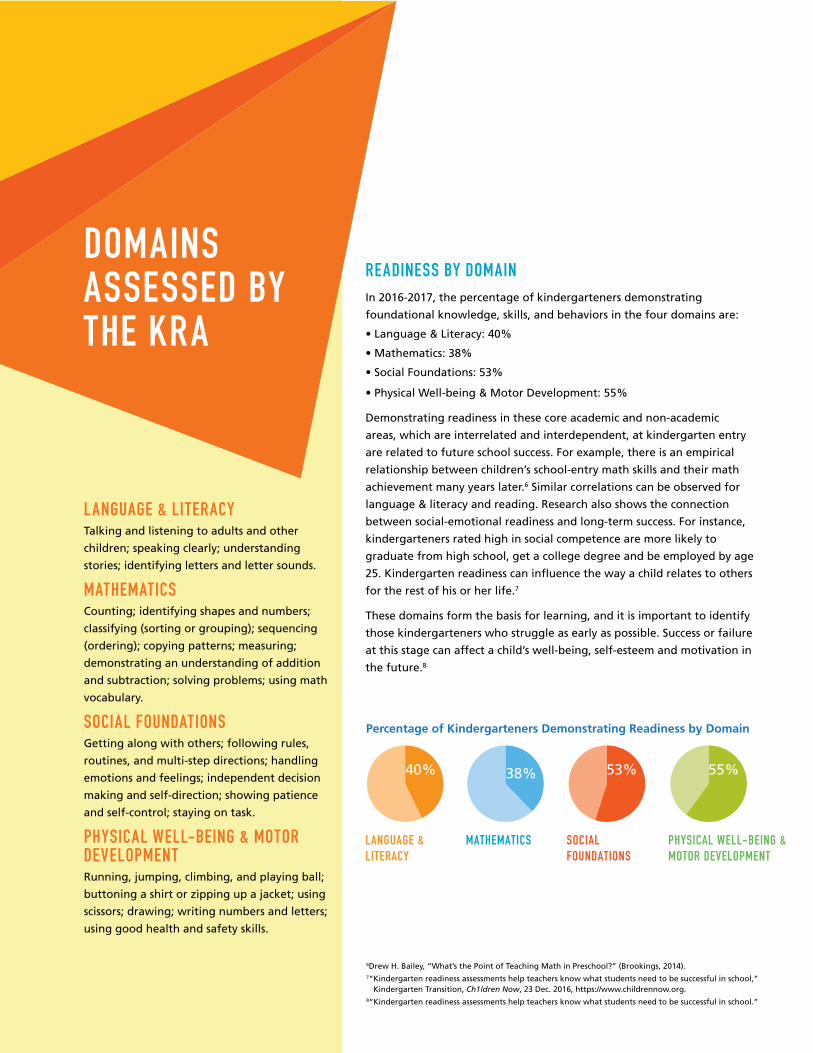
READINESS BY DOMAINIn 2016-2017, the percentage of kindergarteners demonstrating
foundational knowledge, skills, and behaviors in the four domains are:
• Language & Literacy: 40%
• Mathematics: 38%
• Social Foundations: 53%
• Physical Well-being & Motor Development: 55%
Demonstrating readiness in these core academic and non-academic
areas, which are interrelated and interdependent, at kindergarten entry
are related to future school success. For example, there is an empirical
relationship between children’s school-entry math skills and their math
achievement many years later.6 Similar correlations can be observed for
language & literacy and reading. Research also shows the connection
between social-emotional readiness and long-term success. For instance,
kindergarteners rated high in social competence are more likely to
graduate from high school, get a college degree and be employed by age
25. Kindergarten readiness can influence the way a child relates to others
for the rest of his or her life.7
These domains form the basis for learning, and it is important to identify
those kindergarteners who struggle as early as possible. Success or failure
at this stage can affect a child’s well-being, self-esteem and motivation in
the future.8
40% 38% 53% 55%
LANGUAGE & LITERACY
MATHEMATICS SOCIAL FOUNDATIONS
PHYSICAL WELL-BEING & MOTOR DEVELOPMENT
Percentage of Kindergarteners Demonstrating Readiness by Domain
LANGUAGE & LITERACYTalking and listening to adults and other
children; speaking clearly; understanding
stories; identifying letters and letter sounds.
MATHEMATICSCounting; identifying shapes and numbers;
classifying (sorting or grouping); sequencing
(ordering); copying patterns; measuring;
demonstrating an understanding of addition
and subtraction; solving problems; using math
vocabulary.
SOCIAL FOUNDATIONSGetting along with others; following rules,
routines, and multi-step directions; handling
emotions and feelings; independent decision
making and self-direction; showing patience
and self-control; staying on task.
PHYSICAL WELL-BEING & MOTOR DEVELOPMENTRunning, jumping, climbing, and playing ball;
buttoning a shirt or zipping up a jacket; using
scissors; drawing; writing numbers and letters;
using good health and safety skills.
DOMAINS ASSESSED BY THE KRA
6Drew H. Bailey, “What’s the Point of Teaching Math in Preschool?” (Brookings, 2014).7“ Kindergarten readiness assessments help teachers know what students need to be successful in school,”
Kindergarten Transition, Ch1ldren Now, 23 Dec. 2016, https://www.childrennow.org.8“Kindergarten readiness assessments help teachers know what students need to be successful in school.”
0 10 20 30 40 50 60
Children fromLow-Income Households
Children from Mid-/High-Income Households
English Language Learners
English Proficient
Children w/ Disabilities
Children w/o Disabilities 45
19
46
21
51
32
Percentage of Kindergarteners Demonstrating Readiness by Subgroup
26 PT GAP BETWEEN CHILDREN WITH DISABILITIES AND THEIR PEERS.
25 PT GAP BETWEEN ENGLISH LANGUAGE LEARNERS AND THEIR ENGLISH-PROFICIENT PEERS.
19 PT GAP BETWEEN CHILDREN IN LOW-INCOME (FARMS) HOUSEHOLDS AND THEIR NON-FARMS PEERS.
9“Early School Readiness: Indicators on Children and Youth.”
READINESS BY ACADEMIC RISK FACTORThe 2016-2017 kindergarten enrollment data indicate
substantial demographic shifts in Maryland. Schools are
grappling with the challenge of educating an increasing
number of students who come from low-income families,
receive special education services, and are learning to speak
English. In Maryland:
• 5,547 Maryland kindergarteners (9%) have a disability
and/or receive special education services through an
Individualized Education Program (IEP) – a 10% increase in
the past five years.
• 16% of Maryland’s kindergarten population (9,998 children)
are English Language Learners (ELLs); this represents a
16% five-year rise in the number of students who are not
English proficient.
• More than 27,500 kindergarteners (44%) receive Free and
Reduced Price Meals – an 11% increase since 2011-2012.
Children with these early academic risk factors, which affect as
many as one of every three Maryland kindergarteners, exhibit
lower levels of school readiness. Poverty has been shown to
be particularly detrimental to children’s educational and other
life course outcomes. Young pre-kindergarten children from
low-income households are much less likely to have cognitive
and early literacy readiness skills than are children living
above the poverty threshold.9 The resulting achievement
gaps are likely to continue throughout K-12 education
without high-quality instructional supports.
The 2016-2017 data reveal:
• Readiness by Disability Status. Nineteen percent (19%) of
kindergarteners receiving special education services through
an Individualized Education Program (IEP) demonstrate
readiness, compared with 45% of kindergarteners who do
not have an IEP – a 26-point achievement gap.
• Readiness by Language Status. Among ELLs, 21%
demonstrate the foundational skills and behaviors that
are essential for kindergarten success, compared with 46%
of English proficient kindergarteners. This represents a
25-point achievement gap between ELLs and their English
proficient peers.
• Readiness by Free and Reduced Priced Meals Status.
A 19-point achievement gap exists along income lines:
32% of children from low-income households (as indicated
by FARMs status) demonstrate kindergarten readiness,
compared with 51% of children from mid- to high-income
households.
9
6Drew H. Bailey, “What’s the Point of Teaching Math in Preschool?” (Brookings, 2014).7“ Kindergarten readiness assessments help teachers know what students need to be successful in school,”
Kindergarten Transition, Ch1ldren Now, 23 Dec. 2016, https://www.childrennow.org.8“Kindergarten readiness assessments help teachers know what students need to be successful in school.”
10
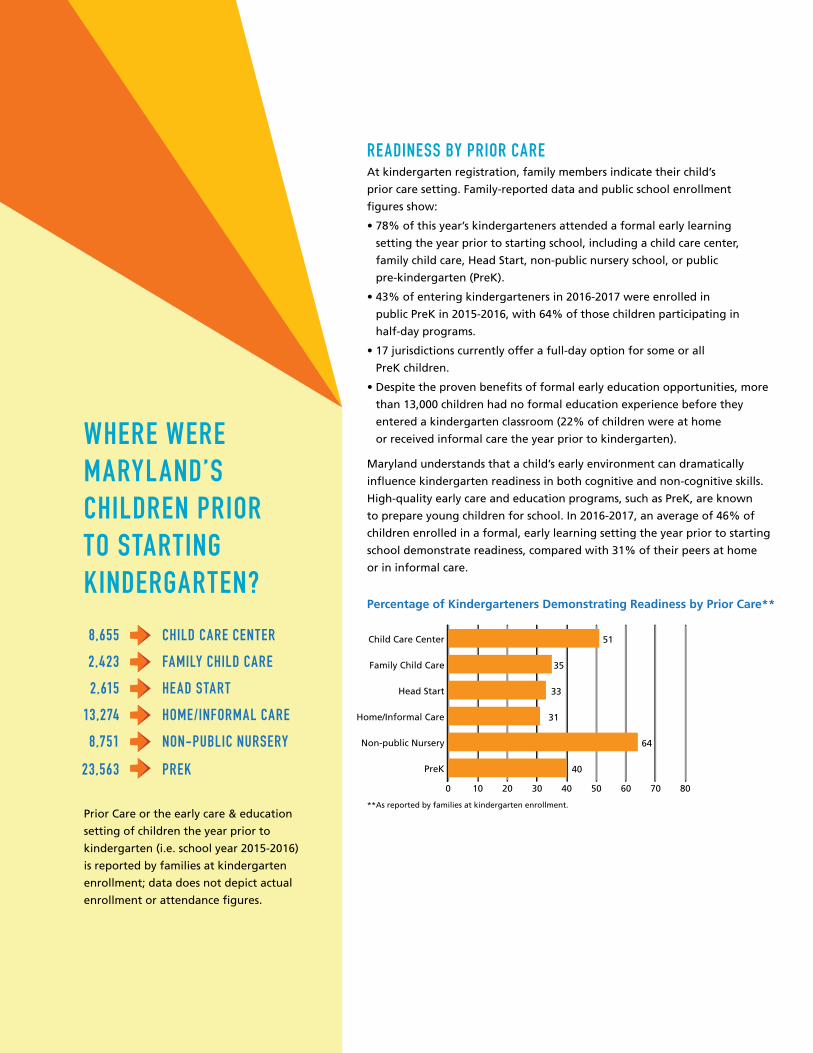
READINESS BY PRIOR CAREAt kindergarten registration, family members indicate their child’s
prior care setting. Family-reported data and public school enrollment
figures show:
• 78% of this year’s kindergarteners attended a formal early learning
setting the year prior to starting school, including a child care center,
family child care, Head Start, non-public nursery school, or public
pre-kindergarten (PreK).
• 43% of entering kindergarteners in 2016-2017 were enrolled in
public PreK in 2015-2016, with 64% of those children participating in
half-day programs.
• 17 jurisdictions currently offer a full-day option for some or all
PreK children.
• Despite the proven benefits of formal early education opportunities, more
than 13,000 children had no formal education experience before they
entered a kindergarten classroom (22% of children were at home
or received informal care the year prior to kindergarten).
Maryland understands that a child’s early environment can dramatically
influence kindergarten readiness in both cognitive and non-cognitive skills.
High-quality early care and education programs, such as PreK, are known
to prepare young children for school. In 2016-2017, an average of 46% of
children enrolled in a formal, early learning setting the year prior to starting
school demonstrate readiness, compared with 31% of their peers at home
or in informal care.
Percentage of Kindergarteners Demonstrating Readiness by Prior Care**
WHERE WERE MARYLAND’S CHILDREN PRIOR TO STARTING KINDERGARTEN?
8,655 CHILD CARE CENTER
2,423 FAMILY CHILD CARE
2,615 HEAD START
13,274 HOME/INFORMAL CARE
8,751 NON-PUBLIC NURSERY
23,563 PREK0 10 20 30 40 50 60 70 80
PreK
Non-public Nursery
Home/Informal Care
Head Start
Family Child Care
Child Care Center 51
35
33
31
64
40
**As reported by families at kindergarten enrollment.Prior Care or the early care & education
setting of children the year prior to
kindergarten (i.e. school year 2015-2016)
is reported by families at kindergarten
enrollment; data does not depict actual
enrollment or attendance figures.
PREK: A POWERFUL PREDICTORThere is strong evidence that young children who participate in PreK
programs enter kindergarten with higher levels of readiness than their
peers from similar backgrounds. In fact, participation in PreK is a more
powerful predictor of children’s pre-reading and pre-writing scores than
demographic variables.10 KRA data confirm:
• 40% of children enrolled in public PreK programs the year prior to
starting school demonstrate the foundational skills and behaviors
essential for kindergarten success and are within 3 points of the statewide
average.
• Children who attended public PreK programs are better prepared for
school than those in home or informal care the year prior to starting
kindergarten (40% demonstrate readiness, compared with 31%).
• 6 of the 12 jurisdictions exceeding the statewide readiness levels serve a
majority (over 50%) of their 4-year-old population through public PreK
programs.
Because public PreK programs serve a high percentage of children with
academic risk factors, these data are significant for addressing the
achievement gaps. For example, children enrolled in public PreK
programs the year before kindergarten – the majority of whom are
from low-income households – outperform their peers at the same
income level (40% demonstrate the foundational knowledge, skills
and behaviors, compared with 32% of kindergarteners from
low-income households).
READINESS BY JURISDICTIONThe following pages highlight kindergarten readiness results
for each of Maryland’s 24 jurisdictions. Eight (8) jurisdictions
chose to conduct a census administration (assessing all
kindergarten students), and the remaining 16 jurisdictions
used a sample administration method (assessing a
random sample of kindergarten students in each
classroom). The administration type (i.e. census or
sample) dictates how teachers, families, the early
childhood professionals, schools, community
leaders, and policy makers
can use the KRA data.
10Chrisanne Gayle, “The Research on Pre-K,” (The Center for Public Education, 2008).
ADDITIONAL KRA DATA, INCLUDING CUSTOMIZED STATEWIDE AND JURISDICTIONAL ISSUE BRIEFS AND POWERPOINT PRESENTATIONS ARE AVAILABLE AT WWW.READYATFIVE.ORG.
11
Percentage of Kindergarteners Demonstrating Readiness by Prior Care**
**As reported by families at kindergarten enrollment.

45% DEMONSTRATE
KINDERGARTEN READINESS
100% KINDERGARTENERS ASSESSED
12
Readiness by Academic Risk Factor
Readiness by Prior Care**
Public School Demographics
Readiness by Domain
Overall Readiness
0 10 20 30 40 50 60 70 80
PreK
Non-public Nursery
Home/Informal Care
Head Start
Family Child Care
Child Care Center 39
63
26
13
64
41
0 10 20 30 40 50 60
Children from Low-Income Households
Children from Mid-/High-Income Households
English Language Learners
English Proficient
Children w/ Disabilities
Children w/o Disabilities 40
14
38
53
29
*
Kindergarten Enrollment (Sept 1, 2016)
Total Students 629
• KRA Assessed 100.0%
Kindergarteners Ethnicity
• American Indian 0.0%
• Asian 1.1%
• African American 2.9%
• Native Hawaiian/Pacific Islander 0.0%
• White 87.6%
• Hispanic 1.1%
• Two or More Races 7.3%
Kindergarteners by Subgroup
• Children with Disabilities 9.1%
• English Language Learners 0.0%
• Free and Reduced Priced Meals Status 63.6%
Kindergarteners Attending PreK in 2015-2016 432 (68.7%)
• Full-Day Program 0.0%
• Half-Day Program 100.0%
Source: Maryland State Department of Education.
Totals may not equal 100% due to rounding.
Children from low-income households, those learning the English language
(ELLs), or those who have a disability exhibit lower levels of school readiness and
achievement gaps exist.
Percentage of Kindergarteners Demonstrating Readiness by Subgroup
41% of the County’s children attending public PreK programs the year prior to starting
school demonstrate kindergarten readiness and exceed the countywide average.
Percentage of Kindergarteners Demonstrating Readiness by Prior Care
38% of the County’s children entered kindergarten classrooms demonstrating the knowledge, skills, and behaviors needed to fully participate in the kindergarten curriculum – within 5 points of the statewide average.
Kindergarten Readiness, School Year 2016-2017
4338
19
38 39
23
Maryland Allegany County0
10
20
30
40
50
DemonstratingApproachingEmerging
26 PT ACHIEVEMENT GAP
24 PT ACHIEVEMENT GAP
34% 33% 57% 47%
Language & Literacy
Mathematics Social Foundations
Physical Well-being & Motor Development
Percentage of Kindergarteners Demonstrating Readiness by Domain
* Fewer than 5 students assessed.
**As reported by families at kindergarten enrollment.
ALLEGANY COUNTY
38% DEMONSTRATE
KINDERGARTEN READINESS
ANNE ARUNDEL COUNTY
45% DEMONSTRATE
KINDERGARTEN READINESS
0 10 20 30 40 50 60
PreK
Non-public Nursery
Home/Informal Care
Head Start
Family Child Care
Child Care Center 54
34
*
38
59
45
0 10 20 30 40 50 60
Children fromLow-Income Households
Children from Mid-/High-Income Households
English Language Learners
English Proficient
Children w/ Disabilities
Children w/o Disabilities 47
18
48
20
51
33
Kindergarten Enrollment (Sept 1, 2016)
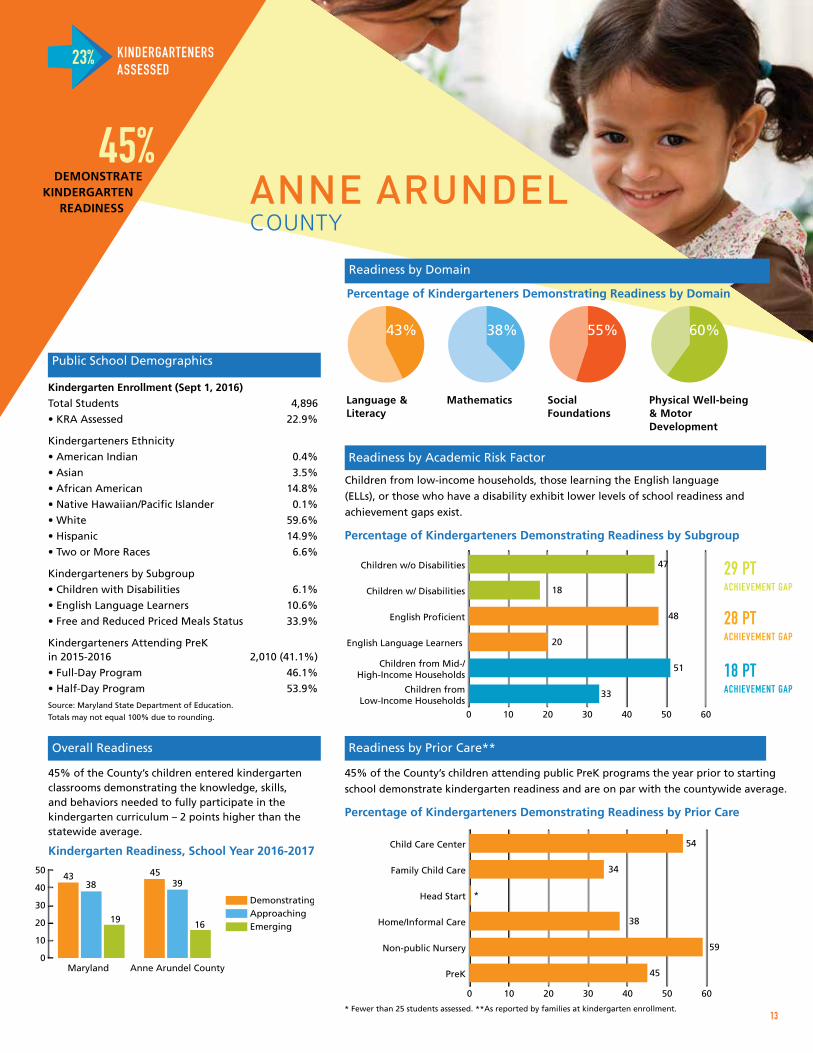
Total Students 4,896
• KRA Assessed 22.9%
Kindergarteners Ethnicity
• American Indian 0.4%
• Asian 3.5%
• African American 14.8%
• Native Hawaiian/Pacific Islander 0.1%
• White 59.6%
• Hispanic 14.9%
• Two or More Races 6.6%
Kindergarteners by Subgroup
• Children with Disabilities 6.1%
• English Language Learners 10.6%
• Free and Reduced Priced Meals Status 33.9%
Kindergarteners Attending PreK in 2015-2016 2,010 (41.1%)
• Full-Day Program 46.1%
• Half-Day Program 53.9%
Source: Maryland State Department of Education.
Totals may not equal 100% due to rounding.
Children from low-income households, those learning the English language
(ELLs), or those who have a disability exhibit lower levels of school readiness and
achievement gaps exist.
Percentage of Kindergarteners Demonstrating Readiness by Subgroup
45% of the County’s children attending public PreK programs the year prior to starting
school demonstrate kindergarten readiness and are on par with the countywide average.
Percentage of Kindergarteners Demonstrating Readiness by Prior Care
45% of the County’s children entered kindergarten classrooms demonstrating the knowledge, skills, and behaviors needed to fully participate in the kindergarten curriculum – 2 points higher than the statewide average.
Kindergarten Readiness, School Year 2016-2017
4338
19
4539
16
Maryland Anne Arundel County0
10
20
30
40
50
DemonstratingApproachingEmerging
29 PT ACHIEVEMENT GAP
28 PT ACHIEVEMENT GAP
18 PT ACHIEVEMENT GAP
43% 38% 55% 60%
Language & Literacy
Mathematics Social Foundations
Physical Well-being & Motor Development
Percentage of Kindergarteners Demonstrating Readiness by Domain
* Fewer than 25 students assessed. **As reported by families at kindergarten enrollment.
KINDERGARTENERS ASSESSED
KINDERGARTENERS ASSESSED
23%
13
Readiness by Academic Risk Factor
Readiness by Prior Care**
Public School Demographics
Readiness by Domain
Overall Readiness
Readiness by Academic Risk Factor
Readiness by Prior Care**
26 PT ACHIEVEMENT GAP
24 PT ACHIEVEMENT GAP
38% DEMONSTRATE
KINDERGARTEN READINESS
41% DEMONSTRATE
KINDERGARTEN READINESS
100% KINDERGARTENERS ASSESSED
14
0 10 20 30 40 50
PreK
Non-public Nursery
Home/Informal Care
Head Start
Family Child Care
Child Care Center 44
25
31
17
49
42
0 5 10 15 20 25 30 35 40
Children fromLow-Income Households
Children from Mid-/High-Income Households
English Language Learners
English Proficient
Children w/ Disabilities
Children w/o Disabilities 40
14
39
22
39
38
Kindergarten Enrollment (Sept 1, 2016)
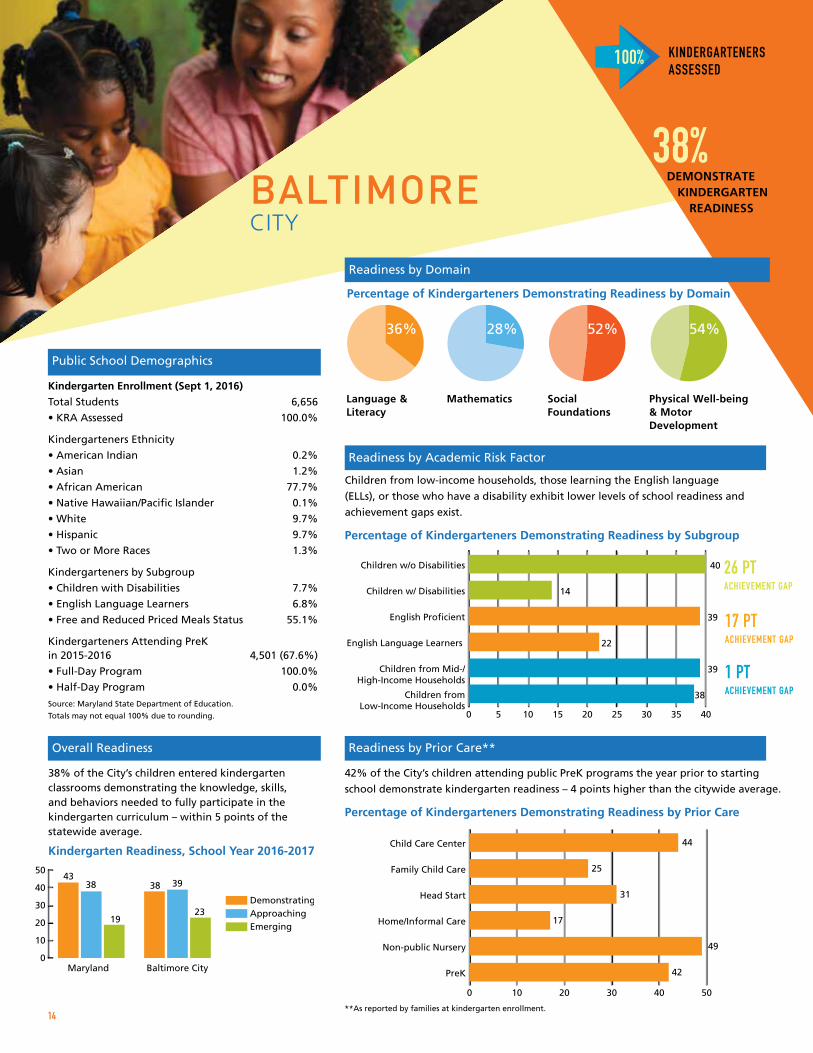
Total Students 6,656
• KRA Assessed 100.0%
Kindergarteners Ethnicity
• American Indian 0.2%
• Asian 1.2%
• African American 77.7%
• Native Hawaiian/Pacific Islander 0.1%
• White 9.7%
• Hispanic 9.7%
• Two or More Races 1.3%
Kindergarteners by Subgroup
• Children with Disabilities 7.7%
• English Language Learners 6.8%
• Free and Reduced Priced Meals Status 55.1%
Kindergarteners Attending PreK in 2015-2016 4,501 (67.6%)
• Full-Day Program 100.0%
• Half-Day Program 0.0%
Source: Maryland State Department of Education.
Totals may not equal 100% due to rounding.
Children from low-income households, those learning the English language
(ELLs), or those who have a disability exhibit lower levels of school readiness and
achievement gaps exist.
Percentage of Kindergarteners Demonstrating Readiness by Subgroup
42% of the City’s children attending public PreK programs the year prior to starting
school demonstrate kindergarten readiness – 4 points higher than the citywide average.
Percentage of Kindergarteners Demonstrating Readiness by Prior Care
38% of the City’s children entered kindergarten classrooms demonstrating the knowledge, skills, and behaviors needed to fully participate in the kindergarten curriculum – within 5 points of the statewide average.
Kindergarten Readiness, School Year 2016-2017
4338
19
38 39
23
Maryland Baltimore City0
10
20
30
40
50
DemonstratingApproachingEmerging
26 PT ACHIEVEMENT GAP
17 PT ACHIEVEMENT GAP
1 PT ACHIEVEMENT GAP
36% 28% 52% 54%
Language & Literacy
Mathematics Social Foundations
Physical Well-being & Motor Development
Percentage of Kindergarteners Demonstrating Readiness by Domain
**As reported by families at kindergarten enrollment.
BALTIMORE CITY
38% DEMONSTRATE
KINDERGARTEN READINESS
Readiness by Academic Risk Factor
Readiness by Prior Care**
Public School Demographics
Readiness by Domain
Overall Readiness
BALTIMORE COUNTY
41% DEMONSTRATE
KINDERGARTEN READINESS
0 10 20 30 40 50 60 70 80
PreK
Non-public Nursery
Home/Informal Care
Head Start
Family Child Care
Child Care Center 48
25
23
28
69
35
0 10 20 30 40 50
Children fromLow-Income Households
Children from Mid-/High-Income Households
English Language Learners
English Proficient
Children w/ Disabilities
Children w/o Disabilities 44
17
44
9
50
29
Kindergarten Enrollment (Sept 1, 2016)
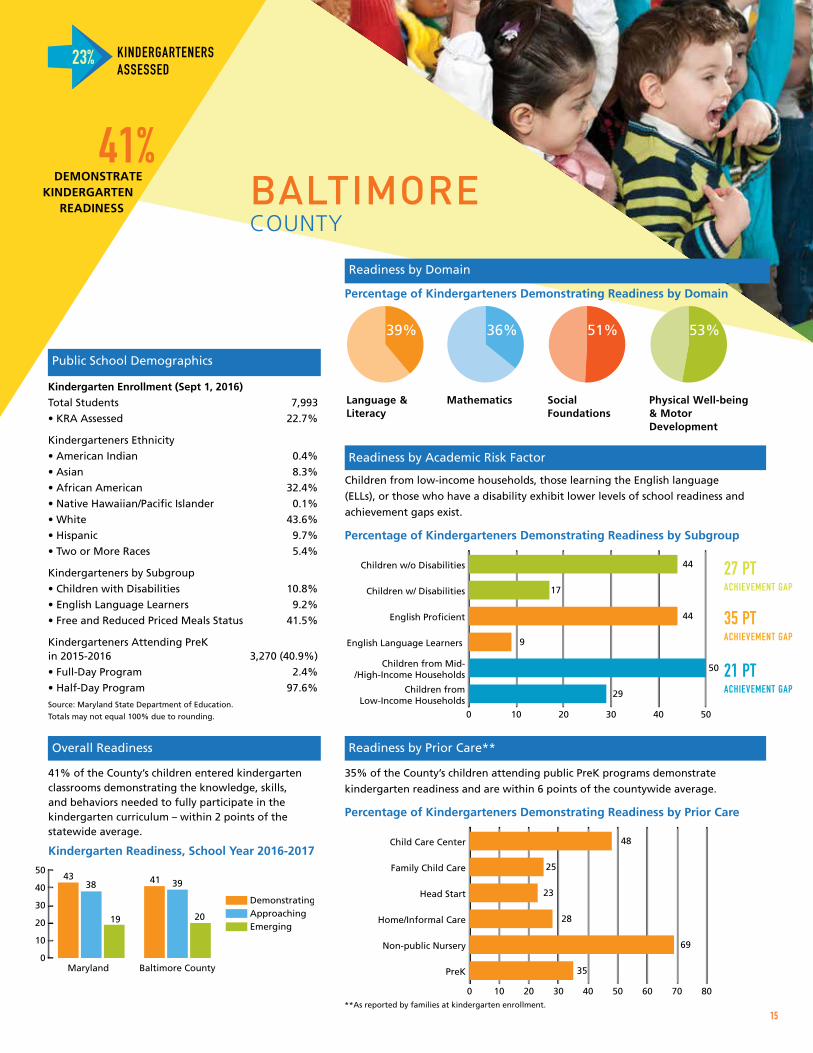
Total Students 7,993
• KRA Assessed 22.7%
Kindergarteners Ethnicity
• American Indian 0.4%
• Asian 8.3%
• African American 32.4%
• Native Hawaiian/Pacific Islander 0.1%
• White 43.6%
• Hispanic 9.7%
• Two or More Races 5.4%
Kindergarteners by Subgroup
• Children with Disabilities 10.8%
• English Language Learners 9.2%
• Free and Reduced Priced Meals Status 41.5%
Kindergarteners Attending PreK in 2015-2016 3,270 (40.9%)
• Full-Day Program 2.4%
• Half-Day Program 97.6%
Source: Maryland State Department of Education.
Totals may not equal 100% due to rounding.
Children from low-income households, those learning the English language
(ELLs), or those who have a disability exhibit lower levels of school readiness and
achievement gaps exist.
Percentage of Kindergarteners Demonstrating Readiness by Subgroup
35% of the County’s children attending public PreK programs demonstrate
kindergarten readiness and are within 6 points of the countywide average.
Percentage of Kindergarteners Demonstrating Readiness by Prior Care
41% of the County’s children entered kindergarten classrooms demonstrating the knowledge, skills, and behaviors needed to fully participate in the kindergarten curriculum – within 2 points of the statewide average.
Kindergarten Readiness, School Year 2016-2017
4338
19
41 39
20
Maryland Baltimore County0
10
20
30
40
50
DemonstratingApproachingEmerging
27 PT ACHIEVEMENT GAP
35 PT ACHIEVEMENT GAP
21 PT ACHIEVEMENT GAP
39% 36% 51% 53%
Language & Literacy
Mathematics Social Foundations
Physical Well-being & Motor Development
Percentage of Kindergarteners Demonstrating Readiness by Domain
**As reported by families at kindergarten enrollment.
KINDERGARTENERS ASSESSED
KINDERGARTENERS ASSESSED
23%
15
Readiness by Academic Risk Factor
Readiness by Prior Care**
Public School Demographics
Readiness by Domain
Overall Readiness
26 PT ACHIEVEMENT GAP
17 PT ACHIEVEMENT GAP
1 PT ACHIEVEMENT GAP
38% DEMONSTRATE
KINDERGARTEN READINESS
Readiness by Academic Risk Factor
Readiness by Prior Care**

48% DEMONSTRATE
KINDERGARTEN READINESS
27% KINDERGARTENERS ASSESSED
16
CALVERTCOUNTY 50%
DEMONSTRATE KINDERGARTEN
READINESS
0 10 20 30 40 50 60 70 80
PreK
Non-public Nursery
Home/Informal Care
Head Start
Family Child Care
Child Care Center 54
31
40
61
54
*
0 10 20 30 40 50 60
Children fromLow-Income Households
Children from Mid-/High-Income Households
English Language Learners
English Proficient
Children w/ Disabilities
Children w/o Disabilities 51
35
50
*
54
39
Kindergarten Enrollment (Sept 1, 2016)
Total Students 1,081
• KRA Assessed 26.8%
Kindergarteners Ethnicity
• American Indian 0.6%
• Asian 0.6%
• African American 12.9%
• Native Hawaiian/Pacific Islander 0.0%
• White 72.1%
• Hispanic 3.8%
• Two or More Races 10.0%
Kindergarteners by Subgroup
• Children with Disabilities 9.7%
• English Language Learners 1.0%
• Free and Reduced Priced Meals Status 26.5%
Kindergarteners Attending PreK in 2015-2016 360 (33.3%)
• Full-Day Program 0.0%
• Half-Day Program 100.0%
Source: Maryland State Department of Education.
Totals may not equal 100% due to rounding.
Children from low-income households, those learning the English language
(ELLs), or those who have a disability exhibit lower levels of school readiness and
achievement gaps exist.
Percentage of Kindergarteners Demonstrating Readiness by Subgroup
54% of the County’s children attending public PreK programs demonstrate
kindergarten readiness and exceed the countywide average.
Percentage of Kindergarteners Demonstrating Readiness by Prior Care
50% of the County’s children entered kindergarten classrooms demonstrating the skills, knowledge and behaviors needed to fully participate in the kindergarten curriculum – 7 points higher than the statewide average.
Kindergarten Readiness, School Year 2016-2017
4338
19
50
39
11
Maryland Calvert County0
10
20
30
40
50
DemonstratingApproachingEmerging
48% 46% 57% 57%
Language & Literacy
Mathematics Social Foundations
Physical Well-being & Motor Development
Percentage of Kindergarteners Demonstrating Readiness by Domain
* Fewer than 25 students assessed. ** As reported by families at kindergarten enrollment.
* Fewer than 25 students assessed.
16 PT ACHIEVEMENT GAP
15 PT ACHIEVEMENT GAP
Readiness by Academic Risk Factor
Readiness by Prior Care**
Public School Demographics
Readiness by Domain
Overall Readiness
0 20 40 60 80 100
PreK
Non-public Nursery
Home/Informal Care
Head Start
Family Child Care
Child Care Center 81
58
20
25
65
46
0 10 20 30 40 50 60 70 80
Children from Low-Income Households
Children from Mid-/High-Income Households
English Language Learners
English Proficient
Children w/ Disabilities
Children w/o Disabilities 52
15
51
33
63
39
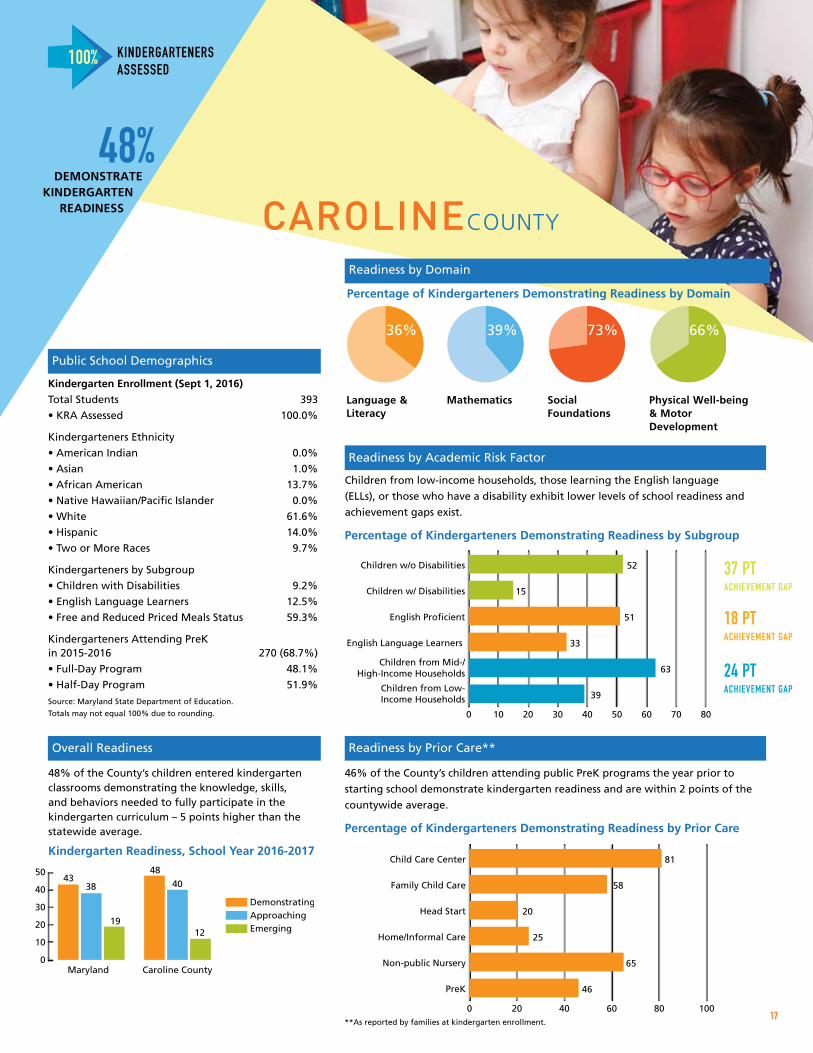
Kindergarten Enrollment (Sept 1, 2016)
Total Students 393
• KRA Assessed 100.0%
Kindergarteners Ethnicity
• American Indian 0.0%
• Asian 1.0%
• African American 13.7%
• Native Hawaiian/Pacific Islander 0.0%
• White 61.6%
• Hispanic 14.0%
• Two or More Races 9.7%
Kindergarteners by Subgroup
• Children with Disabilities 9.2%
• English Language Learners 12.5%
• Free and Reduced Priced Meals Status 59.3%
Kindergarteners Attending PreK in 2015-2016 270 (68.7%)
• Full-Day Program 48.1%
• Half-Day Program 51.9%
Source: Maryland State Department of Education.
Totals may not equal 100% due to rounding.
CAROLINECOUNTY
Children from low-income households, those learning the English language
(ELLs), or those who have a disability exhibit lower levels of school readiness and
achievement gaps exist.
Percentage of Kindergarteners Demonstrating Readiness by Subgroup
46% of the County’s children attending public PreK programs the year prior to
starting school demonstrate kindergarten readiness and are within 2 points of the
countywide average.
Percentage of Kindergarteners Demonstrating Readiness by Prior Care
48% of the County’s children entered kindergarten classrooms demonstrating the knowledge, skills, and behaviors needed to fully participate in the kindergarten curriculum – 5 points higher than the statewide average.
Kindergarten Readiness, School Year 2016-2017
4338
19
48
40
12
Maryland Caroline County0
10
20
30
40
50
DemonstratingApproachingEmerging
37 PT ACHIEVEMENT GAP
18 PT ACHIEVEMENT GAP
24 PT ACHIEVEMENT GAP
36% 39% 73% 66%
Language & Literacy
Mathematics Social Foundations
Physical Well-being & Motor Development
Percentage of Kindergarteners Demonstrating Readiness by Domain
**As reported by families at kindergarten enrollment.
48% DEMONSTRATE
KINDERGARTEN READINESS
KINDERGARTENERS ASSESSED
KINDERGARTENERS ASSESSED
100%
17
Readiness by Academic Risk Factor
Readiness by Prior Care**
Public School Demographics
Readiness by Domain
Overall Readiness
DEMONSTRATE KINDERGARTEN
READINESS
16 PT ACHIEVEMENT GAP
15 PT ACHIEVEMENT GAP
Readiness by Academic Risk Factor
Readiness by Prior Care**
35% DEMONSTRATE
KINDERGARTEN READINESS
37% KINDERGARTENERS ASSESSED
180 10 20 30 40 50 60 70 80
PreK
Non-public Nursery
Home/Informal Care
Head Start
Family Child Care
Child Care Center 55
*
*
35
67
38
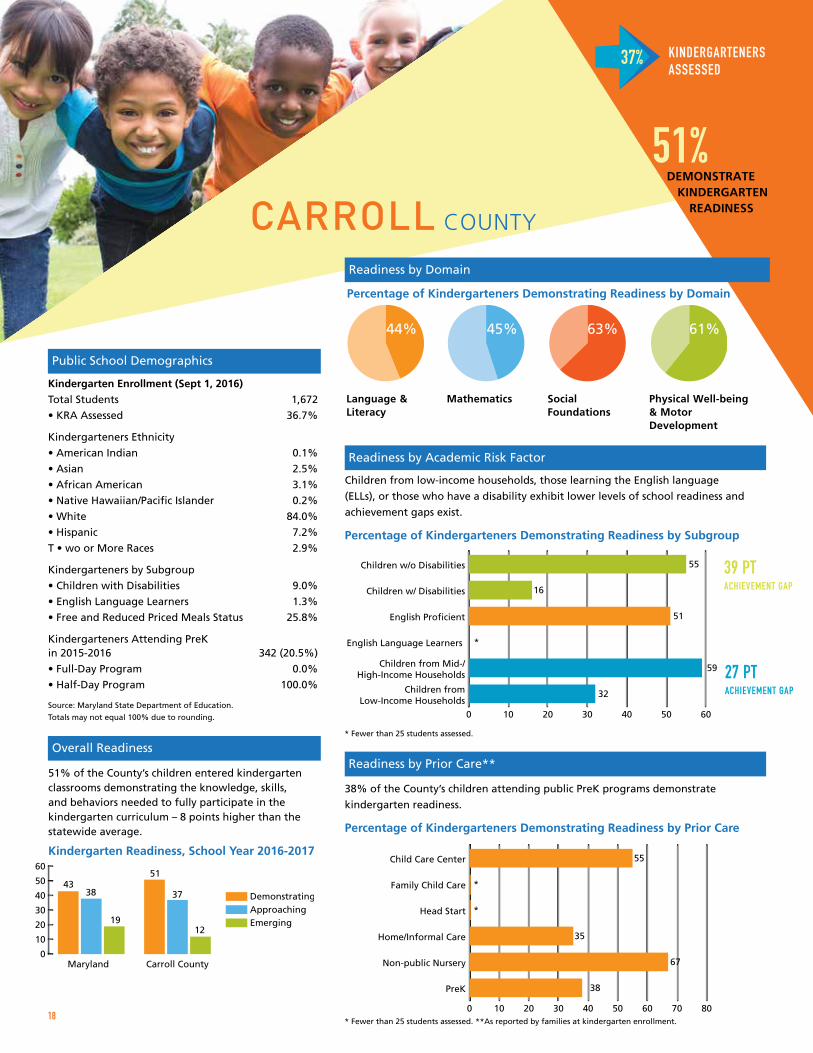
Kindergarten Enrollment (Sept 1, 2016)
Total Students 1,672
• KRA Assessed 36.7%
Kindergarteners Ethnicity
• American Indian 0.1%
• Asian 2.5%
• African American 3.1%
• Native Hawaiian/Pacific Islander 0.2%
• White 84.0%
• Hispanic 7.2%
T • wo or More Races 2.9%
Kindergarteners by Subgroup
• Children with Disabilities 9.0%
• English Language Learners 1.3%
• Free and Reduced Priced Meals Status 25.8%
Kindergarteners Attending PreK in 2015-2016 342 (20.5%)
• Full-Day Program 0.0%
• Half-Day Program 100.0%
Source: Maryland State Department of Education.
Totals may not equal 100% due to rounding.
CARROLL COUNTY
38% of the County’s children attending public PreK programs demonstrate
kindergarten readiness.
Percentage of Kindergarteners Demonstrating Readiness by Prior Care
51% of the County’s children entered kindergarten classrooms demonstrating the knowledge, skills, and behaviors needed to fully participate in the kindergarten curriculum – 8 points higher than the statewide average.
Kindergarten Readiness, School Year 2016-2017
4338
19
51
37
12
Maryland Carroll County0
10
20
30
40
50
60
DemonstratingApproachingEmerging
0 10 20 30 40 50 60
Children fromLow-Income Households
Children from Mid-/High-Income Households
English Language Learners
English Proficient
Children w/ Disabilities
Children w/o Disabilities 55
16
51
*
59
32
Children from low-income households, those learning the English language
(ELLs), or those who have a disability exhibit lower levels of school readiness and
achievement gaps exist.
Percentage of Kindergarteners Demonstrating Readiness by Subgroup
44% 45% 63% 61%
Language & Literacy
Mathematics Social Foundations
Physical Well-being & Motor Development
Percentage of Kindergarteners Demonstrating Readiness by Domain
* Fewer than 25 students assessed.
* Fewer than 25 students assessed. **As reported by families at kindergarten enrollment.
51% DEMONSTRATE
KINDERGARTEN READINESS
39 PT ACHIEVEMENT GAP
27 PT ACHIEVEMENT GAP
Readiness by Academic Risk Factor
Readiness by Prior Care**
Public School Demographics
Readiness by Domain
Overall Readiness
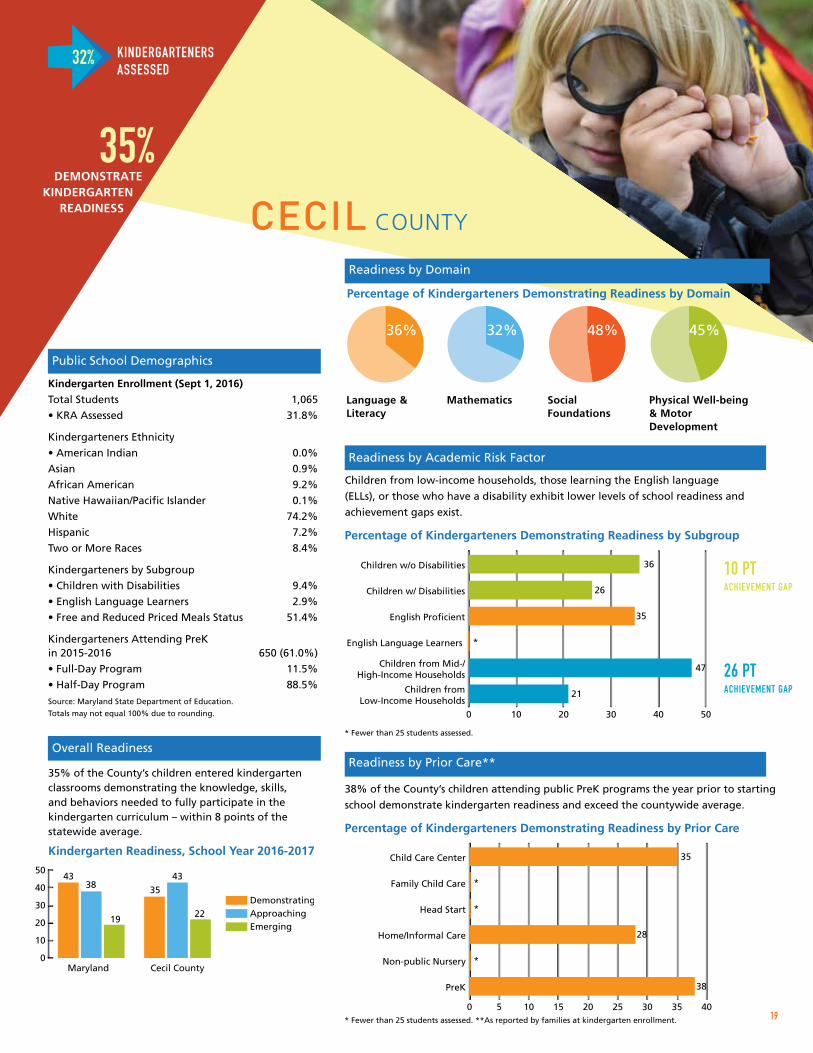
CECIL COUNTY 35%
DEMONSTRATE KINDERGARTEN
READINESS
0 5 10 15 20 25 30 35 40
PreK
Non-public Nursery
Home/Informal Care
Head Start
Family Child Care
Child Care Center 35
*
*
28
*
38
0 10 20 30 40 50
Children fromLow-Income Households
Children from Mid-/High-Income Households
English Language Learners
English Proficient
Children w/ Disabilities
Children w/o Disabilities 36
26
35
*
47
21
Kindergarten Enrollment (Sept 1, 2016)
Total Students 1,065
• KRA Assessed 31.8%
Kindergarteners Ethnicity
• American Indian 0.0%
Asian 0.9%
African American 9.2%
Native Hawaiian/Pacific Islander 0.1%
White 74.2%
Hispanic 7.2%
Two or More Races 8.4%
Kindergarteners by Subgroup
• Children with Disabilities 9.4%
• English Language Learners 2.9%
• Free and Reduced Priced Meals Status 51.4%
Kindergarteners Attending PreK in 2015-2016 650 (61.0%)
• Full-Day Program 11.5%
• Half-Day Program 88.5%
Source: Maryland State Department of Education.
Totals may not equal 100% due to rounding.
Children from low-income households, those learning the English language
(ELLs), or those who have a disability exhibit lower levels of school readiness and
achievement gaps exist.
Percentage of Kindergarteners Demonstrating Readiness by Subgroup
38% of the County’s children attending public PreK programs the year prior to starting
school demonstrate kindergarten readiness and exceed the countywide average.
Percentage of Kindergarteners Demonstrating Readiness by Prior Care
35% of the County’s children entered kindergarten classrooms demonstrating the knowledge, skills, and behaviors needed to fully participate in the kindergarten curriculum – within 8 points of the statewide average.
Kindergarten Readiness, School Year 2016-2017
4338
19
35
43
22
Maryland Cecil County0
10
20
30
40
50
DemonstratingApproachingEmerging
10 PT ACHIEVEMENT GAP
26 PT ACHIEVEMENT GAP
36% 32% 48% 45%
Language & Literacy
Mathematics Social Foundations
Physical Well-being & Motor Development
Percentage of Kindergarteners Demonstrating Readiness by Domain
* Fewer than 25 students assessed. **As reported by families at kindergarten enrollment.
* Fewer than 25 students assessed.
KINDERGARTENERS ASSESSED
KINDERGARTENERS ASSESSED
32%
19
Readiness by Academic Risk Factor
Readiness by Prior Care**
Public School Demographics
Readiness by Domain
Overall Readiness
51% DEMONSTRATE
KINDERGARTEN READINESS
39 PT ACHIEVEMENT GAP
27 PT ACHIEVEMENT GAP
Readiness by Academic Risk Factor
Readiness by Prior Care**
28% DEMONSTRATE
KINDERGARTEN READINESS
27% KINDERGARTENERS ASSESSED
20
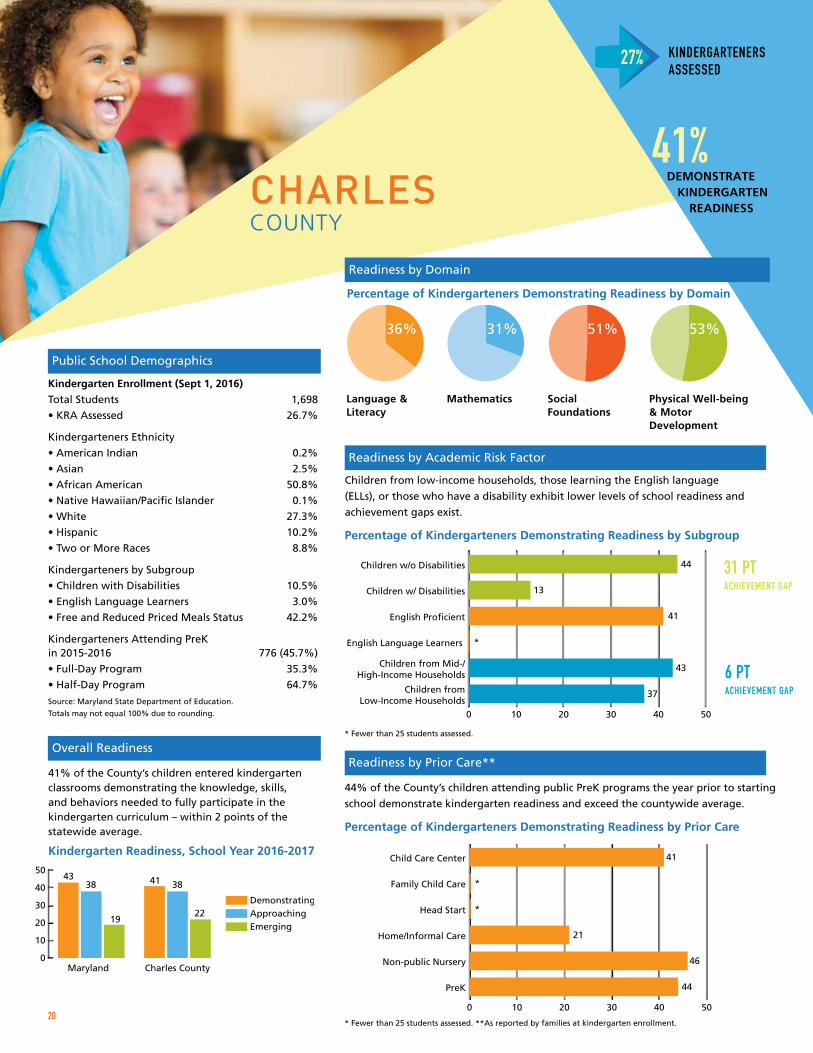
CHARLES COUNTY
41% DEMONSTRATE
KINDERGARTEN READINESS
0 10 20 30 40 50
PreK
Non-public Nursery
Home/Informal Care
Head Start
Family Child Care
Child Care Center 41
*
*
21
46
44
0 10 20 30 40 50
Children fromLow-Income Households
Children from Mid-/High-Income Households
English Language Learners
English Proficient
Children w/ Disabilities
Children w/o Disabilities 44
13
41
*
43
37
Kindergarten Enrollment (Sept 1, 2016)
Total Students 1,698
• KRA Assessed 26.7%
Kindergarteners Ethnicity
• American Indian 0.2%
• Asian 2.5%
• African American 50.8%
• Native Hawaiian/Pacific Islander 0.1%
• White 27.3%
• Hispanic 10.2%
• Two or More Races 8.8%
Kindergarteners by Subgroup
• Children with Disabilities 10.5%
• English Language Learners 3.0%
• Free and Reduced Priced Meals Status 42.2%
Kindergarteners Attending PreK in 2015-2016 776 (45.7%)
• Full-Day Program 35.3%
• Half-Day Program 64.7%
Source: Maryland State Department of Education.
Totals may not equal 100% due to rounding.
Children from low-income households, those learning the English language
(ELLs), or those who have a disability exhibit lower levels of school readiness and
achievement gaps exist.
Percentage of Kindergarteners Demonstrating Readiness by Subgroup
44% of the County’s children attending public PreK programs the year prior to starting
school demonstrate kindergarten readiness and exceed the countywide average.
Percentage of Kindergarteners Demonstrating Readiness by Prior Care
41% of the County’s children entered kindergarten classrooms demonstrating the knowledge, skills, and behaviors needed to fully participate in the kindergarten curriculum – within 2 points of the statewide average.
Kindergarten Readiness, School Year 2016-2017
4338
19
41 38
22
Maryland Charles County0
10
20
30
40
50
DemonstratingApproachingEmerging
31 PT ACHIEVEMENT GAP
6 PT ACHIEVEMENT GAP
36% 31% 51% 53%
Language & Literacy
Mathematics Social Foundations
Physical Well-being & Motor Development
* Fewer than 25 students assessed. **As reported by families at kindergarten enrollment.
* Fewer than 25 students assessed.
Readiness by Academic Risk Factor
Readiness by Prior Care**
Public School Demographics
Readiness by Domain
Overall Readiness
Percentage of Kindergarteners Demonstrating Readiness by Domain
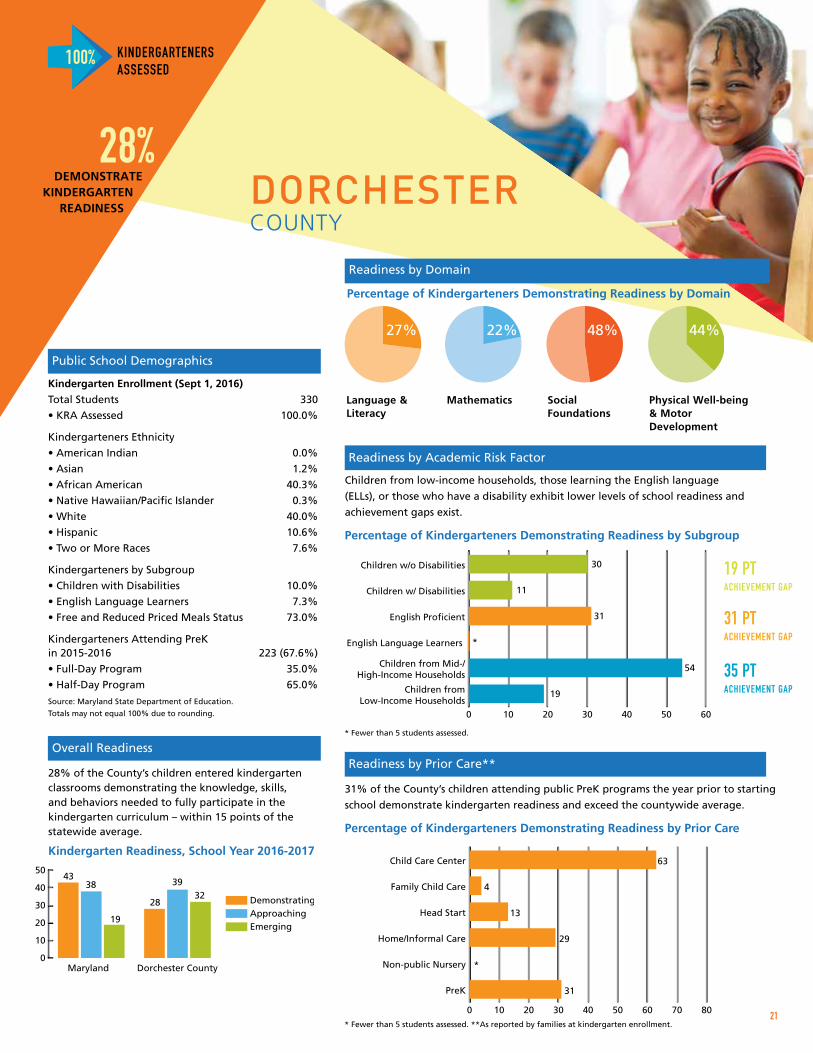
DORCHESTER COUNTY
28% DEMONSTRATE
KINDERGARTEN READINESS
0 10 20 30 40 50 60 70 80
PreK
Non-public Nursery
Home/Informal Care
Head Start
Family Child Care
Child Care Center 63
4
13
29
*
31
0 10 20 30 40 50 60
Children fromLow-Income Households
Children from Mid-/High-Income Households
English Language Learners
English Proficient
Children w/ Disabilities
Children w/o Disabilities 30
11
31
*
54
19
Kindergarten Enrollment (Sept 1, 2016)
Total Students 330
• KRA Assessed 100.0%
Kindergarteners Ethnicity
• American Indian 0.0%
• Asian 1.2%
• African American 40.3%
• Native Hawaiian/Pacific Islander 0.3%
• White 40.0%
• Hispanic 10.6%
• Two or More Races 7.6%
Kindergarteners by Subgroup
• Children with Disabilities 10.0%
• English Language Learners 7.3%
• Free and Reduced Priced Meals Status 73.0%
Kindergarteners Attending PreK in 2015-2016 223 (67.6%)
• Full-Day Program 35.0%
• Half-Day Program 65.0%
Source: Maryland State Department of Education.
Totals may not equal 100% due to rounding.
Children from low-income households, those learning the English language
(ELLs), or those who have a disability exhibit lower levels of school readiness and
achievement gaps exist.
Percentage of Kindergarteners Demonstrating Readiness by Subgroup
31% of the County’s children attending public PreK programs the year prior to starting
school demonstrate kindergarten readiness and exceed the countywide average.
Percentage of Kindergarteners Demonstrating Readiness by Prior Care
28% of the County’s children entered kindergarten classrooms demonstrating the knowledge, skills, and behaviors needed to fully participate in the kindergarten curriculum – within 15 points of the statewide average.
Kindergarten Readiness, School Year 2016-2017
4338
19
28
3932
Maryland Dorchester County0
10
20
30
40
50
DemonstratingApproachingEmerging
19 PT ACHIEVEMENT GAP
31 PT ACHIEVEMENT GAP
35 PT ACHIEVEMENT GAP
27% 22% 48% 44%
Language & Literacy
Mathematics Social Foundations
Physical Well-being & Motor Development
Percentage of Kindergarteners Demonstrating Readiness by Domain
* Fewer than 5 students assessed. **As reported by families at kindergarten enrollment.
KINDERGARTENERS ASSESSED
KINDERGARTENERS ASSESSED
100%
* Fewer than 5 students assessed.
21
Readiness by Academic Risk Factor
Readiness by Prior Care**
Public School Demographics
Readiness by Domain
Overall Readiness
41% DEMONSTRATE
KINDERGARTEN READINESS
31 PT ACHIEVEMENT GAP
6 PT ACHIEVEMENT GAP
Readiness by Academic Risk Factor
Readiness by Prior Care**

63% DEMONSTRATE
KINDERGARTEN READINESS
32% KINDERGARTENERS ASSESSED
22
FREDERICK COUNTY
54% DEMONSTRATE
KINDERGARTEN READINESS
0 10 20 30 40 50 60 70 80
PreK
Non-public Nursery
Home/Informal Care
Head Start
Family Child Care
Child Care Center 65
49
34
52
68
45
0 10 20 30 40 50 60 70 80
Children fromLow-Income Households
Children from Mid-/High-Income Households
English Language Learners
English Proficient
Children w/ Disabilities
Children w/o Disabilities 57
28
58
27
62
37
Kindergarten Enrollment (Sept 1, 2016)
Total Students 2,760
• KRA Assessed 32.1%
Kindergarteners Ethnicity
• American Indian 0.5%
• Asian 4.9%
• African American 11.7%
• Native Hawaiian/Pacific Islander 0.2%
• White 60.7%
• Hispanic 16.9%
• Two or More Races 5.0%
Kindergarteners by Subgroup
• Children with Disabilities 11.3%
• English Language Learners 12.6%
• Free and Reduced Priced Meals Status 30.8%
Kindergarteners Attending PreK in 2015-2016 1,074 (38.9%)
• Full-Day Program 0.0%
• Half-Day Program 100.0%
Source: Maryland State Department of Education.
Totals may not equal 100% due to rounding.
Children from low-income households, those learning the English language
(ELLs), or those who have a disability exhibit lower levels of school readiness and
achievement gaps exist.
Percentage of Kindergarteners Demonstrating Readiness by Subgroup
45% of the County’s children attending public PreK programs the year prior to starting
school demonstrate kindergarten readiness and are within 9 points of the countywide
average.
Percentage of Kindergarteners Demonstrating Readiness by Prior Care
54% of the County’s children entered kindergarten classrooms demonstrating the knowledge, skills, and behaviors needed to fully participate in the kindergarten curriculum – 11 points higher than the statewide average.
Kindergarten Readiness, School Year 2016-2017
4338
19
54
32
14
Maryland Frederick County0
10
20
30
40
50
60
DemonstratingApproachingEmerging
48% 45% 65% 67%
Language & Literacy
Mathematics Social Foundations
Physical Well-being & Motor Development
Percentage of Kindergarteners Demonstrating Readiness by Domain
**As reported by families at kindergarten enrollment.
29 PT ACHIEVEMENT GAP
31 PT ACHIEVEMENT GAP
25 PT ACHIEVEMENT GAP
Readiness by Academic Risk Factor
Readiness by Prior Care**
Public School Demographics
Readiness by Domain
Overall Readiness

* Fewer than 5 students assessed. **As reported by families at kindergarten enrollment.
GARRETT COUNTY
63% DEMONSTRATE
KINDERGARTEN READINESS
0 20 40 60 80 100
PreK
Non-public Nursery
Home/Informal Care
Head Start
Family Child Care
Child Care Center *
67
29
*
83
71
0 10 20 30 40 50 60 70 80
Children fromLow-Income Households
Children from Mid-/High-Income Households
English Language Learners
English Proficient
Children w/ Disabilities
Children w/o Disabilities
*
66
43
63
74
52
Kindergarten Enrollment (Sept 1, 2016)
Total Students 239
• KRA Assessed 100.0%
Kindergarteners Ethnicity
• American Indian 0.0%
• Asian 0.0%
• African American 0.4%
• Native Hawaiian/Pacific Islander 0.0%
• White 96.2%
• Hispanic 1.3%
• Two or More Races 2.1%
Kindergarteners by Subgroup
• Children with Disabilities 12.1%
• English Language Learners 0.0%
• Free and Reduced Priced Meals Status 49.4%
Kindergarteners Attending PreK in 2015-2016 158 (66.1%)
• Full-Day Program 100.0%
• Half-Day Program 0.0%
Source: Maryland State Department of Education.
Totals may not equal 100% due to rounding.
Children from low-income households, those learning the English language
(ELLs), or those who have a disability exhibit lower levels of school readiness and
achievement gaps exist.
Percentage of Kindergarteners Demonstrating Readiness by Subgroup
71% of the County’s children attending public PreK programs the year prior to starting
school demonstrate kindergarten readiness and exceed the countywide average.
Percentage of Kindergarteners Demonstrating Readiness by Prior Care
63% of the County’s children entered kindergarten classrooms demonstrating the knowledge, skills, and behaviors needed to fully participate in the kindergarten curriculum – 20 points higher than the statewide average.
Kindergarten Readiness, School Year 2016-2017
43 38
19
63
26
11
Maryland Garrett County0
10203040506070
DemonstratingApproachingEmerging
23 PT ACHIEVEMENT GAP
22 PT ACHIEVEMENT GAP
51% 56% 71% 65%
Language & Literacy
Mathematics Social Foundations
Physical Well-being & Motor Development
Percentage of Kindergarteners Demonstrating Readiness by Domain
* Fewer than 5 students assessed.
KINDERGARTENERS ASSESSED
KINDERGARTENERS ASSESSED
100%
23
Readiness by Academic Risk Factor
Readiness by Prior Care**
Public School Demographics
Readiness by Domain
Overall Readiness
54% DEMONSTRATE
KINDERGARTEN READINESS
29 PT ACHIEVEMENT GAP
31 PT ACHIEVEMENT GAP
25 PT ACHIEVEMENT GAP
Readiness by Academic Risk Factor
Readiness by Prior Care**
50% DEMONSTRATE
KINDERGARTEN READINESS
32% KINDERGARTENERS ASSESSED
24
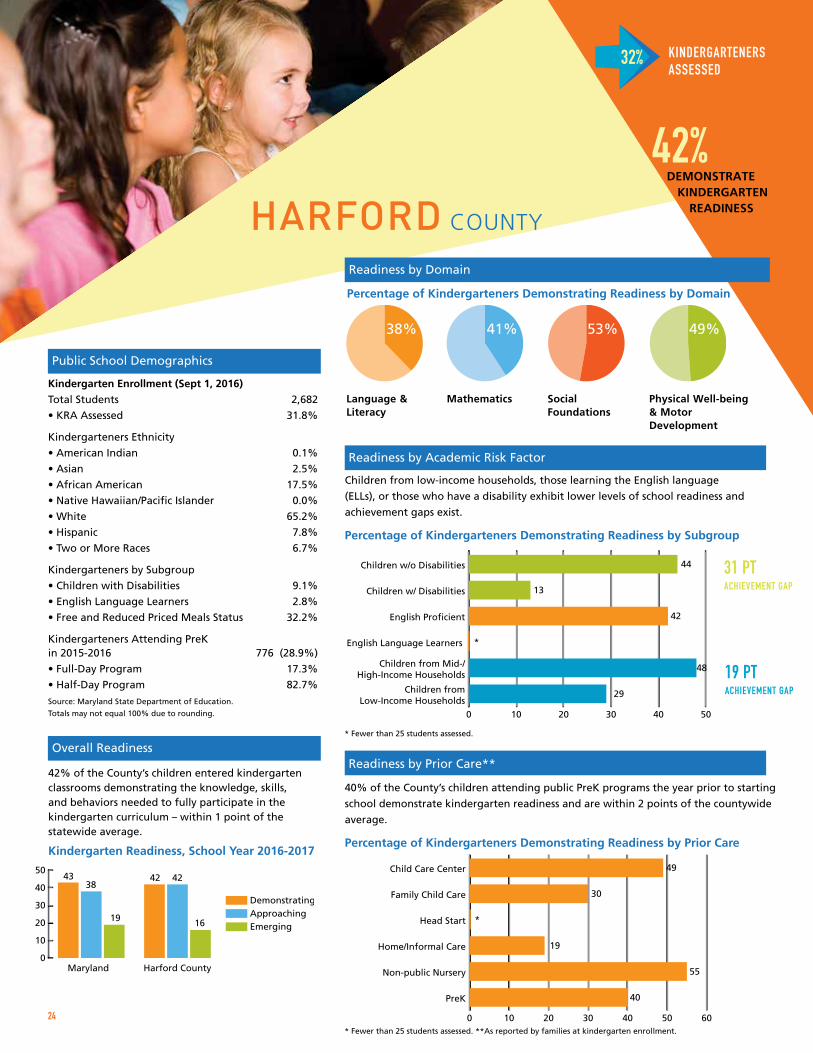
HARFORD COUNTY 42%
DEMONSTRATE KINDERGARTEN
READINESS
0 10 20 30 40 50 60
PreK
Non-public Nursery
Home/Informal Care
Head Start
Family Child Care
Child Care Center 49
30
*
19
55
40
0 10 20 30 40 50
Children fromLow-Income Households
Children from Mid-/High-Income Households
English Language Learners
English Proficient
Children w/ Disabilities
Children w/o Disabilities 44
13
42
*
48
29
Kindergarten Enrollment (Sept 1, 2016)
Total Students 2,682
• KRA Assessed 31.8%
Kindergarteners Ethnicity
• American Indian 0.1%
• Asian 2.5%
• African American 17.5%
• Native Hawaiian/Pacific Islander 0.0%
• White 65.2%
• Hispanic 7.8%
• Two or More Races 6.7%
Kindergarteners by Subgroup
• Children with Disabilities 9.1%
• English Language Learners 2.8%
• Free and Reduced Priced Meals Status 32.2%
Kindergarteners Attending PreK in 2015-2016 776 (28.9%)
• Full-Day Program 17.3%
• Half-Day Program 82.7%
Source: Maryland State Department of Education.
Totals may not equal 100% due to rounding.
Children from low-income households, those learning the English language
(ELLs), or those who have a disability exhibit lower levels of school readiness and
achievement gaps exist.
Percentage of Kindergarteners Demonstrating Readiness by Subgroup
40% of the County’s children attending public PreK programs the year prior to starting
school demonstrate kindergarten readiness and are within 2 points of the countywide
average.
Percentage of Kindergarteners Demonstrating Readiness by Prior Care
42% of the County’s children entered kindergarten classrooms demonstrating the knowledge, skills, and behaviors needed to fully participate in the kindergarten curriculum – within 1 point of the statewide average.
Kindergarten Readiness, School Year 2016-2017
4338
19
42 42
16
Maryland Harford County0
10
20
30
40
50
DemonstratingApproachingEmerging
38% 41% 53% 49%
Language & Literacy
Mathematics Social Foundations
Physical Well-being & Motor Development
* Fewer than 25 students assessed. **As reported by families at kindergarten enrollment.
* Fewer than 25 students assessed.
31 PT ACHIEVEMENT GAP
19 PT ACHIEVEMENT GAP
Readiness by Academic Risk Factor
Readiness by Prior Care**
Public School Demographics
Readiness by Domain
Overall Readiness
Percentage of Kindergarteners Demonstrating Readiness by Domain
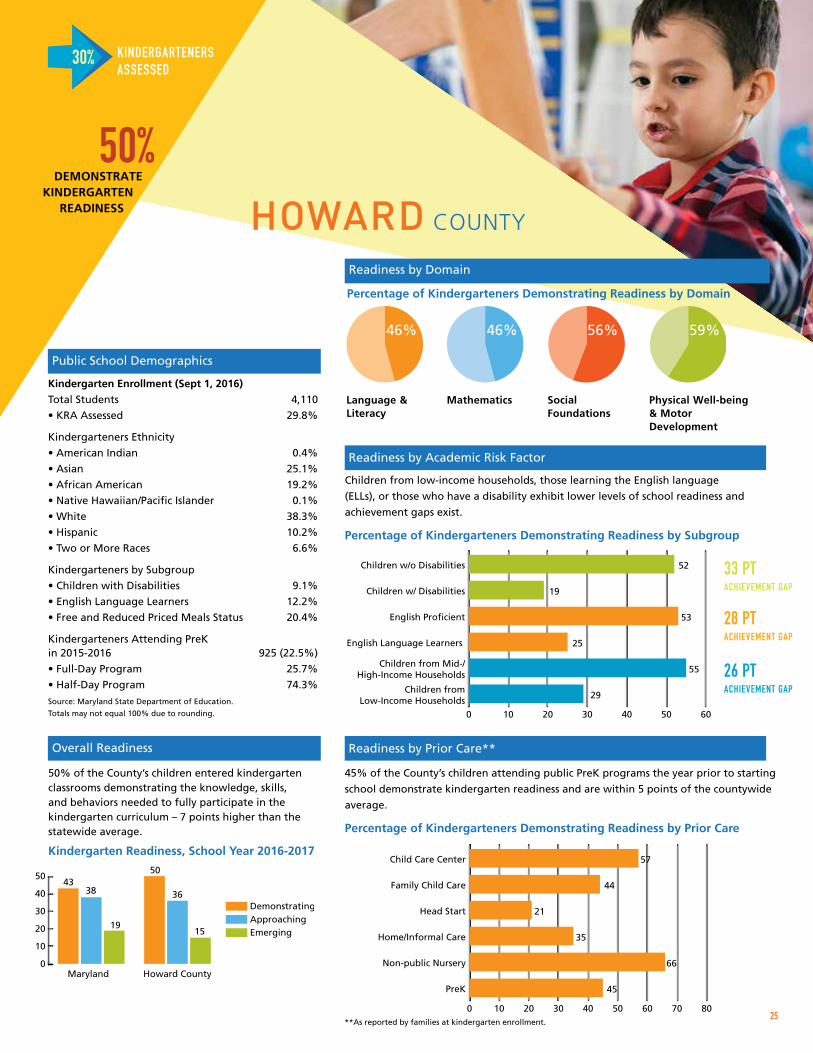
HOWARD COUNTY 50%
DEMONSTRATE KINDERGARTEN
READINESS
0 10 20 30 40 50 60 70 80
PreK
Non-public Nursery
Home/Informal Care
Head Start
Family Child Care
Child Care Center 57
44
21
35
66
45
0 10 20 30 40 50 60
Children fromLow-Income Households
Children from Mid-/High-Income Households
English Language Learners
English Proficient
Children w/ Disabilities
Children w/o Disabilities 52
19
53
25
55
29
Kindergarten Enrollment (Sept 1, 2016)
Total Students 4,110
• KRA Assessed 29.8%
Kindergarteners Ethnicity
• American Indian 0.4%
• Asian 25.1%
• African American 19.2%
• Native Hawaiian/Pacific Islander 0.1%
• White 38.3%
• Hispanic 10.2%
• Two or More Races 6.6%
Kindergarteners by Subgroup
• Children with Disabilities 9.1%
• English Language Learners 12.2%
• Free and Reduced Priced Meals Status 20.4%
Kindergarteners Attending PreK in 2015-2016 925 (22.5%)
• Full-Day Program 25.7%
• Half-Day Program 74.3%
Source: Maryland State Department of Education.
Totals may not equal 100% due to rounding.
Children from low-income households, those learning the English language
(ELLs), or those who have a disability exhibit lower levels of school readiness and
achievement gaps exist.
Percentage of Kindergarteners Demonstrating Readiness by Subgroup
45% of the County’s children attending public PreK programs the year prior to starting
school demonstrate kindergarten readiness and are within 5 points of the countywide
average.
Percentage of Kindergarteners Demonstrating Readiness by Prior Care
50% of the County’s children entered kindergarten classrooms demonstrating the knowledge, skills, and behaviors needed to fully participate in the kindergarten curriculum – 7 points higher than the statewide average.
Kindergarten Readiness, School Year 2016-2017
4338
19
50
36
15
Maryland Howard County0
10
20
30
40
50
DemonstratingApproachingEmerging
33 PT ACHIEVEMENT GAP
28 PT ACHIEVEMENT GAP
26 PT ACHIEVEMENT GAP
46% 46% 56% 59%
Language & Literacy
Mathematics Social Foundations
Physical Well-being & Motor Development
Percentage of Kindergarteners Demonstrating Readiness by Domain
**As reported by families at kindergarten enrollment.
KINDERGARTENERS ASSESSED
KINDERGARTENERS ASSESSED
30%
25
Readiness by Academic Risk Factor
Readiness by Prior Care**
Public School Demographics
Readiness by Domain
Overall Readiness
42% DEMONSTRATE
KINDERGARTEN READINESS
31 PT ACHIEVEMENT GAP
19 PT ACHIEVEMENT GAP
Readiness by Academic Risk Factor
Readiness by Prior Care**
49% DEMONSTRATE
KINDERGARTEN READINESS
100% KINDERGARTENERS ASSESSED
26
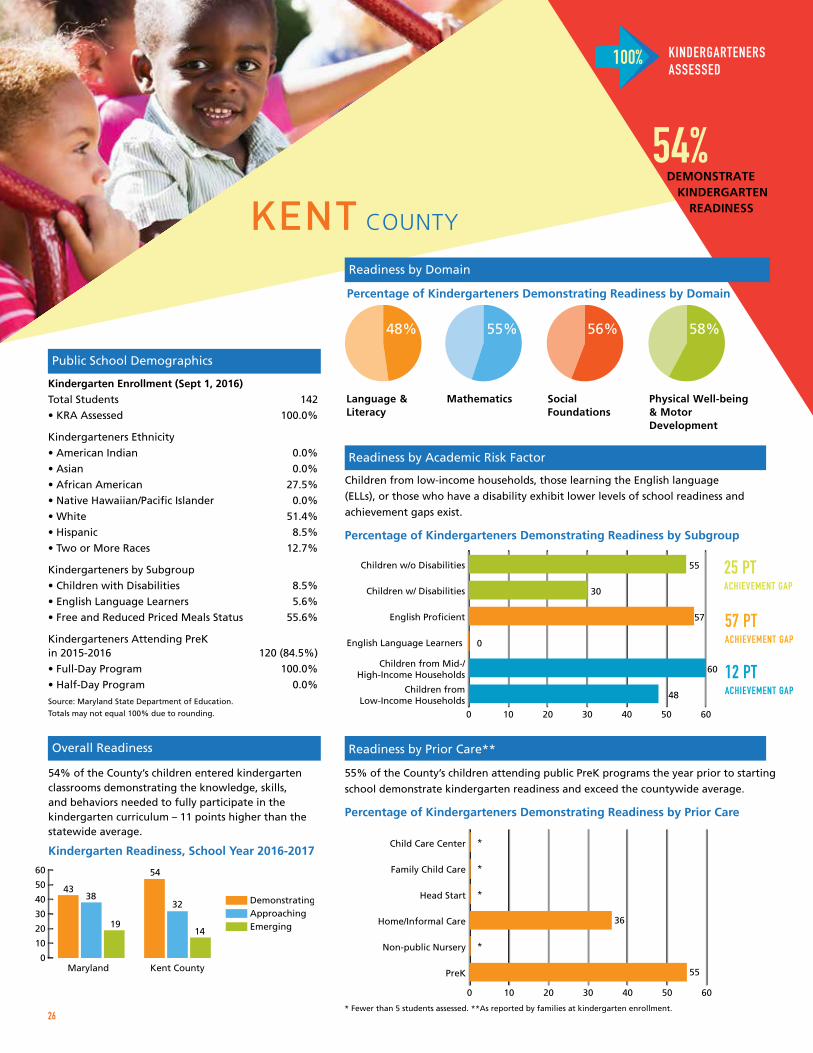
KENT COUNTY 54%
DEMONSTRATE KINDERGARTEN
READINESS
0 10 20 30 40 50 60
PreK
Non-public Nursery
Home/Informal Care
Head Start
Family Child Care
Child Care Center *
*
*
36
*
55
0 10 20 30 40 50 60
Children fromLow-Income Households
Children from Mid-/High-Income Households
English Language Learners
English Proficient
Children w/ Disabilities
Children w/o Disabilities 55
30
57
0
60
48
Kindergarten Enrollment (Sept 1, 2016)
Total Students 142
• KRA Assessed 100.0%
Kindergarteners Ethnicity
• American Indian 0.0%
• Asian 0.0%
• African American 27.5%
• Native Hawaiian/Pacific Islander 0.0%
• White 51.4%
• Hispanic 8.5%
• Two or More Races 12.7%
Kindergarteners by Subgroup
• Children with Disabilities 8.5%
• English Language Learners 5.6%
• Free and Reduced Priced Meals Status 55.6%
Kindergarteners Attending PreK in 2015-2016 120 (84.5%)
• Full-Day Program 100.0%
• Half-Day Program 0.0%
Source: Maryland State Department of Education.
Totals may not equal 100% due to rounding.
Children from low-income households, those learning the English language
(ELLs), or those who have a disability exhibit lower levels of school readiness and
achievement gaps exist.
Percentage of Kindergarteners Demonstrating Readiness by Subgroup
55% of the County’s children attending public PreK programs the year prior to starting
school demonstrate kindergarten readiness and exceed the countywide average.
Percentage of Kindergarteners Demonstrating Readiness by Prior Care
54% of the County’s children entered kindergarten classrooms demonstrating the knowledge, skills, and behaviors needed to fully participate in the kindergarten curriculum – 11 points higher than the statewide average.
Kindergarten Readiness, School Year 2016-2017
4338
19
54
32
14
Maryland Kent County0
10
20
30
40
50
60
DemonstratingApproachingEmerging
25 PT ACHIEVEMENT GAP
57 PT ACHIEVEMENT GAP
12 PT ACHIEVEMENT GAP
48% 55% 56% 58%
Language & Literacy
Mathematics Social Foundations
Physical Well-being & Motor Development
Percentage of Kindergarteners Demonstrating Readiness by Domain
* Fewer than 5 students assessed. **As reported by families at kindergarten enrollment.
Readiness by Academic Risk Factor
Readiness by Prior Care**
Public School Demographics
Readiness by Domain
Overall Readiness
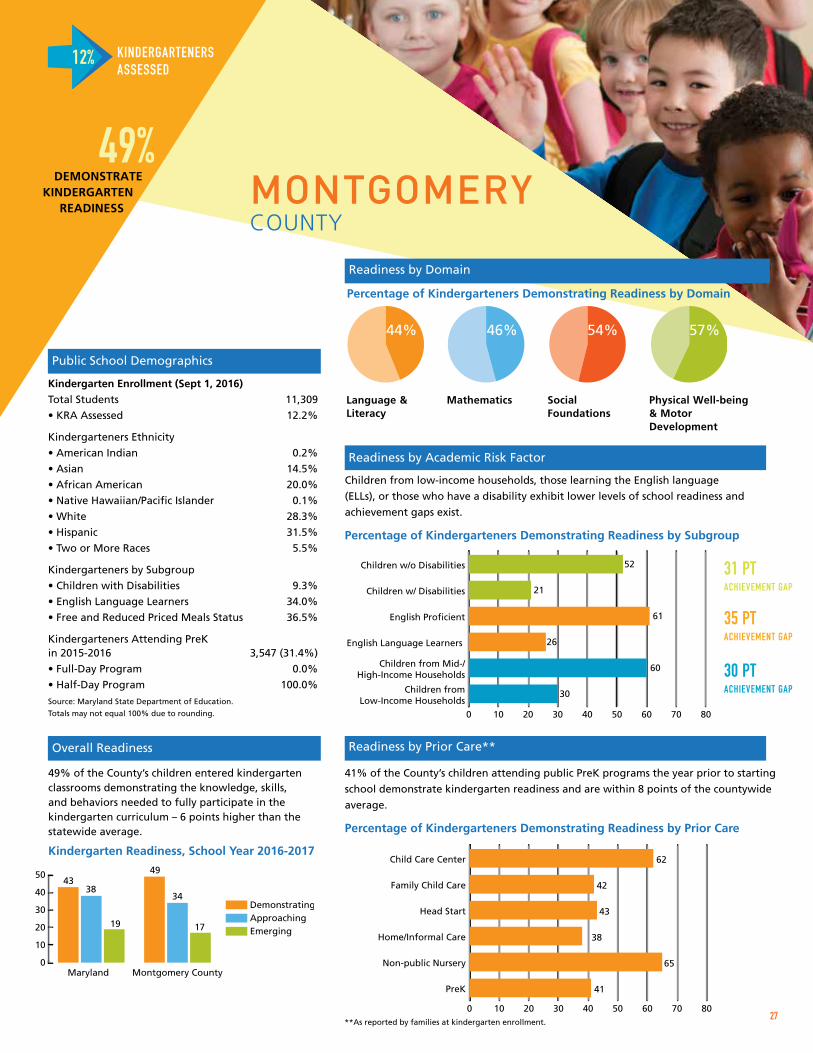
MONTGOMERY COUNTY
49% DEMONSTRATE
KINDERGARTEN READINESS
0 10 20 30 40 50 60 70 80
PreK
Non-public Nursery
Home/Informal Care
Head Start
Family Child Care
Child Care Center 62
42
43
38
65
41
0 10 20 30 40 50 60 70 80
Children fromLow-Income Households
Children from Mid-/High-Income Households
English Language Learners
English Proficient
Children w/ Disabilities
Children w/o Disabilities 52
21
61
26
60
30
Kindergarten Enrollment (Sept 1, 2016)
Total Students 11,309
• KRA Assessed 12.2%
Kindergarteners Ethnicity
• American Indian 0.2%
• Asian 14.5%
• African American 20.0%
• Native Hawaiian/Pacific Islander 0.1%
• White 28.3%
• Hispanic 31.5%
• Two or More Races 5.5%
Kindergarteners by Subgroup
• Children with Disabilities 9.3%
• English Language Learners 34.0%
• Free and Reduced Priced Meals Status 36.5%
Kindergarteners Attending PreK in 2015-2016 3,547 (31.4%)
• Full-Day Program 0.0%
• Half-Day Program 100.0%
Source: Maryland State Department of Education.
Totals may not equal 100% due to rounding.
Children from low-income households, those learning the English language
(ELLs), or those who have a disability exhibit lower levels of school readiness and
achievement gaps exist.
Percentage of Kindergarteners Demonstrating Readiness by Subgroup
41% of the County’s children attending public PreK programs the year prior to starting
school demonstrate kindergarten readiness and are within 8 points of the countywide
average.
Percentage of Kindergarteners Demonstrating Readiness by Prior Care
49% of the County’s children entered kindergarten classrooms demonstrating the knowledge, skills, and behaviors needed to fully participate in the kindergarten curriculum – 6 points higher than the statewide average.
Kindergarten Readiness, School Year 2016-2017
4338
19
49
34
17
Maryland Montgomery County0
10
20
30
40
50
DemonstratingApproachingEmerging
31 PT ACHIEVEMENT GAP
35 PT ACHIEVEMENT GAP
30 PT ACHIEVEMENT GAP
44% 46% 54% 57%
Language & Literacy
Mathematics Social Foundations
Physical Well-being & Motor Development
Percentage of Kindergarteners Demonstrating Readiness by Domain
**As reported by families at kindergarten enrollment.
KINDERGARTENERS ASSESSED
KINDERGARTENERS ASSESSED
12%
27
Readiness by Academic Risk Factor
Readiness by Prior Care**
Public School Demographics
Readiness by Domain
Overall Readiness
54% DEMONSTRATE
KINDERGARTEN READINESS
25 PT ACHIEVEMENT GAP
57 PT ACHIEVEMENT GAP
12 PT ACHIEVEMENT GAP
Readiness by Academic Risk Factor
Readiness by Prior Care**
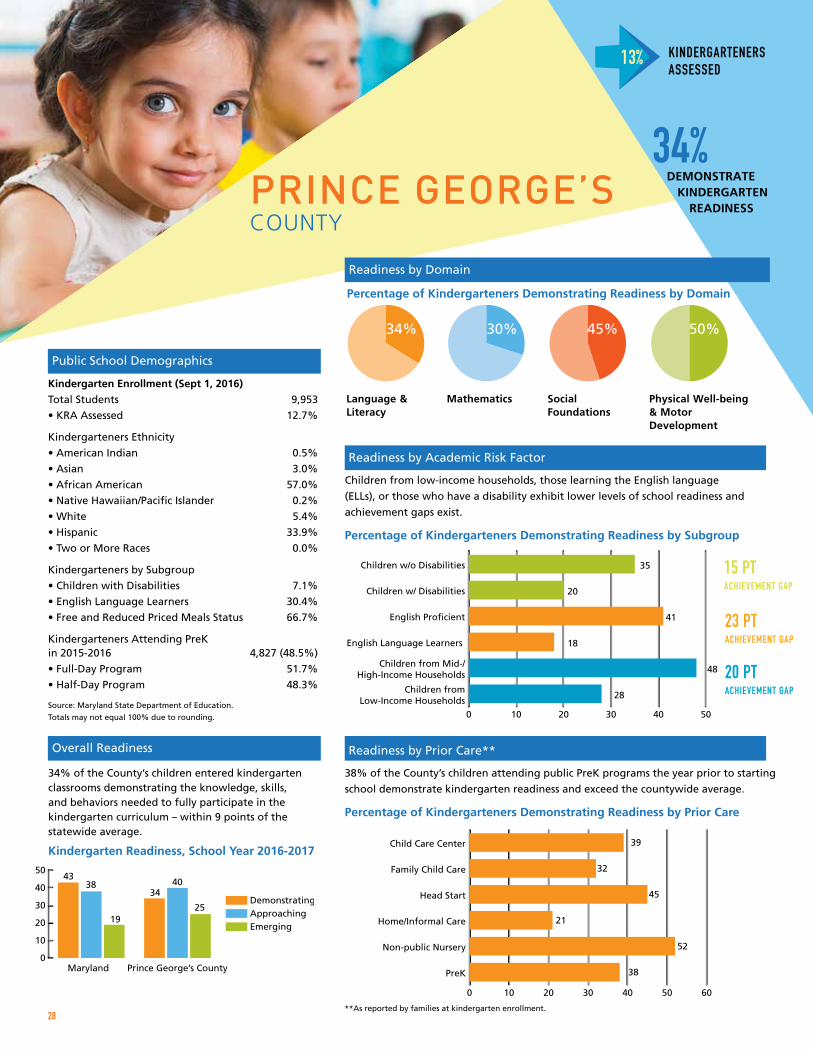
48% DEMONSTRATE
KINDERGARTEN READINESS
13% KINDERGARTENERS ASSESSED
28
Kindergarten Enrollment (Sept 1, 2016)
Total Students 9,953
• KRA Assessed 12.7%
Kindergarteners Ethnicity
• American Indian 0.5%
• Asian 3.0%
• African American 57.0%
• Native Hawaiian/Pacific Islander 0.2%
• White 5.4%
• Hispanic 33.9%
• Two or More Races 0.0%
Kindergarteners by Subgroup
• Children with Disabilities 7.1%
• English Language Learners 30.4%
• Free and Reduced Priced Meals Status 66.7%
Kindergarteners Attending PreK in 2015-2016 4,827 (48.5%)
• Full-Day Program 51.7%
• Half-Day Program 48.3%
Source: Maryland State Department of Education.
Totals may not equal 100% due to rounding.
Children from low-income households, those learning the English language
(ELLs), or those who have a disability exhibit lower levels of school readiness and
achievement gaps exist.
Percentage of Kindergarteners Demonstrating Readiness by Subgroup
34% of the County’s children entered kindergarten classrooms demonstrating the knowledge, skills, and behaviors needed to fully participate in the kindergarten curriculum – within 9 points of the statewide average.
Kindergarten Readiness, School Year 2016-2017
4338
19
3440
25
Maryland Prince George’s County0
10
20
30
40
50
DemonstratingApproachingEmerging
34% 30% 45% 50%
Language & Literacy
Mathematics Social Foundations
Physical Well-being & Motor Development
Percentage of Kindergarteners Demonstrating Readiness by Domain
PRINCE GEORGE’S COUNTY
34% DEMONSTRATE
KINDERGARTEN READINESS
0 10 20 30 40 50 60
PreK
Non-public Nursery
Home/Informal Care
Head Start
Family Child Care
Child Care Center 39
32
45
21
52
38
0 10 20 30 40 50
Children fromLow-Income Households
Children from Mid-/High-Income Households
English Language Learners
English Proficient
Children w/ Disabilities
Children w/o Disabilities 35
20
41
18
48
28
38% of the County’s children attending public PreK programs the year prior to starting
school demonstrate kindergarten readiness and exceed the countywide average.
Percentage of Kindergarteners Demonstrating Readiness by Prior Care
15 PT ACHIEVEMENT GAP
23 PT ACHIEVEMENT GAP
20 PT ACHIEVEMENT GAP
**As reported by families at kindergarten enrollment.
Readiness by Academic Risk Factor
Readiness by Prior Care**
Public School Demographics
Readiness by Domain
Overall Readiness
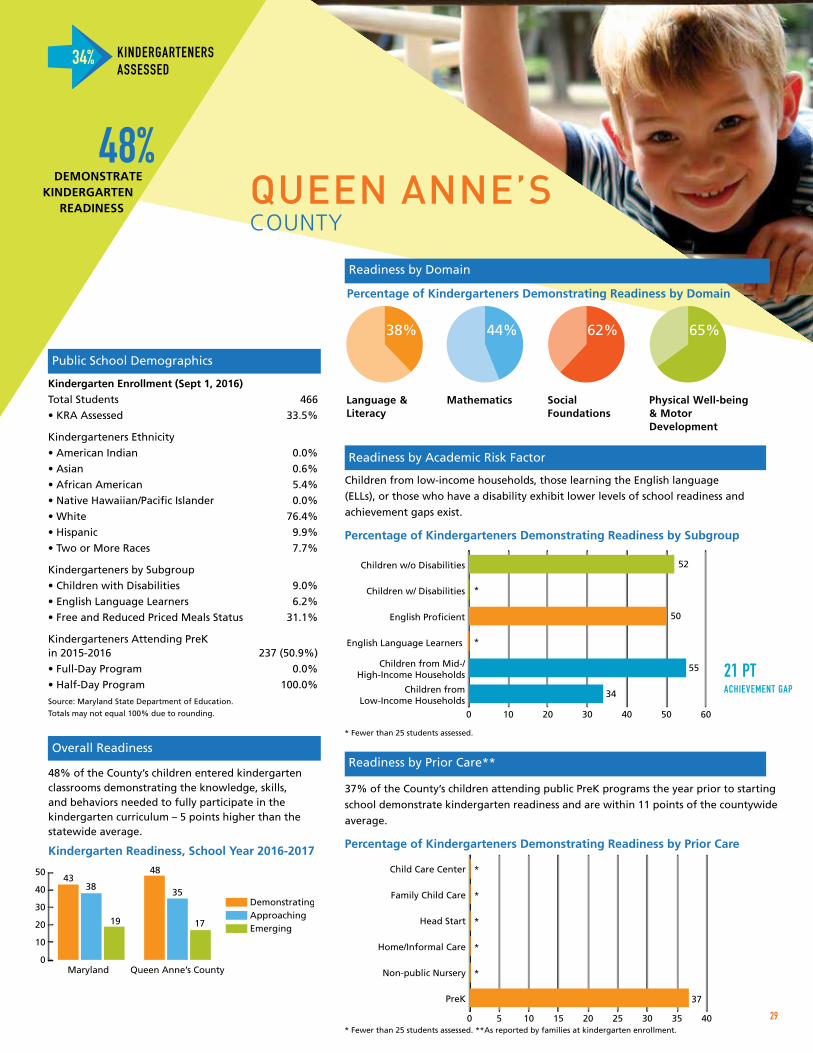
QUEEN ANNE’S COUNTY
48% DEMONSTRATE
KINDERGARTEN READINESS
0 10 20 30 40 50 60
Children fromLow-Income Households
Children from Mid-/High-Income Households
English Language Learners
English Proficient
Children w/ Disabilities
Children w/o Disabilities 52
*
50
*
55
34
Kindergarten Enrollment (Sept 1, 2016)
Total Students 466
• KRA Assessed 33.5%
Kindergarteners Ethnicity
• American Indian 0.0%
• Asian 0.6%
• African American 5.4%
• Native Hawaiian/Pacific Islander 0.0%
• White 76.4%
• Hispanic 9.9%
• Two or More Races 7.7%
Kindergarteners by Subgroup
• Children with Disabilities 9.0%
• English Language Learners 6.2%
• Free and Reduced Priced Meals Status 31.1%
Kindergarteners Attending PreK in 2015-2016 237 (50.9%)
• Full-Day Program 0.0%
• Half-Day Program 100.0%
Source: Maryland State Department of Education.
Totals may not equal 100% due to rounding.
Children from low-income households, those learning the English language
(ELLs), or those who have a disability exhibit lower levels of school readiness and
achievement gaps exist.
Percentage of Kindergarteners Demonstrating Readiness by Subgroup
48% of the County’s children entered kindergarten classrooms demonstrating the knowledge, skills, and behaviors needed to fully participate in the kindergarten curriculum – 5 points higher than the statewide average.
Kindergarten Readiness, School Year 2016-2017
4338
19
48
35
17
Maryland Queen Anne’s County0
10
20
30
40
50
DemonstratingApproachingEmerging
21 PT ACHIEVEMENT GAP
38% 44% 62% 65%
Language & Literacy
Mathematics Social Foundations
Physical Well-being & Motor Development
Percentage of Kindergarteners Demonstrating Readiness by Domain
0 5 10 15 20 25 30 35 40
PreK
Non-public Nursery
Home/Informal Care
Head Start
Family Child Care
Child Care Center *
*
*
*
*
37
37% of the County’s children attending public PreK programs the year prior to starting
school demonstrate kindergarten readiness and are within 11 points of the countywide
average.
Percentage of Kindergarteners Demonstrating Readiness by Prior Care
* Fewer than 25 students assessed.
* Fewer than 25 students assessed. **As reported by families at kindergarten enrollment.
KINDERGARTENERS ASSESSED
KINDERGARTENERS ASSESSED
34%
29
Readiness by Academic Risk Factor
Readiness by Prior Care**
Public School Demographics
Readiness by Domain
Overall Readiness
34% DEMONSTRATE
KINDERGARTEN READINESS
15 PT ACHIEVEMENT GAP
23 PT ACHIEVEMENT GAP
20 PT ACHIEVEMENT GAP
Readiness by Academic Risk Factor
Readiness by Prior Care**

45% DEMONSTRATE
KINDERGARTEN READINESS
32% KINDERGARTENERS ASSESSED
30
ST. MARY’S COUNTY
42% DEMONSTRATE
KINDERGARTEN READINESS
Kindergarten Enrollment (Sept 1, 2016)
Total Students 1,268
• KRA Assessed 32.3%
Kindergarteners Ethnicity
• American Indian 0.4%
• Asian 2.2%
• African American 16.6%
• Native Hawaiian/Pacific Islander 0.2%
• White 65.2%
• Hispanic 6.6%
• Two or More Races 8.7%
Kindergarteners by Subgroup
• Children with Disabilities 7.4%
• English Language Learners 1.3%
• Free and Reduced Priced Meals Status 35.7%
Kindergarteners Attending PreK in 2015-2016 811 (64.0%)
• Full-Day Program 9.2%
• Half-Day Program 90.8%
Source: Maryland State Department of Education.
Totals may not equal 100% due to rounding.
Children from low-income households, those learning the English language
(ELLs), or those who have a disability exhibit lower levels of school readiness and
achievement gaps exist.
Percentage of Kindergarteners Demonstrating Readiness by Subgroup
42% of the County’s children entered kindergarten classrooms demonstrating the knowledge, skills, and behaviors needed to fully participate in the kindergarten curriculum – within 1 point of the statewide average.
Kindergarten Readiness, School Year 2016-2017
4338
19
4239
19
Maryland Saint Mary’s County0
10
20
30
40
50
DemonstratingApproachingEmerging
37% 36% 55% 60%
Language & Literacy
Mathematics Social Foundations
Physical Well-being & Motor Development
Percentage of Kindergarteners Demonstrating Readiness by Domain
0 10 20 30 40 50 60 70 80
PreK
Non-public Nursery
Home/Informal Care
Head Start
Family Child Care
Child Care Center *
33
*
40
71
44
0 10 20 30 40 50 60
Children fromLow-Income Households
Children from Mid-/High-Income Households
English Language Learners
English Proficient
Children w/ Disabilities
Children w/o Disabilities 44
*
43
*
52
24
44% of the County’s children attending public PreK programs the year prior to starting
school demonstrate kindergarten readiness and exceed the countywide average.
Percentage of Kindergarteners Demonstrating Readiness by Prior Care
28 PT ACHIEVEMENT GAP
* Fewer than 25 students assessed. **As reported by families at kindergarten enrollment.
* Fewer than 25 students assessed.
Readiness by Academic Risk Factor
Readiness by Prior Care**
Public School Demographics
Readiness by Domain
Overall Readiness
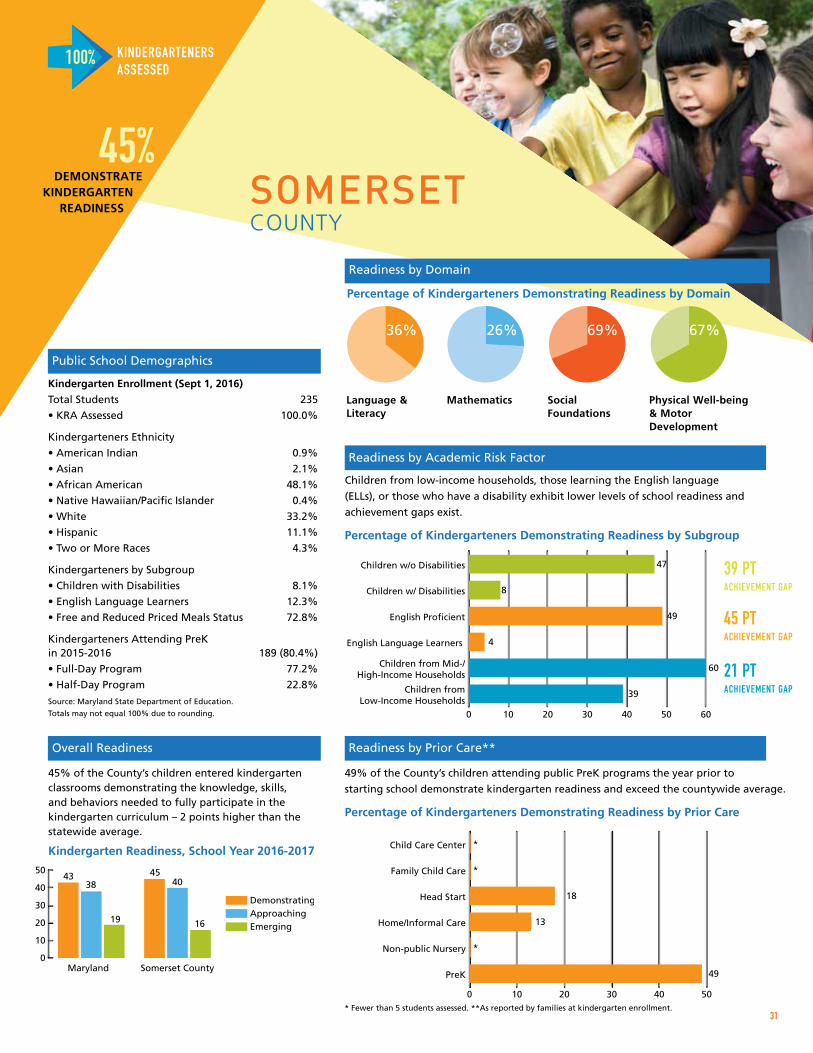
SOMERSET COUNTY
45% DEMONSTRATE
KINDERGARTEN READINESS
0 10 20 30 40 50
PreK
Non-public Nursery
Home/Informal Care
Head Start
Family Child Care
Child Care Center *
*
18
13
*
49
0 10 20 30 40 50 60
Children fromLow-Income Households
Children from Mid-/High-Income Households
English Language Learners
English Proficient
Children w/ Disabilities
Children w/o Disabilities 47
8
49
4
60
39
Kindergarten Enrollment (Sept 1, 2016)
Total Students 235
• KRA Assessed 100.0%
Kindergarteners Ethnicity
• American Indian 0.9%
• Asian 2.1%
• African American 48.1%
• Native Hawaiian/Pacific Islander 0.4%
• White 33.2%
• Hispanic 11.1%
• Two or More Races 4.3%
Kindergarteners by Subgroup
• Children with Disabilities 8.1%
• English Language Learners 12.3%
• Free and Reduced Priced Meals Status 72.8%
Kindergarteners Attending PreK in 2015-2016 189 (80.4%)
• Full-Day Program 77.2%
• Half-Day Program 22.8%
Source: Maryland State Department of Education.
Totals may not equal 100% due to rounding.
Children from low-income households, those learning the English language
(ELLs), or those who have a disability exhibit lower levels of school readiness and
achievement gaps exist.
Percentage of Kindergarteners Demonstrating Readiness by Subgroup
49% of the County’s children attending public PreK programs the year prior to
starting school demonstrate kindergarten readiness and exceed the countywide average.
Percentage of Kindergarteners Demonstrating Readiness by Prior Care
45% of the County’s children entered kindergarten classrooms demonstrating the knowledge, skills, and behaviors needed to fully participate in the kindergarten curriculum – 2 points higher than the statewide average.
Kindergarten Readiness, School Year 2016-2017
4338
19
4540
16
Maryland Somerset County0
10
20
30
40
50
DemonstratingApproachingEmerging
39 PT ACHIEVEMENT GAP
45 PT ACHIEVEMENT GAP
21 PT ACHIEVEMENT GAP
36% 26% 69% 67%
Language & Literacy
Mathematics Social Foundations
Physical Well-being & Motor Development
Percentage of Kindergarteners Demonstrating Readiness by Domain
* Fewer than 5 students assessed. **As reported by families at kindergarten enrollment.
KINDERGARTENERS ASSESSED
KINDERGARTENERS ASSESSED
100%
31
Readiness by Academic Risk Factor
Readiness by Prior Care**
Public School Demographics
Readiness by Domain
Overall Readiness
42% DEMONSTRATE
KINDERGARTEN READINESS
28 PT ACHIEVEMENT GAP
Readiness by Academic Risk Factor
Readiness by Prior Care**

33% DEMONSTRATE
KINDERGARTEN READINESS
34% KINDERGARTENERS ASSESSED
32
TALBOT COUNTY 38%
DEMONSTRATE KINDERGARTEN
READINESS
0 5 10 15 20 25 30 35 40
PreK
Non-public Nursery
Home/Informal Care
Head Start
Family Child Care
Child Care Center 30
*
*
*
*
39
0 10 20 30 40 50
Children fromLow-Income Households
Children from Mid-/High-Income Households
English Language Learners
English Proficient
Children w/ Disabilities
Children w/o Disabilities 39
*
42
*
43
33
Kindergarten Enrollment (Sept 1, 2016)
Total Students 288
• KRA Assessed 34.0%
Kindergarteners Ethnicity
• American Indian 0.0%
• Asian 1.7%
• African American 19.8%
• Native Hawaiian/Pacific Islander 0.0%
• White 53.5%
• Hispanic 16.7%
• Two or More Races 8.3%
Kindergarteners by Subgroup
• Children with Disabilities 10.4%
• English Language Learners 10.8%
• Free and Reduced Priced Meals Status 53.1%
Kindergarteners Attending PreK in 2015-2016 191 (66.3%)
• Full-Day Program 0.0%
• Half-Day Program 100.0%
Source: Maryland State Department of Education.
Totals may not equal 100% due to rounding.
Children from low-income households, those learning the English language
(ELLs), or those who have a disability exhibit lower levels of school readiness and
achievement gaps exist.
Percentage of Kindergarteners Demonstrating Readiness by Subgroup
39% of the County’s children attending public PreK programs the year prior to starting
school demonstrate kindergarten readiness and exceed the countywide average.
Percentage of Kindergarteners Demonstrating Readiness by Prior Care
38% of the County’s children entered kindergarten classrooms demonstrating the knowledge, skills, and behaviors needed to fully participate in the kindergarten curriculum – within 5 points of the statewide average.
Kindergarten Readiness, School Year 2016-2017
4338
19
3845
17
Maryland Talbot County0
10
20
30
40
50
DemonstratingApproachingEmerging
32% 32% 59% 47%
Language & Literacy
Mathematics Social Foundations
Physical Well-being & Motor Development
* Fewer than 25 students assessed. **As reported by families at kindergarten enrollment.
* Fewer than 25 students assessed.
10 PT ACHIEVEMENT GAP
Readiness by Academic Risk Factor
Readiness by Prior Care**
Public School Demographics
Readiness by Domain
Overall Readiness
Percentage of Kindergarteners Demonstrating Readiness by Domain
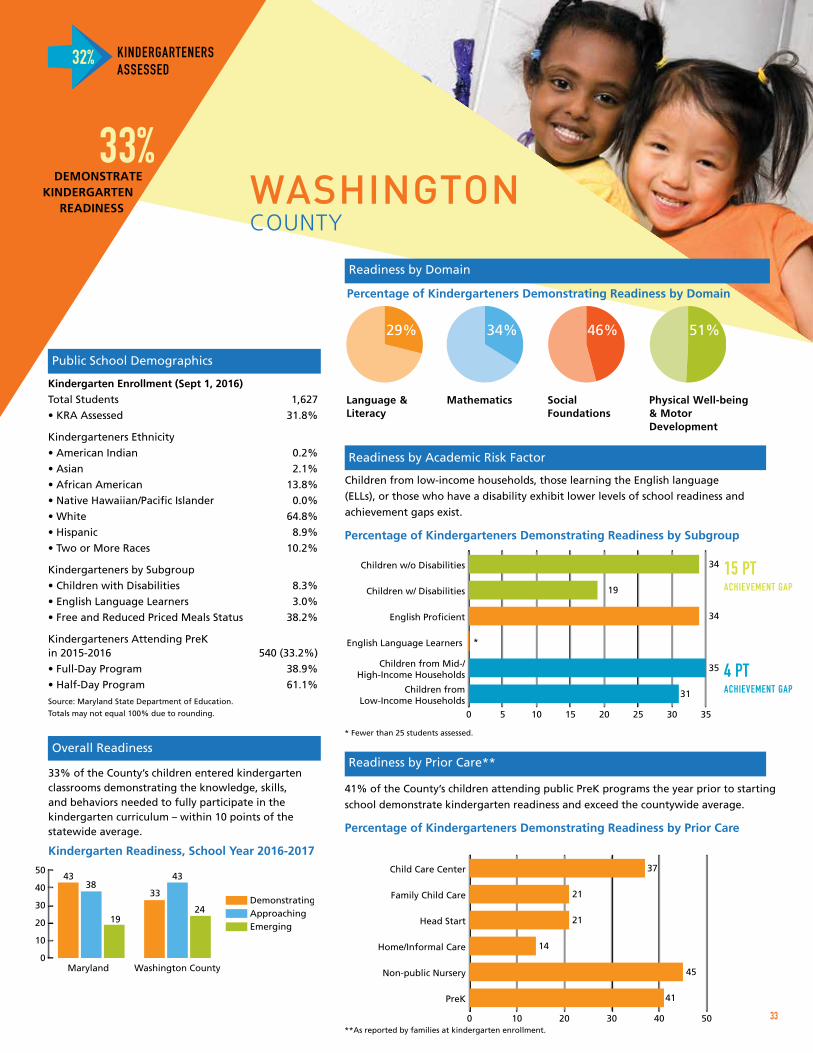
WASHINGTON COUNTY
33% DEMONSTRATE
KINDERGARTEN READINESS
0 5 10 15 20 25 30 35
Children fromLow-Income Households
Children from Mid-/High-Income Households
English Language Learners
English Proficient
Children w/ Disabilities
Children w/o Disabilities 34
19
34
*
35
31
Kindergarten Enrollment (Sept 1, 2016)
Total Students 1,627
• KRA Assessed 31.8%
Kindergarteners Ethnicity
• American Indian 0.2%
• Asian 2.1%
• African American 13.8%
• Native Hawaiian/Pacific Islander 0.0%
• White 64.8%
• Hispanic 8.9%
• Two or More Races 10.2%
Kindergarteners by Subgroup
• Children with Disabilities 8.3%
• English Language Learners 3.0%
• Free and Reduced Priced Meals Status 38.2%
Kindergarteners Attending PreK in 2015-2016 540 (33.2%)
• Full-Day Program 38.9%
• Half-Day Program 61.1%
Source: Maryland State Department of Education.
Totals may not equal 100% due to rounding.
Children from low-income households, those learning the English language
(ELLs), or those who have a disability exhibit lower levels of school readiness and
achievement gaps exist.
Percentage of Kindergarteners Demonstrating Readiness by Subgroup
33% of the County’s children entered kindergarten classrooms demonstrating the knowledge, skills, and behaviors needed to fully participate in the kindergarten curriculum – within 10 points of the statewide average.
Kindergarten Readiness, School Year 2016-2017
4338
19
33
43
24
Maryland Washington County0
10
20
30
40
50
DemonstratingApproachingEmerging
15 PT ACHIEVEMENT GAP
4 PT ACHIEVEMENT GAP
29% 34% 46% 51%
Language & Literacy
Mathematics Social Foundations
Physical Well-being & Motor Development
Percentage of Kindergarteners Demonstrating Readiness by Domain
0 10 20 30 40 50
PreK
Non-public Nursery
Home/Informal Care
Head Start
Family Child Care
Child Care Center 37
21
21
14
45
41
41% of the County’s children attending public PreK programs the year prior to starting
school demonstrate kindergarten readiness and exceed the countywide average.
Percentage of Kindergarteners Demonstrating Readiness by Prior Care
* Fewer than 25 students assessed.
**As reported by families at kindergarten enrollment.
KINDERGARTENERS ASSESSED
KINDERGARTENERS ASSESSED
32%
33
Readiness by Academic Risk Factor
Readiness by Prior Care**
Public School Demographics
Readiness by Domain
Overall Readiness
38% DEMONSTRATE
KINDERGARTEN READINESS
10 PT ACHIEVEMENT GAP
Readiness by Academic Risk Factor
Readiness by Prior Care**
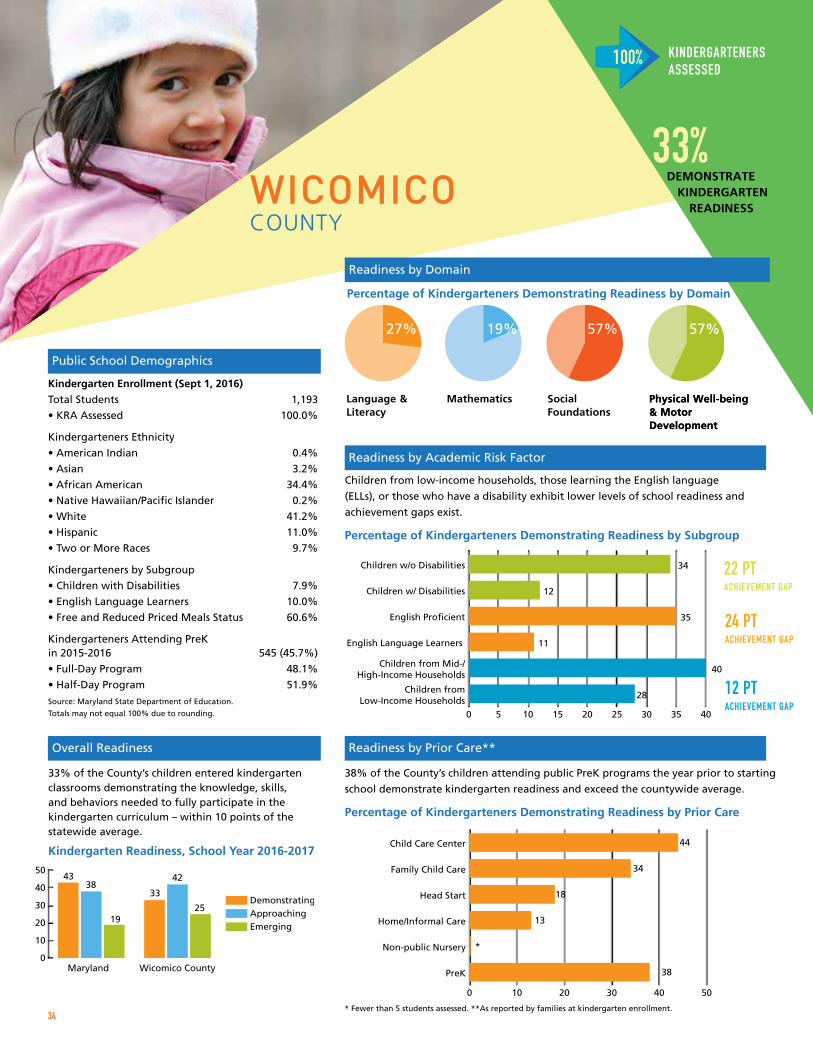
45% DEMONSTRATE
KINDERGARTEN READINESS
100% KINDERGARTENERS ASSESSED
34
22 PT ACHIEVEMENT GAP
Physical Well-being & Motor Development
WICOMICO COUNTY
33% DEMONSTRATE
KINDERGARTEN READINESS
0 10 20 30 40 50
PreK
Non-public Nursery
Home/Informal Care
Head Start
Family Child Care
Child Care Center 44
34
18
13
*
38
0 5 10 15 20 25 30 35 40
Children fromLow-Income Households
Children from Mid-/High-Income Households
English Language Learners
English Proficient
Children w/ Disabilities
Children w/o Disabilities 34
12
35
11
40
28
Kindergarten Enrollment (Sept 1, 2016)
Total Students 1,193
• KRA Assessed 100.0%
Kindergarteners Ethnicity
• American Indian 0.4%
• Asian 3.2%
• African American 34.4%
• Native Hawaiian/Pacific Islander 0.2%
• White 41.2%
• Hispanic 11.0%
• Two or More Races 9.7%
Kindergarteners by Subgroup
• Children with Disabilities 7.9%
• English Language Learners 10.0%
• Free and Reduced Priced Meals Status 60.6%
Kindergarteners Attending PreK in 2015-2016 545 (45.7%)
• Full-Day Program 48.1%
• Half-Day Program 51.9%
Source: Maryland State Department of Education.
Totals may not equal 100% due to rounding.
Children from low-income households, those learning the English language
(ELLs), or those who have a disability exhibit lower levels of school readiness and
achievement gaps exist.
Percentage of Kindergarteners Demonstrating Readiness by Subgroup
38% of the County’s children attending public PreK programs the year prior to starting
school demonstrate kindergarten readiness and exceed the countywide average.
Percentage of Kindergarteners Demonstrating Readiness by Prior Care
33% of the County’s children entered kindergarten classrooms demonstrating the knowledge, skills, and behaviors needed to fully participate in the kindergarten curriculum – within 10 points of the statewide average.
Kindergarten Readiness, School Year 2016-2017
4338
19
33
42
25
Maryland Wicomico County0
10
20
30
40
50
DemonstratingApproachingEmerging
24 PT ACHIEVEMENT GAP
12 PT ACHIEVEMENT GAP
27% 19% 57% 57%
Language & Literacy
Mathematics Social Foundations
Physical Well-being & Motor Development
Percentage of Kindergarteners Demonstrating Readiness by Domain
* Fewer than 5 students assessed. **As reported by families at kindergarten enrollment.
Readiness by Academic Risk Factor
Readiness by Prior Care**
Public School Demographics
Readiness by Domain
Overall Readiness
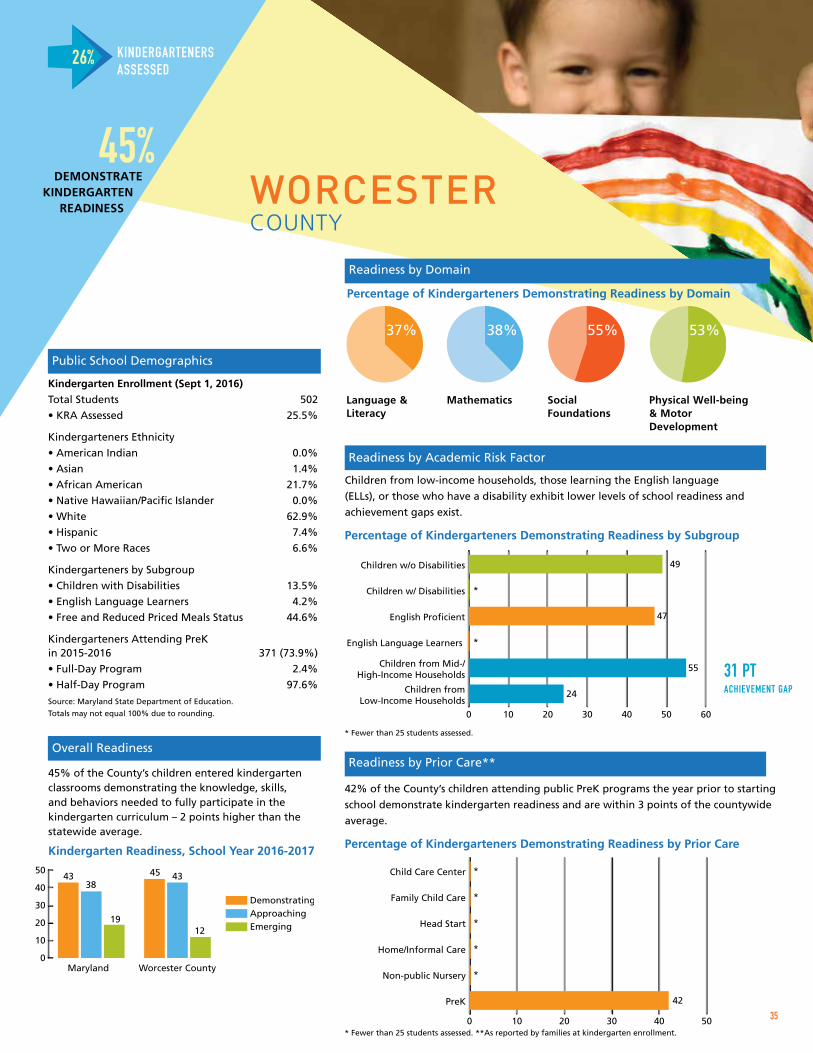
WORCESTER COUNTY
45% DEMONSTRATE
KINDERGARTEN READINESS
0 10 20 30 40 50 60
Children fromLow-Income Households
Children from Mid-/High-Income Households
English Language Learners
English Proficient
Children w/ Disabilities
Children w/o Disabilities 49
*
47
*
55
24
Kindergarten Enrollment (Sept 1, 2016)
Total Students 502
• KRA Assessed 25.5%
Kindergarteners Ethnicity
• American Indian 0.0%
• Asian 1.4%
• African American 21.7%
• Native Hawaiian/Pacific Islander 0.0%
• White 62.9%
• Hispanic 7.4%
• Two or More Races 6.6%
Kindergarteners by Subgroup
• Children with Disabilities 13.5%
• English Language Learners 4.2%
• Free and Reduced Priced Meals Status 44.6%
Kindergarteners Attending PreK in 2015-2016 371 (73.9%)
• Full-Day Program 2.4%
• Half-Day Program 97.6%
Source: Maryland State Department of Education.
Totals may not equal 100% due to rounding.
Children from low-income households, those learning the English language
(ELLs), or those who have a disability exhibit lower levels of school readiness and
achievement gaps exist.
Percentage of Kindergarteners Demonstrating Readiness by Subgroup
45% of the County’s children entered kindergarten classrooms demonstrating the knowledge, skills, and behaviors needed to fully participate in the kindergarten curriculum – 2 points higher than the statewide average.
Kindergarten Readiness, School Year 2016-2017
4338
19
45 43
12
Maryland Worcester County0
10
20
30
40
50
DemonstratingApproachingEmerging
31 PT ACHIEVEMENT GAP
Language & Literacy
Mathematics Social Foundations
Physical Well-being & Motor Development
Percentage of Kindergarteners Demonstrating Readiness by Domain
0 10 20 30 40 50
PreK
Non-public Nursery
Home/Informal Care
Head Start
Family Child Care
Child Care Center *
*
*
*
*
42
42% of the County’s children attending public PreK programs the year prior to starting
school demonstrate kindergarten readiness and are within 3 points of the countywide
average.
Percentage of Kindergarteners Demonstrating Readiness by Prior Care
* Fewer than 25 students assessed.
* Fewer than 25 students assessed. **As reported by families at kindergarten enrollment.
37% 38% 55% 53%
KINDERGARTENERS ASSESSED
KINDERGARTENERS ASSESSED
26%
35
Readiness by Academic Risk Factor
Readiness by Prior Care**
Public School Demographics
Readiness by Domain
Overall Readiness
22 PT ACHIEVEMENT GAP
33% DEMONSTRATE
KINDERGARTEN READINESS
24 PT ACHIEVEMENT GAP
12 PT ACHIEVEMENT GAP
Readiness by Academic Risk Factor
Readiness by Prior Care**
PROPELLING MORE STUDENTS TO READINESSMSDE and its stakeholders across the state are committed
to improving kindergarten readiness and ensuring that all
students are on the path to school success, but too many
children are coming to school unprepared to succeed in
kindergarten. This year, 38% were assessed as “approaching”
readiness, starting school without many of the foundational
skills needed to succeed and requiring differentiated
instruction and support to be ready to engage in curriculum
based on kindergarten standards; 19% possessed minimal
knowledge, skills, and behaviors (“emerging” readiness)
and require substantial assistance.
While we have a significant distance to go to ensure that
all children have the knowledge, skills, and behaviors
required to do kindergarten work and, subsequently, succeed
in school, the MSDE took a huge first-step forward. Its
Ready for Kindergarten (R4K) Maryland’s Early Childhood
Comprehensive Assessment system provides a single
coordinated system for identifying the needs and measuring
the learning progress (knowledge, skills, and behaviors) of all
children from 36 to 72 months (3 to 6 years of age).
In school year 2016-2017, the KRA was administered to 34%
of kindergarteners across the state, and only eight school
systems are currently using this important tool to its full
potential. Obtaining this critical baseline information for
every incoming kindergarten student allows systems to make
the changes that will lead to significant readiness gains and
propel more students to have the knowledge, skills, and
abilities to succeed in kindergarten and beyond.
MEETING THE CHALLENGES HEAD ONMaryland’s kindergarteners need the help of all jurisdictional
leaders, policy makers, schools, early care and education
programs, and families to elevate school readiness. It is
time to:
Assess All Kindergarteners. Although the current KRA results
can be reported with confidence and accuracy, a “sample
administration” method does not provide jurisdictions with
the critical baseline academic information for every child
enrolled. While assessing only a sample of students inherently
lessens the burden on teachers by reducing the number of
students assessed, it severely limits teachers’ knowledge about
each child in their classroom and increases the risk that the
learning needs of students are not being met. In addition,
the current KRA administration method does not make the
Kindergarten Readiness Assessment’s Individual Student
Report (ISR) available to families of every kindergartener,
denying family members the valuable information they need
to further support their child at home.
Support Teachers. School leaders need to provide additional
support and guidance to teachers on ways to integrate the
KRA into the beginning-of-the-year routines and with other
assessment practices, as well as how to use the results to
inform practice and instruction in a meaningful way.
Use the KRA Data to Inform Policy and Practice. The KRA
data should be used to inform our actions, indicate where we
need to focus our energies, and give us a sense of urgency to
improve the outcomes for all children.
Invest in PreK. Implement action steps to carry out the
recommendations from A Comprehensive Analysis of
Prekindergarten in Maryland (Workman, Palaich, & Wool,
2016) which support Maryland’s move toward high quality
prekindergarten expansion to improve young children’s
school readiness skills.
Strengthen Early Care and Education Programs.
Practitioners need a better understanding of what
“kindergarten readiness” means and how the KRA
data identifies achievement gaps and appropriate early
interventions and program enhancements.
Support Innovative Early Childhood Investment Strategies.
Promote public-private partnerships and self-sustaining
community involvement to stimulate action at the state,
jurisdictional, community, and programmatic levels.
CALL TO ACTION
36
SIGNIFICANT CHANGE NEVER HAPPENS OVERNIGHT, BUT IF MARYLAND STAYS COMMIT TED, WE WILL SEE HISTORIC IMPROVEMENTS IN KINDERGARTEN READINESS AND SCHOOL SUCCESS IN THE LONG-TERM.
Scan here or visit www.ReadyAtFive.org for Readiness Matters 2017, including statewide and jurisdictional issue briefs and customized PowerPoints.
For inquiries related to departmental policy, please contact: Equality Assurance and Compliance BranchMaryland State Department of Education200 W. Baltimore StreetBaltimore, Maryland 21201Phone: 410/767.0425TTY/TTD: 410/333.6442Website: http://www.marylandpublicschools.org
For more information about this publication, contact:Division of Early Childhood DevelopmentMaryland State Department of Education200 W. Baltimore StreetBaltimore, Maryland 21201Phone: 410/767.0335Website: http://earlychildhood.marylandpublicschools.org/
For more information and resources to improve school readiness in Maryland, contact:Ready At Five5520 Research Park Drive, Suite 150Baltimore, MD 21228-4791Phone: 410/788.5725Email: [email protected]: www.readyatfive.org
© 2017 Ready At Five
The Maryland State Department of Education does not discriminate on the basis of race, color, sex, age, national origin, religion, disability, or sexual orientation in matters affecting employment or in providing access to programs.