Embed Size (px)
Citation preview

Welcome!
American hospitals crawling towardsElectronic Medical Records (EMR) andComputerized Physician Order Entry (CPOE)
Still <10% of US Hospitals
Must reconcile different information systemsto exchange data accurately and efficiently
Benefits of complete patient data records canbe huge
Speakers to address benefits at various levels ofhealthcare administration

UCSD Medical Center:
Database Driven Decisions
Robert Schoenhaus, Pharm.D.Pharmacoeconomics SpecialistMUE Coordinator
Objectives
Describe limitations of data decision supportat a single academic medical center
Demonstrate value of coordinated data todrive appropriate patient care throughinformed decision making
Review case examples of UCSD medicationuse evaluations that incorporated patientoutcomes taken from several databases

Siemens Pharmacy• Pt Demographics
• Drug/dose• Pharmacy notes
UHC Clinical Resource Management
• Benchmarking outcomes • Pt diagnosis and Procedure codes
TSI (mainframe)• Financial cost/charge
by cost center• Itemized down to
the unit• Coding data
Medical Chart• Everything else…• Clinical rationale• “intangibles”
The “Whole” UCSDPharmacy picture
UCSD Pharmacy Data Collection

Data Capture

A Single Center Experience with
Recombinant Factor VIIa in Orthotopic
Liver Transplantation
Robert Schoenhaus Pharm.D, Linda Awdishu BScPhm,MAS; Sam Martinez Pharm.D, Marquis Hart MD,Thomas Lane MD; UC San Diego Medical Center

Introduction
Options for treatment of blood lossduring liver transplantation:
Packed red blood cells
Platelets
Fresh frozen plasma
Cryoprecipitate
Vitamin K
Factor VIIa ?

Copyright restrictions may apply.
O'Connell, K. A. et al. JAMA 2006;295:293-298.
Estimated Number of Patients Treated With
Recombinant Human Coagulation Factor VIIa by Year

Number of Reported Deaths Among Patients Administered Human
Coagulation Factor VIIa With a Thromboembolic Event by Year
O'Connell, K. A. et al. JAMA 2006;295:293-298.

Comparison of Published Literature
11 vs 15.521 vs 1711 vs. 9.4Fresh FrozenPlasma (units)
4 units vs 9units
2.6 units vs 1.5units
141 ml vs81.8 ml
Platelets
11.1 vs. 137 vs. 98.2 vs. 7Packed RedCells (units)
NR3,500 vs. 1,800NREstimatedBlood Loss (mL)
Planinsic et al(N = 183)(Controlversus
treatment)
De Gasperi et al(N = 12)
(Control versustreatment)
Lodge et al(N = 82)(Controlversus
treatment)
Parameter
No significant differences


Study Objectives
Investigate use of factor VIIa in orthotopicliver transplant patientsDetermine if factor VIIa reduces bloodproduct requirements and operating roomtime in orthotopic liver transplant (OLT)patientsAlter UCSDMC guidelines if needed

Study DesignRetrospective, single center study
Inclusion:
Patients receiving an OLT
Exclusion:
Patients less than 18 years of age
Retransplantation
Multi-organ transplants
ECMO patients
Data collected from patients admitted between January2003-November 2006
Analyzed 119 patients

Model for End Stage Liver Disease (MELD)
Numerical scale from 6 (less ill) to 40 (moreill) that determines the severity of illness for apatient with end stage liver disease based on thefollowing variables
INR
Bilirubin
Creatinine

Methods
Data collectedEstimated blood loss (EBL) duringtransplantation
Blood product administered (in the OR and at 24hrs)
Operating room time (warm ischemia time, coldischemia time)
CBC, chemistries, coagulation studies from the24h preceding OLT through 24h after OLT

Methods
Cost Analysis:Total cost of care is assessed based on:• Accommodations cost
• Pharmacy cost
• Laboratory cost
• Blood cost
• Radiology cost
• Operating room cost (billed by minute)
• Transplant (organ) cost

Data Capture (FVIIa)

StatisticsPrimary Outcome
Log transformation for blood products(non-normal distribution)
• T-test for two independent samples
Secondary Outcomes
Length of stay
• Mann Whitney Test for two samples
Total Costs
• Mann Whitney Test for two samples

Baseline Characteristics
1.4 (0.8-6.5)1.5 (0.9-2.6)Median pre-op INR
15.9 (6-40)16.9 (6-35)Median pre-op MELD
80 (49-145)83 (43-122)Median Weight (kg)
52 (25-68)51 (25-67)Median Age (years)
63%68%Male
Factor VIIaGroup(N=68)
Control Group(N=51)
No significant differences

Primary Outcomes
0.71.31.6Mean LogPLT
11.3 ± 13.415.6 ± 20.5Mean FFP
0.362.22.4Mean Log FFP
6.6 ± 10
2.2
13.4 ± 14.3
Control(units)
4 ± 3.5
2.1
13.8 ± 19.5
Factor 7a
(units)
Mean PLT
0.66Mean logPRBC
Mean PRBC
P ValueVariable
No significant differences

Secondary Outcomes
0.89$55,811($32,567 -479,735)
$57,279($33,096 - 166,673)
Median TotalCosts
0.85$6,667($541 - 27,509)
$6,821($1088 - 19,756)
Median SurgicalCosts
$5,954($517- 42,254)
10 days(1 - 55)
Control
$6,154($563 - 55,742)
12 days(0 - 298)
Factor 7a
0.46Median LOS
0.79Median BloodCosts
P valueVariable
No significant differences

Results
Thrombosis events
2 thrombosis events in factor 7a group
1 thrombosis event in control group
Factor 7a Dose
Median dose 1.7 mg (0.6 - 8.4)
Conclusions
The use of factor VIIa appears to nothave a significant effect on the amountof red blood cells used
The results are consistent with thecurrently available literature that the useof factor VIIa does not provide a benefitin reduction of blood product usage
No difference between blood productcost, surgical costs or total cost of care

Factor VIIa Utilization; UCSD Liver Transplant Service
$0
$5,000
$10,000
$15,000
$20,000
$25,000
$30,000
Aug-
05
Sep-
05
Oct-
05
Nov-
05
Dec-
05
Jan-
06
Feb-
06
Mar-
06
Apr-
06
May-
06
Jun-
06
Jul-06 Aug-
06
Sep-
06
Oct-
06
Nov-
06
Dec-
06
Jan-
07
Feb-
07
Mar-
07

The Use and Outcomes ofAntifibrinolytic Therapy inCardiothoracic Surgery Patients at20 US Academic Medical Centers
Robert Schoenhaus PharmD, Jim Lane PharmD; UC SanDiego Medical Center
Karl Matuszewski PharmD, Mary Ellen Bonk PharmD,Michael J. Oinonen PharmD, MPH; UniversityHealthSystem Consortium

BackgroundImpaired hemostasis and blood loss is of concern in patientsundergoing cardiac surgeryAntifibrinolytics (Aprotinin, Aminocaproic Acid and TranexamicAcid)
Safety questionedMangano DT, et al. The Risk Associated with Aprotinin inCardiac Surgery. NEJM. 2006;354(4): 353-365. (increasedrisk of adverse renal, cardiovascular, and cerebrovascularevents)September 27, 2006, Bayer Pharmaceuticals told FDA thatuse of Trasylol may increase the chance for death,serious kidney damage, congestive heart failure andstrokes
Our objective was to examine these findings using a larger,more recent dataset from a database of academic medicalcenters across the US
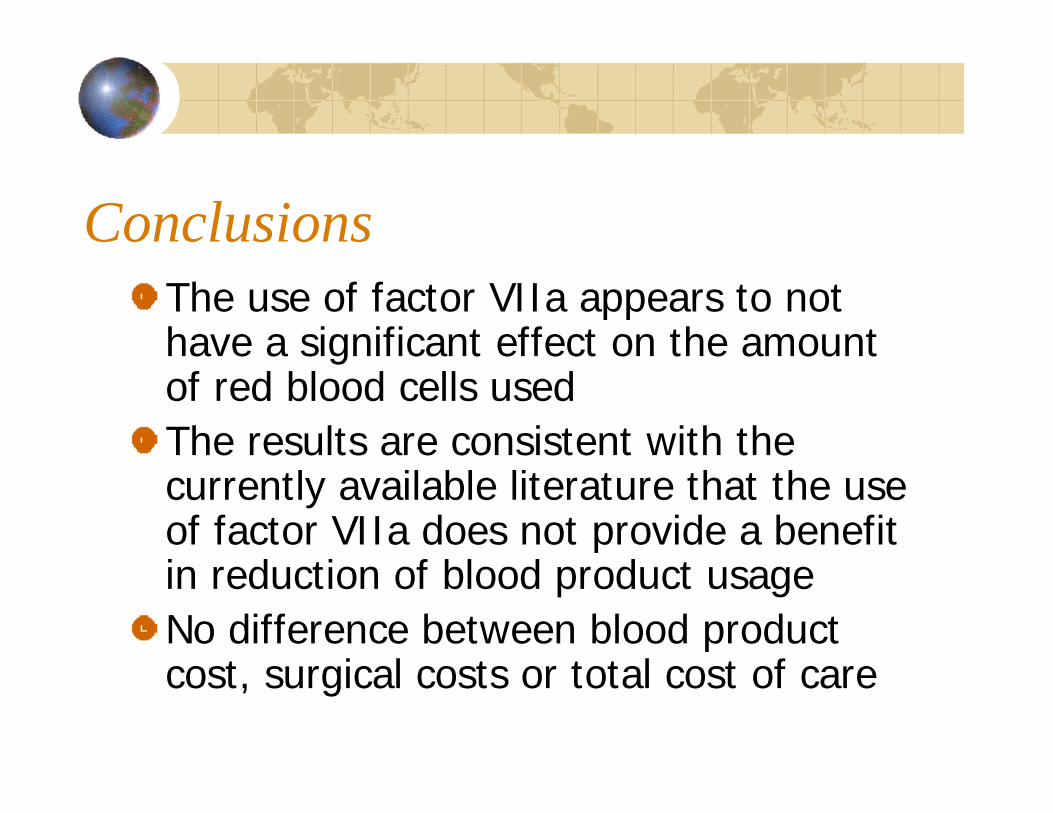
MethodsData Source
University HealthSystem Consortium’s Clinical Resource ManagerDatabase
Quarterly data feeds of administrative data from 50+ academicmedical centers
Inclusion CriteriaPatients discharged between October 2002 and September 2005 withinUHC’s Cardiothoracic Surgery (CTS) product line [Diagnostic RelatedGroups of cardiac surgery in nature (i.e., CABG, Valve, etc)]
ExclusionPatients receiving multiple AF agentsAll tranexamic acid pts (only 17 pts from 4 total hospitals)
Three GroupsAminocaproic Acid (AA) n = 9,751 ptsAprotinin (AP) n = 6,855No AF agent/control n = 46,123 pts

Methods, Cont’Elements Collected
Demographics (i.e. age, gender, race, etc)Comorbidities (Flagged by Comorbidity Software Version 3.1, Agencyfor HealthCare Research and Quality)
HypertensionDiabetes (250.00-250.33, 648.00-648.04, not in DRG 294, 295)Diabetes w/CC (250-40-250.93, 775.1, not in DRG 294, 295)Peripheral Vascular DiseaseAce inhibitor utilization
OutcomesIn-hospital mortalityHemodialysis (procedure code 39.95)Acute renal failure (diagnosis code 584.x)Blood Transfusions (procedure code 99.0X)Post-op Stroke (UHC complication profiler, post-op CVAsecondary diagnosis without a nervous system DRG assignment)

Initial Screen for DifferencesLogistic regression with control forinfluential variables:
Renal failure
PVD
HTN
Diabetes_ccRace
DiabetesSex
ACEI useAge
ComorbiditiesDemographics

Patient CountAll CTS patients
Aprotinin (N = 6,855)
Aminocaproic acid (N = 9,751)
Control (N = 46,123)
CABG only
Aprotinin (N = 3,066)
Aminocap (N = 7,064)
Control (N = 6,879)

Results
Blood Transfusions
Acute Renal Failure
Hemodialysis
Post-OP Stroke
Mortality

P = 0.0288
P = 0.966
P value
0.9900.8300.906
CABG only
Aprotinin vs.Aminocap
1.0680.9340.999
All CTS Pts
Aprotinin vs.Aminocap
95%Confidence
Limits
OddsRatio
BloodTransfusions
Efficacy

P < 0.0001
P < 0.0001
P < 0.0029
P < 0.0001
P < 0.0001
P < 0.2055
P value
2.3781.7462.038CABG only
Aprotinin vs. Aminocap
0.9300.7030.809CABG only
Aminocap vs. Control
2.3131.8272.056All CTS Pts
Aprotinin vs. Aminocap
1.9221.4281.656CABG only
Aprotinin vs. Control
2.5152.0882.291All CTS PtsAprotinin vs. Control
1.1870.9641.069All CTS Pts
Aminocap vs. Control
95%Confidence
Limits
OddsRatio
Acute Renal Failure
Secondary ICD-9Diagnosis = 584.X

P < 0.0001
P < 0.0001
P < 0.0008
P < 0.0001
P < 0.0001
P < 0.1142
P value
4.2442.7343.406CABG only
Aprotinin vs. Aminocap
3.1962.2962.709All CTS Pts
Aprotinin vs. Aminocap
3.4202.6913.034All CTS Pts
Aprotinin vs. Control
0.8580.5600.693CABG only
Aminocap vs. Control
2.9211.9352.378CABG only
Aprotinin vs. Control
95%Confidence
Limits
OddsRatio
Hemodialysis
Secondary ICD-9procedure = 39.95
1.2870.9731.119All CTS Pts
Aminocap vs. Control

P < 0.0001
P < 0.0005
P < 0.0206
P < 0.0001
P < 0.0003
P < 0.0041
P value
1.8781.1921.496CABG only
Aprotinin vs. Control
2.1151.4901.775All CTS Pts
Aprotinin vs. Aminocap
1.4481.1161.271All CTS Pts
Aprotinin vs. Control
0.9600.6120.766CABG only
Aminocap vs. Control
2.5071.5471.969
CABG only
Aprotinin vs. Aminocap
95% ConfidenceLimits
Odds RatioMortality
(In Hospital)
0.9320.6890.801All CTS Pts
Aminocap vs. Control

P = 0.1331
P < 0.0001
P = 0.0012
P = 0.0006
P < 0.0001
P < 0.0001
P value
1.7980.9251.290CABG only
Aprotinin vs. AA
2.3921.2401.722CABG only
Aminocaproic vs. control
3.1551.5022.177CABG only
Aprotinin vs. control
1.9051.1911.506All CTS Pts
Aprotinin vs. Aminocap
5.0833.3454.123All CTS Pts
Aprotinin vs. control
95%Confidence
LimitsOdds RatioPost-Op Stroke
3.5182.3362.866
All CTS Pts
Aminocaproic Acid vs. control

Conclusions
Aprotinin appeared to have superiorityfor reducing blood transfusions in CABGpopulation, but was strongly correlatedwith negative outcomes: ARF,hemodialysis, and mortality
Similar to Bayer findings (exc. CHF)

Aprotinin Dollars Spent (UCSD)
$0
$5,000
$10,000
$15,000
$20,000
$25,000
$30,000
$35,000
Jul-
05
Aug-
05
Sep-
05
Oct-
05
Nov-
05
Dec-
05
Jan-
06
Feb-
06
Mar-
06
Apr-
06
May-
06
Jun-
06
Jul-
06
Aug-
06
Sep-
06
Oct-
06
Nov-
06
Dec-
06
Jan-
07
Feb-
07
Mar-
07

Questions?