Embed Size (px)
Citation preview

Santander Consumer Bank
Q1 2018 Investor Presentation

Who we areSantander Consumer Bank is a Nordic bank with more than
1,400 colleagues in Sweden, Norway, Denmark and Finland, with a long history
in the Nordics, and with global strength by being a part of Banco Santander.
We are one of the largest Nordic banks providing loans and credits,
credit cards, deposits and insurance to private customers.
We work with the best people in an engaged, challenging and passionate
organization that provides great opportunities for professional growth.
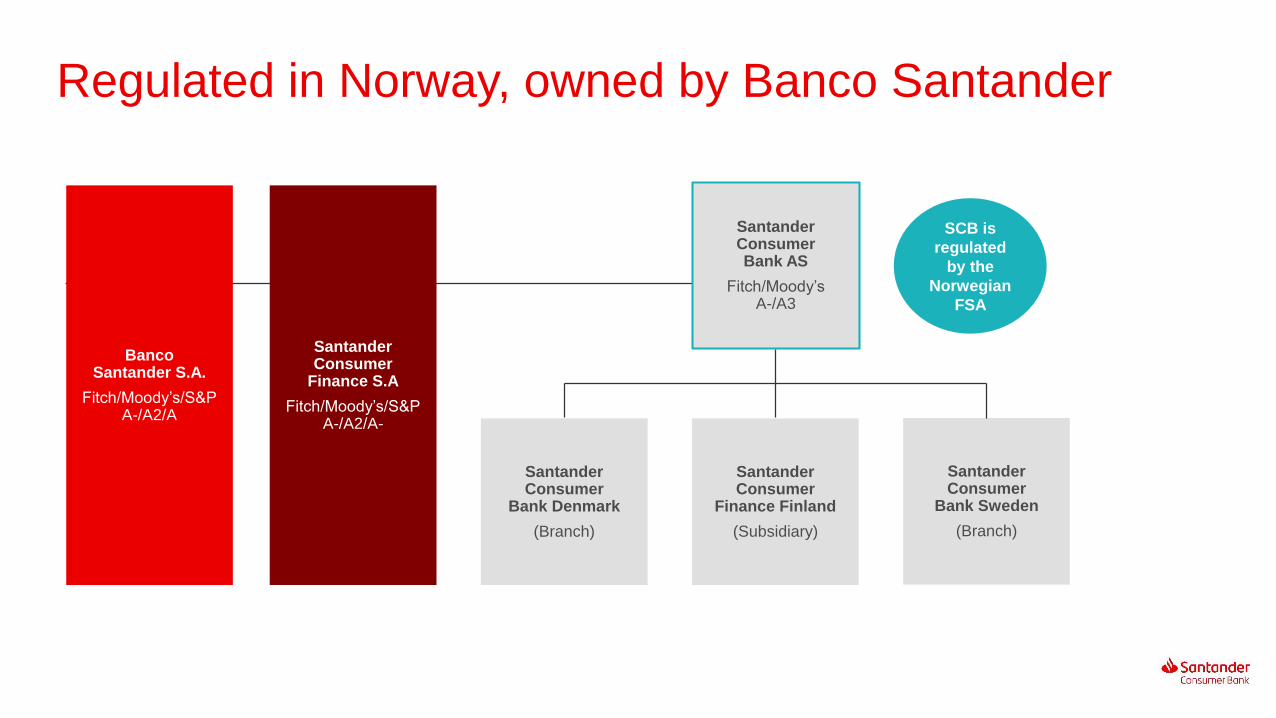
Regulated in Norway, owned by Banco Santander
SCB is
regulated
by the
Norwegian
FSA
Santander Consumer
Finance S.A
Fitch/Moody’s/S&PA-/A2/A-
Santander Consumer Bank AS
Fitch/Moody’sA-/A3
Santander Consumer
Bank Denmark
(Branch)
Santander Consumer
Finance Finland
(Subsidiary)
Santander Consumer
Bank Sweden
(Branch)
BancoSantander S.A.
Fitch/Moody’s/S&PA-/A2/A

Q1 Key figures
Total
deposits
52.2NOK Bn
Gross
Outstanding
Loans
144.5NOK Bn
Profit Before
Tax
744NOK million
Core capital
CET1
15.5per cent
People
1,432employees
Customers
1.41million
Return on
Asset
2.1per cent
Partners
4,785merchants
+4,200car dealers
Source: SCB Q1 2018 Report and Management Figures as per Q1 2018

History
Bankia Bank acquired
(credit cards)
ELCON Finance becomes
Santander Consumer
Bank AS (SCB)
ELCON Finance
A leading Norwegian
company within equipment
leasing, factoring and auto
financing
Santander Consumer
Finance (SCF) acquires
ELCON
Company
demerges
Auto finance retained in
Norway and Sweden
Launch consumer
loans Norway
Start up auto finance in
Denmark and Finland
GE Finland acquired
(auto finance,
consumer loans)
Consumer loans in
Sweden (2012) and
Denmark (2013)
Deposits launched in
Norway and Sweden (2013)
Deposits launched in
Denmark in 2014
1963
2004
2005
2006/07
2009
2012/13
2015
SCB merges with
GE Money Bank
SCB becomes
leader within car
finance and
unsecured loans in
the Nordic region
€
€

Main product areas
Auto & Leisure Unsecured InsuranceDeposits
Saving products
with high interest
rates provided to
private customers
Insurance products
related to payment
protection, auto,
health and travel,
offered to private
customers
Loans, credit cards and sales
finance services offered to private
customers
Loans and financial services
provided to private customers and
car dealers
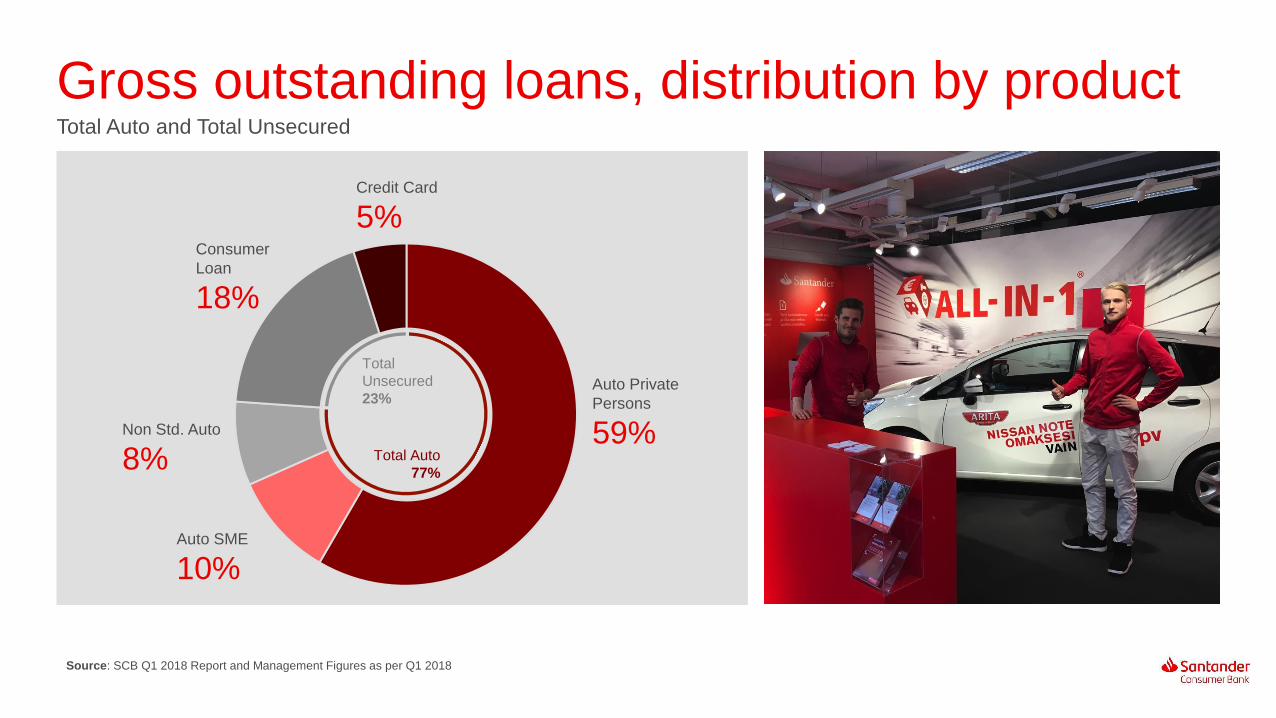
Gross outstanding loans, distribution by productTotal Auto and Total Unsecured
Auto SME
10%
Non Std. Auto
8%
Consumer
Loan
18%
Credit Card
5%
Auto Private
Persons
59%
Total
Unsecured
23%
Total Auto
77%
Source: SCB Q1 2018 Report and Management Figures as per Q1 2018

Our auto products
Saving products with high interest
rates provided to private customers
Auto &
Leisure
Loans and financial services
provided to private
customers SMEs and car dealers
Distribution
Online
Dealers
Cross sale
Auto Loans & Hire Purchase
Customers
• Private Customers
• Business Customers
Distribution
• Online direct distribution
• Indirect distribution with
dealers and importers
Stock & Demo Financing
• Finance of dealer inventories
• Importer agreements (new)
• Direct to dealers (used)
Customers
• Private Customers
• Business Customers
Distribution
• Dealers
• Direct SME
Auto Leasing

Position within Auto
Source Norway: Internal calculations based on data from Finansieringsselskapenes Forening as per Q1 2018
Source Finland: Internal calculations based on data from Finnish Transportation Safety Agency (Trafi) as per Q1 2018
Source Denmark: Internal calculations based on data from Finans og Leasing as per Q1 2018
Source Sweden: Internal calculations based on data from Finansbolagens Förening as per Q1 2018
Partnerships with
21brands
+4.200dealers
Position and market share in the Nordics
#1Position
24%market share
#1Position
23%market share
#1Position
39%market share
#4Position
9%market share

Unsecured products
Sales finance Credit cardsDirect loans
Unsecured
Loans, credit cards and sales finance services
offered to private customers
Distribution
Online
Stores
Cross sale
Portfolio Management
Distribution
Online
Stores
Cross sale
Distribution
Online
Agents
Cross sale
GDPRPSD2
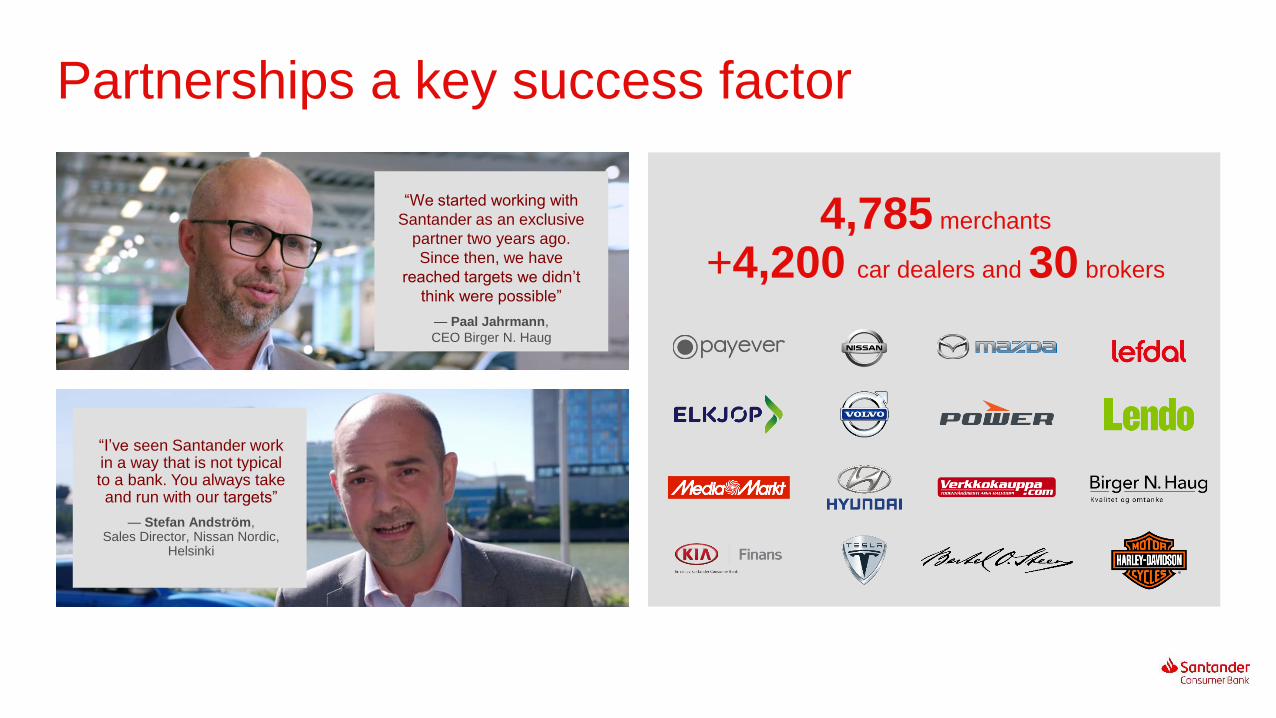
Partnerships a key success factor
4,785 merchants
+4,200 car dealers and 30 brokers
“We started working with
Santander as an exclusive
partner two years ago.
Since then, we have
reached targets we didn’t
think were possible”
— Paal Jahrmann,
CEO Birger N. Haug
“I’ve seen Santander work in a way that is not typical to a bank. You always take and run with our targets”
— Stefan Andström, Sales Director, Nissan Nordic,
Helsinki

Financials

Q1 2018 | Santander Group key figures
Banco Santander S.A.
Total assets 1.44 (trillion €)
Branches globally13,637 (units)
Headcount 201,900
Customers139 (million)
Profit After Tax 2,054 (million €)
Santander Consumer Finance S.A.
Loans 100 (billion €)
European countries15
Headcount 15,850
Customers 20 (million)
Profit After Tax 351 (million €)
Source: Banco Santander and SCF Q1 2018 Institutional Presentation

Q1 2018 | SCB overview
NordicQ1 2018 results
144.5 Bn Gross Outstanding
Loans
744 MMProfit Before Tax
Norway
Auto Loans
Unsecured Loans
Profit Before Tax
45.9 Bn
11.5 Bn
291 MM
Denmark
Auto Loans
Unsecured Loans
Profit Before Tax
23.5 Bn
5.7 Bn
211 MM
Finland
Auto Loans
Unsecured Loans
Profit Before Tax
23.2 Bn
2.6 Bn
97 MM
Sweden
Auto Loans
Unsecured Loans
Profit Before Tax
18.6 Bn
13.4 Bn
144 MM
40% Norway
20% Denmark
22% Sweden
18% Finland
Source: SCB Q1 2018 Report
% of Gross Outstanding Loans

Growing presence in the NordicsWith a doubling of Gross Outstanding Loans in the past 5 years
Source: SCB Annual Reports (2012 –2017) and Q1 2018 Report
59,575(mNOK)
71,891(mNOK)
83,322(mNOK)
116,297(mNOK)
124,625(mNOK)
143,615(mNOK)
59,575
71,891
83,321
116,297124,625
143,615149,053
2012 2013 2014 2015 2016 2017 Q1 2018
mNOK
mNOK
mNOK
mNOKmNOK
mNOK mNOK
16%
40%7%
15%
21%
4%

Solid profitabilityStrong profitability, especially since the merger with GE Money Bank in 2015
PBT development NOK MM
1 1361 393 1 321
1 942
3 250¹
3 995¹
744
2012 2013 2014 2015 2016 2017 Q1 2018
Source: SCB Annual Reports (2012 –2017) and Q1 2018 Report
1) The Group reclassified issued AT1 capital of 2,25 Bn NOK from liabilities to equity in 2017. Interest expenses for 2017 of 169 MM NOK are consequently presented in equity instead of profit and
loss, with related tax impact presented as part of other equity. Comparison figures are changed similarly. Please see principle 6) on page 40 in the 2017 Annual Report for further details.
23%
CAGR

Strong financial performanceEvidencing well-managed growth
Source: SCB Annual Reports (2012 –2017) and Q1 2018 Report
ROA = PBT / ANEA (Annualized)
NII Ratio = Net Interest Income / ANEA (Annualized)
Cost/Income Ratio = OPEX / Gross Margin (OPEX: Total Operating Costs)
4.5 4.54.8
5.24.9 4.7
2013 2014 2015 2016 2017 Q1 2018
42 4448
3740 39
2013 2014 2015 2016 2017 Q1 2018
2.1
1.71.9
2.73.0
2.1
2013 2014 2015 2016 2017 Q1 2018
Return on AssetsPer cent
Net Interest Income RatioPer cent
Cost / Income RatioPer cent

Group Balance Sheet summaryRobust balance sheet driven by growth in loans to customers
Q1 2018• Deposits with external institutions: Significant increase due to
repayment of EUR bond maturity in April.
• Loans to customers: Growth in gross loans are partially off-set
by IFRS9 impact on LLR
• Other financial assets: Increased liquidity portfolio due to bond
purchases in Q1 2018
• Other assets: Change mainly driven by decreased consignment
• Debt to credit institutions: Increased levels of intragroup funding
due to large EUR bond maturity
• Deposits from customers: Increase in deposits in accordance
with funding strategy
• Debt established by issuing securities: Increase issuance in
unsecured bonds
NOK MM Q1 2018 Q4 2017 Δ 18/17 %
Deposits with external institutions 7 357 3 291 4 066 124 %
Loans to customers (net) 140 979 140 793 186 0 %
Other financial assets 8 557 7 119 1 438 20 %
Other assets 7 446 7 896 -450 -6 %
Total assets 164 339 159 100 5 239 3 %
Debt to credit institutions 33 654 31 020 2 634 8 %
Deposits from customers 52 244 50 617 1 627 3 %
Debt established by issuing securities 53 009 51 270 1 739 3 %
Other liabilities 2 876 3 260 -384 -12 %
Subordinated loan capital 1 709 1 753 -44 -3 %
Total equity 20 848 21 179 -331 -2 %
Total liabilities and equity 164 339 159 100 5 239 3 %
Source: SCB Q1 2018 Report

Group Income Statement summaryP&L showing steady growth with increasing profits
NOK MM Q1 2018 Q1 2017 Δ 18/17 %
Interest income and similar income 2 036 1 895 141 7 %
Interest expenses and similar expenses -340 -302 -38 13 %
Net interest income 1 696 1 593 103 6 %
Commissions and fees 105 135 -30 -22 %
Other product and funding related income and cost 27 -23 50 217 %
Gross margin 1 828 1 705 123 7 %
Salaries and personnel expenses -315 -282 -33 12 %
Administrative expenses -369 -377 8 -2 %
Depreciations and amortisation -28 -26 -2 8 %
Net operating income 1 116 1 020 96 9 %
Other incomes and costs -1 -1 0 0 %
Total losses on loans, guarantees etc. -372 -108 -264 244 %
Profit before tax 744 911 -167 -18 %
Income tax -187 -216 29 -13 %
Profit after tax 557 695 -138 -20 %
Source: SCB Q1 2018 Report
Q1 2018• Net Interest Income: Increased due to higher volumes and
lower cost of funding
• Commissions and fees: Single premium insurance product
closed in Norway
• Salaries personnel and administrative expenses: Increase in
salaries and personnel expenses reflects a higher activity level
throughout the Nordic region in Q1 2018 compared to Q1 2017
• Total losses: Significantly increase in loan losses mainly driven
by the effect of the new methodology in IFRS 9 which results in
higher reserves coverage for the same credit risk levels

Self-funding is a strategic focusThree pillars approach provides funding flexibility
Self-funding pillars¹
Securitization Unsecured Deposits
6 outstanding
transactions across
Nordics
Represents a low-cost
and stable funding
source
NOK 8.101 billion
outstanding in the
Norwegian bond market
including NOK 850 MM
in Commercial Paper
SEK 5.45 billion
outstanding in the
Swedish bond market
EUR 2.75 billion
outstanding from four
Benchmark
transactions
In Norway deposits are
guaranteed up to NOK
2 MM
In EU countries the
guarantee is up to EUR
100,000
NOK 52.2 billion in total
deposits across
Norway, Sweden and
Denmark
2011 2012 2013 2014 2015 2016 2017 Q1 2018
Parent funding Securitization Deposits Unsecured Bonds
22% 28%
50%62%
70% 70% 77% 76%
2011 2012 2013 2014 2015 2016 2017 Q1 2018
Funding Composition
Self-funding ratio
Source: SCB Q1 2018 Report
1) Outstanding amounts/transactions as per Q1 2018
24%
29%
38%
9%

Deposits at a glanceConsolidated total balance: NOK 50.6 Bn
43%of total balance
Saving account
29%of total balance
Saving account
Notification product
Term deposits
28%of total balance
Saving account
Notification product
Source: SCB Q1 2018 Report
Deposit guarantees: Norway NOK 2 million | Sweden SEK 950,000 | Denmark EUR 100,000 equivalent
Saving account• Floating interest rates
• Full flexibility
Notification product• Withdrawals with 31 days notice
• Floating interest rates
Term deposits• Fixed interest rates
• Balance locked for 24 months
• Fees for withdrawals within term period

Unsecured Senior & Commercial Paper Funding2017 and 2018 YTD summary
New Issuances
Repurchases
Net New funding
Maturities
Total Outstanding¹
Preferred Format
Preferred Tenor
850 million
-
850 million
1,850 million
8,101 million
FRN
3 – 5 year
1,000 million
-
1,000 million
-
5,450 million
FRN
3 – 5 year
500 million
-
500 million
-
2,750 million
FXD
5 year
Source: Bloomberg
1) Outstanding amounts as per Q1 2018
2) Outstanding amounts as per Q4 2017
20181 NOK SEK EUR
New Issuances
Repurchases
Net New funding
Maturities
Total Outstanding²
Preferred Format
Preferred Tenor
20172
4,050 million
800 million
3,250 million
-
9,101 million
FRN
3 – 5 year
2,000 million
-
2,000 million
2,410 million
4,450 million
FRN
3 – 4 year
500 million
-
500 million
-
2,250 million
FXD
3 year
NOK SEK EUR

Unsecured FundingMaturity profile 2018 – 2022 for Senior Unsecured and Commercial Paper
Total Maturity (EUR MM)
88
357
16636
19197
141
97
146
750
1,000
500
2018¹ 2019 2020 2021 2022
EUR
SEK
NOK
750
1,000
500
2018¹ 2019 2020 2021 2022
850
3,451
1,600
350
1,850
2018¹ 2019 2020 2021 2022
1,0001,450
1,000
1,500
2018¹ 2019 2020 2021 2022
Source: Bloomberg as per Q1 2018
FX: SEK/NOK 0.9409 | EUR/NOK 9.6770 | EUR/SEK 10.2843
1) Remaining maturities for 2018
NOK MM
SEK MM
EUR MM

Strict capital requirements in Norway
1) Portfolio allocation per 31.03.18, show a countercyclical buffer requirement for SCB Group of 1,14% and SCB AS of 1,46%
Ensuring strong capitalization of the bank
~11.3%
Pillar 1 CET1-requirement
2.3%
Pillar 2 CET1-requirement
~13.6%
Minimum CET1 requirement 4.5%
Conservation buffer 2.5%
Countercyclical buffer ~1.3%1
Systemic risk buffer 3%
~11.3%
CET1-ratio requirement for 2018 Capital requirements in Norway
• Strict requirements in Norway with the
inclusion of additional buffer requirements and
a high countercyclical buffer requirement
• Pillar 2 requirement for SCB was set to 2.3%
by the Norwegian FSA, applicable from
January 2018
• Countercyclical buffer requirement is
calculated as a weighted average of the risk
weighted assets in the countries where the
bank operates
• For 2018 the countercyclical buffer for SCB will
be 2% in Norway and Sweden and 0% in
Denmark and Finland¹

Strong Capital PositionCET1 ratio of 15.5%
Capital ratios evolution SCB GroupPer cent
15.3 15.1 15.5 15.2 15.5
17.8 17.4 17.5 17.2 17.5
19.1 18.7 19.1 18.8 19.1
11.4 11.5 12.011.5 11.7
2015 2016 2017 Q1 2018 Q1 2018
CET 1 Tier 1 Tier 2 Leverage ratio
Source: SCB Q1 2018 Report
Full IFRS9
impact
With IFRS9
transitional rules
• Net capital impact of
implementation of IFRS9 was
NOK 457 million for SCB
Group
• SCB has notified the FSA that
we will use the transitional
rules for IFRS9 capital impact
when calculating capital ratios
• SCB Group had a CET1-ratio
of 15.5% per year end using
transitional rules for IFRS9
impact
• SCB Group had a strong
Leverage Ratio per year end
of 11.7%

Risk Management Recent developments
• Answer to the BIS initiative
on risk data aggregation
and risk reporting
• Risk data captures all types
of risks with appropriate
accuracy and timeliness
• Complete, precise and
regular data for effective
risk management
• SCB was approved an IRB
bank in 2015
• The operational benefits of
IRB are related to improved
client information
• IRB requires the bank to
increase the accuracy of
models, improve scoring,
processes and routines
and in general the risk
management practice of
the bank
• IFRS9 parameters are
developed leveraging from
the IRB system
• Strong governance in place
including internal validation
and audit
• Engine developed, tested,
in use to face the new
impairment requirements
• Business strategy defined
by risk appetite.
• All risks to be managed
• Forward-looking approach
• Independent risk function
• Robust data management
• Risk culture (greater
synergy and integration of
IRB into management)

Tight risk controls result in stable performance Risk ratio breakdown
NPL Ratio 2013 2014 2015 2016 2017 Q1 2018
Denmark 0.71% 0.61% 0.98% 1.24% 1.17% 1.29%
Finland 1.04% 0.89% 0.72% 0.71% 0.74% 0.77%
Norway 2.47% 2.36% 3.40% 3.36% 3.50% 3.66%
Sweden 0.48% 0.61% 1.53% 1.22% 1.12% 1.19%
Nordic 1.61% 1.48% 2.05% 2.01% 1.96% 2.08%
NPL ratio3
Coverage ratio4
Source: Management Figures as per Q1 2018
1) Auto includes Stock Finance
2) Unsecured includes Direct Loans, Credit Cards and Sales Finance (“Durables”)
3) NPL ratio = Non-performing loans / Gross outstanding loans
4) Coverage Ratio = Loan Loss Reserves (Write Downs) / NPL
1.61 1.482.05 2.01 1.96 2.08
2013 2014 2015 2016 2017 Q1 2018
98.6126.9
107.7 113.696.9
114.1
2013 2014 2015 2016 2017 Q1 2018
NPL Ratio 2013 2014 2015 2016 2017 Q1 2018
Auto1 1.20% 1.09% 1.03% 1.10% 1.07% 1.14%
Unsecured2 5.32% 4.77% 4.95% 4.89% 4.92% 5.28%
Nordic 1.61% 1.48% 2.05% 2.01% 1.96% 2.08%
Coverage Ratio 2013 2014 2015 2016 2017 Q1 2018
Auto1 75.5% 89.4% 95.4% 90.4% 91.8% 111.5%
Unsecured2 136.4% 148.1% 111.8% 113.1% 100.6% 115.9%
Nordic 98.6% 126.9% 107.7% 113.6% 96.9% 114.1%
Per cent
Per cent

Key takeaways
Anchored by a global
banking franchise
Sustained market
leader in auto
Building out position in
unsecured space
Robust financial results
Stable credit risk

Santander & Santander Consumer Finance
April 2018

Section divider
01
1. Santander

Santander, a leading financial group
31
Headcount 201,900
Branches (units) 13,637
Shareholders (millions) 4.11
Customers (millions) 139
Total assets (trill. €) 1.44
Key Figures Mar’18
Attributable Profit 2017 (mill. €) 6,619
Attributable Profit Q1’18 (mill. €) 2,054

The Santander vision
32
to help people and businesses prosper
to be the best retail and commercial bank, earning the lasting
loyalty of our people, customers, shareholders and communities
Our
purpose
Our aim
A bank
that is
We are committed to generating growth
in a sustainable, predictable and responsible manner
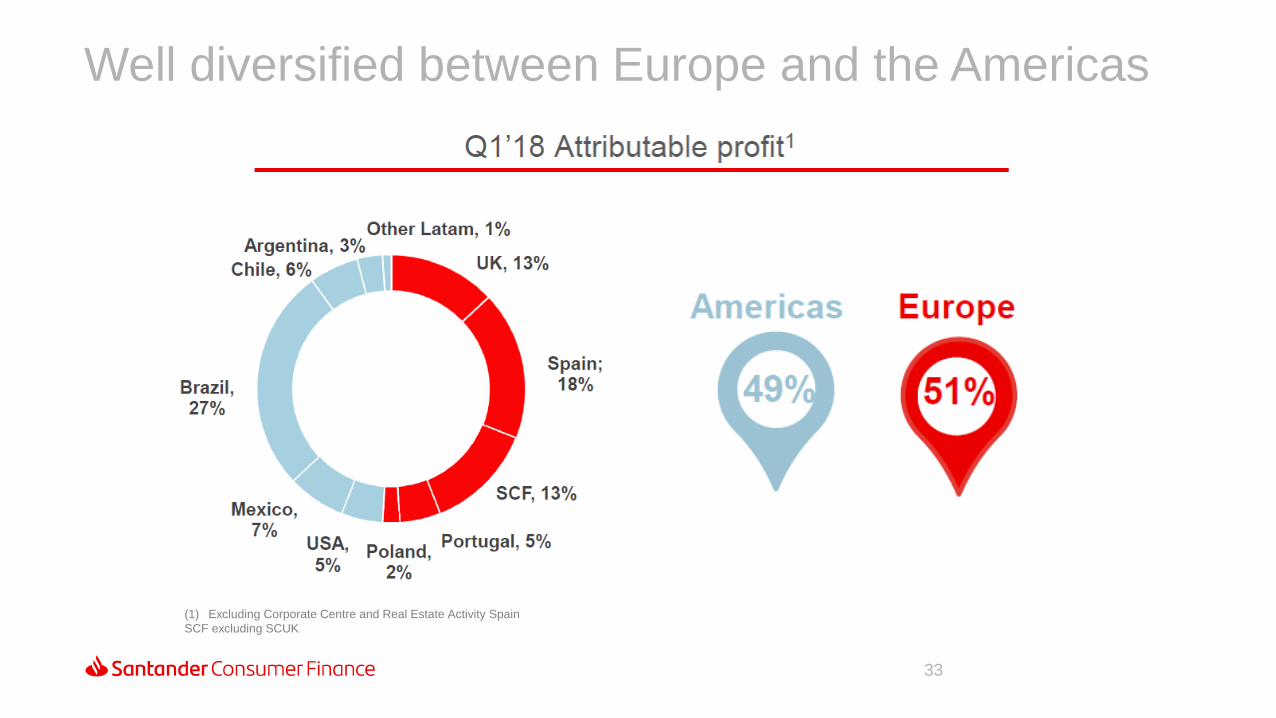
Well diversified between Europe and the Americas
33
(1) Excluding Corporate Centre and Real Estate Activity Spain
SCF excluding SCUK

With leading positions in its core markets
34
USA
Mkt. share1,4: 3%
Branches: 683
Argentina
Mkt. share1: 10%
Branches: 482
Mkt. share1: 16%
Branches: 563
PortugalBrazil
Mkt. share1: 9%
Branches: 3,465
UK
Mkt. share2: 10%
Branches: 808
Mkt. share1,6: 18%
Branches: 2,843
Spain
Mkt. share1: 19%
Branches: 439
Chile
Mkt. share1,3: 10%
Branches: 576
Poland
Mkt. share1: 13%
Branches: 1,401
Mexico
Nº countries5: 15
Branches: 546
SCF
7
(1) Lending (2) UK mortgages (excluding Social Housing), Consumer credit and commercial lending (excluding Financial Institutions) (3) Including Santander Consumer Finance business (SCF)
• (4) In the states where the Group operates. (5) Including SCF UK (6) Including Banco Popular. Excluding it: 13% (7) Argentina and Portugal only include private sector banks.
• Data: Dec’17 or latest available. Branches do not include Santander Consumer Finance business

Q1’18 Highlights
35
(1) Underlying attributable profit change vs. Q4’17: +7% (+10% in constant euros)
(2) Total dividends charged to 2018 earnings are subject to the Board and AGM approval

Predictable growth and balance sheet strength
36
Note: YoY change, including Popular in 2018. % change in constant euros. Loans excluding reverse repos. Funds: deposits excluding repos + marketed mutual funds
Q1’18 performance

Excellent YoY performance driven by strong top-line growth and lower provisions
37
Note: Contribution to the SRF (net of tax) recorded in Q2’17 (EUR -146 mn). Contribution to the DGF (net of tax) in Q4’17 (EUR -186 mn)
Q1’18 performance

On track to meet our 2018 targets
38
Q1’18 performance
(1)% change in constant euros (2)Total dividends charged to 2018 earnings are subject to the Board and AGM approval (3) Underlying RoTE: 11.8%

Section divider
02
2. Santander Consumer Finance

40
PoS partnerts (thousand) >130
Market positions1 Top 3
Loans (bill. €) 100
Deposits (bill. €) 37
European countries 15
Underlying Attrib. Profit Q1’18 (mill. €) 351
Customers (million) 20
Grupo Santander is the
main and unique
shareholder of SCF ...
… and at the same time,
SCF acts as a holding
for its subsidiaries
through a banking license
Operations are mainly
done through points-of-
sale (dealers and
retailers)
Key Figures Mar’18
Santander Consumer Finance, European leader in the consumer finance industry
Underlying Attrib. Profit 2017 (mill. €) 1,373
SCF: Management perimeter (i.e. including SCUK)
Attributable profit without non-recurring (provisions or capital gains) (1) In its main geographies by market share in New Business car loans or durables

41
With recurrent profits through the cycle
2009 2010 2011 2012 2013 2014 2015 2016 2017
472555
744825
895 908
1 093
1 238
1 373
Q1’2018
Underlying Attrib. Profit
€351 million
(+2% YoY)
Underlying Attributable Profit€ Million
SCF: Management perimeter (i.e. including SCUK)
Attributable profit without non-recurring (provisions or capital gains)

42
A differential and proven business model based on five key levers
High diversification and European leadership
A
Advanced car financing platform and strong foothold in consumer finance
B
Efficiency leadership with proven integration capabilities
C
Best-in-class risk and collections capabilities
Sound funding structure
SCF’s
business model
D
E

43
Well spread across Europe and well balanced between car and consumer loans
A
SCF: Management perimeter (i.e. including SCUK). NOTE: SCF’s portfolio also includes mortgages (6%), corporate loans (1%) and other loans (1%).
SCF Portfolio: €100 bnMar’18
Well spread across 15 European
countries
Important foothold in the largest
economies
74% portfolio in AAA & AA countries
Car financing represents the biggest
share of the portfolio: 70%
Consumer lending (durables financing,
cash loans and credit cards): 21%

44
Advanced car financing platform and strong foothold in consumer finance
B
TOP retail chain agreements throughout
Europe
>55,000 POS partners
>4 MM consumer loans per year
TOP 3 in core geographies
Digital direct business platforms
Strong foothold in consumer finance
Consumer Finance: Durable financing, Personal loans and Credit Cards
Presence in all main European markets
TOP positions in its geographies,
including the 5 biggest European auto
markets: Germany, France, UK, Italy
and Spain
>75.000 POS (captive and non-captive)
The longest European captive
agreements base: more than 100
agreements with 15 manufacturers
Advanced car financing platform

45
One of the best efficiency in the industry, with proven capabilities to make the most of integrations
C
• Germany
• Germany
• Austria
• Finland
• Germany
• Benelux
• Norway
• Sweden
• Denmark
• France• Germany• Italy• Poland
• Spain• Portugal• Belgium• Austria
• Netherlands• Switzerland• UK
Integrations 2008 2009 2011 20142014
• Spain
2015 …
43,4
47,548,7
43,3
46,3
48,4FY2016 FY2017
Cost-to-Income
ratio
SCF: Management perimeter (including SCUK) . Peers: Crédit Agricole Consumer Finance, BNP Personal Finance. Source: company websites.
Note.- BNP Personal Finance 'Share of Earnings of Equity-Method Entities’ reported after gross income. CA Consumer Finance Gross Operating Income in their accounts is Revenues minus
Operating Expenses, not including "equity affiliates results“. Both are reclassified for comparative purposes with SCF. Public report FY 2017 C/I ratios: CA=51,0%; BNP 49,3%
(%)
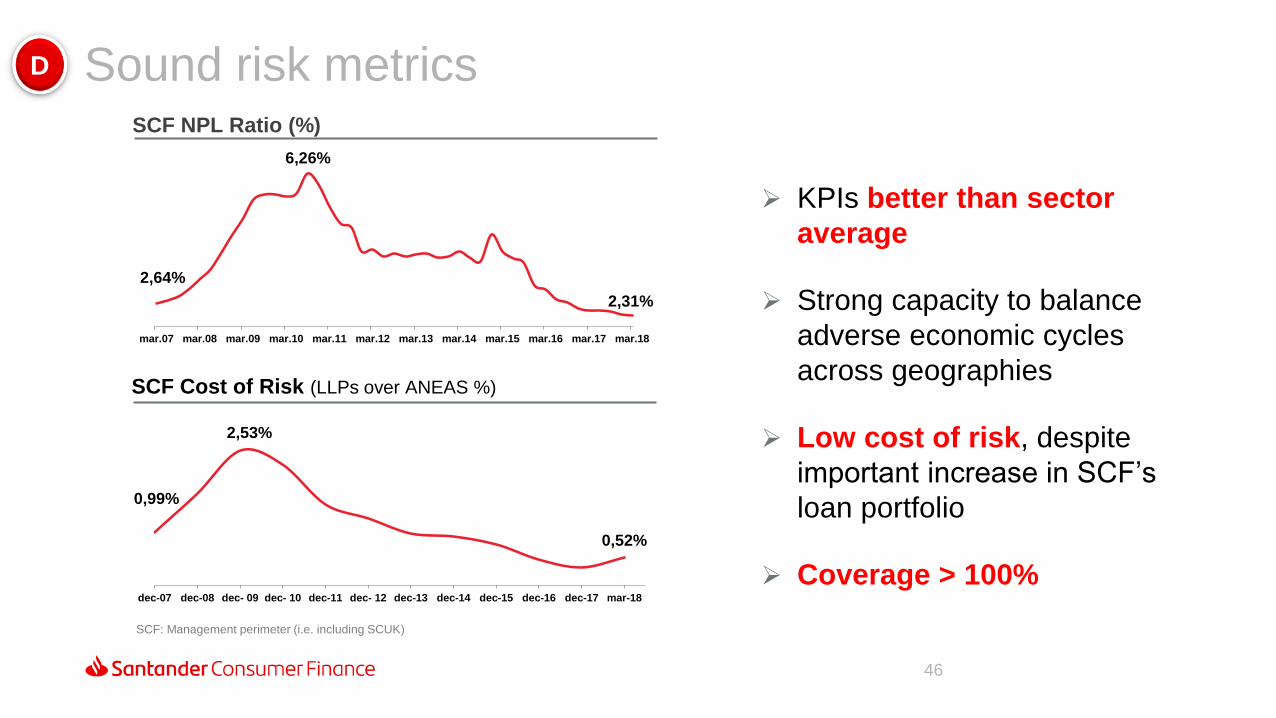
46
Sound risk metricsD
KPIs better than sector
average
Strong capacity to balance
adverse economic cycles
across geographies
Low cost of risk, despite
important increase in SCF’s
loan portfolio
Coverage > 100%
2,64%
6,26%
2,31%
mar.07 mar.08 mar.09 mar.10 mar.11 mar.12 mar.13 mar.14 mar.15 mar.16 mar.17 mar.18
0,99%
2,53%
0,52%
0%
1%
2%
3%
dec-07 dec-08 dec- 09 dec- 10 dec-11 dec- 12 dec-13 dec-14 dec-15 dec-16 dec-17 mar-18
SCF NPL Ratio (%)
SCF Cost of Risk (LLPs over ANEAS %)
SCF: Management perimeter (i.e. including SCUK)

47
Funding diversificationE
SCF’s funding structure (%)
High diversification of
funding sources
Capacity to do issuances in
all countries
Diversification of deposits
in many countries
Increasing long-term
finance vs short term
Mar’18
SCF: Management perimeter (i.e. including SCUK)

48
SCF is a significant contributor to Santander’s results, representing 13% of the Group’s profit1 in Q1’2018
SCF excluding SCUK. Including SCUK, SCF represents 14% of SAN profit1
(1) Percentage over SAN attributable profit in Q1’18, excluding Corporate Centre and Real Estate Activity Spain
SCF, 13%

Contacts
• Anders Bruun-Olsen, Nordic CFO
• Mobile: +47 95 76 83 28
• E-mail: [email protected]
• Priscilla Halverson, Director Capital Markets
• Mobile: +47 92 06 58 75
• E-mail: [email protected]
• Anders Fuglsang, Senior Manager Capital Markets
• Mobile: +47 95 04 21 28
• E-mail: [email protected]
• Thomas Andrén-Johansen, Senior Manager Capital Markets
• Mobile: +47 91 82 42 44
• E-mail: [email protected]
• Morten Christopher Freberg Holme, Capital Markets Manager (Paternity leave)
• Mobile: +47 92 82 38 33
• E-mail: [email protected]
• Joachim Joveng Rogne, Capital Markets Analyst
• Mobile: :+47 48 23 86 32
• E-mail: [email protected]
To learn more about Santander visit
Santanderconsumer.no | Santanderconsumer.dk | Santanderconsumer.se | Santanderconsumer.fi
Our purpose is to help people and
businesses prosper.
Our culture is based on the belief that
everything we do should be


![Santander Consumer Bank AG...2020/07/01 · MOODY'S INVESTORS SERVICE FINANCIAL INSTITUTIONS Key Indicators Exhibit 2 Santander Consumer Bank AG (Unconsolidated Financials) [1] 12-182](https://img.dokumen.tips/doc/110x75/601f182c6168690b1d515512/santander-consumer-bank-ag-20200701-moodys-investors-service-financial.jpg)