Embed Size (px)
Citation preview

REPORT
Santander Consumer Bank electric vehicles portfolio
CLIENT
Santander Consumer Bank AS
SUBJECT
Impact assessment
DATE: / REVISION: October 8, 2019 / 04
DOCUMENT CODE: 10213203-TVF-RAP-001

10213203-TVF-RAP-001 October 8, 2019 / 04 Page 2 of 13
This report has been prepared by Multiconsult on behalf of Multiconsult or its client. The client’s rights to the report are regulated in the relevant assignment agreement. If the client provides access to the report to third parties in accordance with the assignment agreement, the third parties do not have other or more extensive rights than the rights derived from the client’s rights. Any use of the report (or any part thereof) for other purposes, in other ways or by other persons or entities than those agreed or approved in writing by Multiconsult is prohibited, and Multiconsult accepts no liability for any such use. Parts of the report are protected by intellectual property rights and/or proprietary rights. Copying, distributing, amending, processing or other use of the report is not permitted without the prior written consent from Multiconsult or other holder of such rights.

MULTICONSULT | Nedre Skøyen vei 2 | P.O.Box 256 Skøyen, N-0213 Oslo, Norway | Tel +47 21 58 50 00 | multiconsult.no NO 918 836 519 VAT
REPORT
PROJECT Santander Consumer Bank Electric Vehicles Portfolio
DOCUMENT CODE 10213203-TVF-RAP-001
SUBJECT Impact assessment ACCESSIBILITY Open
CLIENT Santander Consumer Bank AS PROJECT MANAGER Stig Jarstein
CONTACT Anders Skåning Fuglsang PREPARED BY Heikki Eidsvoll Holmås, Stig Jarstein
RESPONSIBLE UNIT 10105080 Renewable Energy Advisory Services

Santander Consumer Bank electric vehicles portfolio multiconsult.no
10213203-TVF-RAP-001 October 8, 2019 / 04 Page 4 of 13
TABLE OF CONTENTS
Contents 1 Introduction.......................................................................................................................................................................... 5
2 Loan Portfolio Analysis Santander Consumer Bank ............................................................................................................... 5 2.1 Eligible assets ........................................................................................................................................................................ 5 2.2 Portfolio data ........................................................................................................................................................................ 5
3 Electric Vehicles – general description .................................................................................................................................. 6 3.1 EV policy in Norway .............................................................................................................................................................. 6 3.2 Biofuel policy ........................................................................................................................................................................ 7 3.3 Climate policy ....................................................................................................................................................................... 7
4 Climate gas emissions (Scope 1 and 2) .................................................................................................................................. 7 4.1 Indicators .............................................................................................................................................................................. 7 4.2 Direct emissions (tailpipe)- Scope 1 ...................................................................................................................................... 8 4.3 Indirect emissions (Power consumption only)- Scope 2 ..................................................................................................... 10
4.3.1 Electricity production mix ...................................................................................................................................... 10 4.3.2 CO2- emissions related to electricity demand ........................................................................................................ 11
5 Portfolio analysis and impact assessment ........................................................................................................................... 13 5.1 Santander Consumer Bank’s criterion – All electric vehicles .............................................................................................. 13
Santander Consumer Bank electric vehicles portfolio multiconsult.no
1 Introduction
10213203-TVF-RAP-001 October 8, 2019 / 04 Page 5 of 13
1 Introduction
On assignment from Santander Consumer Bank, Multiconsult has assessed the impact of electric
vehicles in Norway on climate gas emissions. The bank’s portfolio is assessed regarding direct
emissions (Scope 1) and indirect emissions related to electric power production (Scope 2). A baseline
is established as the emission of the average car of the total new cars introduced to the marked, EV’s
excluded.
2 Loan Portfolio Analysis Santander Consumer Bank
The Green loan portfolio of Santander Consumer Bank consists of electric vehicles that meet the
eligibility criteria as formulated below.
2.1 Eligible assets
The eligibility criteria is formulated in line with Climate Bonds Initiative (CBI) criteria1 and proposed
criteria in the EU Taxonomy2.
The vehicles in the examined portfolio are relevant for CBI’s Low Carbon Land Transport eligibility
criteria, Criterion 1.
2.2 Portfolio data
The bank has provided essential data on number of electric vehicles in the portfolio and portfolio
volume including type of engine, fuel and vehicle category. All vehicles are registered in Norway.
Multiconsult has investigated Santander Consumer Bank’s portfolio and can confirm that it in July
2019 includes 25,787 electric cars.
1 https://www.climatebonds.net/standard/transport 2 The financing and / or refinancing of electric powertrain vehicles loans is contemplated by the EU Technical Expert Group’s June 2019 Taxonomy Technical Report.
https://ec.europa.eu/info/files/190618-sustainable-finance-teg-report-taxonomy_en
Eligibility criterion: Vehicles propelled by fully electric engines. Automatically eligible Light Duty and Heavy Goods Vehicles: electric and fuel cell vehicles

Santander Consumer Bank electric vehicles portfolio multiconsult.no
3 Electric Vehicles – general description
10213203-TVF-RAP-001 October 8, 2019 / 04 Page 6 of 13
3 Electric Vehicles – general description
Personal mobility in Norway is high, among the highest in Europe, with privately owned passenger
cars taking the lion share of the passenger transportation work. Figure 1 show the nature of
passenger transport in Norway compared to other selected countries.
Historical figures of how far the average private car is driven annually, shows a falling slope from
2007, when the personal car peaked and was on average driven 13,916 km. In 2018 the average
personal car was driven 12,140 km3.
Figure 1 Passenger transport in selected countries [passenger kilometre per person per day] (Source Statistics
Norway4/Eurostat,2014)
In 2018 the average age of private cars scrapped for refund was 18 years old5. The history of modern
EV’s is short and there is yet no evidence for the lifetime of EV’s being different from other cars. In
this analysis we assume the same lifetime independent of fuel and that it will stay 18 years.
3.1 EV policy in Norway
The number of EVs on Norwegian roads rose in 2019 above 200 000. In July 2019, 44, 3 %6 of all new
registered personal cars were zero emission cars (including a small number of fuel cell vehicles).
A broad consensus around gradually expanding the Norwegian EV-politics has been sustained in
parliament. The Norwegian EV policy, one of the world’s most ambitious EV policies have been made
effective by the tax exemption on VAT and tax exemption on the high registration tax, in addition to
a series of benefits like free fares on the many toll roads, car ferries, free parking and free charging in
cities.
3 SSB 12578: Kjørelengder , eter kjøreøyype, drivstoffype, alder, staisikkvariabel og år, 2019 4 https://www.ssb.no/transport-og-reiseliv/artikler-og-publikasjoner/koyrer-nest-mest-i-europa 5 https://www.ssb.no/en/statbank/table/05522 6 CO2-utslippet, OFV, 2019
0 5 10 15 20 25 30 35 40
Romania
Poland
Spain
Netherlands
Denmark
Great Britain
Germany
Sweden
Norway
France
Public transport
Private cars

Santander Consumer Bank electric vehicles portfolio multiconsult.no
4 Climate gas emissions (Scope 1 and 2)
10213203-TVF-RAP-001 October 8, 2019 / 04 Page 7 of 13
The tax exemption has been prolonged to 2021 in the current government platform7, so far without
a new policy in place. Many of the other benefits have been reduced and EVs are currently paying up
to a maximum, by law, of 50 % for parking, toll roads and ferries.
The Norwegian Parliament have unanimously adopted a target of 100 % EV-sales from 2025.
3.2 Biofuel policy
Norway has an ambitious biofuel policy in order to reduce CO2-emissions. Regulation8 was
introduced in 2008 to oblige all petrol retailers to sell a volume of at least 2 % biofuels of their total
sales of ordinary petroleum products. For 2019 the regulation states a total of 12 % biofuels,
escalating to 20 % in 2020. Advanced biofuels counts double against this target and 4 % of the
biofuels is set to be advanced biofuels in 2020. The government platform points in the unambiguous
direction of an increasing share of advanced biofuels.
3.3 Climate policy
Norway recently passed a bill to join the EU’s mechanisms for climate emission reduction in non- ETS
sectors, and has in the government platform9, Europe’s most ambitious targets of reducing climate
emissions in non-ETS-sectors by 45% by 2030 compared to 2005 levels.
4 Climate gas emissions (Scope 1 and 2)
Categorizing the emissions we have chosen to use the CBI guidelines for the Scope 1, Scope 2 and
Scope 3 emission calculations. CBI’s Low Carbon Transport Background Paper to Eligibility Criteria10
underlines the focus on tailpipe emissions because of their dominance, the need to send strong
signals to vehicle purchasers and the need to promote technologies and infrastructure that have the
potential to radically shift emissions trajectories and avoid fossil fuel lock-in. We do however include
indirect emissions related to power production.
4.1 Indicators
In this analysis we a using two relevant climate gas emission indicators for vehicles:
- Emissions per kilometre [gCO2/km]
- Emissions per passenger kilometre [gCO2/pkm]
The car fleet composition and emissions from the types of cars is used to calculate the emissions per
kilometre.
A passenger-kilometre, abbreviated as pkm, is the unit of measurement representing the transport of
one passenger over one kilometre. Passenger kilometers are found by multiplying the number of
passengers by the corresponding number of kilometers traveled.
Statistics Norway’s method for calculating indicators for emissions per passenger kilometre utilizes a
vehicle occupancy of 1.7 persons in private cars11. The same factor is adopted in this analysis.
7 Granavolden-plattformen, 2019 8 Produktforskriften kapittel 3: Omsetningskrav for biodrivsoff og børekrafskrierier for biodrivsoff og flytende biobrensel, Lovdata, 2019 9 Granavolden-plattformen, 2019 10 https://www.climatebonds.net/files/files/Low%20Carbon%20Transport%20Background%20Paper%20Feb%202017.pdf page 10 11 https://www.ssb.no/transport-og-reiseliv/artikler-og-publikasjoner/mindre-utslipp-per-kjorte-kilometer

Santander Consumer Bank electric vehicles portfolio multiconsult.no
4 Climate gas emissions (Scope 1 and 2)
10213203-TVF-RAP-001 October 8, 2019 / 04 Page 8 of 13
4.2 Direct emissions (tailpipe)- Scope 1
Under scope 1 of the “Low Carbon Land Transport and the Climate Bonds Standard (Version 1.0)” we
calculate the “Direct tailpipe CO2 emissions from fossil fuels combustion” avoided.
The estimation of the baseline is performed through 4 steps:
1. Estimating the gross CO2-emission per km (c) from the average car that is being substituted by
the zero emission car.
2. Multiplied by the number of km (d) the car is estimated to travel.
3. Multiplied by the number (n) of cars substituting fossil cars in the portfolio.
This can be described in the following equation:
Ebaseline = cweighted average*dy*ntotal = Eavoided (1)
All EVs and fuel cell vehicles are considered eligible with zero tailpipe emissions. So for scope 1
calculations, the emissions from these vehicles are set to zero, and the baseline will amount to the total
avoided emissions.
Emission data are retrieved from recognized test methods and not actual registrations of emissions in
Norwegian climate. Test methods have lately been improved to better reflect actual emissions but are
still likely to underestimate the emissions12.
Biofuels are already to some degree mixed with fossil fuels in Norway, and in the lifetime of the
vehicles the influence of biofuel will increase. This will result in some adjustment to the direct
emissions. There are however major uncertainties related to the future share of advanced biofuels that
do not replace feedstock and the related CO2-emissions. In these calculations the effect of biofuels on
direct emissions are not included.
To estimate the annual emissions avoided by the eligible assets, projections are made for direct tailpipe
CO2 emissions from fossil fuels combustion in the national car fleet. These projections are linear, and
since the average lifetime of private cars is 18 years, the baseline emission is set at the year 2027, half
way into new cars lifetime (the bank’s portfolio include cars from 2017 to 2019).
We chose 9 years from year 0 as the best approximation year and set 2018 as the best approximation
for year 0 based on the portfolio.
1. To estimate the weighted average of emissions per fossil car (cweighed average) we use the average
annual emission from new car models from 2017, 2018, 201913. To reflect the age dispersion of
the cars in the portfolio, a weighted average is calculated based on the number and age of zero
emission cars in the portfolio.
cwheigted average = 101 g CO2/km
12 https://www.vegvesen.no/fag/fokusomrader/miljo+og+omgivelser/klima 13 https://ofv.no/CO2-utslippet/co2-utslippet

Santander Consumer Bank electric vehicles portfolio multiconsult.no
4 Climate gas emissions (Scope 1 and 2)
10213203-TVF-RAP-001 October 8, 2019 / 04 Page 9 of 13
2. To estimate the distance traveled by the average car (d2027) we assume that EVs in 2027 will
travel as far as the average car. Figure 2 illustrates the distance traveled yearly by relatively
new vehicles dependent on type of car.
Figure 2 Average road traffic volumes per vehicle age 0-4 years old in 2018 [km] (Source: Statistics
Norway14)
Traffic volumes per car is declining and we use linear regression on publicly available dataset
(d2005-d2018) and extrapolate until 2027.
We estimate the distance traveled by the average car to: d2027 = 10,975 km/yr
Based on calculated gross tailpipe CO2-emissions for the average car, fossil fuel content in
petrol/diesel pumped in 2027 and the traveled distance for the average car the same year,
table 1 present the calculated emission factors and CO2-emissions in a year for the same car.
Table 1 Greenhouse gas emission factors (CO2- equivalents), direct emissions in the year 202715
14 https://www.ssb.no/en/statbank/table/12575/ 15 Calculations have been rounded
0
2 000
4 000
6 000
8 000
10 000
12 000
14 000
16 000
Petrol EV Petrol hybrid,chargeable
Petrol hybrid, nonchargeable
Direct emissions fossil car-
Baseline 2027
Direct emissions EV
Emissions per passenger km 60 gCO2/pkm 0 gCO2/pkm
Emissions per km 101 gCO2/km 0 gCO2/km
Emissions per car and year 1108 kgCO2 0 kgCO2

Santander Consumer Bank electric vehicles portfolio multiconsult.no
4 Climate gas emissions (Scope 1 and 2)
10213203-TVF-RAP-001 October 8, 2019 / 04 Page 10 of 13
4.3 Indirect emissions (Power consumption only)- Scope 2
4.3.1 Electricity production mix
In 2018, the Norwegian power production was 98 % renewable (NVE16). As shown in figure 3, the
Norwegian production mix in 2018 (95 % hydropower) results in emissions of 11 gCO2/kWh. The
production mix is also included in the figure for other selected European states for illustration.
Figure 3 National electricity production mix in some relevant countries (European Residual Mixes 2018,
Association of Issuing Bodies17)
16 https://www.nve.no/reguleringsmyndigheten-for-energi-rme-marked-og-monopol/varedeklarasjon/nasjonal-varedeklarasjon-2017/ 17 https://www.aib-net.org/facts/european-residual-mix
7%2%
9%
18%
14%10%
48%
11%
95%
12%
39%
19%
13%32%
72%
12%22%
42%
23%
9%
12%
6%
15%
24%
2%6%
15%
46%
67%
8%
11
143
47
469
268
457
209
120
50
100
150
200
250
300
350
400
450
500
0%
10%
20%
30%
40%
50%
60%
70%
80%
90%
100%
NO FI FR DE GB NL DK SE
Dir
ect
em
issi
on
s [g
CO
2/k
Wh
]
Nat
ion
al p
rod
uct
ion
by
shar
e
National Electricity Production Mix 2018- selected countries
Renewables Unspecified Solar Wind
Hydro & Marine Geothermal Biomass
Nuclear Total Fossil Unspecified Lignite
Hard Coal Gas Oil
Direct CO2 (gCO2/kWh)
Santander Consumer Bank electric vehicles portfolio multiconsult.no
4 Climate gas emissions (Scope 1 and 2)
10213203-TVF-RAP-001 October 8, 2019 / 04 Page 11 of 13
4.3.2 CO2- emissions related to electricity demand
Power is traded internationally in an ever more interconnected European electricity grid. For impact
calculations of all power consumption, and even electrification of transportation, the regional or
European production mix is more relevant than national production.
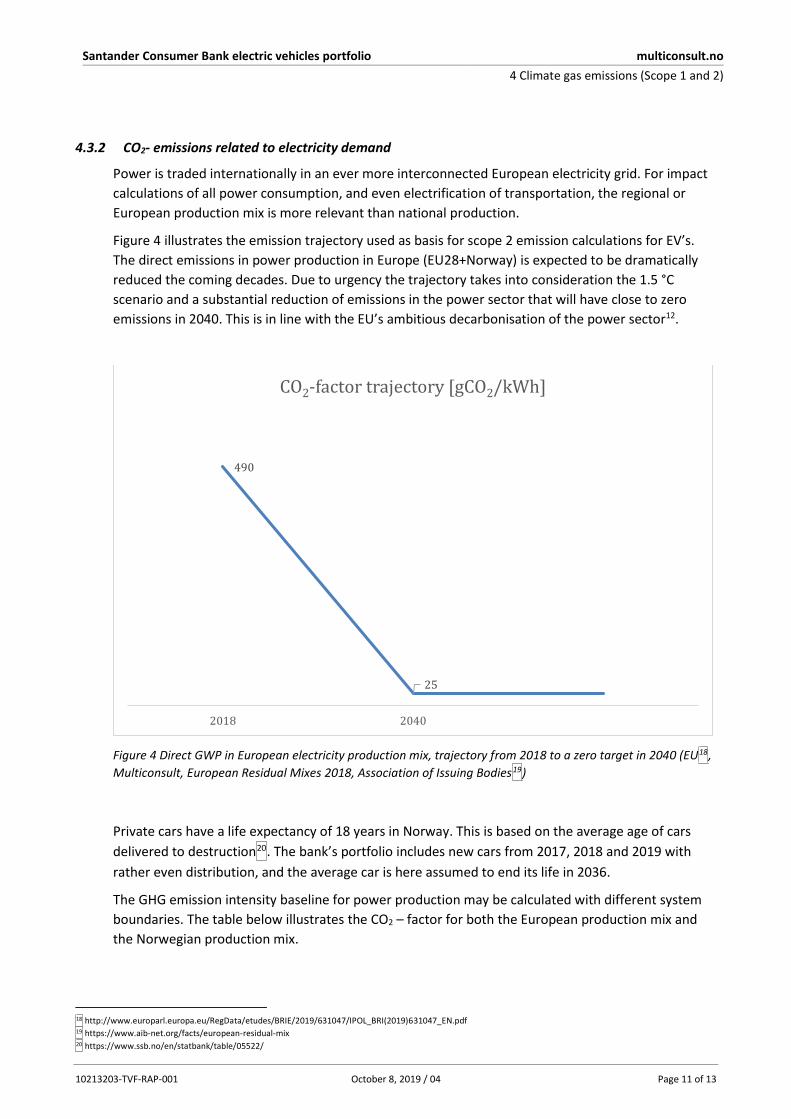
Figure 4 illustrates the emission trajectory used as basis for scope 2 emission calculations for EV’s.
The direct emissions in power production in Europe (EU28+Norway) is expected to be dramatically
reduced the coming decades. Due to urgency the trajectory takes into consideration the 1.5 °C
scenario and a substantial reduction of emissions in the power sector that will have close to zero
emissions in 2040. This is in line with the EU’s ambitious decarbonisation of the power sector12.
Figure 4 Direct GWP in European electricity production mix, trajectory from 2018 to a zero target in 2040 (EU18,
Multiconsult, European Residual Mixes 2018, Association of Issuing Bodies19)
Private cars have a life expectancy of 18 years in Norway. This is based on the average age of cars
delivered to destruction20. The bank’s portfolio includes new cars from 2017, 2018 and 2019 with
rather even distribution, and the average car is here assumed to end its life in 2036.
The GHG emission intensity baseline for power production may be calculated with different system
boundaries. The table below illustrates the CO2 – factor for both the European production mix and
the Norwegian production mix.
18 http://www.europarl.europa.eu/RegData/etudes/BRIE/2019/631047/IPOL_BRI(2019)631047_EN.pdf 19 https://www.aib-net.org/facts/european-residual-mix 20 https://www.ssb.no/en/statbank/table/05522/
490
25
2018 2040
CO2-factor trajectory [gCO2/kWh]

Santander Consumer Bank electric vehicles portfolio multiconsult.no
4 Climate gas emissions (Scope 1 and 2)
10213203-TVF-RAP-001 October 8, 2019 / 04 Page 12 of 13
Table 2 Electricity consumption greenhouse gas factors (CO2- equivalents) for two scenarios
The following calculations apply the European mix in table 2. This is in line with Nordic Public Sector
Issuers: Position Paper on Green Bonds Impact Reporting (January 2019)21. 275 gCO2/kWh constitute
the GHG emission intensity baseline for power production in the life time of a 2018 model private
car.
The energy consumption of EV’s is very much dependent on size and outdoor temperature. There is
not sufficient available data to ensure an accurate estimation of energy consumption for the average
EV. In these calculations we are using the average for all currently available EV models in Electrical
Vehicle Database22, 17.5 kWh/100km. In table 3 emission factors are presented in both emissions per
kilometre and per passenger kilometre.
Table 3 Electricity consumption greenhouse gas factors (CO2- equivalents)
*Note that there are indirect emissions related fossil fuel as well but that are scope 3 emissions and
not included in this analysis.
21 https://www.kommunalbanken.no/media/545579/npsi_position_paper_2019_final.pdf 22 https://ev-database.org/cheatsheet/energy-consumption-electric-car
Scenario CO2- factor (g/kWh)
European (EU28+ Norway) production mix (year 2027) 275
Norwegian consumption mix 11
Indirect emissions fossil
car*
Indirect emissions EV-
2027
Emissions per passenger km, indirect emissions
from power production
0 gCO2/pkm 28 gCO2/pkm
Emissions per km, indirect emissions from power
production
0 gCO2/km 48 gCO2/km

Santander Consumer Bank electric vehicles portfolio multiconsult.no
5 Portfolio analysis and impact assessment
10213203-TVF-RAP-001 October 8, 2019 / 04 Page 13 of 13
5 Portfolio analysis and impact assessment
5.1 Santander Consumer Bank’s criterion – All electric vehicles
The 25,787 eligible vehicles in Santander Consumer Bank’s portfolio is estimated to drive 283 million
kilometres in a year. The available data from the bank include:
- Current number of contracts and related portfolio volume
- Historic number of contracts and related portfolio volume
Number of vehicles Sum km/yr Sum person km/yr
Eligible passenger vehicles plants in portfolio 25,787 283 mill. 167 mill.
Table 4 Number of eligible passenger vehicles and expected yearly mileage
The table below summarises, in rounded numbers, the reduced CO2-emissions compared to baseline
for the eligible assets in the portfolio in an average year in the lifetime of the vehicles in the
portfolio, presented as reductions in direct emissions and indirect emissions. Note that indirect
emissions only is calculated for EV’s and not fossil fuelled cars.
Direct emissions in table 5 are calculated by multiplying distant travelled by the 25,787 cars in the
portfolio in a year, 283 mill. km, by the specific emission factor [CO2/km] in table 1.
Indirect emissions are calculated by multiplying distant travelled by the 25,787 cars in the portfolio in
a year by the specific emission factor [CO2/km] in table 3.
Eligible passenger vehicles plants in portfolio Reduced CO2-emissions compared to baseline
Direct emissions only (Scope 1) 28,600 tons CO2/year
Indirect emissions EV’s only (Scope 2) - 13,600 tons CO2/year
Direct and indirect emissions in total 15,000 tons CO2/year
Table 5 The portfolio’s estimated impact on GHG-emissions in rounded numbers
The reduction in direct emissions correspond to 12 million litre gasoline saved per year.