Embed Size (px)
Citation preview

R&S®FSH4/8/13/20 Spectrum Analyzer Operating Manual
1173.6275.12 – 31
Ope
ratin
g M
anua
l

The Operating Manual describes the following R&S®FSH models:
● R&S FSH4 (1309.6000.04)
● R&S FSH4 (1309.6000.14)
● R&S FSH4 (1309.6000.24)
● R&S FSH8 (1309.6000.08)
● R&S FSH8 (1309.6000.18)
● R&S FSH8 (1309.6000.28)
● R&S FSH13 (1314.2000.13)
● R&S FSH20 (1314.2000.20)
● R&S FSH4 (1309.6000.54, equivalent to 1309.6000.04)
● R&S FSH4 (1309.6000.64, equivalent to 1309.6000.14)
● R&S FSH4 (1309.6000.74, equivalent to 1309.6000.24)
● R&S FSH8 (1309.6000.58, equivalent to 1309.6000.08)
● R&S FSH8 (1309.6000.68, equivalent to 1309.6000.18)
● R&S FSH8 (1309.6000.78, equivalent to 1309.6000.28)
● R&S FSH13 (1314.2000.63, equivalent to 1314.2000.13)
● R&S FSH20 (1314.2000.70, equivalent to 1314.2000.20)
The manual also covers the following options:
R&S FSH-K10 (1304.5864.02)
R&S FSH-K14 (1304.5770.02)
R&S FSH-K15 (1309.7488.02)
R&S FSH-K16 (1309.7494.02)
R&S FSH-K17 (1304.5893.02)
R&S FSH-K29 (1304.5993.02)
R&S FSH-K41 (1304.5612.02)
R&S FSH-K42 (1309.5629.02)
R&S FSH-K43 (1304.5635.02)
R&S FSH-K44 (1309.5658.02)
R&S FSH-K44E (1304.5758.02)
R&S FSH-K45 (1309.5641.02)
R&S FSH-K46 (1304.5729.02)
R&S FSH-K46E (1304.5764.02)
R&S FSH-K47 (1304.5787.02)
R&S FSH-K47E (1304.5806.02)
R&S FSH-K48 (1304.5887.02)
R&S FSH-K48E (1304.5858.02)
R&S FSH-K50 (1304.5735.02)
R&S FSH-K50E (1304.5793.02)
R&S FSH-K51 (1304.5812.02)
R&S FSH-K51E (1304.5829.02)
R&S FSH-K56 (1318.6100.02)
The contents of this manual correspond to firmware version 2.81 or higher.
© 2018 Rohde & Schwarz GmbH & Co. KG
Muehldorfstr. 15, 81671 Munich. Germany
Phone: +49 89 4129-0
Fax: +49 89 4129-12 164
E-mail: [email protected]
Internet: http://www.rohde-schwarz.com
81671 Munich, Germany
Subject to change – Data without tolerance limits is not binding.
R&S® is a registered trademark of Rohde & Schwarz GmbH & Co. KG.
Trade names are trademarks of the owners.
Throughout this manual, products from Rohde & Schwarz are indicated without the ® symbol , e.g. R&S®FSH is indicated as
R&S FSH.

R&S FSH Safety Instructions
1175.6590.12 - 03 Page i
Safety Instructions
Risk of injury and instrument damage
The instrument must be used in an appropriate manner to prevent personal injury or
instrument damage.
● Do not open the instrument casing.
● Read and observe the "Basic Safety Instructions" delivered as printed brochure
with the instrument or in electronic format on the documentation CD-ROM.
● Read and observe the safety instructions in the following sections. Note that the
data sheet may specify additional operating conditions.
● Keep the "Basic Safety Instructions" and the product documentation in a safe place
and pass them on to the subsequent users.
The R&S FSH has been designed for lab operation as well as for service and
maintenance applications in outdoor areas. Thus, the following safety instructions
apply in addition to or contrary to the “Basic Safety Instructions” leaflet.
1. The R&S FSH is protected against dripping water and dust (IP degree 51) and can
thus be used in outdoor areas to a certain degree.
2. The R&S FSH’s max. operating altitude is 4600 m above sea level and its max.
transport altitude is 12000 m above sea level.

R&S FSH Instrucciones de seguridad
1175.6590.12 - 03 Page ii
Instrucciones de seguridad
Riesgo de lesiones y daños en el instrumento
El instrumento se debe usar de manera adecuada para prevenir descargas eléctricas,
incendios, lesiones o daños materiales.
● No abrir la carcasa del instrumento.
● Lea y cumpla las "Instrucciones de seguridad elementales" suministradas con el
instrumento como folleto impreso o en formato electrónico en el CD-ROM de
documentación.
● Lea y cumpla las instrucciones de seguridad incluidas en las siguientes secciones.
Se debe tener en cuenta que las especificaciones técnicas pueden contener
condiciones adicionales para su uso.
● Guarde bien las instrucciones de seguridad elementales, así como la
documentación del producto, y entréguelas a usuarios posteriores.
El R&S FSH está diseñado tanto para el uso en el laboratorio como para aplicaciones
de servicio y mantenimiento al aire libre. En consecuencia, las instrucciones de
seguridad siguientes son aplicables de manera adicional a las “Informaciones
elementales de seguridad” (folleto) o en lugar de estas en los puntos en los que
diverjan.
1. El R&S FSH está protegido contra las salpicaduras de agua y contra el polvo (IP
51), por lo que hasta cierto punto se puede usar en exteriores sin problemas.
2. La altitud máxima de funcionamiento del R&S FSH es de 4600 m sobre el nivel del
mar, mientras que su altitud máxima de transporte es de 12 000 m sobre el nivel
del mar.

R&S FSH Sicherheitshinweise
1175.6590.12 - 03 Page iii
Sicherheitshinweise
Gefahr von Verletzungen und Schäden am Gerät
Betreiben Sie das Gerät immer ordnungsgemäß, um elektrischen Schlag, Brand,
Verletzungen von Personen oder Geräteschäden zu verhindern.
● Öffnen Sie das Gerätegehäuse nicht.
● Lesen und beachten Sie die "Grundlegenden Sicherheitshinweise", die als
gedruckte Broschüre dem Gerät beiliegen oder elektronisch auf der
Dokumentation CD-ROM zu finden sind.
● Lesen und beachten Sie die Sicherheitshinweise in den folgenden Abschnitten;
möglicherweise enthält das Datenblatt weitere Hinweise zu speziellen
Betriebsbedingungen.
● Bewahren Sie die "Grundlegenden Sicherheitshinweise" und die
Produktdokumentation gut auf und geben Sie diese an weitere Benutzer des
Produkts weiter.
Der R&S FSH wurde für den Einsatz im Labor sowie für Service- und
Wartungseinsätze im Freien entwickelt. Deshalb gelten zusätzlich oder im Gegensatz
zur Broschüre „Grundlegende Sicherheitshinweise‟ die folgenden Sicherheitshinweise.
3. Der R&S FSH ist gegen Spritzwasser und Staub geschützt (IP-Schutzart 51) und
kann daher bis zu einem gewissen Grad im Freien verwendet werden.
4. Die maximale Betriebshöhe des R&S FSH beträgt 4600 m ü. NN und die maximale
Transporthöhe 12000 m ü. NN

R&S FSH Consignes de sécurité
1175.6590.12 - 03 Page iv
Consignes de sécurité
Risque de blessures et d'endommagement de l'appareil
L'appareil doit être utilisé conformément aux prescriptions afin d'éviter les
électrocutions, incendies, dommages corporels et matériels.
● N'ouvrez pas le boîtier de l'appareil.
● Lisez et respectez les "consignes de sécurité fondamentales" fournies avec
l’appareil sous forme de brochure imprimée ou disponibles en format électronique
sur le CD-ROM de documentation.
● Lisez et respectez les instructions de sécurité dans les sections suivantes. Il ne
faut pas oublier que la fiche technique peut indiquer des conditions d’exploitation
supplémentaires.
● Gardez les consignes de sécurité fondamentales et la documentation produit dans
un lieu sûr et transmettez ces documents aux autres utilisateurs.
Le R&S FSH a été conçu pour le fonctionnement en laboratoire ainsi que pour les
applications de service et de maintenance en extérieur. Par conséquent, les
instructions de sécurité suivantes s’appliquent en plus de la fiche « Consignes
fondamentales de sécurité » ou s’opposent à elles.
5. Le R&S FSH est protégé contre les projections d’eau et la poussière (niveau de
protection IP 51) et peut par conséquent être utilisé en extérieur dans une certaine
mesure.
6. Le R&S FSH est utilisable jusqu’à une altitude maximale de 4600 m au-dessus du
niveau de la mer, et peut être transporté à une altitude maximale de 12000 m au-
dessus du niveau de la mer.

1171.0200.22-06.00
Customer Support
Technical support – where and when you need it For quick, expert help with any Rohde & Schwarz equipment, contact one of our Customer Support Centers. A team of highly qualified engineers provides telephone support and will work with you to find a solution to your query on any aspect of the operation, programming or applications of Rohde & Schwarz equipment.
Up-to-date information and upgrades To keep your instrument up-to-date and to be informed about new application notes related to your instrument, please send an e-mail to the Customer Support Center stating your instrument and your wish. We will take care that you will get the right information.
Europe, Africa, Middle East Phone +49 89 4129 12345 [email protected]
North America Phone 1-888-TEST-RSA (1-888-837-8772) [email protected]
Latin America Phone +1-410-910-7988 [email protected]
Asia/Pacific Phone +65 65 13 04 88 [email protected]
China Phone +86-800-810-8228 / +86-400-650-5896 [email protected]

R&S FSH Table of Contents
Operating Manual 1173.6275.12 - 31 1
Table of Contents
Documentation Overview ................................................................... 9
Conventions Used in the Documentation ....................................... 11
1 Operating the R&S FSH .................................................................... 12
1.1 Screen Layout and Elements ....................................................................................12
1.2 Means of Input ............................................................................................................13
1.2.1 Using the Alphanumeric Keys ......................................................................................14
1.2.2 Confirming and Cancelling Entries ..............................................................................15
1.2.3 Using the Rotary Knob .................................................................................................15
1.2.4 Using the Cursor Keys .................................................................................................16
1.2.5 Remote Operation........................................................................................................16
1.3 Presetting the R&S FSH ............................................................................................17
1.4 Configuring Measurements ......................................................................................17
1.5 Configuring the Instrument ......................................................................................18
1.6 Taking Screenshots ...................................................................................................21
1.7 Saving Events ............................................................................................................22
1.8 Connecting the R&S FSH to a PC ............................................................................24
1.8.1 Connecting the R&S FSH in a LAN .............................................................................25
1.8.2 Connecting the R&S FSH in an Existing LAN .............................................................28
1.8.3 Connecting the R&S FSH via USB ..............................................................................29
1.9 Managing Datasets ....................................................................................................30
1.9.1 Saving Datasets ...........................................................................................................32
1.9.2 Restoring Datasets ......................................................................................................37
1.9.3 Deleting Datasets.........................................................................................................39
1.10 Updating the Firmware ..............................................................................................40
1.11 Installing Firmware Options .....................................................................................40
2 Working with the Measurement Wizard .......................................... 41
2.1 Preparing the Measurement .....................................................................................42
2.1.1 Creating a Measurement Set .......................................................................................42
2.1.2 Uploading Measurement Sets .....................................................................................44
2.2 Using the Measurement Wizard ...............................................................................45

R&S FSH Table of Contents
Operating Manual 1173.6275.12 - 31 2
2.2.1 Starting the Measurement Wizard ...............................................................................45
2.2.2 Performing a Sequence of Measurements ..................................................................48
2.3 Evaluating Results .....................................................................................................51
3 Spectrum Analyzer Mode ................................................................. 52
3.1 Performing Spectrum Measurements ......................................................................52
3.1.1 Measuring Basic Signal Characteristics ......................................................................52
3.1.2 Measuring the Channel Power of Continuously Modulated Signals ............................53
3.1.3 Measuring the Occupied Bandwidth ............................................................................57
3.1.4 Power Measurements on TDMA Signals .....................................................................61
3.1.5 Measuring the Adjacent Channel Leakage Ratio (ACLR) ...........................................64
3.1.6 Measuring the Spectrum Emission Mask ....................................................................73
3.1.7 Measuring the Harmonic Distortion .............................................................................76
3.1.8 Measuring the AM Modulation Depth ..........................................................................78
3.1.9 Measuring Spurious Emissions ...................................................................................80
3.1.10 Working with the Spectrogram Result Display (R&S FSH-K14/ -K15) ........................83
3.1.11 Using Isotropic Antennas .............................................................................................94
3.2 Configuring Spectrum Measurements ....................................................................96
3.2.1 Configuring the Horizontal Axis ...................................................................................96
3.2.2 Configuring the Vertical Axis ......................................................................................100
3.2.3 Setting Bandwidths ....................................................................................................104
3.2.4 Configuring and Triggering the Sweep ......................................................................107
3.2.5 Working with Traces ..................................................................................................113
3.2.6 Using Markers ............................................................................................................118
3.2.7 Using Display Lines ...................................................................................................127
3.2.8 Using Limit Lines........................................................................................................128
3.3 Working with Channel Tables .................................................................................131
3.4 Using Transducer Factors ......................................................................................132
3.4.1 Unit for Measurements with Transducers ..................................................................133
3.4.2 Setting the Reference Level ......................................................................................133
3.4.3 Frequency Range of Transducer ...............................................................................134
3.4.4 Data Sets Containing Transducer Factors ................................................................134
4 Power Meter .................................................................................... 135
4.1 Using a Power Sensor .............................................................................................135

R&S FSH Table of Contents
Operating Manual 1173.6275.12 - 31 3
4.1.1 Connecting a Power Sensor ......................................................................................137
4.1.2 Performing and Configuring Measurements ..............................................................138
4.2 Using a Directional Power Sensor .........................................................................141
4.2.1 Connecting a Directional Power Sensor ....................................................................142
4.2.2 Performing and Configuring Measurements ..............................................................143
4.3 Using the Internal Power Meter ..............................................................................146
4.4 Performing Pulse Power Measurements (R&S FSH-K29) ....................................147
4.4.1 Configuring the Numerical Result Display .................................................................149
4.4.2 Configuring the Power vs Time Result Display .........................................................150
5 Interference Analyzer (R&S FSH-K15/ -K16) ................................. 154
5.1 Measuring the Spectrum .........................................................................................156
5.1.1 Measuring the Carrier-to-Noise Ratio ........................................................................156
5.1.2 Measuring the Carrier-to-Interference Ratio ..............................................................157
5.1.3 Analyzing Interference Measurements ......................................................................157
5.2 Working with Maps ..................................................................................................158
5.2.1 Transferring Maps (R&S FSH-K15 and -K16) ...........................................................158
5.2.2 Transferring Indoor Maps (R&S FSH-K17) ................................................................159
5.2.3 Displaying Maps .........................................................................................................160
5.2.4 Measuring Interference ..............................................................................................166
5.2.5 Collecting Geographic Data (R&S FSH-K15 and -K16) ............................................169
5.2.6 Collecting Measurement Data (R&S FSH-K17) .........................................................173
5.2.7 Analyzing Geographic Data (R&S FSH-K15 and -K16).............................................176
5.2.8 Analyzing Indoor Data (R&S FSH-K17) .....................................................................177
6 Network Analyzer Mode ................................................................. 178
6.1 Configuring the Tracking Generator ......................................................................180
6.2 Calibrating Measurements ......................................................................................182
6.3 Performing Scalar Measurements ..........................................................................188
6.3.1 Measuring the Transmission ......................................................................................188
6.3.2 Measuring the Reflection ...........................................................................................190
6.4 Performing Vector Measurements (R&S FSH-K42) ..............................................192
6.4.1 Measuring the Transmission ......................................................................................192
6.4.2 Measuring the Reflection ...........................................................................................195
6.5 Evaluating the Results ............................................................................................197
R&S FSH Table of Contents
Operating Manual 1173.6275.12 - 31 4
6.5.1 Selecting the Measurement Format...........................................................................197
6.5.2 Configuring the Vertical Axis ......................................................................................204
6.5.3 Using Markers ............................................................................................................206
6.5.4 Working with Channel Tables ....................................................................................206
6.5.5 Using Limit Lines........................................................................................................207
6.5.6 Using Trace Mathematics ..........................................................................................207
6.6 Vector Voltmeter (R&S FSH-K45) ...........................................................................208
6.6.1 Calibrating Measurements .........................................................................................209
6.6.2 Performing Measurements ........................................................................................209
6.6.3 Evaluating the Results ...............................................................................................211
7 Distance-to-Fault Mode (R&S FSH-K41) ....................................... 212
7.1 Performing Cable and Antenna Measurements ....................................................214
7.1.1 Reflection Measurements ..........................................................................................214
7.1.2 Distance to Fault Measurements ...............................................................................215
7.1.3 Spectrum Measurements ...........................................................................................215
7.1.4 Selecting the Measurement Format...........................................................................216
7.1.5 Calibrating Measurements .........................................................................................218
7.2 Configuring Cable and Antenna Tests ..................................................................219
7.2.1 Selecting the Cable Model .........................................................................................219
7.2.2 Configuring the Horizontal Axis .................................................................................222
7.2.3 Configuring the Amplitude Characteristics ................................................................224
7.2.4 Configuring the Tracking Generator ..........................................................................226
7.3 Analyzing Measurement Results ............................................................................227
7.3.1 Working with Traces ..................................................................................................227
7.3.2 Using Markers ............................................................................................................227
7.3.3 Using Display and Limit Lines ....................................................................................227
8 Receiver Mode (R&S FSH-K43) ...................................................... 228
8.1 Selecting the Measurement Mode ..........................................................................229
8.1.1 Performing Single Frequency Measurements ...........................................................229
8.1.2 Performing Frequency Scans ....................................................................................232
8.2 Configuring Measurements in Receiver Mode .....................................................235
8.2.1 Selecting Detectors for EMI Measurements ..............................................................235
8.2.2 Selecting the Measurement Bandwidths for EMI Measurements ..............................237
R&S FSH Table of Contents
Operating Manual 1173.6275.12 - 31 5
8.2.3 Defining the Measurement Time ................................................................................238
8.2.4 Working with Traces ..................................................................................................238
8.2.5 Using Transducers .....................................................................................................238
8.2.6 Using Limit Lines........................................................................................................238
9 Digital Modulation Analyzer ........................................................... 239
9.1 General Settings of the Digital Modulation Analyzer ...........................................240
9.1.1 General Settings in the Result Summary ..................................................................240
9.1.2 Trace Mode Selection ................................................................................................243
9.2 General Result Displays of the Digital Modulation Analyzer ..............................245
9.3 Measurements on GSM Signals .............................................................................248
9.3.1 The Result Summary .................................................................................................249
9.3.2 The Burst Power Result Display ................................................................................253
9.3.3 Configuring the Measurement ...................................................................................255
9.4 Measurements on 3GPP FDD Signals ...................................................................256
9.4.1 The Result Summary .................................................................................................257
9.4.2 The Code Domain Analyzer .......................................................................................261
9.4.3 The Code Domain Channel Table .............................................................................264
9.4.4 Configuring the Measurement ...................................................................................267
9.5 Measurements on CDMA2000 Signals ..................................................................271
9.5.1 The Result Summary .................................................................................................272
9.5.2 The Code Domain Analyzer .......................................................................................275
9.5.3 The Code Domain Channel Table .............................................................................277
9.5.4 The PN Scanner ........................................................................................................280
9.5.5 Configuring the Measurement ...................................................................................281
9.6 Measurements on 1xEV-DO Signals ......................................................................284
9.6.1 The Result Summary .................................................................................................285
9.6.2 The PN Scanner ........................................................................................................288
9.6.3 The Burst Power Result Display ................................................................................288
9.6.4 Configuring the Measurement ...................................................................................289
9.7 Measurements on TD-SCDMA Signals ..................................................................290
9.7.1 The Result Summary .................................................................................................291
9.7.2 The Code Domain Analyzer .......................................................................................295
9.7.3 The Code Domain Channel Table .............................................................................297

R&S FSH Table of Contents
Operating Manual 1173.6275.12 - 31 6
9.7.4 The Sync ID Result Display .......................................................................................299
9.7.5 The Time Domain Power Result Display ...................................................................300
9.7.6 Configuring the Measurement ...................................................................................302
9.8 Measurements on LTE Signals ...............................................................................306
9.8.1 The Result Summary .................................................................................................307
9.8.2 The Result Summary for Carrier Aggregation ...........................................................313
9.8.3 The Constellation Diagram ........................................................................................314
9.8.4 The BTS Scanner ......................................................................................................316
9.8.5 The Resource Allocations Result Display ..................................................................317
9.8.6 Configuring the Measurement ...................................................................................319
9.9 Measurements on NB-IoT Signals..........................................................................325
9.9.1 The Result Summary .................................................................................................326
9.9.2 The Constellation Diagram ........................................................................................330
9.9.3 Configuring the Measurement ...................................................................................332
10 Menu and Softkey Overview .......................................................... 337
10.1 General Functions ...................................................................................................337
10.1.1 General R&S FSH Setup ...........................................................................................337
10.1.2 File Management .......................................................................................................338
10.1.3 Operating Mode Selection .........................................................................................338
10.2 Functions of the Spectrum Analyzer .....................................................................339
10.2.1 Measurement Selection .............................................................................................339
10.2.2 Frequency Parameters ..............................................................................................342
10.2.3 Span Selection ...........................................................................................................342
10.2.4 Amplitude Parameters ...............................................................................................342
10.2.5 Sweep Configuration .................................................................................................343
10.2.6 Bandwidth Selection ..................................................................................................343
10.2.7 Trace Functionality.....................................................................................................343
10.2.8 Display and Limit Lines ..............................................................................................343
10.2.9 Markers ......................................................................................................................344
10.3 Functions of the Network Analyzer ........................................................................345
10.3.1 Measurement Configuration ......................................................................................345
10.3.2 Frequency Parameters ..............................................................................................345
10.3.3 Span Selection ...........................................................................................................346

R&S FSH Table of Contents
Operating Manual 1173.6275.12 - 31 7
10.3.4 Amplitude Parameters ...............................................................................................346
10.3.5 Sweep Configuration .................................................................................................346
10.3.6 Bandwidth Selection ..................................................................................................346
10.3.7 Trace Functionality.....................................................................................................347
10.3.8 Limit Lines ..................................................................................................................347
10.3.9 Markers ......................................................................................................................347
10.4 Functions of the Power Meter ................................................................................349
10.4.1 Power Meter Measurements ......................................................................................349
10.4.2 Frequency Parameters ..............................................................................................349
10.4.3 Amplitude Parameters ...............................................................................................350
10.4.4 Sweep Configuration .................................................................................................350
10.4.5 Bandwidth Configuration ............................................................................................351
10.4.6 Trace Configuration ...................................................................................................351
10.5 Functions of the Distance-to-Fault Mode ..............................................................352
10.5.1 Measurement Configuration ......................................................................................352
10.5.2 Frequency Parameters ..............................................................................................352
10.5.3 Span Selection ...........................................................................................................352
10.5.4 Amplitude Parameters ...............................................................................................353
10.5.5 Sweep Configuration .................................................................................................353
10.5.6 Bandwidth Selection ..................................................................................................353
10.5.7 Trace Functionality.....................................................................................................354
10.5.8 Markers ......................................................................................................................354
10.6 Functions of the Receiver Mode ............................................................................355
10.6.1 Measurement Configuration ......................................................................................355
10.6.2 Frequency Parameters ..............................................................................................355
10.6.3 Span Selection ...........................................................................................................355
10.6.4 Amplitude Parameters ...............................................................................................356
10.6.5 Sweep Configuration .................................................................................................356
10.6.6 Bandwidth Selection ..................................................................................................356
10.6.7 Trace Functionality.....................................................................................................356
10.6.8 Markers ......................................................................................................................357
10.7 Functions of the Interference Analyzer (Map Mode) ............................................358
10.7.1 Measurement Configuration ......................................................................................358

R&S FSH Table of Contents
Operating Manual 1173.6275.12 - 31 8
10.7.2 Frequency Parameters ..............................................................................................358
10.7.3 Amplitude Parameters ...............................................................................................359
10.7.4 Sweep Configuration .................................................................................................359
10.7.5 Bandwidth Selection ..................................................................................................359
10.7.6 Trace Functionality.....................................................................................................359
10.8 Functions of the Digital Modulation Analyzer ......................................................360
10.8.1 Measurement Configuration ......................................................................................360
10.8.2 Frequency Parameters ..............................................................................................363
10.8.3 Amplitude Parameters ...............................................................................................363
10.8.4 Sweep Configuration .................................................................................................364
10.8.5 Trace Functionality.....................................................................................................364
11 How a Spectrum Analyzer Works .................................................. 366
Index ................................................................................................ 371

R&S FSH Documentation Overview
Operating Manual 1173.6275.12 - 31 9
Documentation Overview
The user documentation for the R&S FSH is divided as follows:
Quick Start Guide
The Quick Start Guide provides basic information on the instrument's functions.
It covers the following topics:
● overview of all elements of the front and rear panels
● basic information on how to set up the R&S FSH
● information on how to operate the R&S FSH in a network
● instructions on how to perform measurements
Operating Manual
The Operating Manual provides a detailed description on the instrument's functions
It covers the following topics:
● instructions on how to set up and operate the R&S FSH in its various operating
modes
● instructions on how to perform measurements with the R&S FSH
● instructions on how to work with the available software options and applications
Service Manual
The Service Manual provides information on maintenance.
It covers the following topics:
● instructions on how to perform a performance test
● instructions on how to repair the R&S FSH including a spare parts list
● mechanical drawings
Release Notes
The release notes describe the installation of the firmware, new and modified
functions, eliminated problems, and last minute changes to the documentation. The
corresponding firmware version is indicated on the title page of the release notes. The
current release notes are provided on the internet.
Internet Site
The internet site at: http://www.rohde-schwarz.com/product/fsh.html provides the most
up to date information on the R&S FSH. The most recent manuals are available as
printable PDF files in the download area.
Also provided for download are firmware updates including the corresponding release
notes, instrument drivers, current data sheets, application notes and image versions.

R&S FSH Documentation Overview
Operating Manual 1173.6275.12 - 31 10
Calibration Certificate
The calibration certificates of your device are available online. Visit the R&S FSH product page and select the item to download the calibration certificate. You will be forwarded to a Gloris page.
https://gloris.rohde-schwarz.com/calcert
Enter the device ID of your R&S FSH and download the certificate. You can find the
device ID either in the "Setup" menu or on the label on the rear panel.

R&S FSH Conventions Used in the Documentation
Operating Manual 1173.6275.12 - 31 11
Conventions Used in the Documentation
The following conventions are used throughout the R&S R&S FSH Operating Manual:
Typographical conventions
Convention Description
“Graphical user interface elements” All names of graphical user interface elements both on the screen
and on the front and rear panels, such as dialog boxes, softkeys,
menus, options, buttons etc., are enclosed by quotation marks.
“KEYS” Key names are written in capital letters and enclosed by quotation
marks.
Input Input to be entered by the user is displayed in italics.
File names, commands,
program code
File names, commands, coding samples and screen output are
distinguished by their font.
"Links" Links that you can click are displayed in blue font.
"References" References to other parts of the documentation are enclosed by
quotation marks.
Other conventions
● Remote commands: Remote commands may include abbreviations to simplify
input. In the description of such commands, all parts that have to be entered are
written in capital letters. Additional text in lower-case characters is for information
only.

R&S FSH Operating the R&S FSH
Screen Layout and Elements
Operating Manual 1173.6275.12 - 31 12
1 Operating the R&S FSH
This chapter provides information about basic functionality and about the user interface
of the R&S FSH.
1.1 Screen Layout and Elements
The following figure shows the screen layout in cable and antenna test operating
mode. It shows all elements that are the same for all operating modes of the R&S FSH.
Screen layouts that show specifics for each operating mode or measurement are
provided in the corresponding sections of this manual.
1 Measurement information 13 Horizontal axis labeling
2 GPS and antenna status 14 Active menu item
3 Date and time 15 Unavailable menu item
4 Battery status 16 Currently selected menu item
5 Hardware settings 17 Selectable menu item
6 GPS information 18 Input field
7 Marker information 19 Vertical axis labeling
8 Reference position 20 Currently selected softkey
9 Invalid trace indicator and
overload information
21 Selectable softkey
10 Diagram 22 Active softkey function
11 Marker 23 Unavailable softkey
12 Trace

R&S FSH Operating the R&S FSH
Means of Input
Operating Manual 1173.6275.12 - 31 13
1.2 Means of Input
The user interface of the R&S FSH provides several elements for you to input data.
1 Alphanumeric keys
2 Unit keys
3 Rotary knob
4 Cursor keys
5 Enter key
6 Cancel key
7 Back key

R&S FSH Operating the R&S FSH
Means of Input
Operating Manual 1173.6275.12 - 31 14
1.2.1 Using the Alphanumeric Keys
Using the alphanumeric keys, you can enter numeric values or characters. The
alphanumeric keys include the numbers from 0 to 9, the alphabet, a minus sign and
dot.
If you have to enter a numeric value, press the corresponding key. In case of numeric
values, each key covers just the number that's printed on it.
You can enter negative values with the minus sign key and enter values that contain
decimal places with the dot key.
If the R&S FSH asks you to enter a character or you need to enter a character (e.g. file
names), the key assignment changes. Each key covers one number and more than
one character with the first choice being a character. If you need to enter a character,
press the key several times until the character you require is selected. The following
table shows an overview of character assignment.
You can correct entries with the BACK key. The BACK key moves the cursor one
position backwards and deletes the character that was in that place.
Key 1. 2. 3. 4. 5. 6. 7. 8. 9.
1 1
2 a b c 2 A B C
3 d e f 3 D E F
4 g h i 4 G H I
5 j k l 5 J K L
6 m n o 6 M N O
7 p q r s 7 P Q R S
8 t u v 8 T U V
9 w x y z 9 W X Y Z
0 0 blank _
- - +
. .

R&S FSH Operating the R&S FSH
Means of Input
Operating Manual 1173.6275.12 - 31 15
1.2.2 Confirming and Cancelling Entries
Depending on the input you have made, there are several ways to confirm entries.
● Values without unit or values that have a fixed unit that you enter in an input field
can be confirmed with the ENTER key or by pressing the center of the rotary knob.
Alternatively, you can confirm such an entry by pressing the softkey that has
opened the input field in question.
● Values that have flexible units, like frequency or time, can be confirmed with one of
the unit keys.
If you confirm a such a value with the ENTER key, the R&S FSH always uses the
smallest possible unit (e.g. Hz).
● If you have opened a submenu or input field by accident, you can close it without
making any changes with the CANCEL key.
1.2.3 Using the Rotary Knob
Using the rotary knob, you can do several things.
● The rotary knob works like a cursor key in dialog boxes or softkey submenus. In
that case you can navigate to one of the items with the rotary knob. If the dialog
box covers more than one screen page, it also scrolls through the dialog box.
Turning it to the right corresponds to a downward movement. Moving it to the left to
an upward movement.
● The rotary knob increases or decreases any kind of numeric value if an input field
is active.
Turning it to the right corresponds to an increase, turning it to the left to a decrease
of a numeric value.
In most cases, the rotary knob changes numeric values with a fixed step size.
● The rotary knob moves markers around.
Again the step size is fixed.
● Pressing the rotary knob has the same effect as pressing the ENTER key as it
confirms an entry or selection.

R&S FSH Operating the R&S FSH
Means of Input
Operating Manual 1173.6275.12 - 31 16
1.2.4 Using the Cursor Keys
Using the cursor keys, you can do several things.
● The cursor keys navigate through dialog boxes or softkey submenus.
● The up and down keys increase or decrease any kind of numeric value if an input
field is active.
The cursor keys change numeric values with a fixed step size.
● The up and down keys move markers around.
The step size is fixed.
● The left and right keys move the cursor in an input field in the corresponding
direction.
1.2.5 Remote Operation
Remote operation is a way to control the R&S FSH from another device like a PC. To
use the R&S FSH this way, you have to establish a connection between both devices
via the LAN or USB interfaces of the R&S FSH.
The product range of the R&S FSH provides several tools for remote operation.
Remote control with R&S FSH-K40
The R&S FSH-K40 is a firmware option to control the R&S FSH with remote control
commands that are compatible to the SCPI standard.
You can download the user manual for the R&S FSH-K40 from the R&S website.
Remote desktop with R&S InstrumentView
The remote desktop is an application provided by the R&S InstrumentView software.
You can use it to access and control the R&S FSH in the R&S InstrumentView
environment.
While the R&S FSH is running and connected to the control computer, the screen
contents and control elements (keys, softkeys etc.) are displayed. Thus, you can
operate the R&S FSH just like the hardware itself.
► Connect the R&S FSH to the control computer.
► Start the R&S InstrumentView software.
► Press the "Remote Display" button ( ) in the user interface.
The software opens the remote display to operate the R&S FSH remotely.
R&S FSH Operating the R&S FSH
Presetting the R&S FSH
Operating Manual 1173.6275.12 - 31 17
1.3 Presetting the R&S FSH
Before you prepare a measurement, it is recommended to preset the R&S FSH. During
a preset, the R&S FSH resets all settings to their default state. Restoring the default
configuration has the advantage that old settings do not affect measurements.
The default setup is specific to the operating mode.
► Press the PRESET key.
The R&S FSH restores its default setup.
You can also define your own default settings via a dataset. These are then loaded
after pressing the PRESET key instead of the factory default.
► Press the SETUP key.
► Press the "User Preferences" softkey.
► Select the "Preset Dataset" menu item.
The R&S FSH opens a dialog box to select the dataset that contains the settings
you would like to have as the preset settings.
► Select the dataset with the settings you want.
► Select the "Preset Mode" menu item in the "User Preferences" dialog box.
► Select the "User Defined" item from the dropdown menu.
The R&S FSH now loads the settings of the dataset after you press PRESET.
1.4 Configuring Measurements
The "Measurement Setup" dialog box provides an overview of the current configuration
of the R&S FSH. In addition, you can also change the configuration in this dialog box.
► Press the SETUP key.
► Press the "Measurement Setup" softkey.
► Select one of the menu items and change the settings as you like.
Note that the contents of the "Measurement Setup" dialog box are customized for each
operating mode of the R&S FSH. Therefore, the order and number of displayed
settings is different in each mode.

R&S FSH Operating the R&S FSH
Configuring the Instrument
Operating Manual 1173.6275.12 - 31 18
1.5 Configuring the Instrument
The "Instrument Setup" dialog box contains functionality that is independent of the
operating mode.
For more information see the "Quick Start Guide".
Protecting the R&S FSH with a PIN
The R&S FSH features a PIN protection system that protects the R&S FSH from
unauthorized access. If PIN protection is on, you have to enter the PIN whenever you
turn the R&S FSH on.
The protection system provides three levels of security.
● PIN made up of four digits
● Master PIN made up out of 10 digits.
When you enter the wrong PIN three times in a row, you have to enter the Master
PIN to unlock the R&S FSH. By default, the Master PIN is the same as the OEM
Master PIN, but you can define a User Master PIN.
If you unlock the R&S FSH with the User Master PIN, the PIN is automatically
reset to its default value ('0000').
● OEM Master PIN code made up out of 10 digits.
If you
- have defined a User Master PIN and enter the wrong User Master PIN five
times in a row or
- have not defined a User Master PIN and enter the wrong PIN three times in a
row,
the only remaining way to unlock the R&S FSH is with the OEM Master PIN. The
OEM Master PIN is a fix PIN that you receive upon delivery of your R&S FSH. You
cannot change the OEM Master PIN.
OEM Master PIN
Make sure not to lose the OEM Master PIN that is delivered with the R&S FSH and
keep it in a safe place away from the instrument itself.
If you use PIN protection and forget the User PINs, the OEM Master PIN is the only
way you can unlock and use the R&S FSH.
If you unlock the R&S FSH with the OEM Master PIN, the PIN and, if defined, the
User Master PIN are automatically reset to their default values:
'0000' (PIN) and '0000000000' (User Master PIN).
If you fail to unlock the R&S FSH with the OEM Master PIN, the R&S FSH will
force a reboot of the software until you enter the correct OEM Master PIN.

R&S FSH Operating the R&S FSH
Configuring the Instrument
Operating Manual 1173.6275.12 - 31 19
Firmware update
If the R&S FSH is protected with a PIN, a firmware update is only possible after you
have entered the correct PIN.
In the initial state after delivery, PIN protection is turned off. So if you want to protect
the R&S FSH, you have to turn it on manually.
► Press the SETUP key.
► Press the "Instrument Settings" softkey.
The R&S FSH shows the "Instrument Settings" dialog box.
► Select the "PIN Code Protection" menu item.
► Press ENTER
The R&S FSH opens an input field to define a new PIN.
► Enter a 4-digit PIN.
The R&S FSH opens an input field to confirm the PIN.
► Enter the 4-digit PIN again.
If the PIN confirmation was successful, the R&S FSH shows a corresponding
message and activates PIN protection. In that case, you have to enter the PIN
every time the R&S FSH boots.
If the PIN confirmation was not successful, the R&S FSH shows a corresponding
message and does not activate PIN protection. In that case repeat the last steps.
You can change the PIN any time you want.
► Select the "New PIN Code" menu item.
The R&S FSH opens an input field to define a new PIN.
► Enter the new PIN.
► Confirm the new PIN.
The R&S FSH changes the PIN accordingly.
You can define a User Master PIN the same way. By default, the User Master PIN is
the OEM Master PIN as shown in the "Instrument Settings" dialog box.
► Select the "Master PIN Code" menu item.
The R&S FSH opens an input field to define a User Master PIN.

R&S FSH Operating the R&S FSH
Configuring the Instrument
Operating Manual 1173.6275.12 - 31 20
► Enter a 10-digit number for the User Master PIN.
The R&S FSH opens an input field to confirm the User Master PIN.
► Confirm the PIN.
The R&S FSH shows a message if the change was successful or not.
► Alternatively, select the "User Master PIN Code" menu item and enter a 10-digit
PIN in the input field that opens.

R&S FSH Operating the R&S FSH
Taking Screenshots
Operating Manual 1173.6275.12 - 31 21
1.6 Taking Screenshots
You can take and store a screenshot of the current screen anytime with the key.
► Press the key.
The R&S FSH takes a screenshot.
If available, the R&S FSH stores the screenshot on an external storage device (USB
memory stick or SD card). If both are connected, the R&S FSH uses the SD card.
If no external device is available, the R&S FSH stores the screenshot in its internal
memory (if there is enough left). In that case you can transfer the pictures with the
R&S InstrumentView software to your computer.
Saving screenshot and dataset at the same time
Depending on the "Capture" settings available in the "User Preference" menu, using
the key also saves a dataset in addition to the screenshot.
For more information see "Managing Datasets" on page 30.
Screenshot file name
All screenshots get a default file name "Screenshot####". The files also get numbers
(####) in ascending order, beginning with 0000. You can select a default file name and
start number in the "User Preference" menu.
► Press the SETUP key.
► Press the "User Preference" softkey.
► Select the "Default Filename" and "File Name Counter Starts At" items and assign
a file name and number as you wish.
Screenshot file format
The file format of screenshots is either *.png or *.jpg, depending on your configuration
in the "User Preference" menu.
► Press the SETUP key.
► Press the "User Preference" softkey.
► Select the "Capture Screen Format" item to select the screenshot file format.
Previewing screenshots
If you want to make sure if a screenshot you took contains the wanted information, you
can preview screenshots on the R&S FSH.
► Press the SAVE/RECALL key.
► Press the "Recall Screenshot" softkey.
The R&S FSH opens a dialog box to select a screenshot for the preview.
R&S FSH Operating the R&S FSH
Saving Events
Operating Manual 1173.6275.12 - 31 22
1.7 Saving Events
The R&S FSH provides functionality that automatically saves measurement information
if a certain situation or event occurs.
Saving events is possible in all operating modes.
► Press the SETUP key.
► Press the "User Preference" softkey.
► Select the "Save on Event" menu item.
► Select "On" from the "Save on Event" dropdown menu.
The R&S FSH turns on automatic event recognition. You can select one of several
events that trigger the storage of measurement data.
Data types
You can select several data types to save when an event occurs.
● A screenshot of the sweep that contains the event (.png or .jpg file)
● A dataset of the sweep that contains the event (.set file)
● The GPS coordinates of the location where the event happens (.gpx file) - a GPS
receiver and option R&S FSH-K16 is required for this
► Press the SETUP key.
► Press the "User Preference" softkey.
► Select the "Capture Screen", "Capture Dataset" or "Capture GPX" menu item and
turn it on or off.
If on, the corresponding information is included in the saved data.
Timing of the data capture
Note that the R&S FSH evaluates the measured data after a sweep is done and thus
detects and saves an event only after a sweep has been completed.
Event types
To use the "Save on Event" functionality, you have to select an event type that triggers
the capture of the selected data. The R&S FSH supports several event types.
► Press the SETUP key.
► Press the "User Preference" softkey.
► Select the "Event Source" menu item and select an event type from the dropdown
menu.
● Time interval
Saves measurement data every <x> seconds.
You can define the duration of the time interval via the "Time Interval" menu item.

R&S FSH Operating the R&S FSH
Saving Events
Operating Manual 1173.6275.12 - 31 23
Single sweeps and sweep time
Note that it is not possible to save measurement data every <x> seconds in single
sweep mode, because the R&S FSH only performs one sweep and then stops.
Note also that the time interval must be longer than the sweep time. If the time interval
would be shorter, the R&S FSH would not be able to save data, because a sweep has
to be complete before the R&S FSH is able to save the data.
● Limit failure
Saves measurement data if a limit line is violated. (not supported by Geotagging
mode yet)
The R&S FSH provides different modes for handling limit check failures. You can
select one via the "Limits Save Mode"
- Start on failure: starts to save measurement data if a limit line is violated.
- Stop on failure: stops to save measurement data if a limit line is violated.
- Save only failure: saves only the sweeps that actually fail a limit check.
● Distance interval
Saves measurement data after you have covered a certain distance.
You can define the distance that must covered before data is saved via the
"Distance Interval" menu item.
● Every sweep
Saves the data of all measurement sweeps that are performed.
Storage device
To use the "Save on Event" functionality, you need an SD card or USB stick to store
the data on. The internal memory would probably not be sufficient.
► Press the SETUP key.
► Press the "User Preference" softkey.
► Select the "Recording Storage" menu item.
► From the dropdown menu, select the storage device you prefer (SD card or USB
device)

R&S FSH Operating the R&S FSH
Connecting the R&S FSH to a PC
Operating Manual 1173.6275.12 - 31 24
1.8 Connecting the R&S FSH to a PC
The R&S FSH comes with the R&S InstrumentView software package. This software
package features several tools that allow you to document measurement results or
create and edit limit lines or channel tables among other things.
Note that the .NET Framework 2.0 (or higher) is required on the PC to run the software
properly.
You can set up a connection between the R&S FSH and R&S InstrumentView either
via its LAN port or its mini USB port.
You have to install the R&S InstrumentView software on the PC before you are able to
establish a connection.
► Run the CD-ROM delivered with the R&S FSH.
► Navigate to the "Software" section and start the setup file.
► Follow the instructions on the screen.
Alternatively, you can download the latest R&S InstrumentView from the R&S FSH
product homepage.
http://www.rohde-schwarz.com/product/fsh.html
Firewall settings
If no connection can be established between the software and the R&S FSH after
successful configuration, check the firewall settings on your PC.

R&S FSH Operating the R&S FSH
Connecting the R&S FSH to a PC
Operating Manual 1173.6275.12 - 31 25
1.8.1 Connecting the R&S FSH in a LAN
You can connect the R&S FSH directly to the PC with the LAN cable that is supplied
with the R&S FSH. The LAN port is located on the left side of the R&S FSH behind a
protective cap.
You can set up the LAN connection in the "Instrument Settings" dialog box.
For a direct connection between a PC and the R&S FSH, DHCP (Dynamic Host
Configuration Protocol) has to be turned off (which is the default state).
► In the "Instrument Setup" dialog box, select the "DHCP" item.
► Press the ENTER key.
A dropdown menu to select the DHCP state opens.
► Turn DHCP on or off as required.
Setting an IP address and subnet mask
To establish a connection, the PC and the R&S FSH have to be in the same subnet.
► Identify the subnet mask of your PC, for example in the Microsoft Windows
"TCP/IP Properties".
► In the "Instrument Setup" dialog box, select the "Subnet Mask" item.
► Press the ENTER key.
► Enter the subnet mask of the PC with the numeric keys.
► Confirm the entry with the ENTER key.

R&S FSH Operating the R&S FSH
Connecting the R&S FSH to a PC
Operating Manual 1173.6275.12 - 31 26
After you have matched the subnet mask, you can define the IP address. When both
devices are in the same subnet, the first three digits of the IP address are usually the
same ('192' in the example below).
Example
IP address PC 192.0.2.0
IP address R&S FSH 192.0.2.10
► Identify the IP address of your PC, for example in the Microsoft Windows "TCP/IP
Properties".
► In the "Instrument Setup" dialog box, select the "IP Address" item.
► Press the ENTER key.
► Enter the IP address of the PC with the numeric keys.
► Confirm the entry with the ENTER key.
Configuring the R&S InstrumentView software
► Start R&S InstrumentView.
► Select the "LAN" tab in the "Instrument Connect" dialog box.

R&S FSH Operating the R&S FSH
Connecting the R&S FSH to a PC
Operating Manual 1173.6275.12 - 31 27
► Press the "Add" button to create a new network connection.
► Specify a name for the new network connection, for example R&S FSH.
► Enter the IP address for the R&S FSH (in this case 192.0.2.10)
► Confirm the entry with the "OK" button.
The connection is now created and configured and is added to the IP Configuration
list.
► Select the new connection labeled R&S FSH.
► Press the Connect button to establish the connection.
R&S FSH Operating the R&S FSH
Connecting the R&S FSH to a PC
Operating Manual 1173.6275.12 - 31 28
1.8.2 Connecting the R&S FSH in an Existing LAN
You can either draw the R&S FSH IP address automatically from the DHCP server or
manually assign a fixed address. With manual allocation, a fixed IP address and
subnet mask must be assigned to the R&S FSH as described in the chapter on direct
LAN connection. Then the R&S InstrumentView software has to be configured as
described with the assigned IP address.
Free IP address
Contact your IT system manager to get a free IP address.
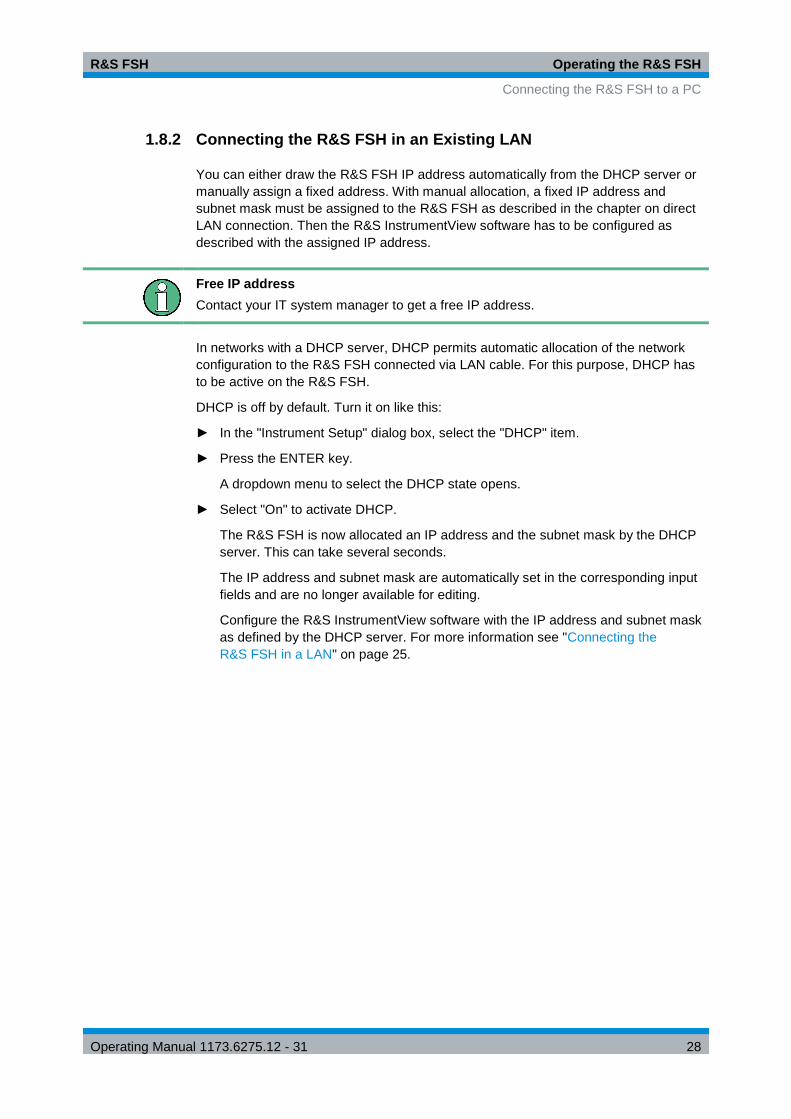
In networks with a DHCP server, DHCP permits automatic allocation of the network
configuration to the R&S FSH connected via LAN cable. For this purpose, DHCP has
to be active on the R&S FSH.
DHCP is off by default. Turn it on like this:
► In the "Instrument Setup" dialog box, select the "DHCP" item.
► Press the ENTER key.
A dropdown menu to select the DHCP state opens.
► Select "On" to activate DHCP.
The R&S FSH is now allocated an IP address and the subnet mask by the DHCP
server. This can take several seconds.
The IP address and subnet mask are automatically set in the corresponding input
fields and are no longer available for editing.
Configure the R&S InstrumentView software with the IP address and subnet mask
as defined by the DHCP server. For more information see "Connecting the
R&S FSH in a LAN" on page 25.

R&S FSH Operating the R&S FSH
Connecting the R&S FSH to a PC
Operating Manual 1173.6275.12 - 31 29
1.8.3 Connecting the R&S FSH via USB
Alternatively, you can connect the R&S FSH to the PC with the USB cable that is
supplied with the delivery. The Mini USB interface is located on the left side of the
R&S FSH behind a protective cap.
When you connect the R&S FSH to a computer for the first time, Windows tries to
install the new hardware automatically. The required drivers are installed along with the
R&S InstrumentView software package.
When the drivers have been found on your system and the hardware has been
successfully installed, Windows shows a corresponding message.
► Connect the R&S FSH via the Mini USB port to your computer.
► Start R&S InstrumentView on the PC.
► Select the "USB" tab in the "Instrument Connect" dialog box.
► Select the R&S FSH connection.
► Confirm the selection with the "Connect" button.
►
R&S FSH IP address
The R&S FSH internally emulates a LAN connection. The IP address displayed by
R&S InstrumentView for the USB connection is for information only. It is fixed to
172.16.10.10 and cannot be changed.

R&S FSH Operating the R&S FSH
Managing Datasets
Operating Manual 1173.6275.12 - 31 30
1.9 Managing Datasets
The R&S FSH provides functionality to manage (save, restore etc.) datasets available
in its internal memory or an external storage device.
The USB interface that supports the use of memory sticks is available for models with
serial numbers 105000 and higher.
Read-only files
If a file is labeled with a lock symbol in the "Stat" column of the file manager, it is read-
only and therefore cannot be edited.
You can remove the read-only attribute in several ways.
● Connect the R&S FSH to a PC and start the R&S InstrumentView software.
In the software, start the "Synchonization Control", select a file and lock or unlock
the file with the corresponding buttons.
● Copy the file to a computer and remove the attribute with the Windows functionality
(right click on the file, select "Properties" and remove the check from the "Read-
only" checkbox.
● Use the SYSTem:SET:UNLock command to remove the read-only attribute. Note
that you might have to select the correct directory first with MMEM:CDIR.
MMEM:CDIR '\Public\Cable Models'
SYST:SET:UNL 'xyz.cblmod'
Datasets
Basically, the R&S FSH supports various types of datasets. The instructions below
primarily describe managing datasets that you create on the R&S FSH during
measurements, for example measurement results and configurations. Note that these
datasets have the file extension .set.
Datasets with the file extension .set are an image of measurement results and
configurations. Thus, you can subsequently reproduce the context of the
measurement.
You can use datasets for documentation, for example, or use them for a more detailed
analysis later on (for example with the R&S InstrumentView software). Note that
datasets also contain calibration data if calibration has been performed.

R&S FSH Operating the R&S FSH
Managing Datasets
Operating Manual 1173.6275.12 - 31 31
Templates
The R&S FSH also supports various other types of datasets (or templates). Such
templates mainly contain additional requirements for a particular measurement, like
limit lines or channel tables.
Creating and editing these templates is only possible with the functionality provided by
the R&S InstrumentView software package. Note that the file extension depends on
the application of the template. For example, a template containing a channel table has
the extension .chntab.
For more information on working with templates refer to the documentation of the
R&S InstrumentView software package.
Data synchronization
The R&S InstrumentView features a data synchronization that matches the data
available on the R&S FSH and that on the computer with the R&S InstrumentView
installation.
► Press the "Synchronization Control" ( ) button.
The software opens another dialog box to control synchronization.
By default, the software synchronizes a selected set of data, depending on the
synchronization direction.
● Synchronization from PC to R&S FSH: button
Updates all files on the R&S FSH that have been created or edited with the
R&S InstrumentView software package (cable models, limit lines, transducers,
channel tables etc.).
● Synchronization from R&S FSH to PC: button
Updates all files on the PC that have been created on the R&S FSH (datasets,
screenshots and wizard results).
Removing outdated files
When you turn on "Remove Orphans", the software removes all files from the
R&S FSH that it cannot find on the PC.
Alternatively, you can synchronize all files at the same time
(templates and datasets) in one direction (PC to R&S FSH
or R&S FSH to PC), regardless of the file type.
► Turn on "Synchronize All".
► Press either the "FSH ← PC" button to update all files on the R&S FSH based on
the data available on the PC or the "FSH → PC" button to update the files on the
PC based on the data available on the R&S FSH.

R&S FSH Operating the R&S FSH
Managing Datasets
Operating Manual 1173.6275.12 - 31 32
1.9.1 Saving Datasets
The R&S FSH allows you to save the data that is currently analyzed at any time.
► Press the SAVE/RECALL key.
The R&S FSH opens the file manager.
► Press the "Save" softkey.
The R&S FSH opens the "Save Dataset" dialog box.
1 Available datasets and folder structure
2 Dataset name input field
3 Remaining memory on selected data storage device
4 File manager softkey menu
The folder structure shows all available data storage devices. Possible storage devices
are the internal memory of the R&S FSH, an SD card or a memory stick.
The default storage device depends on which devices are connected to the R&S FSH.
● If an SD card is connected, datasets are always stored there first.
● If a memory stick is connected, datasets are stored there only if no SD card is
connected.
● The internal memory is used only if neither SD card or memory stick are connected.
The internal memory provides approximately 20 MB of data, therefore the number of
datasets you save on the R&S FSH is limited. Each dataset needs about 100 kB of
memory, but this value can vary.
If you are using an external storage device, the number of datasets you can save is
limited only by the size of the storage device.
The R&S FSH shows the remaining memory on the storage device in the dialog box.
► Select the storage device you want to save the data to.
► Select the folder you want to save the data to.
► Enter a file name in the corresponding input field.

R&S FSH Operating the R&S FSH
Managing Datasets
Operating Manual 1173.6275.12 - 31 33
The default file name for datasets is "Dataset###.set" with a new number in
ascending order for each new dataset. The file extension for datasets is .set.
If you enter another name, the R&S FSH uses that name and assigns a new
number to the file name if you save the data set the next time. This function allows
you to assign consecutive dataset file names without entering a new name every
time you want to save a dataset.
You can enter the file name with the alphanumeric keypad. Each key covers more
than one character. To get the character you want, press the key in question the
appropiate number of times.
Instead of entering a file name character by character, you can also put a name
together using the quick naming feature. For more information see "Quick Naming
of Datasets" on page 34.
► Press the "Save" softkey.
The R&S FSH saves the dataset.
1.9.1.1 Alternative Ways to Save Datasets
The R&S FSH provides alternative and more comfortable ways to save datasets.
Using the key
You can configure the key to take a screenshot as well as saving a dataset.
► Press the SETUP key.
► Press the "User Preference" softkey.
► Select the "Capture Dataset" item and turn it on.
If on, pressing the key saves a dataset of the current measurement.
Pressing the key saves the selected data of the current measurement.
Saving events
You can configure the R&S FSH to save a dataset when an event occurs.
► Press the SETUP key.
► Press the "User Preference" softkey.
► Select the "Capture Dataset" item and turn it on.
If on, the R&S FSH saves a dataset of the current measurement if an event occurs.
For more information on events see "Saving Events" on page 22.

R&S FSH Operating the R&S FSH
Managing Datasets
Operating Manual 1173.6275.12 - 31 34
1.9.1.2 Renaming File Names
If necessary, you can rename files or file directories directly on the R&S FSH.
► Enter the "File Manager".
► Select the file or directory you want to rename.
► Press the "Select Action" softkey.
► Select the "Rename" menu item.
The R&S FSH opens an input field to change the name of the file.
1.9.1.3 Quick Naming of Datasets
The R&S FSH provides a quick naming feature that speeds up the process of naming
a file.
Putting together a file name
Basically, using the quick naming feature is a way of compiling a file name by putting
one or more predefined text modules or terms together in a logical way.
The various terms are combined in a table, each cell of which contains one term. The
table consists of 120 cells. You can define the contents of each cell freely.
► Press the SAVE/RECALL key.
► Press the "Save" softkey.
► Press the "Quick Naming" softkey.
The R&S FSH opens a dialog box that contains the terms.
► Select the term you want to add with the cursor keys.
► Press ENTER to add the term to
the file name.
The current file name is displayed
in the line above the table.
So, if you perform, for example, an
ACLR measurement of an uplink
LTE signal at a certain location,
you might want that information in
the file name:
'Site_LTE_UL_ACLR'
► Press the "OK" softkey to exit the quick naming table.
After you have exited the table, the file name appears in the "Save as:" field in the
"Save Dataset" dialog box. If necessary, you can then add additional characters.
Note that by default, the R&S FSH adds a term without separators between each term.
If you need a separator between the term, you can add a blank space or an
underscore.

R&S FSH Operating the R&S FSH
Managing Datasets
Operating Manual 1173.6275.12 - 31 35
► After having added a term, press the "_" softkey or the "Space" softkey.
Or to add a separator automatically upon adding a term.
► Press the "Auto Insert" softkey.
► Select the "Off" menu item to add no separator, the "_" menu item to add an
underscore or the "Space" menu item to add a blank space.
Designing a quick naming table
The firmware of the R&S FSH already has some basic mobile communication terms in
the table. However, you can add up to 120 terms to the table.
► Press the SAVE/RECALL key.
► Press the "Save" softkey.
► Press the "Quick Naming" softkey.
► Select one of the table cells with the cursor keys.
► Press the "Change Table Item" softkey.
The R&S FSH opens an input field to define a term for the cell.
► Define a term with the number keys and confirm the term with ENTER.
The R&S FSH adds the term to the table.
You can create and edit quick naming tables with the R&S InstrumentView software
package and then transfer them into the internal memory of the R&S FSH.
► In the "Quick Naming" softkey menu, press the "Import" softkey.
► Select the "Import Quick Naming Table" menu item.
The R&S FSH opens a dialog box to select a file to import.
The same way, you can also export a quick naming table.
► In the "Quick Naming" softkey menu, press the "Export" softkey.
► Select the "Export Quick Naming Table" menu item.
1.9.1.4 Converting Dataset File Types
The functionality of the R&S InstrumentView software allows you to convert a dataset
of the file type *.set into the *.csv format.
The conversion is possible with a command line option for the FSH4View.exe file.
The general syntax you have to use is:
FSH4View.exe -csv "<InputDataset.set>" "<DestinationFile.csv>"
Note that you have to use quotation marks for the file name if it contains blank spaces.
Example:
FSH4View.exe -csv 'Dataset.set' 'Dataset.csv'
Renames the file Datset.set into Dataset.csv.

R&S FSH Operating the R&S FSH
Managing Datasets
Operating Manual 1173.6275.12 - 31 36
Environment variables
The command line option only works if you execute the command from the installation
folder of R&S InstrumentView software.
Otherwise, you have to set a "Path" environment variable to the destination of the
location of the .exe file.
You can access the environment variable via the MS Windows control panel.
"Start Menu" "Control Panel" "System" "Advanced System Settings"
"Advanced" tab
"Environment Variables" button "System Variables" "Path"
► Add a new variable with the installation path of the software.
The default installation path is
● C:\Program Files\Rohde-Schwarz\FSH4View\ (for Windows XP, Vista and 7 (32-bit)
● C:\Program Files (x86)\Rohde-Schwarz\FSH4View\ (for Windows 7 64-bit)
If necessary, change the path as required.
R&S FSH Operating the R&S FSH
Managing Datasets
Operating Manual 1173.6275.12 - 31 37
1.9.2 Restoring Datasets
You can preview and load previously saved measurement results with the recall
function of the R&S FSH. This function also provides easy access to previous
measurement settings so that you do not have to set up the R&S FSH again.
► Press the SAVE/RECALL key.
The R&S FSH opens the file manager.
► Select the dataset you want to use.
The R&S FSH restores the configuration that the dataset contains.
By default, the most recently saved dataset is highlighted. If you need another dataset,
navigate to the folder or storage device that contains the dataset you need.
1.9.2.1 Previewing a Dataset
The R&S FSH provides a preview of datasets. The preview is like a screenshot and
lets you take a quick look at that measurement and its settings. The R&S FSH does
not yet activate the measurement settings of that dataset.
► Browse through the available datasets and select the one you want.
► Press the "Recall" softkey.
The R&S FSH shows a preview of the measurement contained in the selected
dataset. The preview shows the measurement results as well as the measurement
settings.
► Use the rotary knob to browse the previews of all datasets available in the selected
folder.
► Press the "Exit" softkey to return to the "Recall Dataset" dialog box.
1.9.2.2 Loading a Dataset
If you find a dataset whose settings you need for your current measurement task, you
can load it.
► Press the "Activate" softkey.
The R&S FSH loads the dataset in question and adjusts its measurement settings
to those of the dataset.

R&S FSH Operating the R&S FSH
Managing Datasets
Operating Manual 1173.6275.12 - 31 38
1.9.2.3 Quick Recall of Instrument Settings
For regular measurement tasks, the R&S FSH allows quick access to previously saved
datasets by linking a particular dataset to one of the softkeys.
Assigning a dataset to one of the softkeys
► Press the SETUP key.
The R&S FSH opens the setup menu.
► Press the "User Preference" softkey.
The R&S FSH opens the User Preference Setup menu.
In this menu you can customize the name of one of the softkeys F1 to F6 and assign a dataset to a specific softkey for quick access to that dataset. By default, the name of the label is "User-Pref 1" to "User-Pref 6".
► Select one of the User Key Labels F1 to F6.
► Customize the name of the softkey by entering a new one with the alphanumeric
keys, e.g. 'user label 1'.
The first word of the key label is displayed in the first row of the label, the rest in
the second row. If a label is too long to be displayed, it is truncated. If you enter no
label, the softkey will be inactive.
► Select the User Key Dataset corresponding to the customized User Key Label F1
to F6.
The R&S FSH opens the file manager and displays a list of available datasets.
► Select the dataset you want to assign to the softkey.
The R&S FSH returns to the User Preference Setup menu. The dataset is now
assigned to the softkey.
Recalling a dataset
► Press the USER key.
► Press one of the softkeys F1 to F6 in the menu.
Note that the label of the softkeys depends on the settings made in the User
Preference Setup menu.
The R&S FSH immediately activates the dataset assigned to that softkey.

R&S FSH Operating the R&S FSH
Managing Datasets
Operating Manual 1173.6275.12 - 31 39
1.9.3 Deleting Datasets
If you have to delete a dataset, you can do so with the file manager.
► Press the SAVE/RECALL key.
► Press the "File Manager" softkey.
The R&S FSH opens the file manager.
► In order to delete a single dataset, press the "Select Action" softkey. Select
"Delete" and the dataset currently selected is deleted after your confirmation.
In order to delete multiple data sets, the respective datasets have to be marked first.
► Press the "Mark" softkey to mark files for deletion
► Select the dataset you'd like to delete.
► Mark the data sets with the ENTER key.
The selected data sets should be checked in the "Status" column.
Repeat the selection by moving the cursor with the rotary knob or the cursor key
and marking more data sets with the ENTER key.
► Press the "Select Action" softkey.
► Select the "Delete" menu item and confirm with the ENTER key or the "Select
Action" softkey.
Before deleting the data set, the R&S FSH shows a warning message that you
need to confirm. After confirming the deletion process the R&S FSH deletes the
selected data sets from its memory.

R&S FSH Operating the R&S FSH
Updating the Firmware
Operating Manual 1173.6275.12 - 31 40
1.10 Updating the Firmware
You can download new firmware versions from the R&S FSH website.
http://www.rohde-schwarz.com/product/fsh.html
The website also provides release notes for each new firmware version. The release
notes include instructions on how to perform a firmware update.
1.11 Installing Firmware Options
You can equip the R&S FSH with several firmware options to enable additional
operating modes or special measurements.
For more information see the "Quick Start Guide"

R&S FSH Working with the Measurement Wizard
Installing Firmware Options
Operating Manual 1173.6275.12 - 31 41
2 Working with the Measurement Wizard
When testing antennas and cables it is often necessary to perform a sequence of
standardized and recurring measurements, often in an environment that is not easily
accessible. To make sure that measurements are performed as required and to avoid
a constant adjustment of parameters, the R&S FSH features a measurement wizard.
The measurement wizard allows you to combine several individual measurement
configurations to a sequence of measurements (or measurement set). Because all
relevant parameters have been set prior to the actual measurement and cannot be
changed once the measurement procedure has begun, the wizard is a good way to
avoid mistakes and save time when setting up measurements.
This chapter describes the functionality of the measurement wizard. For details on the
individual measurements you can perform with the wizard, refer to the corresponding
chapters.
● Spectrum Analyzer Mode on page 52
● Power Meter on page 135
● Network Analyzer Mode on page 154
● Distance-to-Fault Mode (R&S FSH-K41) on page 212
● Receiver Mode on page 228
● Interference Analyzer (R&S FSH-K15/ -K16) on page 154
● Digital Modulation Analyzer on page 239
You can use the wizard for measurements in all operating modes.
Note that it is necessary to install and use the R&S InstrumentView software package if
you want to access the measurement wizard.

R&S FSH Working with the Measurement Wizard
Preparing the Measurement
Operating Manual 1173.6275.12 - 31 42
2.1 Preparing the Measurement
Before you can use the measurement wizard you have to define a measurement set
with the R&S InstrumentView software package and transfer it to the R&S FSH.
The R&S InstrumentView software package is delivered with the R&S FSH. The latest
version is also available for download on the R&S FSH website at
http://www2.rohde-schwarz.com/product/fsh.html
2.1.1 Creating a Measurement Set
A measurement set consists of several datasets. A dataset is a file that contains the
settings of a specific R&S FSH configuration, for example frequency, scaling etc. To
get hold of a dataset, set up the R&S FSH as you need and save the configuration or
use one of the predefined datasets.
For more information on datasets see "Saving Datasets" on page 32.
► Start the R&S InstrumentView software on your PC.
► Select the "Wizard Set Editor" with the button.
The R&S FSH opens a dialog that provides all functionality to manage
measurement sets.
1 Name of the measurement set
2 Description of the measurement task
3 Font type for on-screen instructions (latin and some asian fonts are supported)
4 Measurement set password protection
5 Measurement sequence control
6 Calibration method
7 Cable characteristics (length and model)

R&S FSH Working with the Measurement Wizard
Preparing the Measurement
Operating Manual 1173.6275.12 - 31 43
8 Control of cable characteristics (model and length) after individual measurements
9 List of datasets that are available via the PC
10 List of datasets that are currently part of the measurement set
11 File management options
12 Preview dataset button
► Set up the measurement set as you like by adding or removing datasets.
The editor also allows you to add comments to each measurement that is part of the
measurement set. You can also rename the measurement.
► Select one of the datasets and click on the button.
The R&S FSH opens another dialog box.
In this dialog box, you can
- see the name of the selected dataset
- define a name for the corresponding measurement
- include instructions (verbal or graphical) about performing the measurement
- define several hardware settings as described in the Quick Start Guide.
- select a calibration method specific for that measurement
You can add instructions for every measurement that you include in the set to
avoid handling measurements incorrectly.
The R&S FSH shows these instructions before the measurement starts.
Password protection for measurement sets
It is possible to protect the contents of measurement sets with a password from
unauthorized access.
If you protect a measurement set, you are able to edit the contents of the
measurement set only after you have entered the correct password.
In addition, you can control who is using the measurement sets by limiting its access
to a particular set of R&S FSH serial numbers only. All other devices will not be able
to process these wizard files.

R&S FSH Working with the Measurement Wizard
Preparing the Measurement
Operating Manual 1173.6275.12 - 31 44
2.1.2 Uploading Measurement Sets
In order to perform the actual measurements, you have to upload the wizard definition
file that contains the set of measurements to the R&S FSH.
► Select the "Wizard Set Control" function with the button.
The R&S FSH opens a dialog box to select the measurement set(s) to upload.
► Select the measurement set you want to upload.
► Copy the files with the button.
The software stores a copy of the measurement set in the memory of the
R&S FSH.
Alternatively, you can use a memory stick or SD card to access a measurement
set on the R&S FSH.

R&S FSH Working with the Measurement Wizard
Using the Measurement Wizard
Operating Manual 1173.6275.12 - 31 45
2.2 Using the Measurement Wizard
Now that the measurement set is available on the R&S FSH you can start performing
measurements.
2.2.1 Starting the Measurement Wizard
► Press the USER key.
► Press the "Wizard" softkey".
The R&S FSH opens the "Wizard" dialog box. This dialog box contains information
about the measurement set, including several parameters whose values you can
change during the measurement (for example the site name).
► Press the "Load Meas Set" softkey.
The R&S FSH opens the file manager.
► Select the file that contains the
measurement set that you require.
► Confirm the selection with the
"Select" softkey.
The R&S FSH returns to the
measurement wizard dialog box. It
now displays information about the
measurement set you have just
loaded.
The dialog box contains the following information:
● Measurement Definition
Name of the wizard definition file currently in use. Pressing the ENTER key on this
field has the same effect as the "Load Meas Set" softkey.
● Measurement Description
Short description of the measurement task. This is a read only field that shows the
description as defined with the R&S InstrumentView software.
● User
Name of the person that performs the measurement.
● Number of Sequence Steps to Perform
Number of individual measurements in the measurement sequence.
The field allows you to reduce the number of individual measurements and perform
only those measurements that are really necessary. If you reduce the number of
measurements, the R&S FSH omits the last measurements in the sequence.

R&S FSH Working with the Measurement Wizard
Using the Measurement Wizard
Operating Manual 1173.6275.12 - 31 46
You can edit this field only if you have turned on the "Allow Variable Number of
Sequence Steps" in the "Wizard Set Editor" of the R&S InstrumentView software.
● Site Name
Location of the measurement. This field is available on the R&S FSH only.
● Comments
Comments about the measurement, e.g. the external conditions during the
measurement.
● GPS Position
Shows the GPS position, if you have connected a GPS receiver. Pressing the
ENTER key on this field results in an update of the GPS coordinates.
● Use Wizard Cable Settings
Determines if you want to use the cable characteristics as defined in the
measurement set or if you want to be able change cable characteristics on site.
Select "Yes" to use the predefined cable characteristics. In That case the
parameters below will be locked.
● Cable Model
Cable model that you perform the measurement on. You can define a cable model
with the R&S InstrumentView software, but can also change the cable model on
short notice, if necessary.
● Clear Cable Model
Deactivates the currently active cable model.
● Cable Length
Length of the cable that you perform the measurement on.
● Calibration
Calibration method to use before the measurement starts. This is a read only field,
the calibration method has to be defined with R&S InstrumentView.
You have to calibrate the R&S FSH before you can begin with the measurement
sequence defined in the wizard. If the R&S FSH has already been calibrated with
the defined routine prior to starting the wizard, the R&S FSH skips the calibration
and directly starts the measurement.
● Measurements
List of all individual measurements (datasets) that need to be performed for
successful completion of the measurement task. The list also shows the
measurements that still need to be performed.

R&S FSH Working with the Measurement Wizard
Using the Measurement Wizard
Operating Manual 1173.6275.12 - 31 47
Some parameters of the measurement setup you can still change directly on the
R&S FSH. These are mainly parameters whose details may not be available when you
define the measurement set or whose details may differ depending on the
measurement site, e.g. the cable length or the cable model if it is different to the one
defined previously.
► To change a parameter, select it with the cursor keys and activate the
corresponding input field with the ENTER key.
► Update all parameters that are not correct for the current measurement.

R&S FSH Working with the Measurement Wizard
Using the Measurement Wizard
Operating Manual 1173.6275.12 - 31 48
2.2.2 Performing a Sequence of Measurements
Now that you have updated all parameters concerning the measurement task, you can
start the measurement procedure.
► Press the "Start Meas Set" softkey.
If calibration of the R&S FSH is necessary for the measurement task, it asks you to
perform the calibration routine. The stages of the calibration depend on the defined
calibration routine.
For more information see "Calibrating Measurements" on page 182.
Calibration pool
The R&S FSH adds the calibration data of each calibration you perform to a calibration
pool available on its internal memory. Each dataset in the calibration pool is unique for
a particular calibration method and a particular measurement configuration.
Note that the calibration is only valid for the instrument it has been performed on.
Before you start a measurement sequence with the measurement wizard, the
R&S FSH compares the contents of the calibration pool to the measurement
configurations and required calibration methods in the measurement sequence.
● If the R&S FSH has already been calibrated for a particular configuration, it
restores that data. Another calibration is not necessary.
● If the R&S FSH has not been calibrated for a particular configuration yet,
calibration becomes necessary. The new calibration data is added to the pool.
Therefore, calibration is necessary only for calibration methods that have not been
used for a particular measurement configuration before.
However, it is recommended to perform calibration on a regular basis to keep
measurements as accurate as possible.
You can delete obsolete calibration data from the folder:
\Public\CalibrationPool.
Measurement sequence
After having successfully calibrated the R&S FSH, it starts to go through the
measurements that are part of the measurement set. The sequence of measurements
is as defined with R&S InstrumentView.
Before each measurement, the
R&S FSH shows a message box.
The message box contains the information and instructions on how to prepare and
perform the measurement that you have defined with the R&S InstrumentView
software.
► Make the necessary preparations, like connecting the cable.
► Press the "Confirm" softkey.

R&S FSH Working with the Measurement Wizard
Using the Measurement Wizard
Operating Manual 1173.6275.12 - 31 49
The R&S FSH performs the measurement as defined in the dataset and
measurement set. When finished, it shows the measurement results and says
.
Note that it is not possible to change any measurement parameters while using the
measurement wizard. Marker functionality, scaling parameters and (if configured
that way) cable settings are, however, available.
Changing cable characteristics
If necessary, you can define different cable characteristics (cable model and length)
after each individual measurement. This is useful, for example, if you want to do the
same measurements on different cables at one go.
This feature is available when you turn on "Prompt User to Change Cable Settings" in
the "Wizard Set Editor" of the R&S InstrumentView software.
When this function is on, the R&S FSH asks you to select new cable characteristics
during the preparation of a measurement.
► Press the "Yes" softkey if changes are required and select new cable
characteristics before proceeding with the measurement.
► Press the "No" softkey if changes are not required and proceed with the
measurement.
After each measurement step, you have several options:
- Continue with the next measurement ("Continue" softkey).
Finishes the current measurement and begins with the next measurement by
showing the necessary preparations.
- Repeat the current measurement ("Repeat Meas" softkey).
Repeats the current measurement, e.g. if the results don't match your
expectations and you want to validate the results.
- Interrupt the measurement set sequence ("Interrupt Wizard" softkey).
Interrupting the sequence of measurements may become necessary if the
measurement doesn't yield the expected results (e.g. violated limit lines).
In that case, you can interrupt the measurement sequence and try to find the
origin of the problem by using different settings or measurements than those
defined in the wizard.
When you interrupt the wizard sequence, the complete functionality is
available as if you would not use the wizard.
When you interrupt a measurement sequence, the R&S FSH keeps the results
of measurements you have already performed.
When you are finished reconfiguring the measurement, press the WIZARD key
and resume the measurement sequence with the "Resume Sequence" softkey.

R&S FSH Working with the Measurement Wizard
Using the Measurement Wizard
Operating Manual 1173.6275.12 - 31 50
- Skip a measurement ("Skip Meas" softkey).
Skips a single measurement and initiates the subsequent measurement.
Skipping individual measurements is possible when you turn on "Allow to skip
measurements and finish wizard sequence" in the "Wizard Set Editor" of the
R&S InstrumentView software.
- End the measurement sequence ("Finish Wizard" softkey).
Ends the measurement sequence and returns to the "Measurement Wizard"
dialog box. The results of the measurements you have already finished are
kept in the memory of the R&S FSH.
Ending the sequence is possible when you turn on "Allow to skip
measurements and finish wizard sequence" in the "Wizard Set Editor" of the
R&S InstrumentView software.
- Abort the measurement sequence ("Cancel" softkey).
Aborts the measurement and returns to the "Measurement Wizard" dialog box.
The results of the measurements you have already finished are lost.
When you have finished all measurements that are part of the measurement set, the
R&S FSH asks you if you want to save the measurement results.
► Press the "Save Meas Results" softkey.
The R&S FSH saves the results on the selected storage device.
Limited internal memory
If you have to store the results on the internal memory, make sure that it has enough
space left to store them. Else the results might get lost. If the space is not enough, you
can delete old data with the file manager.
For more information see "Deleting Datasets" on page 39.
The results for a measurement set consist of a number of files, each file corresponding
to one of the performed measurements. For easy evaluation, the R&S FSH includes
the name of the measurement as defined in the wizard dialog or R&S InstrumentView
in the file name.
All result files that belong to a measurement set are stored in the same directory. The
directory is named after the measurement name and site. The syntax is
'sitename_measurement_#'.
The R&S FSH adds numbers in ascending order to files as well as directories if you
perform a measurement or measurement set more than once.
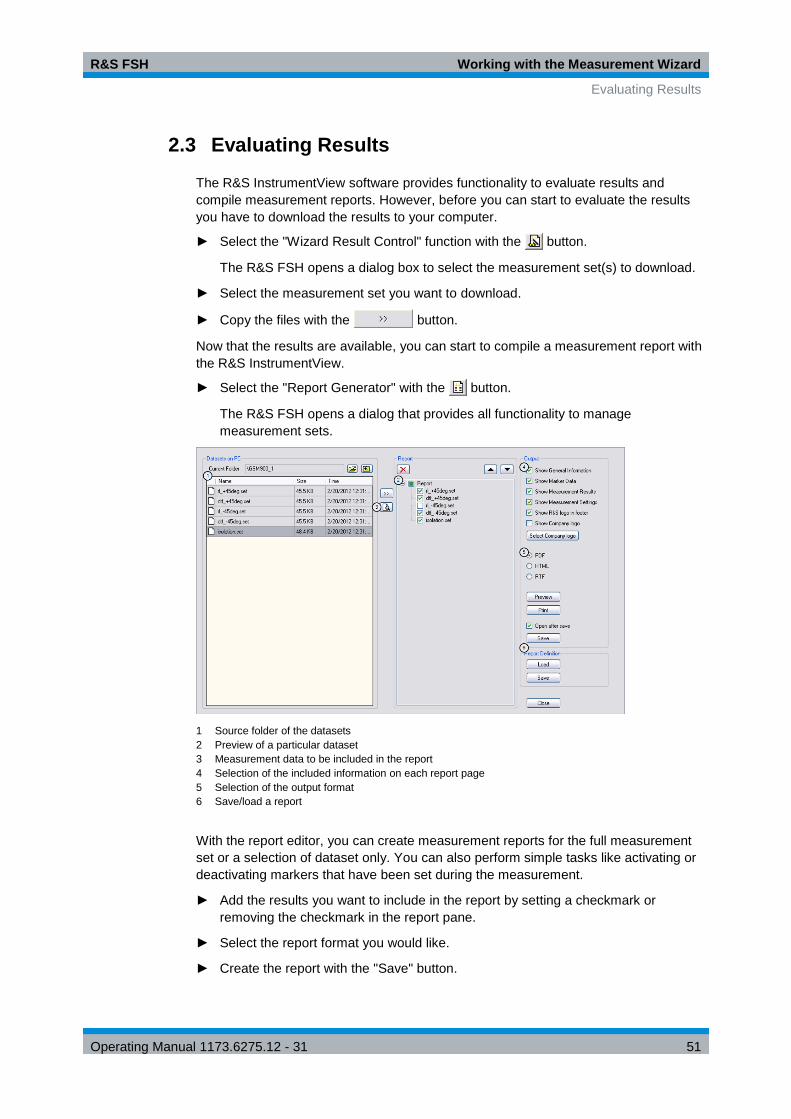
R&S FSH Working with the Measurement Wizard
Evaluating Results
Operating Manual 1173.6275.12 - 31 51
2.3 Evaluating Results
The R&S InstrumentView software provides functionality to evaluate results and
compile measurement reports. However, before you can start to evaluate the results
you have to download the results to your computer.
► Select the "Wizard Result Control" function with the button.
The R&S FSH opens a dialog box to select the measurement set(s) to download.
► Select the measurement set you want to download.
► Copy the files with the button.
Now that the results are available, you can start to compile a measurement report with
the R&S InstrumentView.
► Select the "Report Generator" with the button.
The R&S FSH opens a dialog that provides all functionality to manage
measurement sets.
1 Source folder of the datasets
2 Preview of a particular dataset
3 Measurement data to be included in the report
4 Selection of the included information on each report page
5 Selection of the output format
6 Save/load a report
With the report editor, you can create measurement reports for the full measurement
set or a selection of dataset only. You can also perform simple tasks like activating or
deactivating markers that have been set during the measurement.
► Add the results you want to include in the report by setting a checkmark or
removing the checkmark in the report pane.
► Select the report format you would like.
► Create the report with the "Save" button.

R&S FSH Spectrum Analyzer Mode
Performing Spectrum Measurements
Operating Manual 1173.6275.12 - 31 52
3 Spectrum Analyzer Mode
The default operating mode of the R&S FSH is the spectrum analyzer. The spectrum
analyzer provides the functionality to perform measurements in the frequency domain,
e.g. to identify the power of signals.
3.1 Performing Spectrum Measurements
In addition to basic spectrum measurements, the R&S FSH provides several specific
measurements. These measurements, also in combination with one of the available
accessories, allow you to perform advanced and more complex measurement tasks.
3.1.1 Measuring Basic Signal Characteristics
Basic spectrum measurements determine the spectrum of a signal in the frequency
domain or keep track of a signal in the time domain. They provide a basic overview of
the input signal characteristics.
Frequency domain
In the frequency domain, the R&S FSH analyzes the input signal characteristics over a
particular span. You can use it, for example, to obtain basic measurement results like
peak levels and the shape of the spectrum.
The horizontal axis shows the frequency, the vertical axis shows the signal levels.
The measurement in the frequency domain is the default measurement mode.
Time domain
In the time domain, the R&S FSH analyzes the characteristics of a signal at a particular
frequency over time. The span during time domain measurements is 0 (zero span
mode). You can use time domain measurements, for example to monitor the
characteristics of a signal.
The horizontal axis shows the time, the vertical axis shows the signal levels.
To perform a time domain measurement, you have to set the span to zero manually.

R&S FSH Spectrum Analyzer Mode
Performing Spectrum Measurements
Operating Manual 1173.6275.12 - 31 53
3.1.2 Measuring the Channel Power of Continuously Modulated Signals
The channel power measurement selectively measures the power of modulated
signals. Unlike a power meter that performs measurements over its entire frequency
range, the channel power measurement measures the power of a specific transmission
channel. Other signals in the frequency spectrum don't show in the results.
When measuring the spectrum within a channel, the R&S FSH uses a resolution
bandwidth that is small compared to the channel bandwidth. It then determines the
total power of the channel by integrating the results on the trace. The R&S FSH takes
the following parameters into account:
● display mode (absolute or relative)
● detector
● resolution bandwidth
That means that you can compare the result to the result that would have been
obtained from a thermal power meter. The small resolution bandwidth acts like a
narrow channel filter and so prevents out-of-channel emissions from affecting the
result.
► Press the MEAS key.
► Press the "Meas Mode" softkey.
► Select the "Channel Power" menu item.
The R&S FSH starts to measure the channel power.
By default, the 3GPP WCDMA standard is active. Two vertical lines show the
channel bandwidth.
Screen layout for channel power measurements
1 Standard
2 Channel bandwidth
3 Channel power numerical
4 Channel bandwidth graphical (blue lines)
5 Channel power measurement softkey menu

R&S FSH Spectrum Analyzer Mode
Performing Spectrum Measurements
Operating Manual 1173.6275.12 - 31 54
3.1.2.1 Selecting the Standard
If you need to perform measurements that are conform to a telecommunications
standard, you can activate one of the predefined standards that are already stored in
the R&S FSH memory. However, you can create new configurations to perform
measurements on other standards as well.
► Press the MEAS key.
► Press the "Standard" softkey.
The R&S FSH opens a dialog box to select the standard.
► Select one of the available standards.
► Confirm the selection with the "Select" softkey.
The R&S FSH loads the configuration of the selected standard. It automatically
sets the optimal span, resolution bandwidth, video bandwidth, sweep time and
detector for the standard.
If the measurement is not according to the selected standard anymore (e.g. if you
make changes to a parameter), the R&S FSH puts a red dot in front of the
standard display ( ).
You can create and edit standards with the R&S InstrumentView software and transfer
them to the R&S FSH via the USB or the LAN interface. The number of standards the
R&S FSH can store in its memory depends on the number of other data sets stored on
the R&S FSH.
For more information see "Managing Datasets" on page 30.
3.1.2.2 Setting the Reference Level
The reference level is the power level that the R&S FSH expects at the RF input. When
selecting the reference level, make sure that you do not overload the R&S FSH by
applying a signal whose power exeeds the maximum reference level.
As the power is measured with a small resolution bandwidth compared to the signal
bandwidth, it is still possible to overload the R&S FSH, even if the trace is within the
measurement diagram. To prevent an overload, perform the measurement with the
largest resolution bandwidth possible using the peak detector. If you set these
parameters, it is not possible for the trace to exceed the reference level.
To simplify operation and to prevent incorrect measurements, the R&S FSH has an
automatic routine for setting the reference level.
► Press the AMPT key.
► Press the "Level Adjust" softkey.
The R&S FSH performs a
measurement to determine the
optimal reference level.

R&S FSH Spectrum Analyzer Mode
Performing Spectrum Measurements
Operating Manual 1173.6275.12 - 31 55
It uses a resolution bandwidth of 1 MHz, a video bandwidth of 1 MHz and the peak
detector. After finishing the automatic measurement, the R&S FSH sets the optimal
reference level.
3.1.2.3 Setting the Channel Bandwidth
The channel bandwidth specifies the frequency range around the center frequency,
over which the R&S FSH performs the power measurement.
► Press the MEAS key.
► Press the "Chan BW" softkey.
The R&S FSH opens an input field to specify the channel bandwidth.
► Enter the channel bandwidth you need.
The R&S FSH sets the appropriate span for the channel bandwidth that you have
entered (span = 1.2 x channel bandwidth). This ensures that no incorrect channel
power measurements are made.
The minimum channel bandwidth that you can set is 833 Hz at a span of 1 kHz.
3.1.2.4 Changing the Span
Usually, the span the R&S FSH sets yields optimal results. But sometimes you also
need to see the spectrum outside the current span to detect other signal components
that you need to include in the measurement. Therefore, you can adjust the span to up
to ten times the channel bandwidth and hence still be able to see the spectrum outside
the measurement channel.
► Press the SPAN key.
In the default configuration, "Auto Span" is active. The R&S FSH automatically sets
the optimal span for the channel power measurement.
► Press the "Manual Span" softkey.
The R&S FSH opens an input field to define the span manually.
► Enter the span you need.
The largest possible span for the channel power measurement is ten times the
channel bandwidth. At larger spans, the result of the channel power measurement
would be increasingly imprecise, because too few points of the trace would be in
the channel you are measuring.
► Press the "Auto Span" softkey.
The R&S FSH again calculates the span automatically.

R&S FSH Spectrum Analyzer Mode
Performing Spectrum Measurements
Operating Manual 1173.6275.12 - 31 56
3.1.2.5 Measuring the Maximum Channel Power
If signal levels fluctuate significantly, you can define the maximum channel power with
the Max Hold function.
► Press the MEAS key.
► Press the "Power Display" softkey.
► Select the "Max Hold" menu item.
The power display switches from "Power" to "Max Power".
If you want to deactivate the Max Hold function and return to the normal power display,
activate Clear/Write.
► To deactivate the Max Hold function, press the "Power Display" softkey.
► Select the "Clear/Write" menu item.
The power display returns to "Power" display.
3.1.2.6 Unit for Power Display
The R&S FSH can apply different units to the power output. The default unit is dBm.
► Press the MEAS key.
► Press the "Power Unit" softkey.
► Select the unit you want from the submenu.
The R&S FSH displays the power level in the selected unit.

R&S FSH Spectrum Analyzer Mode
Performing Spectrum Measurements
Operating Manual 1173.6275.12 - 31 57
3.1.3 Measuring the Occupied Bandwidth
The proper operation of a transmission network requires that all transmitters adhere to
the bandwidths assigned to them. The occupied bandwidth is defined as the bandwidth
that contains a specified percentage of the entire power of the transmitter.
Numerous standards require a occupied bandwidth of 99 %. Therefore this is the
default setting. If you need another percentage for the occupied bandwidth you can set
values from 10 % to 99.9 %.
After entering the channel bandwidth, the R&S FSH automatically selects the
measurement parameters so that you can attain the best result.
► Press the MEAS key.
► Press the "Meas Mode" softkey.
The R&S FSH opens the measurement menu.
► Select the "Occupied BW" menu item.
The R&S FSH starts to measure the occupied bandwidth.
Two vertical lines show the occupied bandwidth.
Screen layout for the occupied bandwidth
1 Standard
2 Occupied bandwidth numerical
3 Channel bandwidth
4 Power percentage
5 Occupied bandwidth graphical (blue lines)
5 Occupied bandwidth measurement softkey menu

R&S FSH Spectrum Analyzer Mode
Performing Spectrum Measurements
Operating Manual 1173.6275.12 - 31 58
3.1.3.1 Selecting a Standard
If you need to perform measurements that are conform to a telecommunications
standard, you can activate one of the predefined standards that are already stored in
the R&S FSH memory. However, you can create new configurations to perform
measurements on other standards as well.
► Press the MEAS key.
► Press the "Standard" softkey.
The R&S FSH opens a dialog box to select the standard.
► Select one of the available standards.
► Confirm the selection with the "Select" softkey.
The R&S FSH loads the configuration of the selected standard. It automatically
sets the optimal span, resolution bandwidth, video bandwidth, sweep time and
detector for the standard.
You can create and edit standards with the R&S InstrumentView software and transfer
them to the R&S FSH via the USB or the LAN interface. The number of standards the
R&S FSH can store in its memory depends on the number of other data sets stored on
the R&S FSH.
For more information see "Managing Datasets" on page 30.
If you make changes to the settings or create datasets, note that
● the span is always coupled to the channel bandwidth. Changes to either of those
automatically adjust the other (= 5 x channel bandwidth).
● the resolution bandwidth should be between 1 % and 4 % of the channel
bandwidth. This ensures that the occupied bandwidth is measured with high
accuracy.
● the video bandwidth must be at least three times the resolution bandwidth. This
prevents incorrect results due to the compression of signal peaks by the video
filter.
● you use the RMS detector if possible. This ensures that the power measurement is
always correct irrespective of the waveform being investigated.
● the sweep time must be set so that the result is stable. If you increase the sweep
time, the R&S FSH also increases the integration time for the RMS detector and
thus ensures more stable measured values.
3.1.3.2 Setting the Reference Level
The reference level is the power level that the R&S FSH expects at the RF input. When
selecting the reference level, make sure that you do not overload the R&S FSH by
applying a signal whose power exeeds the maximum reference level.
As the power is measured with a small resolution bandwidth compared to the signal
bandwidth, it is still possible to overload the R&S FSH, even if the trace is within the
measurement diagram.

R&S FSH Spectrum Analyzer Mode
Performing Spectrum Measurements
Operating Manual 1173.6275.12 - 31 59
To prevent an overload, perform the measurement with the largest resolution
bandwidth possible using the peak detector. If you set these parameters, it is not
possible for the trace to exceed the reference level.
To simplify operation and to prevent incorrect measurements, the R&S FSH has an
automatic routine for setting the reference level.
► Press the AMPT key.
► Press the "Level Adjust" softkey.
The R&S FSH performs a measurement to determine the ideal reference level.
It uses a resolution bandwidth of 1 MHz, a video bandwidth of 1 MHz and the peak
detector. After finishing the automatic measurement, the R&S FSH sets the ideal
reference level.
3.1.3.3 Setting the Channel Bandwidth
The channel bandwidth specifies the frequency range around the center frequency,
over which the R&S FSH performs the power measurement.
► Press the MEAS key.
► Press the "Chan BW" softkey.
The R&S FSH opens an input field to specify the channel bandwidth.
► Enter the channel bandwidth you need.
The R&S FSH sets the appropriate span for the channel bandwidth that you have
entered (span = 5 x channel bandwidth). This ensures that no incorrect channel
power measurements are made.
The minimum channel bandwidth that you can set is 2 kHz at a span of 1 kHz.
3.1.3.4 Defining the Percentage of Occupied Bandwidth
By default, the power percentage inside the occupied bandwidth is 99 %, a number
most standards require. If you measure standards that specify another power
percentage you can change that value.
► Press the MEAS key.
► Press the "% Power BW" softkey.
The R&S FSH opens an input field to define the power percentage.
► Enter the power percentage you need.
The value you enter here is the power percentage that has to be inside the channel
bandwidth relative to the power over the total span (the percentage of the total
power).
The R&S FSH now displays the occupied bandwidth graphically in the trace
window and numerically above the trace window.

R&S FSH Spectrum Analyzer Mode
Performing Spectrum Measurements
Operating Manual 1173.6275.12 - 31 60
3.1.3.5 Changing the Span
Usually, the span the R&S FSH sets yields optimal results. But sometimes you also
need to see the spectrum outside the current span to detect other signal components
that you need to include in the measurement. Therefore, you can adjust the span to up
to ten times the channel bandwidth and still be able to see the spectrum outside the
measurement channel.
► Press the SPAN key.
In the default configuration, "Auto Span" is active. The R&S FSH automatically sets
the optimal span for the channel power measurement.
► Press the "Manual Span" softkey.
The R&S FSH opens an input field to define the span manually.
► Enter the span you need.
The largest possible span for the channel power measurement is ten times the
channel bandwidth. At larger spans, the result of the channel power measurement
would be increasingly imprecise, because too few points of the trace occur in the
channel to be measured.
► Press the "Auto Span" softkey.
The R&S FSH again calculates the span automatically.
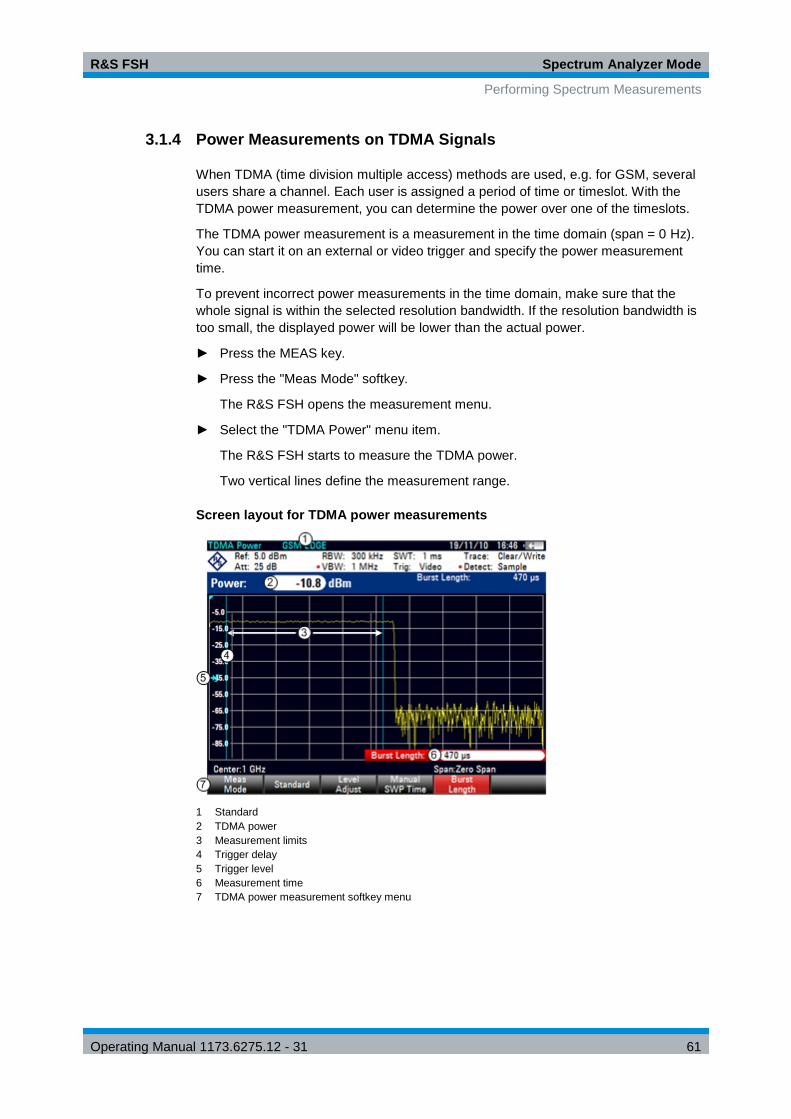
R&S FSH Spectrum Analyzer Mode
Performing Spectrum Measurements
Operating Manual 1173.6275.12 - 31 61
3.1.4 Power Measurements on TDMA Signals
When TDMA (time division multiple access) methods are used, e.g. for GSM, several
users share a channel. Each user is assigned a period of time or timeslot. With the
TDMA power measurement, you can determine the power over one of the timeslots.
The TDMA power measurement is a measurement in the time domain (span = 0 Hz).
You can start it on an external or video trigger and specify the power measurement
time.
To prevent incorrect power measurements in the time domain, make sure that the
whole signal is within the selected resolution bandwidth. If the resolution bandwidth is
too small, the displayed power will be lower than the actual power.
► Press the MEAS key.
► Press the "Meas Mode" softkey.
The R&S FSH opens the measurement menu.
► Select the "TDMA Power" menu item.
The R&S FSH starts to measure the TDMA power.
Two vertical lines define the measurement range.
Screen layout for TDMA power measurements
1 Standard
2 TDMA power
3 Measurement limits
4 Trigger delay
5 Trigger level
6 Measurement time
7 TDMA power measurement softkey menu

R&S FSH Spectrum Analyzer Mode
Performing Spectrum Measurements
Operating Manual 1173.6275.12 - 31 62
3.1.4.1 Selecting a Standard
If you need to perform measurements that are conform to a telecommunications
standard, you can activate one of the predefined standards that are already stored in
the R&S FSH memory. When starting the measurement in the default configuration,
the R&S FSH automatically activates the GSM/EDGE standard. However, you can
create new configurations to perform measurements on other standards as well.
► Press the MEAS key.
► Press the "Standard" softkey.
The R&S FSH opens a dialog box to select the standard.
► Select one of the available standards.
► Confirm the selection with the "Select" softkey.
The R&S FSH loads the configuration of the selected standard. It automatically
sets the optimal settings for the selected standard.
You can create and edit standards with the R&S InstrumentView software and transfer
them to the R&S FSH via the USB or the LAN interface. The number of standards the
R&S FSH can store in its memory depends on the number of other data sets stored on
the R&S FSH.
For more information see "Managing Datasets" on page 30.
3.1.4.2 Setting the Burst Length
The burst length is the measurement time that the R&S FSH performs measurements
with. The burst length can be equal or less than the sweep time.
► Press the MEAS key.
► Press the "Burst Length" softkey.
The R&S FSH opens an input field to define the burst length.
► Enter the length of the burst you need.
The R&S FSH performs the measurement over the time you have entered.
If the measurement time you have entered was greater than the sweep time, the
R&S FSH sets a burst length equal to the sweep time. To work with a greater burst
length, you have to increase the sweep time first.
The minimum burst length is the time corresponding to one trace pixel (= sweep
time / 631).
3.1.4.3 Setting the Reference Level
The reference level is the power level that the R&S FSH expects at the RF input. When
selecting the reference level, make sure that you do not overload the R&S FSH by
applying a signal whose power exeeds the maximum reference level.

R&S FSH Spectrum Analyzer Mode
Performing Spectrum Measurements
Operating Manual 1173.6275.12 - 31 63
Because the resolution bandwidths of the R&S FSH are implemented digitally after the
A/D converter, the signal level at the A/D converter can be higher than the level
indicated by the trace, depending on the selected resolution bandwidth.
To prevent the A/D converter from being overloaded, the signal must be measured at
the widest resolution bandwidth and video bandwidth with the peak detector. The trace
maximum then determines the best reference level.
To simplify operation and to prevent incorrect measurements, the R&S FSH has an
automatic routine for setting the reference level.
► Press the AMPT key.
► Press the "Level Adjust" softkey.
The R&S FSH performs a measurement to determine the ideal reference level.
It uses a resolution bandwidth of 3 MHz, a video bandwidth of 3 MHz and the peak
detector. After finishing the automatic measurement, the R&S FSH sets the ideal
reference level.
3.1.4.4 Using a Trigger
Usually you will apply a trigger when measuring bursts.
If a trigger is active, the R&S FSH uses the video trigger for TDMA measurements by
default. The video trigger level is at 50 % of the range of the vertical axis but is
variable. This means, the R&S FSH triggers a measurement if the rising edge of the
burst exceeds this 50 % line.
If the DUT features some sort of trigger equipment, you can also use an external
trigger to trigger measurements.
► Connect the DUT trigger output to the R&S FSH trigger input.
► Press the SWEEP key.
► Press the "Trigger" softkey.
► Select either the "External Rise" or "External Fall" menu item (rising or falling
edge).
The R&S FSH activates the trigger and shows the results of the measurement.
It may be that the burst is not completely visible on the display. To correct that and
make the whole burst visible, you can set a trigger delay.
► Press the "Trigger" softkey.
► Select the "Trigger Delay" menu item.
The R&S FSH opens an input field to define the trigger delay.
► Adjust the trigger delay until the burst is visible inside the vertical lines that show
the measurement range.

R&S FSH Spectrum Analyzer Mode
Performing Spectrum Measurements
Operating Manual 1173.6275.12 - 31 64
3.1.5 Measuring the Adjacent Channel Leakage Ratio (ACLR)
The Adjacent Channel Leakage Ratio (ACLR) measurement is a method to measure
the power over more than one transmission channel and also evaluate the power of
the adjacent (or alternate) channels of the transmission channel. The ACLR performs
measurements according to a specific channel configuration, e.g. a particular radio
communications standard.
► Press the MEAS key.
► Press the "Meas Mode" softkey.
The R&S FSH opens the measurement menu.
► Select the "ACLR" menu item.
The R&S FSH starts to measure the adjacent channel leakage ratio.
In principle, the ACLR measurement works like the channel power measurement in
that it determines the spectrum within the channel using a resolution bandwidth that is
small compared to the channel bandwidth. In addition to the channel bandwidth, the
ACLR measurement is also defined by the channel spacing, the bandwidth of adjacent
channels and the adjacent channel spacing. The R&S FSH supports measurements on
up to 12 carrier channels and 12 adjacent channels to either side of the carrier. When
measuring more than one carrier or adjacent channels, the R&S FSH shows the
powers of each channel in a list below the marker list. The channel itself is marked by
red (transmission channels) or green (adjacent channels) vertical lines.
Screen Layout for ACLR measurements
1 Standard
2 Marker information
3 Limit check information
4 Channel information
5 TX channel (red line)
6 Adjacent channel (green line)
7 Alternate channels (green lines)
8 Marker (blue line)
9 ACLR softkey menu

R&S FSH Spectrum Analyzer Mode
Performing Spectrum Measurements
Operating Manual 1173.6275.12 - 31 65
The predefined standards are the same as for channel power measurements (3GPP
WCDMA, cdmaOne and CDMA2000 1x systems). However, you can also customize
the settings to set up the R&S FSH for other radio communication standards. You can
define the settings directly on the R&S FSH or define and manage them using the
R&S InstrumentView software.
When customizing settings, make sure to consider the following points to get valid and accurate measurement results:
● Reference level
Make sure not to overload the R&S FSH as the power is measured with a
resolution bandwidth that is small in comparison with the signal bandwidth. As with
Channel Power measurements, automatically set the reference to an optimal level
with the "Level Adjust" softkey.
● Setting the span
The frequency span must at least cover the carriers and the adjacent channels
plus a measurement margin of about 10 % to get valid results.
If the span is automatically calculated by the R&S FSH with the "Auto Span"
function, the span is calculated as follows:
(No. of transmission channels - 1) x transmission channel spacing +
2 x transmission channel bandwidth + measurement margin
with the measurement margin being approx. 10 % of the value obtained by adding
the channel spacing and the channel bandwidth.
Selecting the frequency span
If the frequency span is too large in comparison to the channel bandwidth (or the
adjacent-channel bandwidths) being examined, only a few points on the trace are
available per channel. This reduces the accuracy of the waveform calculation for the
channel filter used, which has a negative effect on the measurement accuracy. It is
therefore strongly recommended that the formulas mentioned be taken into
consideration when selecting the frequency span.
● Setting the resolution bandwidth:
The RBW should not be too high or too small to get both an acceptable
measurement speed and a suppression of spectral components outside the
channels. As a rule of thumb, it is recommended to set it to about 1 % to 4 % of the
channel bandwidth.
You can select a larger resolution bandwidth if the spectrum within the channel to
be measured and around it has a flat characteristic. In the standard setting, e.g. for
standard cdmaOne at an adjacent channel bandwidth of 30 kHz, a resolution
bandwidth of 30 kHz is used. This yields correct results since the spectrum in the
neighborhood of the adjacent channels normally has a constant level.
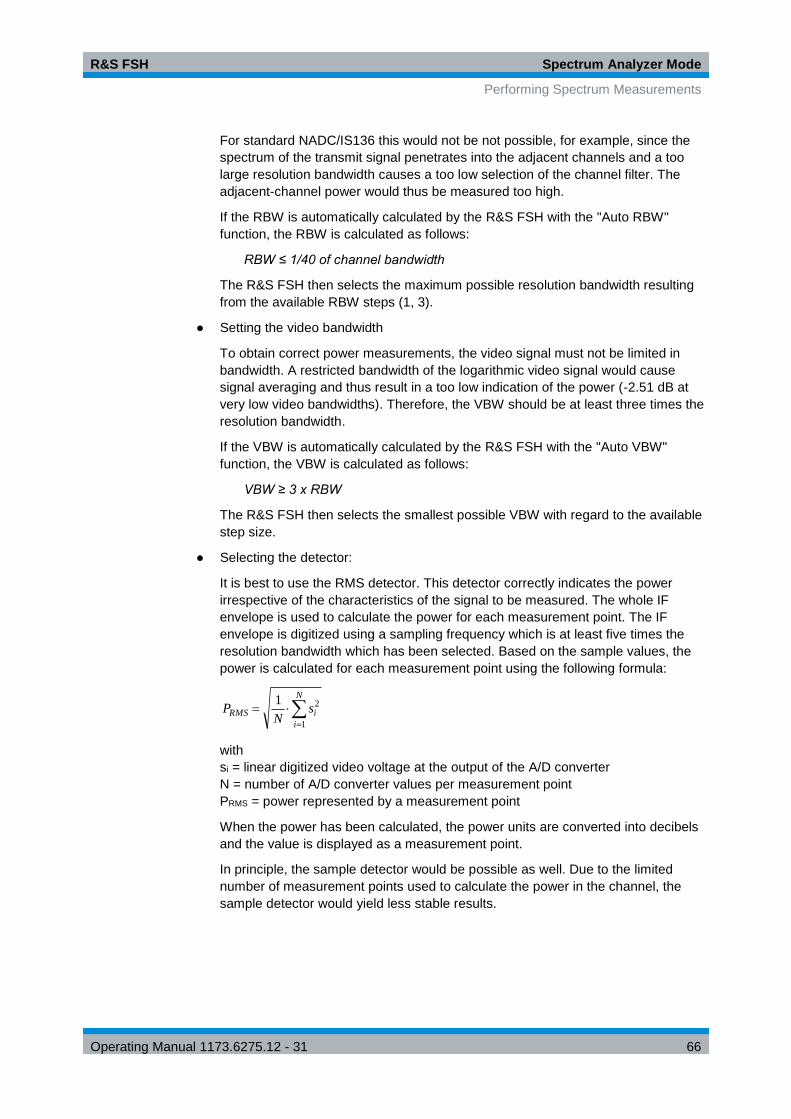
R&S FSH Spectrum Analyzer Mode
Performing Spectrum Measurements
Operating Manual 1173.6275.12 - 31 66
For standard NADC/IS136 this would not be not possible, for example, since the
spectrum of the transmit signal penetrates into the adjacent channels and a too
large resolution bandwidth causes a too low selection of the channel filter. The
adjacent-channel power would thus be measured too high.
If the RBW is automatically calculated by the R&S FSH with the "Auto RBW"
function, the RBW is calculated as follows:
RBW ≤ 1/40 of channel bandwidth
The R&S FSH then selects the maximum possible resolution bandwidth resulting
from the available RBW steps (1, 3).
● Setting the video bandwidth
To obtain correct power measurements, the video signal must not be limited in
bandwidth. A restricted bandwidth of the logarithmic video signal would cause
signal averaging and thus result in a too low indication of the power (-2.51 dB at
very low video bandwidths). Therefore, the VBW should be at least three times the
resolution bandwidth.
If the VBW is automatically calculated by the R&S FSH with the "Auto VBW"
function, the VBW is calculated as follows:
VBW ≥ 3 x RBW
The R&S FSH then selects the smallest possible VBW with regard to the available
step size.
● Selecting the detector:
It is best to use the RMS detector. This detector correctly indicates the power
irrespective of the characteristics of the signal to be measured. The whole IF
envelope is used to calculate the power for each measurement point. The IF
envelope is digitized using a sampling frequency which is at least five times the
resolution bandwidth which has been selected. Based on the sample values, the
power is calculated for each measurement point using the following formula:
N
i
iRMS sN
P1
21
with
si = linear digitized video voltage at the output of the A/D converter
N = number of A/D converter values per measurement point
PRMS = power represented by a measurement point
When the power has been calculated, the power units are converted into decibels
and the value is displayed as a measurement point.
In principle, the sample detector would be possible as well. Due to the limited
number of measurement points used to calculate the power in the channel, the
sample detector would yield less stable results.

R&S FSH Spectrum Analyzer Mode
Performing Spectrum Measurements
Operating Manual 1173.6275.12 - 31 67
3.1.5.1 Selecting a Standard
If you need to perform measurements that are conform to a telecommunications
standard, you can activate one of the predefined standards that are already stored in
the R&S FSH memory. Those predefined standards have already been set up to yield
the best results. However, the R&S FSH provides functionality to create new
configurations to perform measurements on other test setups as well.
► Press the MEAS key.
► Press the "Standard" softkey.
The R&S FSH opens a dialog box to select the standard.
► Select one of the available standards.
► Confirm the selection with the "Select" softkey.
The R&S FSH loads the configuration of the selected standard. It automatically
sets the optimal span, resolution bandwidth, video bandwidth, sweep time and
detector for the standard.
You can create and edit standards with the R&S InstrumentView software and transfer
them to the R&S FSH via the USB or the LAN interface. The number of standards the
R&S FSH can store in its memory depends on the number of other data sets stored on
the R&S FSH. For more information see "Managing Datasets" on page 30.
3.1.5.2 Configuring the Measurement
In addition to creating and editing standards with the R&S InstrumentView software,
the R&S FSH also provides functionality to set up a measurement configuration.
Setting the number of transmission channels
► Press the MEAS key.
► Press the "Channel Settings" softkey.
► Select the "Tx Channels" menu item.
The R&S FSH opens an input field to define the number of transmission channels.
► Enter the number of transmission channels you need for the measurement.
Setting the number of adjacent channels
► Press the "Channel Settings" softkey.
► Select the "Adj Channels" menu item.
The R&S FSH opens an input field to define the number of adjacent channels.
► Enter the number of adjacent / alternate channels you need for the measurement.
The borders of Tx channels are displayed red in the trace diagram, the borders of
adjacent and alternate channels are displayed green.
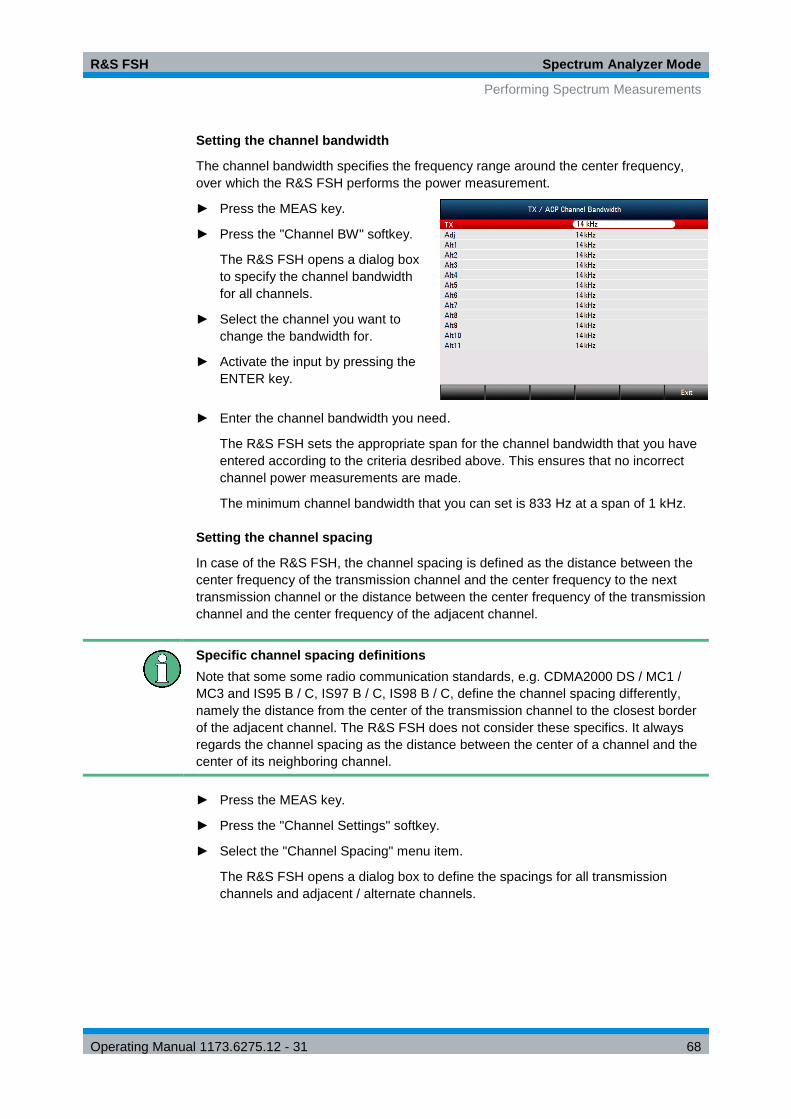
R&S FSH Spectrum Analyzer Mode
Performing Spectrum Measurements
Operating Manual 1173.6275.12 - 31 68
Setting the channel bandwidth
The channel bandwidth specifies the frequency range around the center frequency,
over which the R&S FSH performs the power measurement.
► Press the MEAS key.
► Press the "Channel BW" softkey.
The R&S FSH opens a dialog box
to specify the channel bandwidth
for all channels.
► Select the channel you want to
change the bandwidth for.
► Activate the input by pressing the
ENTER key.
► Enter the channel bandwidth you need.
The R&S FSH sets the appropriate span for the channel bandwidth that you have
entered according to the criteria desribed above. This ensures that no incorrect
channel power measurements are made.
The minimum channel bandwidth that you can set is 833 Hz at a span of 1 kHz.
Setting the channel spacing
In case of the R&S FSH, the channel spacing is defined as the distance between the
center frequency of the transmission channel and the center frequency to the next
transmission channel or the distance between the center frequency of the transmission
channel and the center frequency of the adjacent channel.
Specific channel spacing definitions
Note that some some radio communication standards, e.g. CDMA2000 DS / MC1 /
MC3 and IS95 B / C, IS97 B / C, IS98 B / C, define the channel spacing differently,
namely the distance from the center of the transmission channel to the closest border
of the adjacent channel. The R&S FSH does not consider these specifics. It always
regards the channel spacing as the distance between the center of a channel and the
center of its neighboring channel.
► Press the MEAS key.
► Press the "Channel Settings" softkey.
► Select the "Channel Spacing" menu item.
The R&S FSH opens a dialog box to define the spacings for all transmission
channels and adjacent / alternate channels.

R&S FSH Spectrum Analyzer Mode
Performing Spectrum Measurements
Operating Manual 1173.6275.12 - 31 69
► Select the channel you want to
change the spacing for.
► Activate the input by pressing the
ENTER key.
► Enter the channel spacing you
need.
The R&S FSH now takes the new
values into account for future
measurements.
When performing measurements on multi-carrier signals, you can define the spacing of
the transmission (Tx) channels to one another. By default, the R&S FSH assumes
equal spacing between all Tx channels in the system. Therefore, the spacing you enter
for the first two Tx channels is automatically applied to all other Tx channels.
If you do measurements on systems with a different channel spacing for each Tx
channel, you can also set the channel spacing for each Tx channel separately by
entering the respective number in the fields.
If the spacings are not equal, the channel distribution according to the center frequency
is as follows:
● Odd number of TX channels
The middle TX channel is centered to center frequency.
● Even number of TX channels
The two TX channels in the middle are used to calculate the frequency between
those two channels. This frequency is aligned to the center frequency.
Adjacent or alternate channel spacing is also available for single-carrier
measurements. The R&S FSH can perform measurements on up to 12 adjacent
channels. Usually the first adjacent channel to the Tx channel is referred to as the
Adjacent Channel (ADJ). All others are called Alternate Channels (ALT1 to ALT11).
By default, the R&S FSH assumes that the distance of the adjacent channels to each
other is the same. In that case, you only have to enter the first spacing value. The
R&S FSH then calculates all higher adjacent channels from that value. If you change
the spacing of one of the higher channels, the R&S FSH only updates the channel
spacings above the one you have changed, but not those below.
So, for example, if you set the first adjacent channel spacing (ADJ) to 20 kHz, the
following spacings are 40 kHz (ALT1), 60 kHz (ALT2), 80 kHz (ALT3), 100 kHz (ALT4),
120 kHz (ALT5) and so on.
If you then change the spacing of the third alternate channel (ALT3) to 100 kHz, the
R&S FSH adjusts the alternate channels above the third one accordingly: 125 kHz
(ALT4), 150 kHz (ALT5) and so on.

R&S FSH Spectrum Analyzer Mode
Performing Spectrum Measurements
Operating Manual 1173.6275.12 - 31 70
3.1.5.3 Normalization of Measurement Results
By default, the power of the channels and adjacent channels is displayed in the unit
dBm. It is also possible to display the power density of the signal to, for example,
measure the signal/noise power density or obtain the signal to noise ratio.
► Press the MEAS key.
► Press the "Channel Settings" softkey.
► Select the "Channel Pwr/Hz" menu item.
The R&S FSH activates normalization and switches the unit from dBm to dBm/Hz.
The channel power density in dBm/Hz corresponds to the power inside a
bandwidth of 1 Hz and is calculated as follows:
channel power density = channel power - log10(channel bandwidth)
3.1.5.4 Displaying Absolute and Relative Results
You can set up the result display to either show the absolute power of the adjacent
channels or the power relative to one of the transmission channels.
► Press the MEAS key.
► Press the "Power Display" softkey.
► Select either the "Absolute" menu item to display the absolute results or the
"Relative" menu item to display the power relative to one of the transmission
channels.
3.1.5.5 Selecting the Reference Channel
When determining relative power values for the adjacent channels, you can set a
specific transmission channel as the reference channel.
► Press the MEAS key.
► Press the "Channel Settings" softkey.
► Select the "ACLR Ref Setting" menu item.
The R&S FSH opens a another submenu to select the reference channel.
► Select the method of determining the reference channel.
The following methods are available:
- Tx Channel
Select a specific transmission channel by entering its number as the reference.
- Min Power Tx Channel
The channel with the lowest power level is the reference channel.
- Max Power Tx Channel
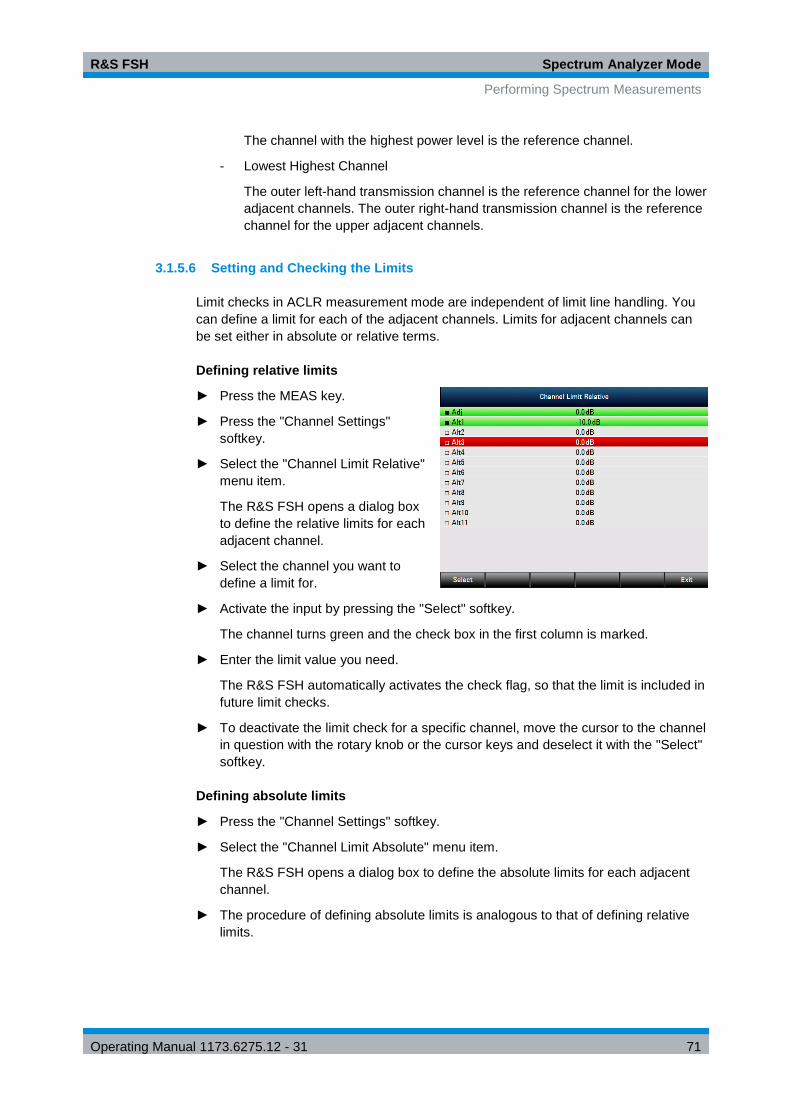
R&S FSH Spectrum Analyzer Mode
Performing Spectrum Measurements
Operating Manual 1173.6275.12 - 31 71
The channel with the highest power level is the reference channel.
- Lowest Highest Channel
The outer left-hand transmission channel is the reference channel for the lower
adjacent channels. The outer right-hand transmission channel is the reference
channel for the upper adjacent channels.
3.1.5.6 Setting and Checking the Limits
Limit checks in ACLR measurement mode are independent of limit line handling. You
can define a limit for each of the adjacent channels. Limits for adjacent channels can
be set either in absolute or relative terms.
Defining relative limits
► Press the MEAS key.
► Press the "Channel Settings"
softkey.
► Select the "Channel Limit Relative"
menu item.
The R&S FSH opens a dialog box
to define the relative limits for each
adjacent channel.
► Select the channel you want to
define a limit for.
► Activate the input by pressing the "Select" softkey.
The channel turns green and the check box in the first column is marked.
► Enter the limit value you need.
The R&S FSH automatically activates the check flag, so that the limit is included in
future limit checks.
► To deactivate the limit check for a specific channel, move the cursor to the channel
in question with the rotary knob or the cursor keys and deselect it with the "Select"
softkey.
Defining absolute limits
► Press the "Channel Settings" softkey.
► Select the "Channel Limit Absolute" menu item.
The R&S FSH opens a dialog box to define the absolute limits for each adjacent
channel.
► The procedure of defining absolute limits is analogous to that of defining relative
limits.
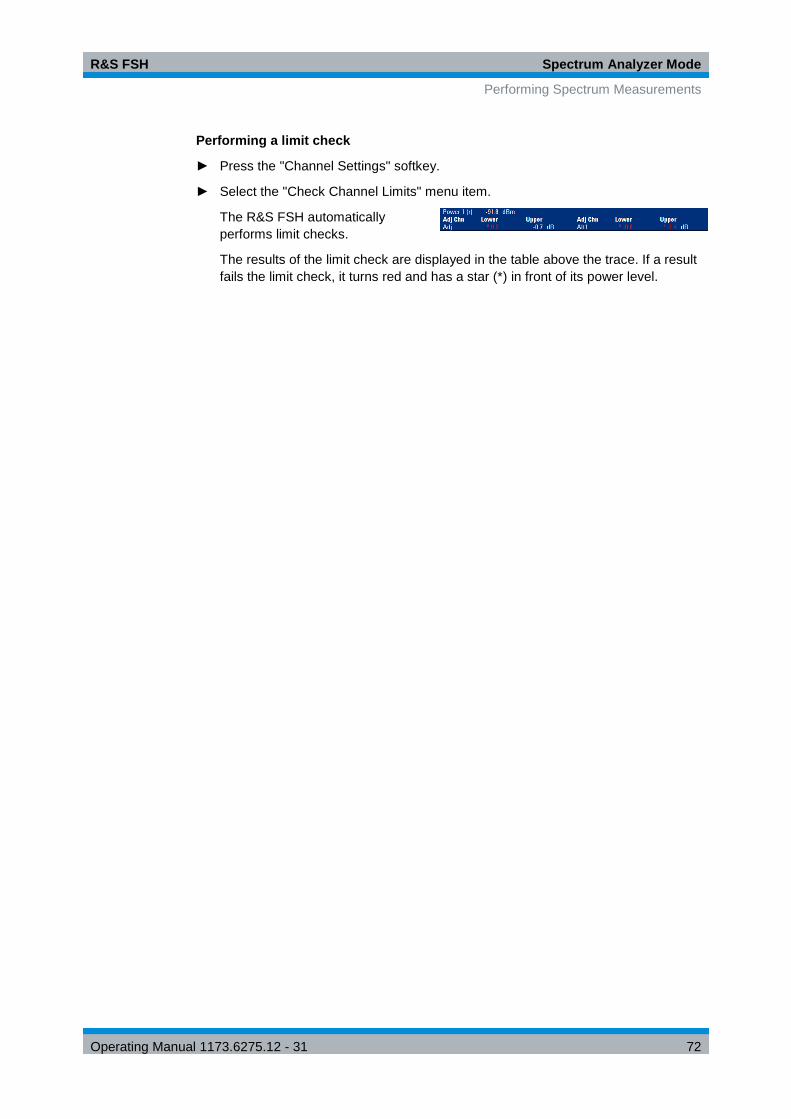
R&S FSH Spectrum Analyzer Mode
Performing Spectrum Measurements
Operating Manual 1173.6275.12 - 31 72
Performing a limit check
► Press the "Channel Settings" softkey.
► Select the "Check Channel Limits" menu item.
The R&S FSH automatically
performs limit checks.
The results of the limit check are displayed in the table above the trace. If a result
fails the limit check, it turns red and has a star (*) in front of its power level.

R&S FSH Spectrum Analyzer Mode
Performing Spectrum Measurements
Operating Manual 1173.6275.12 - 31 73
3.1.6 Measuring the Spectrum Emission Mask
The Spectrum Emission Mask (SEM) measurement is a method to detect spurious
emissions or intermodulation products of a signal. When performing a SEM
measurement, the R&S FSH checks the signal against a spectral mask to see whether
the signal complies with a specific standard or not. Therefore, the R&S FSH provides
predefined spectrum emission masks for various telecomunications standards.
However, you can define your own spectral masks with the R&S InstrumentView
software to perform measurements in frequency ranges other than the predefined
ones. To learn how to define Spectrum Emission Masks, refer to the
R&S InstrumentView manual.
► Press the MEAS key.
► Press the "Meas Mode" softkey.
The R&S FSH opens the measurement menu.
► Select the "Spectrum Emission Mask" menu item.
The R&S FSH starts to measure the spectrum emission mask.
Note that the frequency range of the actual measurement depends on the start and
stop frequency you have set on the R&S FSH. Correct measurement results are
therefore only possible if the frequency ranges of the SEM are inside the current span
of the R&S FSH.
Screen Layout for the SEM measurement
1 Standard
2 Marker information
3 SEM list
4 Limit check result
5 Spectrum emission mask (red line)
6 Trace (yellow line)
7 Peak (P<x>) and normal markers (M<x> and D<x>) (blue line)
8 SEM softkey menu

R&S FSH Spectrum Analyzer Mode
Performing Spectrum Measurements
Operating Manual 1173.6275.12 - 31 74
Markers in the SEM measurement
In addition to the normal marker functionality of the R&S FSH, the SEM measurement
provides special markers labeled P1 to Px.
The R&S FSH activates and positions these special markers automatically after
displaying the trace. Each of these markers marks the peak level in each SEM
subrange. Thus, the number of markers depends on the number of subranges defined
for the Spectrum Emission Mask and in turn depends on the standard you are
measuring against.
The numerical marker information (frequency and level) for these markers is part of the
SEM list.
Markers P1 to Px are fix and always remain on the peak level of the corresponding
subrange. If you'd like to analyze other locations on the trace, use normal marker and
deltamarker functionality. For more information see "Using Markers and Deltamarkers"
on page 118.
3.1.6.1 Selecting a Standard
If you need to perform measurements that are conform to a telecommunications
standard, you can activate one of the predefined standards that are already stored in
the R&S FSH memory. However, you can create new configurations to perform
measurements on other standards as well.
► Press the MEAS key.
► Press the "Standard" softkey.
The R&S FSH opens a dialog box to select the standard.
► Select one of the available standards.
► Confirm the selection with the "Select" softkey.
The R&S FSH loads the configuration of the selected standard. It automatically
sets the optimal span, resolution bandwidth, video bandwidth, sweep time and
detector for the standard.
You can create and edit standards with the R&S InstrumentView software and transfer
them to the R&S FSH via the USB or the LAN interface. The number of standards the
R&S FSH can store in its memory depends on the number of other data sets stored on
the R&S FSH.
For more information see "Managing Datasets" on page 30.
3.1.6.2 Optimizing Measurement Settings
After selecting the standard and applying the signal to the R&S FSH, you can optimize
measurement settings to avoid overloading the R&S FSH.
► Press the "Adjust Settings" softkey.
The R&S FSH performs a measurement to determine the ideal reference level ans
span..

R&S FSH Spectrum Analyzer Mode
Performing Spectrum Measurements
Operating Manual 1173.6275.12 - 31 75
3.1.6.3 Viewing the Results in a Table
You can add a table to the display that shows the measurement results in numerical
form.
► Press the MEAS key.
► Press the "View List" softkey.
The R&S FSH shows a list above
the trace diagram.
If the list contains more than four entries, you can scroll through the list with the
rotary knob or the cursor keys to see the other results. Note that scrolling works
only if there is no active input field.
The list contains the following information:
● Tx Power
Power level of the transmission channel.
● Tx Bandwidth
Bandwidth of the transmission channel.
● PASS / FAIL information
If the signal is within the limits of the spectral mask, the R&S FSH shows ,
if not it shows .
● Range [Hz]
Frequency range. The first number is the start frequency, the second number the
stop frequency of each defined frequency range. The character following the
number indicates the unit (k = kHz, M = MHz, G = GHz)
● RBW [Hz]
Resolution bandwidth the corresponding frequency range is measured with.
● Peak
Number of the peak marker (Px).
● Freq [Hz]
Frequency of the peak level that has been measured in each frequency range
● Power Abs
Absolute peak power in the corresponding frequency range.
● Power Rel
Relative peak power in relation to the channel power of the reference channel.
● Δ Limit
Minimum distance from the limit line to the trace in the corresponding frequency
range. Negative values or a zero indicate a passed SEM limit check, positive
values indicate a violation of the limit check.

R&S FSH Spectrum Analyzer Mode
Performing Spectrum Measurements
Operating Manual 1173.6275.12 - 31 76
3.1.7 Measuring the Harmonic Distortion
The Harmonic Distortion measurement is an easy way to identify the harmonics of a
DUT. In addition to the graphic display of the harmonics, this measurement mode also
calculates the Total Harmonic Distortion (THD) and shows the results.
You can perform a Harmonic Distortion measurement in frequency sweep (span > 0)
and zero span mode (span = 0). When starting the measurement, the R&S FSH looks
for the first harmonic of the signal (= the highest signal) in the defined frequency range.
It then adjusts the frequency axis so that all harmonics are visible. In zero span mode,
the center frequency remains the same.
► Press the MEAS key.
► Press the "Meas Mode" softkey.
► Select the "Harmonic Distortion" menu item.
The R&S FSH starts to measure the harmonic distortion.
The search for harmonics starts as soon as you enter the Harmonic Distortion
measurement. Upon entering the measurement, the R&S FSH automatically adjusts
the settings in order to display the selected number of harmonics (default = 2) on the
screen.
Screen layout for the harmonic distortion measurement
1 Harmonics list
2 Total harmonic distortion in %
3 Total harmonic distortion in dB
4 Trace
5 Markers indicating harmonics (blue lines)
6 Harmonic distortion softkey menu

R&S FSH Spectrum Analyzer Mode
Performing Spectrum Measurements
Operating Manual 1173.6275.12 - 31 77
3.1.7.1 Defining the Number of Harmonics
By default, the R&S FSH shows the signal and its first harmonic. Each harmonic is
indicated by a marker that the R&S FSH places on the harmonic (here M1 and M2).
Note that all of the markers that have been set are normal markers that show the
absolute frequency of the harmonic.
At the same time, the R&S FSH also calculates the values for the total harmonic
distortion (THD) and shows the results in a box above the trace diagram. The values
are output in % as well as dB.
If you want to see more than one harmonic, the R&S FSH can show up to six
harmonics.
► Press the MEAS key.
► Press the "Harmonics" softkey.
► Enter the number of harmonics you'd like to see.
3.1.7.2 Optimizing the Display of Harmonics
The R&S FSH places the markers on the other harmonics even if they are outside of
the display range.
► Press the MEAS key.
► Press the "Adjust Settings" softkey.
The R&S FSH performs a measurement to determine the ideal reference level,
frequency and span in order to display all harmonics.
3.1.7.3 Activating the Harmonics List
To see the exact frequency of the harmonic, you can activate the marker list that
shows the value for each harmonic or marker.
► Press the MKR key.
► Press the "View List" softkey.
The R&S FSH displays the marker list that contains the values for each harmonic.

R&S FSH Spectrum Analyzer Mode
Performing Spectrum Measurements
Operating Manual 1173.6275.12 - 31 78
3.1.8 Measuring the AM Modulation Depth
The AM Modulation Depth measurement analyzes AM modulated signals and
calculates the modulation depth of the signal using the measurement results. Note that
the measurement works properly only if you apply an AM modulated signal.
► Press the MEAS key.
► Press the "Meas Mode" softkey.
The R&S FSH opens the measurement menu.
► Select the "AM Modulation Depth" menu item.
The R&S FSH starts to measure the AM modulation depth.
After you have started the measurement, the R&S FSH places three markers on the
trace. The first marker is placed on the peak power level. The R&S FSH assumes that
position as the level of the carrier. The second and third markers are delta markers.
These are placed symmetrically on the adjacent peak values to the left and right of the
carrier.
Screen layout for the AM modulation depth measurement
1 Marker list
2 Modulation depth
3 Trace
4 Threshold line
5 Markers (blue lines)
6 AM modulation depth softkey menu
By default, delta marker 2 is active for editing. If you move the delta marker to another
position, the other delta marker will be moved by the same distance relative to the
normal marker. Note that this happens only if you move delta marker 2 (D2). When
moving delta marker 3 (D3), only this marker is repositioned.

R&S FSH Spectrum Analyzer Mode
Performing Spectrum Measurements
Operating Manual 1173.6275.12 - 31 79
From the values of the markers, the R&S FSH then calculates the AM modulation
depth. The AM modulation depth is the ratio between the power values at the
reference marker and at the delta markers. When the powers of the two AM side bands
are not the same, the R&S FSH uses the mean value of the two sideband values.
If the R&S FSH is unable to find any AM modulated a carriers, it shows the message
.
3.1.8.1 Setting a Threshold
You can set a threshold that defines the minimum power level the signal must have. If
the power of the signal is below the threshold, the R&S FSH will not set the markers
and therefore will not calculate the modulation depth.
► Press the MEAS key.
► Press the "Threshold" softkey
The R&S FSH opens an input field to set the threshold.
► Enter the threshold value you need.
The threshold is represented as a horizontal blue line in the diagram area.
3.1.8.2 Optimizing the Settings
In order to get the best results, you can use the automatic adjustment routine that the
R&S FSH offers.
► Press the MEAS key.
► Press the "Adjust Settings" softkey.
The R&S FSH performs a sweep and repeats the peak search sequence for the
three markers.
3.1.8.3 Activating the Marker List
To see the exact frequency of the carrier and its sidebands, you can activate the
marker list that shows the value for each marker.
► Press the MKR key.
► Press the "View List" softkey.
The R&S FSH displays the marker list that contains the values for carrier and
sideband.

R&S FSH Spectrum Analyzer Mode
Performing Spectrum Measurements
Operating Manual 1173.6275.12 - 31 80
3.1.9 Measuring Spurious Emissions
The Spurious Emission measurement is a tool to monitor unwanted emissions in the
frequency spectrum outside of an assigned channel (carrier). When performing a
Spurious Emission measurement, the R&S FSH checks the spectrum that you have
defined against a limit line to see whether the signal complies with a specific standard
or not.
Spurious Emission measurements are usually performed over a wide frequency
spectrum. To avoid long measurement times, the spectrum is split into several smaller
ranges. Each of those ranges has a different configuration (for example a different
RBW).
The Spurious Emission measurement available on the R&S FSH is designed for
measurements on category A 3GPP base stations with the appropriate configuration in
each measurement range.
► Press the MEAS key.
► Press the "Meas Mode" softkey.
The R&S FSH opens the measurement menu.
► Select the "3GPP BTS Spurious Emission" menu item.
► Press the "Start Meas" softkey.
The R&S FSH starts the measurement.
Screen Layout for the Spurious Emission measurement
1 Result display
2 Limit check
3 List of spurious emissions
4 Limit line (red line)
5 Trace (yellow line)
6 Spurious Emission softkey menu

R&S FSH Spectrum Analyzer Mode
Performing Spectrum Measurements
Operating Manual 1173.6275.12 - 31 81
Note that the frequency range of the actual measurement depends on the start and
stop frequency you have set for the carrier. Correct measurement results are therefore
only possible if the frequency ranges of the measurement are inside the current span
of the R&S FSH.
Markers in the Spurious Emission measurement
In addition to the normal marker functionality of the R&S FSH, the Spurious Emission
measurement provides special markers labeled P1 to Px.
The R&S FSH activates and positions these special markers automatically after
displaying the trace. Each of these markers marks the peak level in each Spurious
Emission range.
The numerical marker information (frequency and level) for these markers is part of the
result table.
Markers P1 to P4 are fix and always remain on the peak level of the corresponding
subrange. If you'd like to analyze other locations on the trace, use normal marker and
deltamarker functionality. For more information see "Using Markers and Deltamarkers"
on page 118.
3.1.9.1 Defining the Channel Bandwidth
Several frequency bands have been defined for 3GPP transmissions. Depending on
the frequency band you are testing, you have to adjust the start and stop frequencies
of the carriers.
► Press the MEAS key.
► Press the "Carrier Start" softkey.
The R&S FSH opens an input field to define the lower frequency of the channel.
► Press the "Carrier Stop" softkey.
The R&S FSH opens an input field to define the upper frequency of the channel.
Note that the standard defines spurious emissions as transmission outside the
frequency band 12.5 MHz below the first carrier and 12.5 MHz above the last carrier.
Keep these values in mind when defining the start and stop frequencies of the carrier.
3.1.9.2 Viewing the Results in a Table
You can add a table to the display that shows the measurement results in numerical
form.
► Press the MEAS key.
► Press the "View List" softkey.
The R&S FSH shows a list above
the trace diagram.

R&S FSH Spectrum Analyzer Mode
Performing Spectrum Measurements
Operating Manual 1173.6275.12 - 31 82
The list contains information for each frequency range that the measurement covers.
Thus, the number of entries in the list depends on the overall frequency span you are
using for the measurement. The following ranges have been defined:
● 9 kHz to 150 kHz (with an RBW of 1 kHz)
● 150 kHz to 30 MHz (with an RBW of 10 kHz)
● 30 MHz to 1 GHz (with an RBW of 100 kHz)
● > 1 GHz (with an RBW of 1 MHz)
The spurious list contains the following information for each range.
● Frequency range
Start and stop frequencies of the range.
● RBW
Resolution bandwidth that the R&S FSH uses within that range.
● Peak Frequency
Frequency at which the peak power has been measured in a particular range.
● Peak Power
Peak power that has been measured in a particular range.

R&S FSH Spectrum Analyzer Mode
Performing Spectrum Measurements
Operating Manual 1173.6275.12 - 31 83
3.1.10 Working with the Spectrogram Result Display (R&S FSH-K14/ -K15)
With option R&S FSH-K14 or R&S FSH-K15, you can view measurement results in a
spectrogram.
The spectrogram result display shows the spectral density of a signal in the frequency
domain and over time simultaneously.
Screen layout for the spectrogram
1 Result display
2 Marker and time line information
3 Spectrum result display (optional)
4 Marker/ delta marker (vertical lines)
5 Spectrogram
6 Time lines T1 and T2 (horizontal lines)
7 Scroll direction
8 Spectrogram softkey menu
Like other result displays, the horizontal axis represents the frequency span. The
vertical axis represents time. Time in the spectrogram runs chronologically from top to
bottom. Therefore, the top of the diagram is the present. A third dimension shows the
amplitude for each frequency by mapping different colors to every power level. The
result is therefore a two dimensional diagram.
The color the R&S FSH assigns to a power level that was measured depends on:
● the color table you have selected
● the spectrogram reference level
● the spectrogram level range
The spectrogram consists of horizontal lines, each one pixel high, that are called
frames. In the default state, a frame is added to the spectrogram after each sweep.
This means that the amount of data in a frame depends on the sweep time. As the
spectrogram in the R&S FSH runs from top to bottom, the outdated time line(s) move
down one position, so that the present frame is always on top of the diagram.
Therefore, the sequence of frames is chronological.

R&S FSH Spectrum Analyzer Mode
Performing Spectrum Measurements
Operating Manual 1173.6275.12 - 31 84
► Press the MEAS key.
► Press the "Meas Mode" softkey.
► Select the "Spectrogram" menu item.
The R&S FSH starts the spectrogram result display.
By default, the spectrogram result display consists of two windows. The upper window
shows the measured spectrum as a trace line. The lower window shows the
measurement results in a spectrogram. The chronological information in the
spectrogram is restricted by the internal memory of the R&S FSH. The R&S FSH
stores 1024 frames or spectrums that have been measured in its memory. As the
height of the display is smaller, some of the data becomes invisible after a time.
3.1.10.1 Controlling the Spectrogram Update
The spectrogram starts running as soon as you enter the spectrogram mode, if you are
in continuous sweep mode.
If you are in single sweep mode, the R&S FSH does not add a line to the spectrogram
until you initiate the next single sweep.
You can stop the update of the spectrogram in continuous sweep mode.
► Press the MEAS key.
► Press the "Hold" softkey.
Note that in continuous sweep mode the measurement in the spectrum result
display does not stop. The trace in the upper window still updates continuously.
Only the spectrogram view stops.
► Press the "Hold" softkey again.
The R&S FSH resumes updating the spectrogram.
The spectrogram result display is filled with results until you change a measurement
setting. As soon as a setting is changed, the spectrogram clears and starts to fill again.
You can also clear the spectrogram manually.
► Press the MEAS key.
► Press the "Clear" softkey.
3.1.10.2 Browsing Through the Signal History
There are two ways to view parts of the measurement result history that have moved
outside the visible area of the spectrogram.
► Press the MEAS key.
► Press the "Spectrogram Settings" softkey.
► Select the "[ ] Spectrogram Full Screen" menu item.

R&S FSH Spectrum Analyzer Mode
Performing Spectrum Measurements
Operating Manual 1173.6275.12 - 31 85
The R&S FSH now uses the full diagram area of the screen for the spectrogram.
The number of lines in the spectrogram and therefore the displayed time period
more than doubles.
► The "Spectrogram Full Screen" menu item is marked by an [X].
It may, however, be necessary that the spectrum result display is still visible to
evaluate measurement results. For this purpose, the spectrogram has an (invisible)
scrollbar that you can use to scroll up and down the spectrogram to the frame that
you'd like to see.
Scrolling through the spectrogram
Turn the rotary knob or use the UP and DOWN cursor keys whenever you are viewing
the spectrogram.
The R&S FSH scrolls through the spectrogram history.
Note that this is only possible as long as no input field or menu is active. To resume
the spectrogram scroll function in this case,
► Press the CANCEL key
► Use the rotary knob or the UP and DOWN cursor keys again.
The R&S FSH resumes scrolling through the spectrogram history.
The symbols on the right side of the spectrogram indicate the position of the
spectrogram part currently displayed on the screen:
● A single down arrow in the right lower corner of the spectrogram indicates that the
uppermost frame still represents the most recently recorded trace.
● Two arrows (one up, one down) indicate that the spectrogram area displayed is
somewhere in the middle of the available history.
● A single up arrow in the upper right corner of the spectrogram indicates that the
lowest line of the spectrogram represents the end of the history buffer.
3.1.10.3 Configuring the Display
As colors are an important part of the spectrogram, the R&S FSH offers various ways
to customize the display for best viewing results.
The first and most obvious way to configure the display is to select a different color
scheme.
► Press the "Spectrogram Settings" softkey.
► Select the "Spectrogram Color Table" menu.
The R&S FSH opens a submenu that contains several color schemes.
● Default
● Green-Yellow
● Green-Blue
● Black-White
● Red-Purple
● Blue-Black
The following examples are based on the green-yellow color scheme.

R&S FSH Spectrum Analyzer Mode
Performing Spectrum Measurements
Operating Manual 1173.6275.12 - 31 86
► Select the color scheme you are most comfortable with.
The R&S FSH adjusts the screen colors according to your selection.
It is possible that the color distribution is not ideal in the current configuration. You
have two ways to set things straight.
By cutting the reference level, you can eliminate amplitudes from the color map
that are not part of the signal.
Example: By default, the spectrogram reference level is 30 dBm.
That means that signal parts with
an amplitude of 30 dBm would be
yellow in the spectrogram, and
signal parts with a very small
amplitude would be dark green.
Everything in between is a shade
of the colors between. As the
colors are distributed over a very
large range (about a 150 dBm or
more), it is likely that you can not
distinguish details in the signal you
have measured.
Therefore you should adjust the color map to the overall shape of the signal you
are measuring. Let's say, for example, that the signal has an amplitude range of
about 30 dB with the maximum amplitude at about -60 dBm and the minimum
amplitude at about -100 dBm and the Green-Yellow color scheme. With the default
settings, the spectrogram is made up exclusively of green colors and it's not easy
to distinguish amplitude levels. That's because the yellow color shades are
completely out of range.
To get a better result, change the spectrogram reference level to a level near the
maximum power level that has been measured first.
► Press the "Spectrogram Settings" softkey.
► Select the "Spectrogram Reference Level" menu item.
The R&S FSH opens an input field to enter the spectrogram reference level.
The reference level should be near the maximum level that has been measured
while the spectrogram was running. In the example, the reference level should be
at about -60 dBm.
► Enter the reference level you need.
The R&S FSH now shifts the reference level of the spectrogram to the value you
have entered.
Note that the spectrogram reference level does not affect the spectrum result
display, as well as the spectrum reference level ("Amplitude" menu) does not affect
the spectrogram. In the screenshot the spectrum trace is therefore exactly the
same as in the previous picture.
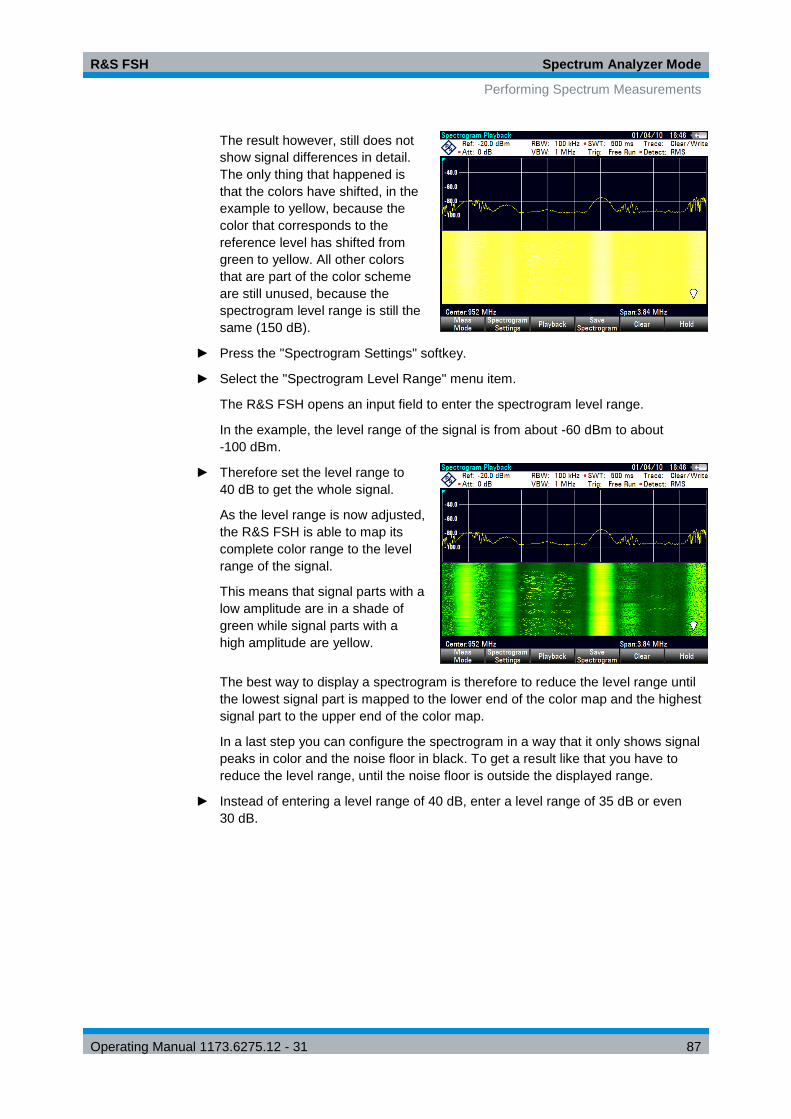
R&S FSH Spectrum Analyzer Mode
Performing Spectrum Measurements
Operating Manual 1173.6275.12 - 31 87
The result however, still does not
show signal differences in detail.
The only thing that happened is
that the colors have shifted, in the
example to yellow, because the
color that corresponds to the
reference level has shifted from
green to yellow. All other colors
that are part of the color scheme
are still unused, because the
spectrogram level range is still the
same (150 dB).
► Press the "Spectrogram Settings" softkey.
► Select the "Spectrogram Level Range" menu item.
The R&S FSH opens an input field to enter the spectrogram level range.
In the example, the level range of the signal is from about -60 dBm to about
-100 dBm.
► Therefore set the level range to
40 dB to get the whole signal.
As the level range is now adjusted,
the R&S FSH is able to map its
complete color range to the level
range of the signal.
This means that signal parts with a
low amplitude are in a shade of
green while signal parts with a
high amplitude are yellow.
The best way to display a spectrogram is therefore to reduce the level range until
the lowest signal part is mapped to the lower end of the color map and the highest
signal part to the upper end of the color map.
In a last step you can configure the spectrogram in a way that it only shows signal
peaks in color and the noise floor in black. To get a result like that you have to
reduce the level range, until the noise floor is outside the displayed range.
► Instead of entering a level range of 40 dB, enter a level range of 35 dB or even
30 dB.

R&S FSH Spectrum Analyzer Mode
Performing Spectrum Measurements
Operating Manual 1173.6275.12 - 31 88
This will provide a high contrast
between signal parts that are
above the noise floor, and the
noise floor, which is drawn in
black.
To show details of the noise floor
and exclude the peak levels you
have to lower the spectrogram
reference level, until it is just
above the noise floor.
The R&S FSH will then display the signal parts that are above the reference level
in only one color, which is the color at the upper border of the color map.
3.1.10.4 Recording a Spectrogram
You can save the data of the spectrogram for documentation or for further analysis of
the recorded data.
► Press the MEAS key.
► Press the "Save Spectrogram" softkey.
The R&S FSH opens a dialog box
to save the current spectrogram.
► Enter the name of the spectrogram
with the alphanumeric keys.
By default, the R&S FSH saves
the spectrogram as
'Spectrogram###' with ascending
numbers.
► Press the "Save" softkey to store
the spectrogram.
Now that you have saved the spectrogram, you can replay it any time you want.
The number of spectrograms that you can store on the R&S FSH internal memory
depends on the other datasets that are currently on the R&S FSH.

R&S FSH Spectrum Analyzer Mode
Performing Spectrum Measurements
Operating Manual 1173.6275.12 - 31 89
3.1.10.5 Playback of a Spectrogram
If you have recorded a spectrogram and have saved it in internal memory, a memory
stick or the SD card, you can view the results of that measurement at a later time.
► Press the "Playback" softkey
or
► Press the "Meas Mode" softkey.
► Select the "Spectrogram Playback" menu item.
Recalling a previously stored spectrogram
► Press the "Recall Spectrogram" softkey.
The R&S FSH opens a dialog box to select a file that contains the spectrogram
data. The file extension for spectrogram data is *.spm.
► Select the file you need.
► Confirm the selection with the "Select" softkey.
The R&S FSH loads the spectrogram and shows the data in the display.
In general you can do the same things on a recalled spectrogram as in the
spectrogram recording mode, e.g. customize the display to your needs.
In addition to that functionality, it is possible to view not only the spectrum that belongs
to the currently selected spectrogram frame, but also the spectrums of all frames that
are in the memory of the R&S FSH.
Working with time lines in playback mode
To find a particular point in time and display the corresponding spectrum you can use
two time lines:
When entering the playback mode the R&S FSH displays two time lines in the
spectrogram.
The first time line (T1) corresponds to
an absolute time value, the second
(T2) is a time relative to the first time
line. Both time lines are positioned on
the most recent spectrogram line at
the top of the result display.
You can now select a specific spectrogram frame that is in the memory of the
R&S FSH.
► Press the "Select Time Line" softkey.
The R&S FSH opens an input field to define the position of the first time line (T1).

R&S FSH Spectrum Analyzer Mode
Performing Spectrum Measurements
Operating Manual 1173.6275.12 - 31 90
► Position the time line by entering a number or moving it with the rotary knob.
Entering 0 sets the time line marker on the most recent frame. The maximum value
that you can enter is 1024 (the maximum number of frames the R&S FSH can
store in its memory).
Note that not all frames are visible on the screen. If a frame is part of the history
outside the visible area, the time line is also not visible and you have to scroll
through the spectrogram to be able to see it again.
The upper window will display the spectrum of the frame at the time line position. By
moving the time line you can thus browse through the history of spectra stored in
memory.
In the marker information field, the R&S FSH shows the time stamp of the time line.
The time stamp of the first time line T1
is always referred to the top-most
frame (e.g. a time stamp of
00:00:50:000 means that the data was
measured 50 seconds prior to the top-
most frame).
► Press the "Select Time Line"
softkey again.
The R&S FSH opens an input field
to define the position of the
second time line (T2).
► Enter a number with the number keys, the rotary knob or the cursor keys.
The R&S FSH positions the second time line on the selected frame. Again it shows
the time stamp of the time line in the marker information field (ΔT value). For the
second time line (T2), the information is relative to the first one (T1). This means
that the time stamp of the second time line can be negative, if you have set it on a
frame above the first time line.
If you scroll the time line through the frames of the spectrogram with the rotary knob or
the cursor keys, the R&S FSH will show the spectrum corresponding to the selected
frame in the upper window of the display.
You can use the spectrogram playback for a detailed analysis of the signal levels over
time and compare signal details in the spectrum result display, e.g. with the help of
markers.
In addition to the time line (horizontal marker), you can also use (vertical) markers in
the spectrogram.
With the help of the marker and the time line, you are able to find the exact moment
when a specific event has occurred in the spectrum.

R&S FSH Spectrum Analyzer Mode
Performing Spectrum Measurements
Operating Manual 1173.6275.12 - 31 91
► Press the MARKER key.
The R&S FSH activates a marker
and sets it on the peak level of the
currently displayed spectrum.
► Use the rotary knob or the cursor
keys to move the marker on the
horizontal axis to the frequency
you want to analyze, or enter the
frequency directly with the number
keys.
► Press the "Select Time Line" softkey and browse through the spectrums using the
rotary knob or the cursor keys until the spectrum of interest is displayed in the
upper window.
The time stamp of the selected time line gives you a precise indication on when the
event shown in the spectrum occurred.
For more information on marker functionality, see
● "Using Markers" on page 227
Switching back to active spectrogram recording
To resume recording of a new spectrogram
► Press the "Live Update" softkey at any time you are in playback mode.
The R&S FSH switches back to performing live measurements.
Long Time Spectrograms
The R&S FSH can record spectrogram data up to 999 hours (although the maximum
time actually depends on the measurement settings and available storage space).
► Press the SETUP key.
► Press the “Measure Setup” softkey and look for the “Spectrogram Long Time
Recording” settings.
► Connect the storage device (necessary for long time recording).
► Select the storage device you would like to use from the “Recording Storage”
menu item (USB or SD card).
► Turn on the long time spectrogram with the “Long Time Recording” menu item.
The R&S FSH starts the spectrogram measurement. The data is written directly to the
connected storage device in one or more files, depending on the overall length of the
spectrogram . the longer the recording last, the more files are created.
When you stop the recording, the
R&S FSH shows a message
containing the directory where the
measurement data has been saved.
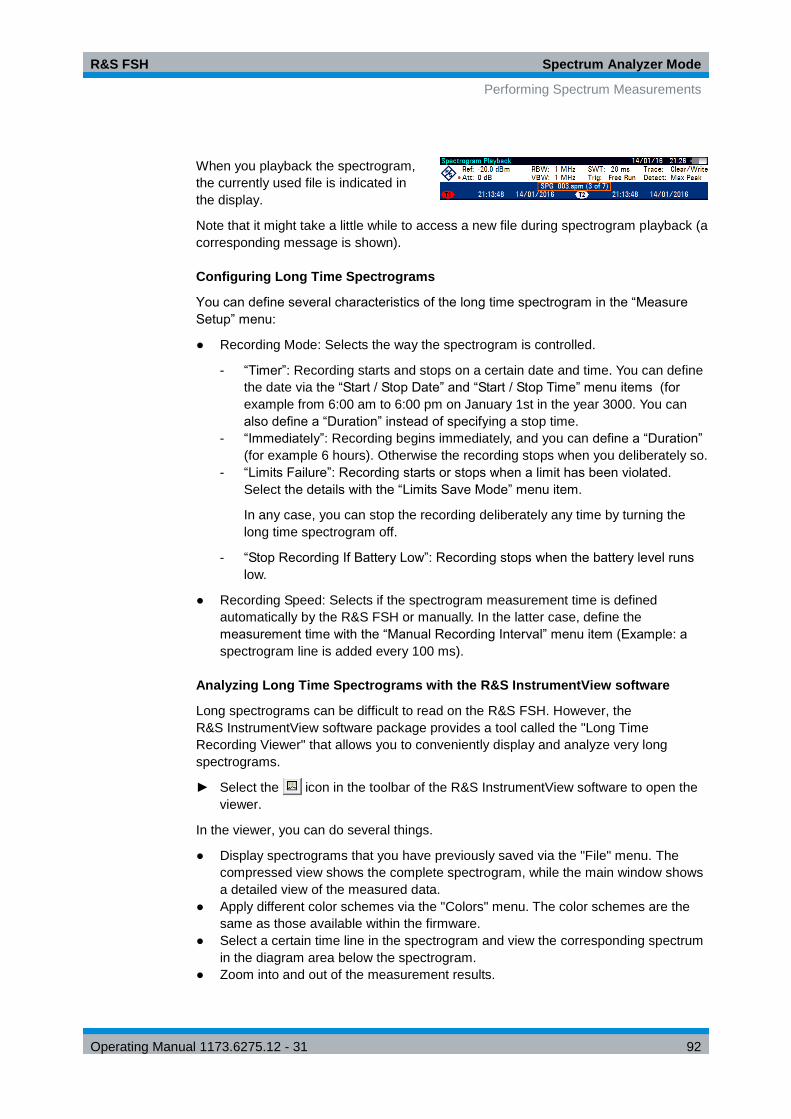
R&S FSH Spectrum Analyzer Mode
Performing Spectrum Measurements
Operating Manual 1173.6275.12 - 31 92
When you playback the spectrogram,
the currently used file is indicated in
the display.
Note that it might take a little while to access a new file during spectrogram playback (a
corresponding message is shown).
Configuring Long Time Spectrograms
You can define several characteristics of the long time spectrogram in the “Measure
Setup” menu:
● Recording Mode: Selects the way the spectrogram is controlled.
- “Timer”: Recording starts and stops on a certain date and time. You can define
the date via the “Start / Stop Date” and “Start / Stop Time” menu items (for
example from 6:00 am to 6:00 pm on January 1st in the year 3000. You can
also define a “Duration” instead of specifying a stop time.
- “Immediately”: Recording begins immediately, and you can define a “Duration”
(for example 6 hours). Otherwise the recording stops when you deliberately so.
- “Limits Failure”: Recording starts or stops when a limit has been violated.
Select the details with the “Limits Save Mode” menu item.
In any case, you can stop the recording deliberately any time by turning the
long time spectrogram off.
- “Stop Recording If Battery Low”: Recording stops when the battery level runs
low.
● Recording Speed: Selects if the spectrogram measurement time is defined
automatically by the R&S FSH or manually. In the latter case, define the
measurement time with the “Manual Recording Interval” menu item (Example: a
spectrogram line is added every 100 ms).
Analyzing Long Time Spectrograms with the R&S InstrumentView software
Long spectrograms can be difficult to read on the R&S FSH. However, the
R&S InstrumentView software package provides a tool called the "Long Time
Recording Viewer" that allows you to conveniently display and analyze very long
spectrograms.
► Select the icon in the toolbar of the R&S InstrumentView software to open the
viewer.
In the viewer, you can do several things.
● Display spectrograms that you have previously saved via the "File" menu. The
compressed view shows the complete spectrogram, while the main window shows
a detailed view of the measured data.
● Apply different color schemes via the "Colors" menu. The color schemes are the
same as those available within the firmware.
● Select a certain time line in the spectrogram and view the corresponding spectrum
in the diagram area below the spectrogram.
● Zoom into and out of the measurement results.

R&S FSH Spectrum Analyzer Mode
Performing Spectrum Measurements
Operating Manual 1173.6275.12 - 31 93
● Position markers in the spectrogram via the "Show" menu and the "Measurement”
panel on the right side of the user interface.
● Configure markers via the "Setup" panel on the right side of the user interface.
● View the measurement setup via the "Measurement" panel.
Prerequisites
Using the "Long Time Recording Viewer" requires you to install .NET framework
version 4.0 or higher on the PC you are running the R&S InstrumentView software on.
R&S FSH Spectrum Analyzer Mode
Performing Spectrum Measurements
Operating Manual 1173.6275.12 - 31 94
3.1.11 Using Isotropic Antennas
The R&S FSH supports measurements with an isotropic antenna.
You can use any isotropic antenna available with the R&S TS-EMF system (order no.
1158.9295.05). Each of those antennas supports a different frequency range between
9 kHz and 6 GHz.
Test setup
The test setup consists of an R&S FSH and one of the isotropic antennas. The
necessary cables are provided with the antennas.
► Connect the RF cable with the N coaxial connector to the RF input (port 1).
► Connect the control cable to the power sensor interface (9-pin D-Sub connector)
with the adapter cable that comes with the antenna.
If necessary, you can connect an additional extension cable (R&S TS-EMFZ2,
order no. 1166.5708.02).
Starting the measurement
► Press the MEAS key.
► Press the "Meas Mode" softkey.
► Select the "Isotropic Antenna" menu item.
After you have turned the isotropic antenna on, the R&S FSH uses the isotropic
antenna for all measurements.
Note that when you turn the isotropic antenna on without having selected a
transducer factor first, the R&S FSH asks you to select a transducer factor.
Using transducer factors
The isotropic antenna is in effect a transducer. Because it has a characteristic
frequency response, it is necessary to correct the measurement results by these
characteristics.
The transducer factors for each of the supported isotropic antennas are provided with
the R&S FSH. The factors contain typical correction values for all three antenna
elements as well as the correction values for the cable.
► Press the AMPT key.
► Press the "Transducer" softkey
The R&S FSH opens a dialog box to select the transducer factor.
► Select the "Primary Transducer" menu item.
► Select the transducer factor.
The file you have to select depends on the antenna you are using. The file type of
transducer factors for isotropic antennas is *.isotrd.
► Confirm the selection with the "Select" softkey.

R&S FSH Spectrum Analyzer Mode
Performing Spectrum Measurements
Operating Manual 1173.6275.12 - 31 95
If you are using the extension cable R&S TS-EMFZ2, you have to take this into
account as a secondary transducer.
► Press the "Transducer" softkey.
► Select the "Select Secondary Transducer" menu item.
The R&S FSH opens a dialog box to select transducer factors with the unit dB.
► Select the transducer factor for the extension cable.
► Confirm the selection with the "Select" softkey.
For more information see "Using Transducer Factors" on page 132.
You can create and edit transducer factor with the R&S InstrumentView software
package and then transfer them into the internal memory of the R&S FSH. Each
transducer factor may consist of up to 1000 reference values.
Display of the antenna directions
An isotropic antenna consists of three orthogonal elements. Each of these elements
measures the field strength from a different direction (x-, y- and z-axis).
Decrease of measurement speed
Because the R&S FSH performs a measurement on each of the three antenna axes,
the update rate of the results decreases slightly.
You can select to display different aspects of the measurement.
► Press the "Meas Mode" softkey.
► Select the "Iso Direction [ ]" menu item.
The R&S FSH opens a new menu to select the measurement aspect.
● "Auto"
Shows the total field strength over all three antenna axes.
The displayed result is a combination of the results for each antenna element. After
measuring each of the three directions individually, the R&S FSH calculates the
total field strength (Er) based on the results for each antenna element.
222zyxr EEEE
● "X"
Shows the field strength measured on the antenna's x-axis only.
● "Y"
Shows the field strength measured on the antenna's y-axis only.
● "Z"
Shows the field strength measured on the antenna's z-axis only.

R&S FSH Spectrum Analyzer Mode
Configuring Spectrum Measurements
Operating Manual 1173.6275.12 - 31 96
3.2 Configuring Spectrum Measurements
3.2.1 Configuring the Horizontal Axis
The FREQ key contains all necessary functions to configure the horizontal axis for
spectrum measurements.
The contents of the menu depend on the currently selected measurement.
Usually, the horizontal axis contains frequency information in spectrum mode. You can
specify the frequency in terms of the center frequency or by defining a start and stop
frequency for a particular span.
If you know the frequency of the signal you are measuring, it is best to match the
center frequency to the signal's frequency. If you are investigating signals, e.g.
harmonics, that are within a particular frequency range, the best option is to enter a
start and stop frequency to define the span.
3.2.1.1 Defining the Center Frequency
The center frequency represents the frequency at the center of the horizontal axis in
the diagram area.
► Press the FREQ key.
The R&S FSH opens the frequency menu.
When you press the FREQ key, the R&S FSH automatically opens an input field to
define the center frequency. If the input field is inactive, you can open it with the
"Center Freq" softkey.
► Enter the center frequency you need.
The frequency you have entered becomes the new center frequency.
While adjusting the center frequency, you may obtain a value that is outside the
R&S FSH maximum span. If this happens, the R&S FSH automatically reduces the
span.
3.2.1.2 Defining a Frequency Step Size
If you set the center frequency with the rotary knob or the cursor keys, the distance of
each step that you take depends on the span. With the rotary knob, the smallest
possible step is a pixel. As the trace consists of 631 pixels, each step is equal to 1/630
of the span. With the cursor keys, the step is 10% of the span or one division of the
grid.
You can set another step size.
► Press the FREQ key.
► Press the "CF Step Size" softkey.
The R&S FSH opens a submenu that contains possible step sizes.

R&S FSH Spectrum Analyzer Mode
Configuring Spectrum Measurements
Operating Manual 1173.6275.12 - 31 97
- 0.1 x Span
The step size equals 10% of the span or 1 division of the horizontal axis.
- =Center
The step size equals the center frequency.
This step size is ideal for measurements on harmonics. When you increase or
decrease the center frequency, the center frequency automatically moves to
the next harmonic.
- Manual…
Define any step size you want.
This step size makes it easy to investigate a spectrum with frequencies at
constant intervals.
► Select the step size you need from the menu.
The R&S FSH adjusts the step size accordingly.
If you set the step size to 10% of the span or to the center frequency, the R&S FSH
sets the step size internally. Manually defining the step size opens an input field to
define the step size.
3.2.1.3 Setting a Frequency Offset
For measurements on frequency converters such as satellite downconverters, it is
often convenient to reference the results to the frequency prior to conversion. For this
purpose, the R&S FSH offers a frequency offset that arithmetically shifts the center
frequency to higher or lower frequencies. Thus, the R&S FSH displays the input
frequency of the DUT.
Positive frequency offset is possible in the range from 1 Hz to 100 GHz, in steps of
1 Hz. The maximum negative frequency offset depends on the start frequency you
have set. The start frequency, taking into account the frequency offset, is always
≥ 0 Hz.
► Press the FREQ key.
► Press the "Freq Offset" softkey.
The R&S FSH opens an input field to set the frequency offset.
► Enter the frequency offset you need.
The R&S FSH adds the frequency offset to the center frequency you have set. A
red dot at the center frequency display indicates that a frequency offset has been
set.

R&S FSH Spectrum Analyzer Mode
Configuring Spectrum Measurements
Operating Manual 1173.6275.12 - 31 98
3.2.1.4 Defining a Start and Stop Frequency
Defining a start an stop frequency is best suited for example for measurements on
harmonics or signals whose exact frequency is unknown.
► Press the FREQ key.
► Press the "Start Freq" softkey.
The R&S FSH opens an input field to define the start frequency.
► Enter the start frequency you need.
► Set a stop frequency with the "Stop Freq" softkey.
The R&S FSH adjusts the horizontal axis according to your input, beginning with
the start frequency and ending with the stop frequency.
If you have entered a stop frequency that is outside the maximum frequency range,
the R&S FSH sets the stop frequency to the possible maximum.
The label of the horizontal axis changes from "Center" and "Span" to "Start" and
"Stop".
3.2.1.5 Setting the Span
The span is the frequency range around the center frequency that a spectrum analyzer
displays on the screen. The span you should select depends on the signal and the
measurement that you are performing. A rule of thumb is that it should be at least twice
the bandwidth occupied by the signal.
The available span for frequency domain measurements depends on the instrument
model.
● R&S FSH4: 10 Hz to 3.6 GHz
● R&S FSH8: 10 Hz to 8 GHz
● R&S FSH13: 10 Hz to 13.6 GHz
● R&S FSH20: 10 Hz to 20 GHz
If you set a span of 0 Hz (zero span), the R&S FSH performs measurements in the
time domain.
► Press the SPAN key.
When you press the SPAN key, the R&S FSH automatically opens an input field to
define the span. If the input field is inactive, you can open it with the "Manual
Span" softkey.
► Enter the span you need.
The R&S FSH adjusts the span of the horizontal axis.

R&S FSH Spectrum Analyzer Mode
Configuring Spectrum Measurements
Operating Manual 1173.6275.12 - 31 99
If you have to switch between full span and a smaller span, you can do so without
having to enter the numeric values.
► Press the SPAN key.
► Press the "Full Span" softkey.
The R&S FSH displays the spectrum over its entire frequency range.
► Press the "Last Span" softkey.
The R&S FSH restores the span that you have set just before displaying the entire
frequency range.
Time domain measurements
You can also activate time domain measurements without having to enter the value
manually. When measuring in the time domain, the span is 0 Hz. In that state, the
R&S FSH measures the signal at the current center frequency only. Instead of
displaying the spectrum, the R&S FSH shows the signal power over a certain time
period. The horizontal axis becomes the time axis. The display always starts at 0 s and
stops after the currently set sweep time.
► Press the SPAN key.
► Press the "Zero Span" softkey.
The R&S FSH sets a span of 0 Hz and performs the measurement in the time
domain.

R&S FSH Spectrum Analyzer Mode
Configuring Spectrum Measurements
Operating Manual 1173.6275.12 - 31 100
3.2.2 Configuring the Vertical Axis
All relevant settings to configure the vertical axis are available in the amplitude menu.
You can access it via the AMPT key.
3.2.2.1 Setting the Reference Level
The reference level is represented graphically by the grid line at the top of the diagram.
The reference level sets the input signal gain up to the display stage. If the reference
level is low, the gain is high. That means that even weak signals are displayed clearly.
If you are measuring strong signals, you have to set a high reference level in order to
prevent an overload of the signal path of the analyzer and to keep the signal within the
display range. If you are measuring the spectrum of a composite signal, make sure that
the reference level is high enough to cover all signals and that all signals are within the
measurement diagram.
► Press the AMPT key.
When you press the AMPT key, the R&S FSH automatically opens an input field to
define the center frequency. If the input field is inactive, you can open it with the
"Ref Level" softkey.
► Enter the reference level you require.
If you change the reference level, the R&S FSH adjusts the position of the trace as
you make the changes.
By default, the reference level corresponds to the grid line at the top of the diagram.
You can also change the position of the reference level to another grid line if you have
a signal that would otherwise overlap with the top of the diagram area. The R&S FSH
indicates the current reference level position with a triangle at the corresponding grid
line on the vertical axis ( ).
► Press the AMPT key.
► Press the "Range / Ref Pos" softkey.
The R&S FSH opens a submenu.
► Select the "Ref Position 10…" menu item.
The R&S FSH opens an input field to define the reference position.
► Enter the number of the grid line you want the reference level at.
The range is from 0 to 10. "0" corresponds to the lowest grid line, "10" corresponds
to highest grid line.
3.2.2.2 Setting a Display Range
The display range determines the scaling or resolution of the vertical axis. In the
default state, the display range is a logarithmic scaling over a 100 dB. This
corresponds to 10 dB per grid division. The R&S FSH provides other display ranges
that either increase or decrease the resolution of the vertical axis.

R&S FSH Spectrum Analyzer Mode
Configuring Spectrum Measurements
Operating Manual 1173.6275.12 - 31 101
However, increasing resolution does not increase the accuracy of, for example, the
marker level readout, but only makes it easier to read values off the trace.
You can also select a linear scale for the vertical axis. In that case, the power levels
are expressed as a percentage of the reference level. Linear scaling is useful to
display AM modulated carriers in the time domain, for example.
► Press the AMPT key.
► Press the "Range / Ref Pos" softkey.
The R&S FSH opens a submenu to select the display range.
► Select the display range you need (“Manual Range” allows you to select a custom
range).
The R&S FSH adjusts the vertical axis accordingly.
3.2.2.3 Selecting the Display Unit
By default, the vertical axis (and therefore the reference level) is scaled in dBm.
However, the units dBmV, dBµV, Watt and Volt are also available. Selecting the right
unit is relevant for the marker level display because the unit of the marker level is the
same as that of the reference level.
► Press the AMPT key.
► Press the "Unit" softkey.
The R&S FSH opens a submenu to select the display unit.
► Select one of the available units.
The R&S FSH adjusts the labels of the vertical axis accordingly.
3.2.2.4 Setting a Reference Offset
You can define a reference offset for the reference level. With a reference offset, you
can increase the reference level by a certain amount. This is useful, for example, if an
attenuator or amplifier has been inserted before the RF input. The R&S FSH
automatically takes the loss or gain into account when the level is displayed and no
manual calculations are necessary. A loss introduced at the RF input must be entered
as a positive number and a gain as a negative number.
► Press the AMPT key.
► Press the "Ref Offset" softkey.
The R&S FSH open an input field to
► Enter the offset you need.
The R&S FSH includes the offset in the measurement.
To indicate an offset other than 0, the R&S FSH puts a red dot at the "Ref:"
hardware setting ( ).

R&S FSH Spectrum Analyzer Mode
Configuring Spectrum Measurements
Operating Manual 1173.6275.12 - 31 102
3.2.2.5 Setting the RF Attenuation
RF attenuation adjusts the input range inside the analyzer. It is coupled directly to the
reference level. If you have set a high reference level, RF attenuation is turned on in
10 dB steps according to the table below so that the input mixer always remains in the
linear range.
The R&S FSH provides three attenuation modes.
● Auto Low Distortion
If this mode is active, the R&S FSH sets the RF attenuation 10 dB higher
according to the table below, making the stress of the input mixer 10 dB less at the
specified reference level. If the spectrum is densely occupied with signals, e.g. in a
television cable network, the input mixer reduces the R&S FSH inherent spurious
products. However, the inherent noise display of the R&S FSH increases due to
the increased attenuation in front of the input mixer.
● Auto Low Noise
If this mode is active, the R&S FSH sets the RF attenuation 10 dB lower. This
increases the sensitivity of the R&S FSH, which means that the inherent noise
display decreases due to the lower attenuation in front of the input mixer.
● Manual
Manual selection of the attenuation.
You can check the status of the RF attenuation and the preamplifier in the
measurement setup dialog and the hardware settings area of the display.
Reference Level
Preamplifier OFF Preamplifier ON
RF Attenuation RF Attenuation
Low Noise Low Distortion Low Noise Low Distortion
≤-30 dBm 0 dB 0 dB 0 dB 0 dB
-29 to -25 dBm 0 dB 0 dB 0 dB 5 dB
-24 to -20 dBm 0 dB 0 dB 0 dB 10 dB
-19 to -15 dBm 0 dB 5 dB 5 dB 15 dB
-14 to -10 dBm 0 dB 10 dB 10 dB 20 dB
-9 to -5 dBm 5 dB 15 dB 15 dB 25 dB
-4 to 0 dBm 10 dB 20 dB 20 dB 30 dB
1 to 5 dBm 15 dB 25 dB 25 dB 35 dB
6 to 10 dBm 20 dB 30 dB 30 dB 40 dB
11 to 15 dBm 25 dB 35 dB 35 dB 40 dB
16 to 20 dBm 30 dB 40 dB 40 dB 40 dB
21 to 25 dBm 35 dB 40 dB 40 dB 40 dB
26 to 30 dBm 40 dB 40 dB 40 dB 40 dB
R&S FSH Spectrum Analyzer Mode
Configuring Spectrum Measurements
Operating Manual 1173.6275.12 - 31 103
► Press the AMPT key.
► Press the "RF Att / Amp / Imp" softkey.
► Select either the "Auto Low Distortion" or the "Auto Low Noise" menu item.
The R&S FSH sets the attenuation according to the table above.
► Select the "Manual: 0 dB" menu item for manual selection of the RF attenuation.
The R&S FSH opens an input field to set the RF attenuation. You can set the
attenuation from 0 dB to 40 dB in 5 dB steps.
To indicate a manual attenuation, the R&S FSH puts a red dot at the "Att:"
hardware setting ( ).
3.2.2.6 Using the Preamplifier
To increase the input sensitivity, the R&S FSH provides an integrated 20 dB
preamplifier after the input mixer.
In the default state of the R&S FSH, the preamplifer is turned off. If you want to
measure signals with low powers, you can turn it on.
► Press the AMPT key.
► Press the "RF Att / Amp / Imp" softkey.
► Select either the "Preamp On" or "Preamp Off" menu item.
The R&S FSH turns the preamplifier on and off.
3.2.2.7 Setting the Input Impedance
In the default state, the input impedance is 50 Ω.
The R&S FSH can also handle 75 Ω systems. The R&S FSH does not select a 75 Ω
RF input per se. Instead it selects a 75 Ω matching pad connected at the RF input. The
50/75 Ω matching pad R&S RAZ is recommended for 75 Ω matching (see
recommended accessories). The R&S FSH automatically considers the conversion
factor when a value of 75 Ω is set.
► Press the AMPT key.
► Press the "RF Att / Amp / Imp" softkey.
► Select the impedance you need.
You can also use other matching pads (e.g. R&S RAM or R&S FSH-Z38) by
activating transducer factors.
3.2.2.8 Using Transducer Factors
For more information see "Using Transducer Factors".

R&S FSH Spectrum Analyzer Mode
Configuring Spectrum Measurements
Operating Manual 1173.6275.12 - 31 104
3.2.3 Setting Bandwidths
The bandwidth menu contains all settings to set up filter bandwidths available in the
R&S FSH. You can access it with the BW key.
3.2.3.1 Setting the Resolution Bandwidth
The resolution bandwidth in a spectrum analyzer determines the frequency resolution
for frequency domain measurements and therefore determines how well it can
separate adjacent frequencies. The results as you see them on the display depend on
the passband of a resolution filter.
The resolution bandwidth (RBW) has several effects on measurements.
● To be able to display two or more signals whose frequencies are close together
separately, you need a (resolution) filter whose bandwidth is small enough. The
frequency difference between two sinusoidal carriers can not be less than the
selected resolution bandwidth if the carriers are to be resolved, for example.
● The bandwidth of the resolution filter also affects the noise that is displayed by the
R&S FSH. The smaller the bandwidth, the less noisy the results are. The rule is,
that if you increase or decrease the bandwidth by a factor of 3, the noise goes
down or up by 5 dB. If you change the bandwidth by a factor of 10, the displayed
noise changes by 10 dB.
● The resolution bandwidth affects the speed of the measurement. If you want to
display the true spectrum, the resolution filters have to settle at all frequencies that
are of interest. Narrow bandfilters have a longer settling time compared to wide
ones. Therefore the sweep time increases the smaller the resolution bandwidth
gets. The rule is, that if you reduce the bandwidth by a factor of 3, the sweep time
goes up by a factor of 9. If you reduce the bandwidth by a factor of 10, the sweep
time goes up by a factor of 100.
The R&S FSH has resolution bandwidths from 1 Hz to 3 MHz in a 1-3-10 sequence.
Additionally, the R&S FSH provides a 200 kHz resolution bandwidth that you have to
select and enter manually.
Setting the 200 kHz resolution bandwidth
The 200 kHz bandwidth is not coupled to the span, so it will not be selected if
automatic selection of the RBW is on.
In fact, you have to enter the 200 kHz resolution bandwidth with the number keys.
When using the rotary knob or the cursor keys, the 200 kHz bandwidth will be skipped.
In the R&S FSH's default state, the resolution bandwidth is coupled to the span, i.e. if
you change the span, the R&S FSH adjusts the resolution bandwidth. Therefore, you
do not have to set the resolution bandwidth manually in many cases, because the
R&S FSH automatically sets the resolution bandwidth if you change the span.
► Press the BW key.
By default, the resolution bandwidth is coupled to the span.
► Press the "Manual RBW" softkey.

R&S FSH Spectrum Analyzer Mode
Configuring Spectrum Measurements
Operating Manual 1173.6275.12 - 31 105
The R&S FSH opens an input field to define the resolution bandwidth.
► Enter the resolution bandwidth you need.
The R&S FSH uses the resolution bandwidth you have entered for the
measurement.
If the resolution bandwidth is no longer coupled to the span, the R&S FSH puts a
red dot at the "RBW" hardware setting ( ).
► Press the "Auto RBW" softkey to again couple the resolution bandwidth to the
span.
Automatic adjustment of the sweep time
In its default mode, the R&S FSH automatically adjusts the sweep time as soon as you
change the resolution bandwidth. This is to make sure that the settling time required for
the selected resolution filter is properly taken into account.The maximum allowed
sweep time is 1000 s. For narrow resolution filters this value would be exceeded for
large spans. In order to avoid this, the R&S FSH adjusts the span automatically as
soon as the maximum sweep time is reached.
3.2.3.2 Setting the Video Bandwidth
The video bandwidth (VBW) basically smoothes the trace by reducing the noise and
therefore making power levels easier to see.
The noise reduction is a result of the video filter. This lowpass filter defines the video
bandwidth and filters the higher frequency parts of the voltage from the signal. Video
voltage is the (DC) voltage that results from the IF signal passing through the envelope
detector which removes the IF components and outputs the envelope only. This output
is also known as the video signal.
The figure below shows that process on an AM modulated signal in the time domain.
In case of an AM modulated signal, the envelope (or video) signal contains a DC
component that corresponds to the level of the carrier. The video signal also contains
an AC component whose frequency is the same as the AM frequency.

R&S FSH Spectrum Analyzer Mode
Configuring Spectrum Measurements
Operating Manual 1173.6275.12 - 31 106
If the bandwidth of the video filter is less than the frequency of the AC component, it is
suppressed depending on its maximum frequency. If the AM component should be
displayed truly, the cutoff frequency of the filter has to be greater than the modulation
frequency.
If there is noise on the sine signal, the modulation signal can be thought of as noise. If
the video bandwidth is reduced, the high-frequency noise components above the cutoff
frequency of the video filter will be rejected. The smaller the video bandwidth, the
smaller the noise amplitude at the video filter output.
The R&S FSH provides video bandwidths from 1 Hz to 3 MHz in a 1-3-10 sequence. In
its default state, the video bandwidth is coupled to the resolution bandwidth and is the
same as the resolution bandwidth. If you change the resolution bandwidth, the
R&S FSH adjusts the video bandwidth accordingly.
The effects of the video bandwidth on measurements are as follows.
● if you are performing measurements on modulated signals, the video bandwidth
must be sufficiently large so that significant modulation components are not
rejected (≥ RBW)
● if you want to keep signals free of noise, you should select the smallest video
bandwidth possible (≤ 0.1 x RBW)
● if you are performing measurements on pulsed signals, the video bandwidth should
be at least three times greater than the resolution bandwidth so that the pulse
edges are not distorted
Like the resolution bandwidth, the video bandwidth has an effect on sweep speed.
Before each measurement, the video filter has to settle.
► Press the BW key.
► Press the "Manual VBW" softkey.
The R&S FSH opens an input field to define the video bandwidth.
► Enter the video bandwidth you need.
The R&S FSH uses the video bandwidth you have entered for the measurement.
If the video bandwidth is no longer coupled to the resolution bandwidth, the
R&S FSH puts a red dot at the "VBW" hardware setting ( ).
► Press the "Auto VBW" softkey to again couple the video bandwidth to the RBW.

R&S FSH Spectrum Analyzer Mode
Configuring Spectrum Measurements
Operating Manual 1173.6275.12 - 31 107
3.2.4 Configuring and Triggering the Sweep
You can find all necessary settings to configure the sweep itself in the sweep menu. To
access it, press the SWEEP key.
3.2.4.1 Setting the Sweep Time
The sweep time is the time it takes the R&S FSH to get the results that are contained
in one trace.
In the frequency domain (span > 0), the sweep time is the time it takes the R&S FSH to
measure the spectrum in the specified span. To avoid the display of spurs in the
spectrum, the sweep time has to meet some conditions.
● The sweep time depends on the resolution bandwidth. If the sweep time is too
short, the resolution filter has no time to settle. In that case, the displayed levels
will be too low. For more information see "Setting the Resolution Bandwidth".
● The sweep depends on the span. If you increase the span, you also have to
increase the sweep time.
In its default state, the R&S FSH couples the sweep time to the span and the
resolution bandwidth to avoid invalid settings. If the coupling is active, the R&S FSH
always sets the shortest possible sweep time to make sure that the display of the
spectrum is correct and valid.
The R&S FSH requires a minimum sweep time of 20 ms for every 600 MHz of span. If
you increase the span, the R&S FSH will also increase the sweep time.
In the time domain (span = 0), the R&S FSH shows the video voltage over time. The
horizontal axis becomes a time axis that starts at 0 s and ends at the sweep time that
you selected. The range of the sweep time in the time domain is from 200 µs to 1000 s.
► Press the SWEEP key.
In the default state, "Auto SWP Time" is active.
► Press the "Manual SWP Time" softkey.
The R&S FSH opens an input field to set the sweep time.
► Enter the sweep time you need.
If the video bandwidth is no longer coupled to the span or the resolution bandwidth,
the R&S FSH puts a red dot at the "SWT" hardware setting ( ).

R&S FSH Spectrum Analyzer Mode
Configuring Spectrum Measurements
Operating Manual 1173.6275.12 - 31 108
3.2.4.2 Selecting the Sweep Mode
The sweep mode is the way the R&S FSH performs the measurement.
In its default state, the R&S FSH measures continuously. In this mode, the R&S FSH
automatically repeats the sweep in the defined range of the horizontal axis (frequency
or time) and updates the trace accordingly after it has finished with one sweep.
In some cases it may be sufficient to get the results over a single sweep only, e.g. if a
particular trigger condition is met. In single sweep mode, the R&S FSH performs the
sweep a certain number of times (depending on the number of averages you have set)
over the defined range of the horizontal axis (frequency or time) and then stops
measuring. It performs another sweep only after you tell it to. For more information on
setting the number of sweeps included in a single sweep see "Selecting the Trace
Mode (Average)".
► Press the SWEEP key.
► Press the "Single Sweep" softkey.
The R&S FSH activates single sweep mode.
► Press the "Cont Sweep" softkey.
The R&S FSH again starts to measure continuously.
3.2.4.3 Working with Trigger Functionality
If you have to perform measurements according to certain signal conditions, you can
use a trigger. A trigger responds to certain events. If a trigger is active, the R&S FSH
starts to measure if the trigger conditions are met. The trigger can be generated either
externally or internally.
Selecting the trigger source
► Press the SWEEP key.
► Press the "Trigger" softkey.
The R&S FSH opens a submenu to select the trigger source.
► Select the trigger source you need.
The R&S FSH activates the trigger.
The R&S FSH provides the following trigger functions.
● Free Run
A new sweep starts on completion of the previous sweep. This is the default state
of the R&S FSH.

R&S FSH Spectrum Analyzer Mode
Configuring Spectrum Measurements
Operating Manual 1173.6275.12 - 31 109
● Video Trigger
A sweep starts when the video voltage exceeds a particular level. The video trigger
is available only in the time domain (span = 0).
In the frequency domain, the R&S FSH would never start a measurement with the
video trigger because there is no guarantee that there is a signal that generates
video voltage present at the start frequency.
● External Trigger (rising or falling slope)
A sweep starts on the rising edge (RISE) or on the falling edge (FALL) of an
external trigger signal. The external trigger signal is fed in via the BNC connector
"Ext Trigger". The switching threshold is 1.4 V, i.e. a TTL signal level.
● Gated Trigger
When the gated trigger is active, a gate signal that is applied to the R&S FSH
trigger input controls the sweep. The R&S FSH starts measuring when the applied
gate signal becomes active and the set gate delay has expired, and it interrupts the
measurement as soon as the defined gate length is reached. With the gate signal
becoming active the next time the measurement is resumed etc.
Pulsed signals can be measured by this method, if the gate delay and gate length
are selected in a way that the measurement is only performed while the pulse is
active. Gated measurements are possible in the frequency domain (span > 0) and
the time domain (span = 0), but it is available only in combination with an external
gate signal.
Note that gated trigger is not available if you are using a forced FFT sweep (see
Selecting the Sweep Type).
● Internal Trigger
A sweep is triggered with an accurate, internal clock.
You can use this trigger, for example, to trigger on time domain based signals,
and, in combination with a gated trigger, hide the uplink or downlink information in
the signal.
To use the internal trigger for this scenario, proceed as follows:
- Define the frequency, the span, the RBW and the amplitude parameters.
- Define the time bases of the internal clock in Hz. These should correspond
with the time domain setting of the injected RF signal.
Example: TD-LTE = 100Hz
- With the "Gate Settings" ("Gate Length" and "Gate Delay"), select the signal
you are interested in. (See below for more information about gate settings.)
- Turn on the gated trigger.
Note that the internal trigger is available for devices with a serial number > 121000

R&S FSH Spectrum Analyzer Mode
Configuring Spectrum Measurements
Operating Manual 1173.6275.12 - 31 110
Including a Delay Time
When you are using a video trigger in the time domain or an external trigger, you can
delay the start of the measurement with respect to the trigger event by entering a delay
time. In this way, you can include time differences between the trigger event and the
measurement.
The range of the trigger delay is from 0 µs to 100 s. The resolution depends on the
subrange.
Trigger delay Resolution
0 to 1 ms 10 µs
1 ms to 10 ms 100 µs
10 ms to 100 ms 1 ms
100 ms to 1 s 10 ms
1 s to 10 s 100 ms
10 s to 100 s 1 s
► Press the SWEEP key.
► Press the "Trigger" softkey.
► Select the "Trigger Delay…" menu item.
The R&S FSH opens an input field to define the trigger delay.
► Enter the delay time you need.
Defining the Trigger Level
When you are using the video trigger, you have to define a trigger level. The trigger
level is a percentage of the reference level. A trigger level of 100 % is the same as the
reference level. A trigger level of, e.g. 50% corresponds to the middle of the vertical
axis. The R&S FSH indicates the video trigger level with a triangle.
► Press the SWEEP key.
► Press the "Trigger" softkey.
► Select the "Trace Video" menu item.
The R&S FSH opens an input field to define the trigger level.
► Enter the trigger level.
The R&S FSH shows the trigger level by adding a horizontal line to the diagram
area.
Performing Gated Sweeps
When the external trigger is active, it is possible to perform a gated sweep.
► Press the SWEEP key.
► Press the "Trigger" softkey.

R&S FSH Spectrum Analyzer Mode
Configuring Spectrum Measurements
Operating Manual 1173.6275.12 - 31 111
► Activate an external trigger.
Now that the external trigger is active, the "Gated Trigger" menu item becomes
available.
► Press the "Trigger" softkey again.
► Select the "Gated Trigger" menu item.
In order to get appropriate results, you have to set the gate delay and gate length in a
way that the measurement is active during the interesting part of the signal. You can
also modify the sweep time in order to match the horizontal axis to the length of the
signal and thus set the gate delay and gate length parameters more accurately.
The gate delay parameter defines the time between the trigger event and the
beginning of the actual measurement. The gate length defines the duration of the
measurement, before it is interrupted and the next gate signal is anticipated to resume
the measurement.
► Press the SWEEP key.
► Press the "Trigger" softkey.
► Select the "Gate Settings" menu item.
The R&S FSH opens a softkey submenu to control the gate settings. At the same time,
the R&S FSH switches into time domain, as indicated in the display.
► Press the "Manual SWP Time" softkey and set the sweep time in a way that the
portion of interest of the signal is visible on the screen.
► Press the "Gate Delay" softkey.
The R&S FSH opens an input field to define the trigger delay.
► Enter the delay time you need.
The measurement now starts after the delay time has passed.
► Press the "Gate Length" softkey.
The R&S FSH opens an input field to define the gate length.
► Enter the length of the gate.
The R&S FSH now measures over the period of the gate length. After the gate has
closed, the R&S FSH waits with the measurement until the next gate signal
happens.
The delay time and gate length are represented by vertical red lines in the diagram
area.
► After setting the gate delay and gate length, exit the gate settings menu with the
"Exit" softkey.
The R&S FSH returns to the frequency domain provided it was active before
setting up the gated trigger. The original span is restored. The R&S FSH is ready
to perform measurements with an accurately set gate.

R&S FSH Spectrum Analyzer Mode
Configuring Spectrum Measurements
Operating Manual 1173.6275.12 - 31 112
3.2.4.4 Selecting the Sweep Type
The sweep type defines the way how the R&S FSH captures and processes the
data.
► Press the SETUP key.
► Press the "User Preferences" softkey.
► Select the "Sweep / FFT" menu item.
The R&S FSH opens a dropdown menu to select the sweep type.
Which sweep type is appropriate for the current measurement depends on the
span, RBW, VBW and sweep time settings.
- Auto
The R&S FSH automatically selects the fastest sweep type for the current
measurement configuration.
- Always Sweep
The R&S FSH uses the local oscillator to provide the spectrum quasi analog
from the start to the stop frequency.
- Prefer FFT
The R&S FSH samples the signal levels over time on a defined frequency
value and transforms it to the spectrum by fast Fourier transformation (FFT).
Note that an FFT sweep is not possible under the following circumstances:
● For measurements in the time domain (zero span).
● For TDMA Power, Spectrum Emission Mask and Spurious Emission
measurements.
● For measurements with a gated trigger.
● If the frequency span is smaller than the resolution bandwidth (RBW).
● If the the resolution bandwidth (RBW) is greater than 300 kHz.

R&S FSH Spectrum Analyzer Mode
Configuring Spectrum Measurements
Operating Manual 1173.6275.12 - 31 113
3.2.5 Working with Traces
The trace menu contains all functions available to customize the trace display.
3.2.5.1 Selecting the Trace Mode
The R&S FSH provides several trace modes. The trace mode defines the way the
R&S FSH writes the trace.
● Clear/Write
In its default state, the R&S FSH overwrites the trace after each sweep.
You can apply all detectors in this mode.
● Average
The trace is the result of the moving average over several sweeps.
The R&S FSH calculates the (moving) average of the power levels for each pixel
over a particular number of sweeps in the range from 2 to 999.
Averaging reduces the effects of noise, but has no effects on sine signals. Using
the trace averaging therefore is a good way to detect signals in the vicinity of
noise.
You can apply all detectors in this mode.
● Max Hold
The trace shows the maximum power levels that have been measured at each
pixel.
To overwrite a max hold trace, change a parameter in a way that the results can
not be compared any more, e.g. the span. Using the max hold trace mode is a
good way to detect intermittent signals or the maximum values of fluctuating
signals, for example.
Using the max hold trace mode automatically activates the max peak detector.
● Min Hold
The trace shows the minimum power levels that have been measured at each
pixel.
To overwrite a min hold trace, change a parameter in a way that the results can not
be compared any more, e.g. the span. Using the min hold trace mode is a good
way to highlight signals within noise or suppress intermittent signals.
Using the min hold trace mode automatically activates the min peak detector.
● View
The view trace mode freezes the current trace and aborts the measurement.
Using the view trace mode is a good way to evaluate the trace, for example with
markers.

R&S FSH Spectrum Analyzer Mode
Configuring Spectrum Measurements
Operating Manual 1173.6275.12 - 31 114
► Press the TRACE key.
► Press the "Trace Mode" softkey.
The R&S FSH opens a submenu to select the trace mode.
► Select the trace mode you want to work with.
If you have selected the average trace mode ("Average: 10" menu item), the
R&S FSH opens an input field to set the number of sweeps the R&S FSH includes
in the averaging.
► Enter the number of sweeps to include in the averaging.
In continuous sweep mode, the R&S FSH now calculates the moving average over
the number of sweeps you have specified. In single sweep mode, it stops the
measurement after finishing the sweeps and averages the traces.
3.2.5.2 Selecting the Detector
The number of measurement results collected in a single sweep usually is very high,
especially if the span is large. However, the display of the R&S FSH can display only
631 results in horizontal direction, as it is limited by the number of pixels that are
available on the display. Therefore, it has to combine measurement results to fit them
on the display. In that case, one pixel represents a frequency range = span/631.
The detector determines the way the R&S FSH combines and displays the results for
one pixel. The data base is the video voltage of the analyzer.
The R&S FSH provides several types of detectors.
● Auto Peak
If the auto peak detector is active, the R&S FSH displays both the maximum and
the minimum power levels that were measured in the frequency range covered by
a pixel.
Therefore, the auto peak detector loses no information. If a signal power level
fluctuates (e.g. noise), the width of the trace depends on the magnitude of the
signal fluctuation.
The auto peak detector is the default detector.
● Max Peak
If the max peak detector is active, the R&S FSH displays only the maximum power
levels that were measured in the frequency range covered by a pixel.
The max peak detector is useful for measurements on pulse or FM signals, for
example.
● Min Peak
If the max peak detector is active, the R&S FSH displays only the minimum power
level that were measured in the frequency range covered by a pixel.
The min peak detector displays sine signals with the correct level and suppresses
noise. Therefore it is useful to find sine signals in the vicinity of noise.

R&S FSH Spectrum Analyzer Mode
Configuring Spectrum Measurements
Operating Manual 1173.6275.12 - 31 115
● Sample
If the sample detector is active, the R&S FSH shows one random power level that
was measured in the frequency range covered by a pixel.
The sample detector is useful for measurements in the time domain (span = 0 Hz)
as it provides the only way to represent the timing of the video signal correctly.
In the frequency domain, the sample detector is a good way to measure noise
power because noise usually has a uniform spectrum with a normal amplitude
distribution.
Signals may get lost if you are using the sample detector for measurements with a
span that is greater than "RBW*631".
● RMS
If the RMS detector is active, the R&S FSH measures the spectral power over one
pixel. In case of power measurements, the RMS detector always shows the true
power of a signal, regardless of the shape of the signal.
The RMS detector is best for measurements on digitally modulated signals
because it provides stable and true power readings. In combination with a high
sweep time you can increase the display stability even more because the
measurement time for each pixel increases.
Noise measurements also provide stable results if you apply the RMS detector in
combination with a high sweep time.
However, the bandwidth occupied by the signal to be measured should at least
equal the frequency covered by a trace pixel or the selected resolution bandwidth
(whichever is larger). Otherwise, the power the R&S FSH shows is too low
because there are spectral components within the frequency range covered by the
pixel that do not originate from the signal you want to observe (e.g. noise).
To get the true power, the video bandwidth (VBW) should also be greater than the
resolution bandwidth (RBW). Otherwise, an averaging effect caused by video
bandlimiting comes into play before the RMS value is calculated.
The R&S FSH provides automatic selection of the detector. In that case, the R&S FSH
selects the detector that is most suitable for the current trace mode.
Trace mode Detector
Clear/Write Auto Peak
Average Sample
Max Hold Max Peak
Min Hold Min Peak

R&S FSH Spectrum Analyzer Mode
Configuring Spectrum Measurements
Operating Manual 1173.6275.12 - 31 116
If you select the detector manually, the detector is independent of the trace mode and
will not change.
► Press the TRACE key.
► Press the "Detector" softkey.
► Select the detector you want to use.
If you automatic detector selection is active, the corresponding menu item is
marked by an [X].
3.2.5.3 Working with a Second Trace
In spectrum mode, you can use two traces. Both traces are based on the same
settings, except the trace settings like the trace mode or the detector. You can use the
second trace to compare, for example, two different detector settings.
In the default state, only trace 1 is active.
► Press the TRACE key.
► Press the "Show" softkey.
► Select the "Trace 2" menu item.
The R&S FSH shows the second
trace. The second trace is in a
different color. To show that the
second trace is active, the
R&S FSH labels the "Trace 2"
menu item with an [X].
After you have activated the
second trace, this is also the
active one. All actions (like
changing the detector or trace
mathematics) apply to the active
trace.
The trace indicator shows the currently active trace with a white background.
► Press the "Select Trace" softkey.
Trace 1 becomes the active trace.
You can put both traces into the internal memory of the R&S FSH and restore them
later. Note that the memory trace 1 and memory trace 2 have the same color (i.e.
white).

R&S FSH Spectrum Analyzer Mode
Configuring Spectrum Measurements
Operating Manual 1173.6275.12 - 31 117
3.2.5.4 Working with Memory Traces
You can save the image of both traces to the memory of the R&S FSH and later
restore it and compare it to a live trace. The memory trace is always colored white to
distinguish it from the live trace.
Measurement settings
Because the memory trace is just a bitmap, any modifications to measurement settings
like span or reference level are nor reflected in the memory trace.
When you save a data set, the R&S FSH also stores the associated trace in the trace
memory. If you restore it at a later time, you can display the memory trace as if it is a
normal memory trace.
► Press the TRACE key.
► Select the trace you want to store
in the trace memory with the
"Select Trace" softkey.
► Press the "TraceMemory"
softkey.
The R&S FSH saves the active
trace.
► Press the "Show" softkey.
► Select the "Memory <x>" menu
item.
The R&S FSH shows the corresponding memory trace. If active, it labels the
"Memory <x>" menu item with an [X].
3.2.5.5 Using Trace Mathematics
Trace mathematics substract the memory trace from the live trace and vice versa and
then display the results.
► Press the TRACE key.
► Press the "TraceMemory"
softkey.
► Press the "Show" softkey.
► Press the "Trace Math" softkey.
► Select the "Trace-Memory" or
"Memory-Trace" menu item.
The R&S FSH calculates and
shows the resulting trace.
► To turn off trace mathematics, select the "Off" menu item.

R&S FSH Spectrum Analyzer Mode
Configuring Spectrum Measurements
Operating Manual 1173.6275.12 - 31 118
3.2.6 Using Markers
The spectrum analyzer mode provides marker and deltamarker functionality. In
addition, you can use several marker functions.
3.2.6.1 Using Markers and Deltamarkers
The R&S FSH has six markers, five of which can be used as either markers or delta
markers.
The markers cannot leave the trace and indicate the horizontal and vertical coordinates
of the point they are positioned on. The horizontal position of a marker is shown by a
vertical line which extends from the top to the bottom of the measurement diagram.
The marker list above the diagram area shows the exact coordinates of all markers in
use.
The position of a delta marker is indicated by a dashed line to distinguish it from a
normal marker. The delta marker level is always a relative to the main marker level and
so the delta marker level unit is always dB. The delta marker frequency is always
relative to the main marker – in other words, the delta marker frequency is the
frequency difference between the frequency at the point marked by the main marker
and the frequency at the point marked by the delta marker.
To measure complex signals, you can activate up to six markers. Marker 1 is always a
normal marker and the reference of all delta markers. Markers 2 to 6 are either
markers or delta markers depending on your set up.
Screen Layout with Active Markers
1 Marker list
2 Marker label: M(x)
3 Delta marker label: D(x)
4 Active marker label (red label)
5 Delta marker (blue dotted line)
6 Marker (blue line)
7 Marker input field
8 Marker menu

R&S FSH Spectrum Analyzer Mode
Configuring Spectrum Measurements
Operating Manual 1173.6275.12 - 31 119
3.2.6.2 Positioning Markers
► Press the MARKER key.
The marker menu opens.
If, as yet, no marker has been activated, the R&S FSH automatically activates the
main marker and positions it on the maximum level that has been measured. In
addition, the marker frequency input field opens.
You can perform the following actions:
● Position the marker with the cursor keys.
When positioning the marker with the cursor keys, the step size is 10% of the
span.
● Position the marker with the rotary knob
When positioning the marker with the rotary knob, the step size is one pixel.
● Enter a marker position with the number keys and confirm the entry with one of the
unit keys.
► Confirm the marker position with the ENTER key.
The marker input field closes.
By default, the marker list above the diagram area is active. The marker list shows
the horizontal position of all markers and the corresponding vertical value. If
inactive, the list shows only the coordinates of markers 1 and 2.
You can turn it off and on again whenever you like.
► Press the "View List" softkey.
The marker list turns off or on, depending on its original state.
3.2.6.3 Positioning a Delta Marker
When a normal marker is already in use, you can add delta markers.
► Press the MARKER key.
► Press the "New Marker" softkey.
The R&S FSH activates a delta marker and positions it on the next maximum level
that has been measured. In addition, the delta marker input field opens.
The R&S FSH adds the delta marker to the marker list and shows the marker
position relative to the normal marker (M1).
You can perform the following actions:
● Enter a delta marker position with the number keys and confirm the entry with one
of the unit keys.
● Change the delta marker position with the rotary knob or the cursor keys.

R&S FSH Spectrum Analyzer Mode
Configuring Spectrum Measurements
Operating Manual 1173.6275.12 - 31 120
► Confirm the delta marker position with the ENTER key.
The delta marker input field closes.
► To add more markers, press the "New Marker" softkey several times until you have
the number of markers you want in the display.
3.2.6.4 Selecting the Marker Type
When you add new markers, they will be delta markers by default. Their coordinates
are relative to the first marker (M1). You can turn delta markers into normal markers if
you need absolute information about the marker position.
► Press the MARKER key.
► Select the delta marker you want to convert with the "Select Marker" softkey.
The corresponding marker symbol turns red and the marker input field opens.
► Press the "Marker Type" softkey.
The delta marker turns into a normal marker. Its label changes accordingly (e.g. D2
to M2) and its coordinates are now absolute values.
3.2.6.5 Automatic Positioning of Markers
The R&S FSH offers functions that make setting the markers easier or allow to make
instrument settings on the basis of the current marker position:
● "Set to Peak"
The Peak function places the active marker or the delta marker on the highest level
value of the trace.
● "Set to Next Peak"
The Next Peak function places the active marker or delta marker on the next
highest level value of the trace, relative to its current position.
● "Set to Minimum"
The Minimum function places the active marker or delta marker on the lowest
value of the trace.
► Press the MKR key.
► Press the "Set to Peak", "Set to Next Peak" or "Set to Minimum" softkey.
The R&S FSH positions the marker accordingly.

R&S FSH Spectrum Analyzer Mode
Configuring Spectrum Measurements
Operating Manual 1173.6275.12 - 31 121
3.2.6.6 Removing Markers
Remove markers any time you want.
Removing selected markers
► Select the marker you want to delete with the "Select Marker" softkey.
The corresponding marker symbol turns red and the marker input field opens.
► Press the MARKER key.
► Press the "Delete Marker" softkey.
► Select the "Delete Selected" menu item.
► Confirm the selection with the ENTER key.
The R&S FSH deletes the marker.
Deactivating markers
If you delete marker 1 (M1), all delta markers that are relative to that marker are also
deleted.
Removing delta markers only
► Press the MARKER key.
► Press the "Delete Marker" softkey.
► Select the "Delete All Delta" menu item.
► Confirm the selection with the ENTER key.
The R&S FSH deletes all delta markers.
Removing all markers at the same time.
► Press the MARKER key.
► Press the "Delete Marker" softkey.
► Select the "Delete All" menu item.
► Confirm the selection with the ENTER key.
The R&S FSH deletes all markers and delta markers.

R&S FSH Spectrum Analyzer Mode
Configuring Spectrum Measurements
Operating Manual 1173.6275.12 - 31 122
3.2.6.7 Using Marker Search Limits
The R&S FSH allows you to use only a limited section of the trace for the "Set to
Peak", "Set to Next Peak" and "Minimum" functions.
► Press the MKR key.
► Press the "Search Limits" softkey.
► Select the "Search Limits On/Off" menu item.
► Confirm the selection with the ENTER key.
The R&S FSH activates the marker search limits.
An [X] indicates an active search limit. Two vertical red lines show the lower and upper
limits in the diagram.
By default, the search limit range is over the whole span.
► Press the "Search Limits" softkey
► Select the "Lower Limit" menu item.
► Confirm the selection with the ENTER key.
The R&S FSH opens an input field to define the lower limit of the search range.
► Enter the lower limit.
► Confirm the entry with one of the unit keys.
If the span is wide enough, the R&S FSH displays a red vertical line to indicate the
lower limit.
► Define the upper search limit the same way.
Deactivating marker search limits
► Press the "Search Limits" softkey.
► Select the "Search Limits On/Off" menu item.
► Confirm the selection.
The "Search Limits" softkey turns grey again and in the "Search Limits" menu, the
[X] is no longer displayed.

R&S FSH Spectrum Analyzer Mode
Configuring Spectrum Measurements
Operating Manual 1173.6275.12 - 31 123
3.2.6.8 Using Marker Functions
In addition to the frequency and level readout, the R&S FSH provides several, more
complex, marker functions in spectrum analyzer mode.
Deactivating marker functions
Selecting a marker function again while it is still active turns that marker function off.
Measuring the Noise Power Density
The marker noise function calculates the noise power density at the marker position in
dBm/Hz. The R&S FSH includes several variables in the calculation of the noise power
density, including the trace pixel values, the resolution bandwidth, the detector and the
level display mode (absolute or relative). To stabilize the noise power display, the
R&S FSH uses the pixel the marker is on and four pixels to the right and four pixels to
the left of the marker pixel.
Noise power density can provide useful information when you are measuring noise or
digitally modulated signals. However, you will get valid results only if the spectrum in
the vicinity of the marker has a flat frequency response. When measuring the noise
power density on discrete signals, results are not valid.
► Press the MARKER key.
► Press the "Marker Function"
softkey.
► Select the "Noise" menu item.
The R&S FSH shows the level at
the marker frequency in dBm/Hz. If
you are using a delta marker for
the measurement, the results have
the unit dBc/Hz with marker 1
being the reference.
Measuring the Frequency
The R&S FSH provides a frequency counter. The frequency counter accurately
measures the frequency at the marker position.
When calculating the horizontal position of the marker, the R&S FSH includes the
current span, center frequency and the frequency of the pixel the marker is on. As the
trace only has 631 pixels, the marker position is just an approximation, especially if the
span is very wide.
With the frequency counter, however, you can get a more accurate result of the
horizontal marker position. If the frequency counter is active, the R&S FSH stops the
measurement at the marker position for a short time and measures the frequency
using the internal reference frequency.

R&S FSH Spectrum Analyzer Mode
Configuring Spectrum Measurements
Operating Manual 1173.6275.12 - 31 124
The accuracy of the results therefore depends only on the accuracy of the internal
reference frequency (TCXO). The frequency counter has a resolution of 0.1 Hz and
therefore provides far more accurate results. Despite the accuracy, the measurement
is still fast (because of a special algorithm for the I/Q baseband signal).
The frequency counter only gives completely accurate readings for sine signals that
are at least 20 dB above the noise floor. If the S/N ratio is less, noise affects the
results.
► Press the MARKER key.
► Press the "Marker Function"
softkey.
► Select the "Frequency Count"
menu item
The R&S FSH displays the
counted marker. If the frequency
counter is on, the marker symbol
changes from M1 to C.
The resolution with which the frequency is measured depends on your selection.
► Select the desired frequency resolution with “Frequency Count Resolution” menu
item. “Low” has a resolution of 0.1 Hz, “High” a resolution of 0.1 mHz.
Precision Frequency Reference
For even more precise measurements with the frequency counter, you can use the
R&S FSH-Z114 Precision Frequency Reference (order no. 1304.5935.02).
For more information refer to the documentation available for the R&S FSH-Z114.
Measuring the Signal Bandwidth
The "n dB Down" marker function places two temporary markers to the left and to the
right of the reference marker and measures the bandwidth between the two temporary
markers. The function therefore is a good way to measure the bandwidth of a signal or
the bandwidth of a filter, for example. The temporary markers are represented as two
vertical lines.
The distance to the reference marker is by default 3 dB below the reference marker.
You can also adjust this value manually. Entering a positive value sets the temporary
markers below the reference marker. If it is, for any reason, not possible to calculate
the frequency spacing, dashes are displayed instead of a value.
Upon entering a negative value, the function turns into a n dB up function. You can use
a n dB up function, for example, for measurements on notch filters.
► Press the MARKER key.
► Press the "Marker Function" softkey.
► Select the "n dB Down" menu item

R&S FSH Spectrum Analyzer Mode
Configuring Spectrum Measurements
Operating Manual 1173.6275.12 - 31 125
The R&S FSH displays two temporary markers on the left and on the right of the
reference marker M1. It also shows the bandwidth between the n dB down
markers.
You can then adjust the distance of the temporary markers.
► Press the "Marker Function"
softkey.
► Select the "n dB Down" menu item
The R&S FSH opens an input field
► Enter a different distance (in this
case 6 dB).
The R&S FSH again shows the
temporary markers, this time with
a broader bandwidth.
Demodulating Signals
The R&S FSH features an AM and FM demodulator to demodulate and monitor audio
signals. It demodulates the signal at the marker frequency.
You can listen to the demodulated signal with the internal speaker or headphones that
you can connect to the 3.5 mm headphone jack on the top of the R&S FSH.
When demodulating an AM modulated signal, the R&S FSH turns the video voltage
into an audible sound. You should therefore set the reference level to about the level of
the signal that you are demodulating.
If you perform measurements in the time domain, the R&S FSH demodulates
continuously. In the frequency domain, you can define a time period the R&S FSH
demodulates the signal at the marker frequency. The frequency sweep then stops at
the marker frequency for that time before finishing the sweep.
► Press the MARKER key.
► Press the "Marker Function" softkey.
► Select the demodulation scheme you require from the menu.
The R&S FSH starts to demodulate the signal.
Demodulating signals
If you turn on the demodulator, the R&S FSH automatically turns off the noise marker
or the frequency counter.

R&S FSH Spectrum Analyzer Mode
Configuring Spectrum Measurements
Operating Manual 1173.6275.12 - 31 126
Defining the demodulation time period
► Press the MARKER key.
► Press the "Marker Function" softkey.
► Select the "Time…" menu item.
The R&S FSH opens an input field to define the demodulation time.
► Enter the demodulation time you need.
The range is from 100 ms to 500 s. In time domain the R&S FSH demodulates
continuously, i.e. the demodulation time is not relevant.
Controlling the volume
► Press the MARKER key.
► Press the "Marker Function" softkey.
► Select the "Volume…" menu item.
The R&S FSH opens an input field to define the demodulation volume.
► Enter the volume you are comfortable with.
The demodulation volume is a percentage (0 % to 100 %) with 100 % being full
volume.
For more information on general volume control see the Quick Start Guide.

R&S FSH Spectrum Analyzer Mode
Configuring Spectrum Measurements
Operating Manual 1173.6275.12 - 31 127
3.2.7 Using Display Lines
Like markers, display lines help you to determine the level of the signal.
A display line is a straight line that runs horizontally and corresponds to a certain level
value. You can move the display line to each pixel in the display. This means that the
accuracy and exact vertical position of the display line depends on the resolution of the
vertical axis. With a display range of 100 dB, for example, each pixel corresponds to
0.3 dB. In that case, the accuracy of the display line is 0.3 dB. If you enter a value with
a higher resolution, the R&S FSH rounds that value.
You can also move the display line with the rotary knob or the cursor keys. The step
size for movement with the rotary knob is one pixel. The step size for the cursor keys is
10 % of the display range.
► Press the LINES key.
► Press the "Display Line" softkey.
The R&S FSH displays the display line as a blue horizontal line. It shows the
vertical position of the line in a table above the diagram area.
When you activate the display line, the R&S FSH also opens an input field to
define the vertical position of the line.
► Enter the level value you need.
The R&S FSH positions the display line accordingly.
Alternatively you can also move the display line with the rotary knob or the cursor
keys.
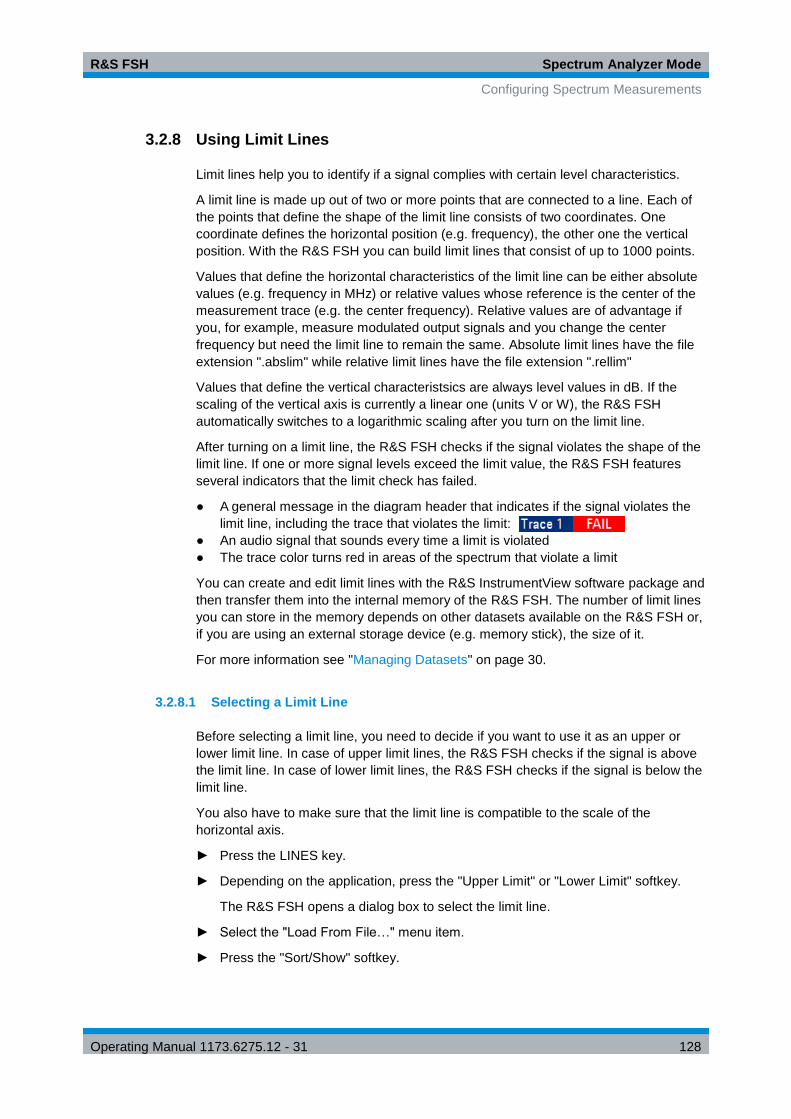
R&S FSH Spectrum Analyzer Mode
Configuring Spectrum Measurements
Operating Manual 1173.6275.12 - 31 128
3.2.8 Using Limit Lines
Limit lines help you to identify if a signal complies with certain level characteristics.
A limit line is made up out of two or more points that are connected to a line. Each of
the points that define the shape of the limit line consists of two coordinates. One
coordinate defines the horizontal position (e.g. frequency), the other one the vertical
position. With the R&S FSH you can build limit lines that consist of up to 1000 points.
Values that define the horizontal characteristics of the limit line can be either absolute
values (e.g. frequency in MHz) or relative values whose reference is the center of the
measurement trace (e.g. the center frequency). Relative values are of advantage if
you, for example, measure modulated output signals and you change the center
frequency but need the limit line to remain the same. Absolute limit lines have the file
extension ".abslim" while relative limit lines have the file extension ".rellim"
Values that define the vertical characteristsics are always level values in dB. If the
scaling of the vertical axis is currently a linear one (units V or W), the R&S FSH
automatically switches to a logarithmic scaling after you turn on the limit line.
After turning on a limit line, the R&S FSH checks if the signal violates the shape of the
limit line. If one or more signal levels exceed the limit value, the R&S FSH features
several indicators that the limit check has failed.
● A general message in the diagram header that indicates if the signal violates the
limit line, including the trace that violates the limit:
● An audio signal that sounds every time a limit is violated
● The trace color turns red in areas of the spectrum that violate a limit
You can create and edit limit lines with the R&S InstrumentView software package and
then transfer them into the internal memory of the R&S FSH. The number of limit lines
you can store in the memory depends on other datasets available on the R&S FSH or,
if you are using an external storage device (e.g. memory stick), the size of it.
For more information see "Managing Datasets" on page 30.
3.2.8.1 Selecting a Limit Line
Before selecting a limit line, you need to decide if you want to use it as an upper or
lower limit line. In case of upper limit lines, the R&S FSH checks if the signal is above
the limit line. In case of lower limit lines, the R&S FSH checks if the signal is below the
limit line.
You also have to make sure that the limit line is compatible to the scale of the
horizontal axis.
► Press the LINES key.
► Depending on the application, press the "Upper Limit" or "Lower Limit" softkey.
The R&S FSH opens a dialog box to select the limit line.
► Select the "Load From File…" menu item.
► Press the "Sort/Show" softkey.

R&S FSH Spectrum Analyzer Mode
Configuring Spectrum Measurements
Operating Manual 1173.6275.12 - 31 129
► Select the "Show Compatible" menu item.
The R&S FSH shows all limit lines that are compatible to the current settings.
► Select one of the available limit lines.
► Press the "Select" softkey.
The R&S FSH activates the limit line. In the diagram, the limit line is displayed as a
red line.
If you have already selected a limit line, you can turn the limit line on and off with
the "Limits On/Off" softkey.
Alternatively, you can define a threshold that works like a limit line. A threshold is a
simple horizontal limit line.
► Press the "Upper Limit" or "Lower Limit" softkey.
► Select the "Threshold" menu item.
The R&S FSH opens a input field to define the threshold.
► Enter the threshold you need.
The R&S FSH displays the line and performs a limit check for that threshold.
Threshold line and display line
Like the display line, a threshold line is a straight horizontal line. The difference is that
the R&S FSH performs a limit check for threshold lines, but not for display lines.
A failed limit check may be an issue if you want to create a measurement report,
because measurements with failed limits are not included in this report.
Using a display line, you can use a line and are able to create a measurement report at
the same time, regardless if any limits have been violated or not.
The process of turning off a limit line completely is similar to that of selecting a line.
► Press the "Upper Limit" or "Lower Limit" softkey
► Select the "Unselect Limit" menu item.
The R&S FSH deactivates the limit line.
3.2.8.2 Performing Limit Checks
If limit lines are active, the R&S FSH automatically checks the trace for limit violations
after each frequency sweep. As long as the signal does not violate the limit line, the
R&S FSH shows a "Pass" message in the measurement diagram. As soon as one
single value (i.e. one pixel) is outside of the limits, the R&S FSH displays a "Fail"
message in the diagram area and, in addition, sounds a beep.
A limit checks relates only to the frequency range defined by the limit line, not the
span.
R&S FSH Spectrum Analyzer Mode
Configuring Spectrum Measurements
Operating Manual 1173.6275.12 - 31 130
Audio signal
You can turn the acoustic signal that sounds in case of a limit violation on and off.
► Press the "Options" softkey.
► Select the "Audio Beep" menu item.
An [X] in front of the "Audio Beep" menu item indicates that the beeper is active. If
the audio beep is active, the R&S FSH beeps each time a limit is violated.
Limit violation
Note that a limit check fails only if the signal exceeds the limit line.
If the signal level is the same as the limit value, the limit check passes.

R&S FSH Spectrum Analyzer Mode
Working with Channel Tables
Operating Manual 1173.6275.12 - 31 131
3.3 Working with Channel Tables
Almost all transmission systems divide their assigned frequency ranges into channels.
Each channel corresponds to a specific frequency. To keep the handling of such
systems simple, you can use channel tables instead of entering frequencies manually.
The R&S FSH already comes with an assortment of channel tables that you can use
without doing anything. If you want to test transmission standards that are not listed,
you can also build channel tables manually with the "Channel Table Editor" of the
R&S InstrumentView software package that is delivered with the R&S FSH. To use one
of those, you just have to copy the channel table to the R&S FSH.
For more information see "Managing Datasets" on page 30.
Selecting a channel table
► Press the FREQ key.
► Press the "Frequency Mode" softkey.
► Select the "Channel" menu item.
The R&S FSH opens a dialog box to select a channel table.
► Select one of the available channel tables.
After activating the channel table, the R&S FSH is set up according to the
information contained in the channel table. Instead of a center frequency, the
R&S FSH shows the currently active channel number including the name of the
channel. The center frequency of a channel is defined in the channel table and is
the frequency corresponding to the selected channel.
Selecting a channel
Entering a center, start or stop frequency is not possible anymore. Instead you select a
channel. The R&S FSH then adjusts the center, start and stop frequency according to
the channel table.
► Press the FREQ key.
► Press the "Center Frequency" softkey.
The R&S FSH opens an input field to select the channel.
► Enter the channel you want to perform measurements on.
The R&S FSH changes the channel according to the channel table.
Channel numbers are assigned to frequencies as follows:
- The first channel is assigned a channel number and a frequency.
- All subsequent channels have ascending numbers.
- The frequency spacing between channels is fixed. It can also be negative, i.e.
the center frequency of the R&S FSH decreases with ascending channel
number.
- In transmission systems containing gaps in the frequency range (as in the case
of television, for example), a channel table can comprise multiple ranges.

R&S FSH Spectrum Analyzer Mode
Using Transducer Factors
Operating Manual 1173.6275.12 - 31 132
3.4 Using Transducer Factors
The frequency-dependent transducer factor of transducers and antennas can be
directly considered in the measurement result. A transducer factor consists of a
numeric value and a unit. The R&S FSH corrects the level values of the trace by the
values of the transducer. At the same time, the unit of the transducer is assigned to the
level axis. When field-strength measurements are performed with the aid of antennas,
for instance, the electrical field strength is directly indicated in dBµV/m on the
R&S FSH. A transducer factor can also be used to correct a frequency-dependent
attenuation, e.g. of a cable between DUT and RF input of the R&S FSH.
You can create and edit transducer factor with the R&S InstrumentView software
package and then transfer them into the internal memory of the R&S FSH. Each
transducer factor may consist of up to 1000 reference values.
For more information see "Managing Datasets" on page 30.
Interpolation between the values is performed with the aid of a modified spline
algorithm. Even if only relatively few values such as maxima, minima and turning
points are available, this algorithm can easily simulate the correction factors of
common transducers. Two transducers can be switched on at a time. The second
transducer must be assigned the unit dB. The R&S FSH adds the two transducers to a
total transducer.
Units supported for transducer factors:
● dB
● dBµV/m
● dBµA/m
● W/m2
The unit dB does not change the unit set on the R&S FSH. It can be used, for instance,
to compensate for frequency-dependent loss and gain at the input of the R&S FSH.
The units dBµV/m and dBµA/m convert the output power of an antenna into electric or
magnetic field strength. The unit W/m2 is used to calculate and display the power flux
density.
For example, to compensate for the cable loss between the transducer and the RF
input, the R&S FSH can use two transducers at the same time. One of them must have
the unit dB, however, i.e. it must correspond to one loss or gain value.
► Press the AMPT key.
► Press the "Transducer" softkey.
Transducer factor availability
Transducer factors are not available for measurements with the tracking generator or
the Power Sensors. The "Transducer" softkey is therefore inactive.
You can select two transducer factors, a primary transducer and a secondary
transducer. If a transducer factor is active, the menu item has an [X] in front of it.

R&S FSH Spectrum Analyzer Mode
Using Transducer Factors
Operating Manual 1173.6275.12 - 31 133
► Select the "Select Primary Transducer" menu item.
The R&S FSH opens a dialog box to select the transducer factor.
► Select the transducer factor you need.
► Confirm the selection with the "Select" softkey.
The R&S FSH shows the name of the active transducer on the display.
An example would be the transducer factor of the R&S HL223 antenna that is defined
between 200 MHz and 1300 MHz. The R&S FSH therefore displays the noise in this
frequency range as a function of frequency incremented by the transducer factor.
Outside the transducer range, the R&S FSH sets the transducer factor at zero, i.e.
measurements in this range do not yield conclusive results.
You can select a second transducer factor with the "Select Secondary Transducer"
menu item. The secondary transducer factor in that case is added to the first. The unit
of the second transducer factor must always be the relative unit dB as otherwise an
addition would not be useful. When you select a secondary transducer factor, the
dialog box shows only those transducer factors that have dB as their unit.
3.4.1 Unit for Measurements with Transducers
If the unit of the transducer is dB, the units dBm, dBmV or dBµV remain unchanged.
The linear units Volt and Watt are not permissible. They are deactivated in the units
menu.
If the unit of the transducer is dBµV/m or dBµA/m, this unit is also used for the
R&S FSH level display. This means that both the level axis of the diagram and the
level at the marker position are assigned the unit of the transducer. If dBµV/m is
selected as the transducer unit, a switch to absolute level indication in V/m is possible.
► Press the AMPT key.
► Press the "Unit" softkey.
► Select the V(olt) menu item.
If you are using a transducer with the unit dBµA/m, it is not possible to select another unit. Level indication is entirely in dBµA/m.
3.4.2 Setting the Reference Level
The transducer shifts the trace by its value as a function of frequency. Positive
transducer values increase the level, negative values reduce it. To ensure that the
trace is always within the diagram, the R&S FSH adjusts the reference level
accordingly. The reference level is shifted by the maximum transducer value in the
positive or negative direction.
R&S FSH Spectrum Analyzer Mode
Using Transducer Factors
Operating Manual 1173.6275.12 - 31 134
3.4.3 Frequency Range of Transducer
If the set frequency range is wider than the span in which a transducer is defined, the
R&S FSH assumes the transducer values outside the defined range to be zero.
3.4.4 Data Sets Containing Transducer Factors
The R&S FSH stores data sets together with any transducer factors that may have
been active for the measurement in question. When such a dataset is recalled, the
associated transducer factor(s) are switched on as well. Transducer factors recalled as
part of a data set do however not appear in the list of transducer factors.

R&S FSH Power Meter
Using a Power Sensor
Operating Manual 1173.6275.12 - 31 135
4 Power Meter
For highly accurate power measurements, you can connect a power sensor to the
R&S FSH and perform measurements.
4.1 Using a Power Sensor
The power sensor function turns the R&S FSH into a wideband power meter. It then
always measures the power of the whole signal in the frequency range of the power
sensor. In most cases the signal shape has no effect on the measurement.
► Press the MODE key.
► Press the "Power Meter" softkey
The R&S FSH activates the mode for power measurements.
Screen layout of the power meter mode
1 Connected power sensor model
2 Reference for relative power measurements
3 Power offset
4 Measurement time
5 Readout of the measured power
6 Analog readout of the measured power
7 Measurement frequency
8 Power sensor softkey menu
A power sensor measures the power in the frequency range defined in the data sheet
of the power sensor. This means that you can measure both sine signals and
modulated signals precisely over a large dynamic range.
For a complete list of supported power sensors, refer to the data sheet.

R&S FSH Power Meter
Using a Power Sensor
Operating Manual 1173.6275.12 - 31 136
If you are using one of the NRP power sensors you also need a passive USB adapter
(R&S NRP-Z4) to connect the power sensor to the R&S FSH.
For more information on the characteristics of the supported power sensors see
● the datasheet of the R&S FSH
● the website for R&S power sensors
http://www2.rohde-schwarz.com/en/products/test_and_measurement/power_volt_meter/NRPZ.html

R&S FSH Power Meter
Using a Power Sensor
Operating Manual 1173.6275.12 - 31 137
4.1.1 Connecting a Power Sensor
The R&S FSH controls and powers the power sensors via a special interface on the
top of the instrument. You can also connect a power sensor via the USB interface on
the right.
If you are using the R&S FSH-Z1 and -Z18 power sensors, connect the power sensor
cable to the power sensor interface and screw it into position. Power sensors of the
R&S NRP product line are controlled via the USB interface with a passive USB
adapter.
After connecting the power sensor to the R&S FSH, you can connect the DUT to the N-
connector of the power sensor.
Risk of damage to the power sensor
Before you start to work with the power sensor, make sure that the continuous power
applied to the input of the power sensor does not exceed a certain level.
Refer to the documentation of the power sensor for more information on the maximum
input power.
If the R&S FSH recognizes a power sensor, it sets up a connection via the interface
and after a few seconds shows the measured power. It displays the type of the power
sensor in the display header.
If no power sensor has been connected or it is not connected appropriately, the
R&S FSH shows nothing.
If there are communication problems between the R&S FSH and the power sensor, the
R&S FSH displays one of the following error messages that indicate the possible
cause.
Message Cause Remedy
Error in zeroing: signal at sensor A signal was present at the power sensor
when zeroing was performed.
Unscrew the power sensor from the device
under test and repeat zeroing.
Warning: Input overloaded The power at the input of the power sensor
exceeds the permitted power (23 dBm =
200 mW).
Reduce the power at the sensor input.
Power sensor hardware error Communication error between the R&S FSH
and the power sensor.
Unscrew the sensor from the R&S FSH and
check the connectors.
If the problem persists, contact a Rohde &
Schwarz service center.
Power sensor error The power sensor signals an error to the
R&S FSH.
Contact a Rohde & Schwarz service center.
Unknown power sensor model
connected
TheR&S FSH cannot identify the device
connected to the power sensor interface.

R&S FSH Power Meter
Using a Power Sensor
Operating Manual 1173.6275.12 - 31 138
4.1.2 Performing and Configuring Measurements
After you have connected a power sensor, the R&S FSH immediately starts to
measure the signal power.
Defining the center frequency
Power sensors have a memory containing correction values that are dependent on the
frequency. Hence, measurement results are the most accurate for signals whose
frequency you know.
Note that the R&S FSH maintains the center frequency that you have set in another
operating mode. In that case it uses that frequency as the power sensor frequency.
If you want to perform measurements on another known signal, you can change the
power sensor frequency manually.
► Press the MEAS key
► Press the "Freq" softkey.
An input field to define the frequency opens.
► Enter the frequency of the signal.
The R&S FSH transfers the new frequency to the power sensor which then
corrects the measured power readings.
Zeroing the power sensor
Offset voltages and currents have most effect on the power readout when measuring
low powers. You can compensate for these offsets by zeroing the power sensor.
Do not apply power during the zeroing process, as the power sensor cannot distinguish
between external powers and internal offsets.
► Press the "Zero" softkey.
The R&S FSH asks you not to apply
any signals to the power sensor during
the zeroing process.
► Disconnect the power sensor from any signal sources.
► Press the "Continue" softkey to start zeroing.
► Press "Cancel" to abort zeroing, for example, if you cannot disconnect the signal
source.
The R&S FSH immediately starts power sensor zeroing.
While zeroing is in progress, the
R&S FSH shows the message
“Zeroing power sensor, please
wait..”.
When zeroing is over, the R&S FSH shows the message
and switches back to the softkey menu for the power sensor.

R&S FSH Power Meter
Using a Power Sensor
Operating Manual 1173.6275.12 - 31 139
Selecting the unit for the power readout
The R&S FSH can display measured power in relative units (dBm) or in absolute units
(W, mW, µW, nW and pW). It is also possible to set a reference level in dB.
► Press the "Unit" softkey.
A submenu to select the unit opens.
► Select the unit you want.
The R&S FSH adjusts the result display accordingly.
Setting the reference level
If you have selected the unit dB Rel, the R&S FSH opens an input field to set the
reference level. The R&S FSH shows the currently set reference level in the diagram
header.
► Enter the reference level you want.
Alternatively, you can set the current level readout as the reference level.
► Press the "Ref" softkey.
The R&S FSH sets the current result as the reference level.
It then displays the measured level relative to the reference level in dB. The unit is
automatically set to dB Rel...
Setting the averaging time
The averaging time determines the length of the measurement. The longer the
averaging time, the more stable the display, particularly if signals have low power or
are noisy.
The averaging time is either "Short", "Normal" or "Long".
● A short measurement time provides stable and accurate results for stationary sine
signals with high levels (> -40 dBm). It is also appropriate for measurements that
require a high repition rate.
● A normal measurement time increases the stability of results for signals with low
levels or modulated signals.
● A long measurement time is appropriate for signals with very low power levels
(< -50 dBm)
To eliminate noise and the effects of noise on the measurement effectively, use the
R&S FSH-Z1 power sensor.
► Press the "Meas Time" softkey.
► Select the measurement time most suitable for your test setup.

R&S FSH Power Meter
Using a Power Sensor
Operating Manual 1173.6275.12 - 31 140
Taking additional loss or gain into account
At high powers that cause the power sensor maximum input level to be exceeded or at
very low levels that are below the R&S FSH minimum sensitivity, the R&S FSH can
take additional loss or gain between the DUT and the power sensor into account.
These are defined in terms of an offset in dB relative to the measured level. A positive
offset corresponds to a loss and a negative offset to a gain.
The R&S FSH shows the current offset in the diagram header.
► Press the AMPT key.
► Press the "Ref Offset" softkey.
The value entry box for the reference offset opens.
► Enter the required offset.
The offset is taken into account in the power or level display.

R&S FSH Power Meter
Using a Directional Power Sensor
Operating Manual 1173.6275.12 - 31 141
4.2 Using a Directional Power Sensor
For power measurements in both directions (forward and reverse), you can connect
directional power sensors to the R&S FSH. The R&S FSH supports the following
directional power sensors:
● R&S FSH-Z14
● R&S FSH-Z44
With a directional power sensor, the R&S FSH measures the power of a signal from
source to load (forward power) and from load to source (reverse power). The ratio of
forward and reverse power is a measure of the load matching. The R&S FSH displays
the results as the return loss or the standing wave ratio.
► Press the MODE key.
► Press the "Power Meter" softkey
The R&S FSH activates the mode for power measurements.
Screen layout of the power meter mode with a directional power sensor
1 Connected power sensor model
2 Selected transmission standard
3 Reference for relative power measurements
4 Power offset
5 Readout of the forward power
6 Analog readout of the forward power
7 Readout of the matching value
8 Analog readout of the matching value
9 Measurement frequency
10 Directional power sensor softkey menu

R&S FSH Power Meter
Using a Directional Power Sensor
Operating Manual 1173.6275.12 - 31 142
4.2.1 Connecting a Directional Power Sensor
The R&S FSH controls and powers the directional power sensors via a special
interface on the top of the instrument.
Connect the power sensor cable to the power sensor interface and screw it into
position. The power sensor itself is located between the source and the load of the test
setup. The figure below shows the way a test setup would look like.
The power sensors for the R&S FSH have an assymetrical design. Hence, you have to
insert them into the test setup in such a way that the "Forward" arrow (12) on the
sensor points toward the load (= in the direction of the power flux).
If the R&S FSH recognizes a power sensor, it sets up a connection via the interface
and after a few seconds shows the results. It displays the type of the power sensor in
the display header. If an error occurs, the R&S FSH shows a corresponding message.
For more information, see "Connecting a Power Sensor".
1 Directional Power Sensor R&S FSH-Z14 or -Z44
2 Source
3 Load
4 Power sensor jack

R&S FSH Power Meter
Using a Directional Power Sensor
Operating Manual 1173.6275.12 - 31 143
4.2.2 Performing and Configuring Measurements
After you have connected a power sensor, the R&S FSH immediately starts to
measure the signal power.
When measuring high powers, pay strict attention to the following instructions to avoid
personal injury and to prevent the power sensor from being destroyed
Risk of skin burns and / or damage to the R&S FSH
Measuring high powers may lead to skin burns and / or damage to the R&S FSH. You
can avoid it by:
● Never exceeding the permissible continuous power. The permissible continuous
power is indicated on a diagram on the back of the power sensor.
● Turning off the the RF power when connecting the power sensor.
● Connecting the RF connectors tightly.
Defining the center frequency
To get the most accurate results, you should synchronize the frequency to that of the
signal.
Note that the R&S FSH maintains the center frequency that you have set in another
operating mode. In that case it uses that frequency as the power sensor frequency.
If you want to perform measurements on another known signal, you can change the
power sensor frequency manually.
► Press the MEAS key
► Press the "Freq" softkey.
An input field to define the frequency opens.
► Enter the frequency of the signal.
The R&S FSH transfers the new frequency to the power sensor which then
corrects the measured power readings.
Zeroing the power sensor
For more information see "Zeroing the power sensor".

R&S FSH Power Meter
Using a Directional Power Sensor
Operating Manual 1173.6275.12 - 31 144
Setting the power measurement weighting mode
For forward power display, the R&S FSH provides both average power and peak
envelope power.
► Press the MEAS key.
► Press the "Fwrd Pwr Display" softkey.
► Select the weighting mode you require.
The R&S FSH indicates the weighting mode at the Forward Power heading.
- Forward power (AVG) = average power
- Forward power (PEP) = peak envelope power
Selecting the unit for the power readout
When using a directional power sensor, the R&S FSH displays the forward power as a
logarithmic level value in dBm (relative value) or as a linear value in W or mW
(absolute value). In addition you can define a reference level relative to which the
R&S FSH indicates the level difference in dB. Load matching is indicated as return loss
in dB or as voltage standing wave ratio (VSWR). In addition, the absolutely reflected
power can be displayed in W, or the reflected level in dBm.
For more information see "Selecting the unit for the power readout".
Setting the reference level
If you have selected the unit dB Rel for the forward power, the R&S FSH opens an
input field to set the reference level. The R&S FSH shows the currently set reference
level in the diagram header.
For more information see "Setting the reference level".
Selecting a standard
To ensure that true results are output when measuring modulated signals, the
R&S FSH offers the possibility of taking correction values into account for a number of
common telecommunications standards.
► Press the "Standard" softkey.
A menu to select a standard opens.
► Select the required standard.
The R&S FSH takes the selected standard into account. The currently active
standard is displayed in the display header.

R&S FSH Power Meter
Using a Directional Power Sensor
Operating Manual 1173.6275.12 - 31 145
Taking additional attenuation into account
When the directional power sensor is connected to a test point not directly but via a
cable, the influence of cable attenuation can be taken into account. For this purpose,
the cable attenuation for the measurement frequency in question is to be entered, i.e.
as a positive dB value if the power and matching are to be measured at the source and
the cable is connected between the source and the power sensor, and as a negative
dB value if the power and matching are to be measured at the load and the cable is
connected between the load and the power sensor. The directional power sensor then
corrects the power and matching values to produce the results that would have been
obtained if it had been directly connected to the test point.
► Press the AMPT key.
► Press the "Ref Offset" softkey.
The input field to enter the reference offset opens.
► Enter the offset you need.
The selected offset is displayed in the diagram header and is taken into account in
the power (level) and matching results.
If high powers are applied that exceed the maximum input level of the R&S FSH-Z14
or R&S FSH-Z44, a directional coupler or an attenuator has to be connected ahead of
the power sensor. In such cases, the coupling attenuation of the directional coupler or
the attenuation value of the attenuator are to be entered as positive dB values (see
above) into the R&S FSH to ensure true measured power readout. In both cases, a
termination or an attenuator of sufficient power-handling capacity has to be connected
to the power sensor at the load end. The matching readout is irrelevant in such case
since it is likewise corrected by taking into account the attenuation value of the
termination or attenuator.

R&S FSH Power Meter
Using the Internal Power Meter
Operating Manual 1173.6275.12 - 31 146
4.3 Using the Internal Power Meter
The R&S FSH also supports power measurements without using a power sensor. In
that case, you can connect the DUT directly to the R&S FSH and still perform accurate
channel power measurements.
The screen layout is the same as is described in "Using a Power Sensor" on page 135.
Performing and configuring channel power measurements
The configuration of channel power measurements without a power sensor is similar to
measurements with a power meter.
The following features are available:
● Defining the frequency
● Zeroing the measurement
● Selecting the unit
● Defining the reference level
● Taking additional loss or gain into account
For more information see "Performing and Configuring Measurements" on page 138.
Defining the channel bandwidth
In addition, you can select the channel bandwidth.
► Press the MEAS key.
► Press the "Channel BW" softkey.
The R&S FSH opens an input field.
► Enter the required channel bandwidth.
The R&S FSH performs a measurement on the selected channel. Note that it is not
possible to change the measurement time, resolution bandwidth and frequency span.

R&S FSH Power Meter
Performing Pulse Power Measurements (R&S FSH-K29)
Operating Manual 1173.6275.12 - 31 147
4.4 Performing Pulse Power Measurements (R&S FSH-
K29)
When you equip the R&S FSH with firmware option R&S FSH-K29, and connect one of
the wideband power sensors available from Rohde & Schwarz (R&S NRP-Z81, -Z85 or
-Z86), you can perform pulse power measurements with your R&S FSH.
Support of the application for R&S FSH models
For R&S FSH with a serial number <121000, it’s mandatory to use Y adapter cable
R&S FSH-Z129 (order no. 1304.5887.00).
Make sure to connect this cable to the USB port and the AUX port on the left side of
the R&S FSH.
Like the normal power meter application, the pulse power application measures the
power of the whole signal in the frequency range of the (wideband) power sensor.
► Press the MODE key.
► Press the "Power Meter" softkey.
Connecting the power sensor
You can connect the wideband power sensors to the USB port of the R&S FSH. For
more information see "Connecting a Power Sensor" on page 137.
The measurement starts as soon as the power sensor is connected.
Numerical result display
► Press the MEAS key.
► Press the "Meas Mode" softkey.
► Select the "Average" menu item.
The layout and contents of the numerical result display are the same as those
described in chapter "Using a Power Sensor" on page 135.
Graphical result display (Power vs Time)
The graphical representation of the results is a special feature only available with the
firmware option R&S FSH-K29.
► Press the MEAS key.
► Press the "Meas mode" softkey.
► Select the "Power vs Time" menu item.

R&S FSH Power Meter
Performing Pulse Power Measurements (R&S FSH-K29)
Operating Manual 1173.6275.12 - 31 148
1 Connected power sensor model
2 Header table showing various hardware settings
3 Marker table
4 Numerical results showing the pulse characteristics
5 Diagram showing the pulse characteristics in a graphical format (trace display)
6 Measurement frequency
7 Scale of the x-axis
8 Softkey menu of thze pulse power measurement application
The following power characteristics are calculated and displayed as numerical values
(see also the figure below for a graphical representation of the parameters).

R&S FSH Power Meter
Performing Pulse Power Measurements (R&S FSH-K29)
Operating Manual 1173.6275.12 - 31 149
Pulse characteristic Description
Pulse Width
Time that the pulse remains at the top level ("ON").
This is the time between the first positive edge and the subsequent negative edge
of the pulse in seconds, where the edges occur at crossings of the mid threshold.
Pulse Period Time that is elapsing from the beginning of one pulse to the beginning of the next
pulse.
Pulse Off Time Time in the displayed trace that is not occupied by the pulse.
Rise Time
Time required for the pulse to transition from the base to the top level.
This is the difference between the time at which the pulse exceeds the lower and
upper thresholds.
Fall Time
Time required for the pulse to transition from the top to the base level.
This is the difference between the time at which the pulse drops below the upper
and lower
thresholds.
Duty Cycle Ratio of the "Pulse Width" to "Pulse Repetition Interval" expressed as a percentage
(requires at least two measured pulses).
Start Time Time offset, relative to the beginning of the trace (0 sec), where the pulse begins
(start of the rise time).
Stop Time Time offset, relative to the beginning of the trace (0 sec), where the pulse stops
(end of the fall time).
Pulse Top
Median pulse ON power.
The value of this parameter is used as a reference (100%) to determine other
parameter values such as the rising / falling thresholds.
Pulse Base
Median pulse OFF power.
The value of this parameter is used as a reference (0%) to determine other
parameter values such as the rising / falling thresholds.
Trace Avg Average power of the signal displayed in the diagram.
Trace Peak Maximum power of the signal displayed in the diagram.
Trace Min Minimum power of the signal displayed in the diagram.
Positive Overshoot Height of the local maximum after a rising edge, divided
by the pulse amplitude. The result is a percentage of the pulse amplitude.
Negative Overshoot Height of the local minimum after a rising edge, divided
by the pulse amplitude. The result is a percentage of the pulse amplitude.
4.4.1 Configuring the Numerical Result Display
The functions available for the numerical result display are the same as those available for normal power sensor measurements. For more information see "Performing and Configuring Measurements" on page 138.
R&S FSH Power Meter
Performing Pulse Power Measurements (R&S FSH-K29)
Operating Manual 1173.6275.12 - 31 150
4.4.2 Configuring the Power vs Time Result Display
The R&S FSH allows you to configure several aspects of the Power vs Time result
display and the way the pulse is measured.
4.4.2.1 Determining Pulse Characteristics
Selecting an algorithm for base and top power calculation
The R&S FSH provides several methods (or algorithms) to calculate the base and top
power of a pulse.
● "Histogram"
Calculates the top and base power of the pulse by analyzing the histogram of the
trace data. The level of the pulse top calculated by the mean value of all points
representing the pulse top. Similarly the level of the pulse base is calculated by the
points representing the pulse base.
This algorithm is recommended for analyzing most of the pulse signals
● "Integration"
Calculates the top power of the pulse by fitting a rectangle pulse of same energy
into the pulse signal as a reference.
This algorithm is recommended for modulated pulse signals or when the pulse
energy must be taken into account, for example when you want to compare the
measurement result with that of a thermal power sensor.
● "Peak"
Assumes that the peak power of the pulse is also the top level of the pulse.
The top and base power are also the reference point for the calculation of pulse timing
characteristics.
► Press the MEAS key.
► Press the "Algorithm" softkey.
► Select the algorithm you prefer for your measurement.
The R&S FSH adjusts the results accordingly.
Defining reference levels for pulse timing calculation
To calculate pulse timing parameters, like the rise and fall time of the pulse, you have
to define several reference levels. All reference levels are a percentage of the pulse
amplitude, either expressed in terms of power (Watt) or voltage (Volt).
The "Low Reference Power" and "High Reference Power" are required to calculate the
fall and rise times of the measured pulse. The "Low Reference Power" defines the
level at the start of the rising edge and the level at the end of the falling edge of the
pulse. The "High Reference Power" defines the level at end of the rising edge and the
level at the start of the falling edge.

R&S FSH Power Meter
Performing Pulse Power Measurements (R&S FSH-K29)
Operating Manual 1173.6275.12 - 31 151
The "Reference Power" is required to calculate the pulse width, its start time and its
stop time.
► Press the MEAS key.
► Press the "Ref Power Config" softkey.
► Define the reference levels as required.
You can always reset the reference levels to their default value with the "Set to
Default" menu item.
All the reference levels can be relative to the power or the voltage of the signal.
Depending on this selection, different measurement points are being analyzed, so the
results may be different.
► Press the MEAS key.
► Press the "Ref Power Config" softkey.
► Select either the "Power" or the "Voltage" menu item as the reference.
4.4.2.2 Selecting the Video Bandwidth
When you are using a wideband power sensor, you can change the video bandwidth
used for the measurement. The main effect of using a small video bandwidth is that it
reduces the displayed inherent noise.
Using a small video bandwidth thus increases the measurement sensitivity and allows
you to accurately determine the pulse peak power even for weak pulses. Reducing the
video bandwidth also increases the trigger sensitivity of the power sensor.
Note however that the video bandwidth should not be smaller than the RF bandwidth of
the measured signal. Otherwise, measurement results may become invalid.
4.4.2.3 Averaging Traces
Selecting the trace mode
The Power vs Time result display provides two trace modes.
● The "Clear / Write" mode overwrites the trace data after each measurement.
● The "Average" mode forms an average over several measurement and displays
the data according to the selected detector.
When you select this mode, you can define the number of measurements over
which the trace data is calculated.
► Press the TRACE key.
► Press the "Trace Mode" softkey.
► Select the trace mode you prefer for the measurement.

R&S FSH Power Meter
Performing Pulse Power Measurements (R&S FSH-K29)
Operating Manual 1173.6275.12 - 31 152
Selecting the detector
When you are averaging traces, you can also select a detector. The detector defines
the way the measured data is evaluated and which data is displayed.
In the Power vs Time result display, you can select the "Average" detector or the "Max
Peak" detector. The "Average" detector displays the averaged measurement data,
while the "Max Peak" detector displays the highest values that have been measured on
each pixel.
► Press the TRACE key.
► Press the "Detector" softkey.
► Select the detector you prefer.
4.4.2.4 Triggering Measurements
In its default state, the R&S FSH starts a measurement on completion of the previous
measurement ("Free Run" measurements).
However, you can also perform triggered measurements with the power sensor. When
you choose to do so, the trigger event (the moment when the actual measurement
starts) is either a rising slope in the signal or a falling slope ("Positive" or "Negative"
trigger).
► Press the SWEEP key.
► Press the "Trigger" softkey.
► Select either the "Positive" or "Negative" menu item.
The R&S FSH stops measuring the signal until a trigger event occurs.
In case of triggered measurements, you have to define a trigger level by which the
signal must rise or fall in order to be recognized.
► Press the SWEEP key.
► Press the "Trigger" softkey.
► Select the "Trigger Level" menu item and define a trigger level.
In addition, you can define a trigger delay time. The trigger delay time defines a time
that must pass after the trigger event has occurred before the measurement starts. A
negative trigger delay time is called a pretrigger.
► Press the SWEEP key.
► Press the "Trigger" softkey.
► Select the "Trigger Delay" menu item and define a delay time.
When a trigger event occurs, the R&S FSH takes the delay time into account when
drawing the trace.

R&S FSH Power Meter
Performing Pulse Power Measurements (R&S FSH-K29)
Operating Manual 1173.6275.12 - 31 153
4.4.2.5 Selecting the Result Unit
In the pulse measurement application, the R&S FSH can display measured power in
relative units (dBm) or in absolute units (W).
► Press the AMPT key.
► Press the "Unit" softkey.
► Select the unit you prefer.
The R&S FSH adjusts the y-axis accordingly.
4.4.2.6 Scaling the Y-Axis
The functionality to scale the y-axis is similar to that of the Spectrum application.
For more information see "Setting a Display Range" on page 100.
4.4.2.7 Using Markers
The Power vs Time diagram supports markers. The functionality is similar to that of the
Spectrum application.
For more information see "Using Markers" on page 118 (note that marker functions are
not available in the Power Meter mode).

R&S FSH Interference Analyzer (R&S FSH-K15/ -K16)
Performing Pulse Power Measurements (R&S FSH-K29)
Operating Manual 1173.6275.12 - 31 154
5 Interference Analyzer (R&S FSH-K15/ -K16)
In wireless systems, interference causes low data rates, dropped calls and poor voice
quality, often making it impossible to establish or maintain a connection.
Equipped with option R&S FSH-K15 (order no. 1309.7488.02), option R&S FSH-K16
(order no. 1309.7494.02) and / or R&S FSH-K17 (order no. 1304.5893.02), you can
track down the source of interferences with your R&S FSH. These options provide
tools and means to make the search for interferers as comfortable as possible.
To measure interferences, you'll also need a directional antenna like the R&S HL300
(order no. 4097.3005.02). For more information refer to the Quick Start Guide.
The interference analyzer provides several measurement modes.
► Press the MODE key.
► Press the "Receiver / Interferences" softkey.
Interference analyzer (R&S FSH-K15)
► Select the "Interference Analyzer" menu item.
The R&S FSH enters the interference analyzer.
For more information see "Measuring the Spectrum" on page 156.
Map mode
► Select the "Maps" menu item.
The R&S FSH enters the map application.
Triangulation (R&S FSH-K15)
► Press the MEAS key.
► Press the "Meas Mode" softkey.
► Select the "Triangulation" menu item.
The R&S FSH provides the triangulation measurement functions.
For more information see "Working with Maps" on page 158.
Geotagging (R&S FSH-K16)
► Press the MEAS key.
► Press the "Meas Mode" softkey.
► Select the "Geotagging" menu item.
The R&S FSH provides the geotagging measurement functions.
For more information see "Working with Maps" on page 158.

R&S FSH Interference Analyzer (R&S FSH-K15/ -K16)
Performing Pulse Power Measurements (R&S FSH-K29)
Operating Manual 1173.6275.12 - 31 155
Indoor Mapping (R&S FSH-K17)
► Press the MEAS key.
► Press the "Meas Mode" softkey.
► Select the "Indoor Mapping" menu item.
The R&S FSH provides the geotagging measurement functions.
For more information see "Working with Maps" on page 158.

R&S FSH Interference Analyzer (R&S FSH-K15/ -K16)
Measuring the Spectrum
Operating Manual 1173.6275.12 - 31 156
5.1 Measuring the Spectrum
Most spectrum measurements of the interference analyzer are also available in
Spectrum mode. Using these measurements allow you to locate interferences in the
frequency spectrum.
● "Measuring the Channel Power of Continuously Modulated Signals" on page 53
● "Measuring the Occupied Bandwidth" on page 57
● "Measuring the Adjacent Channel Leakage Ratio (ACLR)" on page 64
● "Working with the Spectrogram Result Display (R&S FSH-K14/ -K15)" on page 83
These measurements work the same and yield the same results as in Spectrum mode.
You can configure the measurements just as in Spectrum mode. For more information
see "Configuring Spectrum Measurements" on page 96.
In addition, the R&S FSH-K15 provides several dedicated measurements.
5.1.1 Measuring the Carrier-to-Noise Ratio
The Carrier-to-Noise (C/N) measurement is a tool to determine if a signal has sufficient
power compared to the spectrum surrounding it. In case of the carrier-to-noise
measurement, the R&S FSH determines the distance between the level of the carrier
and the lowest signal level that has been measured (usually the noise floor).
► Press the MEAS key.
► Press the "Meas Mode" softkey.
The R&S FSH opens the measurement menu.
► Select the "Carrier-to-Noise" menu item.
The R&S FSH starts to measure the carrier-to-noise ratio.
After you have started the measurement, the R&S FSH places two markers on the
trace. The first marker is placed on the peak power level. The R&S FSH assumes that
position as the level of the carrier. The second marker is positioned on the lowest level
that has been measured ("Min Peak").
Based on the markers, the R&S FSH then calculates the difference between the two
signal levels and returns the result as the "Carrier-to-Noise" ratio.
Optimizing the Settings
In order to get the best results, you can use the automatic adjustment routine that the
R&S FSH offers.
► Press the MEAS key.
► Press the "Adjust Settings" softkey.
The R&S FSH performs a sweep and repeats the peak search sequence for the
two markers.

R&S FSH Interference Analyzer (R&S FSH-K15/ -K16)
Measuring the Spectrum
Operating Manual 1173.6275.12 - 31 157
5.1.2 Measuring the Carrier-to-Interference Ratio
The Carrier-to-Interference (C/I) measurement is a tool to determine if a signal is
affected by interference from neighboring channels. In case of the carrier-to-
interference measurement, the R&S FSH determines the distance between the level of
the carrier and the second strongest level.
► Press the MEAS key.
► Press the "Meas Mode" softkey.
The R&S FSH opens the measurement menu.
► Select the "Carrier-to-Interference" menu item.
The R&S FSH starts to measure the carrier-to-noise ratio.
After you have started the measurement, the R&S FSH places two markers on the
trace. The first marker is placed on the peak power level. The R&S FSH assumes that
position as the level of the carrier. The second marker is positioned on the second
strongest level that has been measured ("Next Peak").
Based on the markers, the R&S FSH then calculates the difference between the two
signal levels and returns the result as the "Carrier-to-Interference" ratio.
Optimizing the Settings
In order to get the best results, you can use the automatic adjustment routine that the
R&S FSH offers.
► Press the MEAS key.
► Press the "Adjust Settings" softkey.
The R&S FSH performs a sweep and repeats the peak search sequence for the
5.1.3 Analyzing Interference Measurements
5.1.3.1 Trace Mathematics ("Diff Mode")
The Interference Analyzer provides a quick way to apply trace mathematics ("Trace -
Memory Trace") and thus a quick way to compare the current results with a previous
one.
► Press the MEAS key.
► Press the "Diff Mode" softkey.
When you turn on the "Diff Mode", the R&S FSH saves the current trace ("memory
trace") and will subtract this trace from the live traces resulting from future sweeps.
For more information on general trace mathematics supported by the R&S FSH see
"Using Trace Mathematics" on page 117.
Note that "Diff Mode" is only available in the Spectrum Overview result display of the
Interference Analyzer.

R&S FSH Interference Analyzer (R&S FSH-K15/ -K16)
Working with Maps
Operating Manual 1173.6275.12 - 31 158
5.2 Working with Maps
Options R&S FSH-K15 and -K16 allow you to work with maps, for example view and
save the position of measurements. With option R&S FSH-K15 you are also able to
determine the source of interference (through triangulation). The options also provide
several other tools that make it easier to locate interference.
To make full use of the functions available in map mode, you will need a GPS receiver
and an antenna (for example R&S HL300, which already contains a GPS receiver).
Option R&S FSH-K17 ("Indoor Maps") allows you to work with small scale maps (for
example floor plan). This option provides functionality to measure the signal strength
indoors using an antenna (for example R&S HL300).
5.2.1 Transferring Maps (R&S FSH-K15 and -K16)
Before you can use any features based on maps, you have to download and install the
maps on the R&S FSH. The R&S FSH supports the map material supplied by the
Open Street Maps project (http://www.openstreetmaps.org)
The easiest way for you to transfer the maps to the R&S FSH is to use the R&S Open
Street Map Wizard (OSM Wizard). The OSM Wizard is available for download on the
R&S FSH product homepage (http://www.rohde-schwarz.com/product/fsh.html).
The OSM wizard establishes a connection to the Open Street Maps database and thus
needs a connection to the internet. The tool allows you to select the area that you need
for your measurements and download the corresponding maps.
For more information on how to download and save maps refer to the documentation
of the OSM Wizard. The documentation is part of the software.

R&S FSH Interference Analyzer (R&S FSH-K15/ -K16)
Working with Maps
Operating Manual 1173.6275.12 - 31 159
5.2.2 Transferring Indoor Maps (R&S FSH-K17)
Before you can use the features of the indoor mapping application, you have to create
an indoor map (for example a floor plan). These maps are created with features
available in the R&S InstrumentView software package, and are based on an image of
the area you would like to measure. The image source can be one of the common file
formats (for example jpg, png or tif).
► Start the R&S InstrumentView software.
► Start the "Indoor Mapping" feature .
The R&S FSH opens the indoor map editor.
► Select the "Map Creator" tab in the map editor.
► Select the "Load New Map" button.
The R&S FSH opens a dialog box to select an image file.
Zooming in and out of the indoor map
You can zoom in and out of the indoor map using the mouse wheel.
► Select the image file of the area you want to measure.
If you have an image, but need only a small part of it, you have to edit it with an
image manipulation program before loading it into the R&S InstrumentView
software.
► Press the "Create New Map" button and select the folder to save the map data in.
The R&S FSH creates a map from the image you have uploaded.
When this is done, copy the folder containing the map data to an SD card and insert it
into the SD card slot of the R&S FSH (make sure that the folder is in the root directory
of the SD card, because otherwise the R&S FSH may not be able to find the map
data).
In addition to creating a map, you can also specify the exact geographic location of the
area you are measuring. To do so, you have to specify three GPS reference points of
the area. Enter the corresponding latitude and longitude data in the corresponding
fields available in the "Create Map" dialog box and move the three cross-hairs
displayed in the preview of the map to the corresponding locations.
When you are using this feature, the application provides some useful features:
● The map is automatically rotated in such a way that the north side faces up.
● The R&S FSH calculates and displays the distance between measurement points
(in meters or feet, depending on the regional settings).
● You are able to embed the collected data into maps with a larger scale. Thus you
are able to, for example, combine measurement data recorded with the
Geotagging application (outdoor map) and data recorded with the Indoor Maps
application in a single map. For more information about this see "Collecting
Measurement Data (R&S FSH-K17)" on page 173.

R&S FSH Interference Analyzer (R&S FSH-K15/ -K16)
Working with Maps
Operating Manual 1173.6275.12 - 31 160
5.2.3 Displaying Maps
After you have downloaded or created the maps you need, save them to an SD card,
which you can use with the R&S FSH.
► Enter the "Maps" or "Indoor Maps"
mode.
► Press the MEAS key.
► Press the "Map" softkey.
The R&S FSH opens a menu that
contains all maps that you have
stored on the SD card (the names
correspond to the folder names for
every area you have saved).
► Select the maps of the area you
need.
In the R&S FSH-K15 or -K16, the "Auto Select" menu item automatically selects
the map that is most fitting for your current location. Using the automatic selection
requires an GPS receiver.
In the R&S FSH-K17, the "Auto Select" menu item is only available if the R&S FSH
could not find any indoor maps.
Screen layout of the map display
The screen layout in "Maps" mode is variable. You can customize the screen contents
and add only information that you need.
► Press the "Settings" softkey.
The R&S FSH opens a menu that contains functions to configure the map display.
If no screen element has been selected, the R&S FSH shows the map only. The
following list contains all settings that define the screen contents.

R&S FSH Interference Analyzer (R&S FSH-K15/ -K16)
Working with Maps
Operating Manual 1173.6275.12 - 31 161
1 Current type of result display
2 Connected device: green color = GPS connection established, red color GPS connection not established
3 Hardware settings
4 GPS information, incl compass information, GPS connection quality and triangulation results (not in
R&S FSH-K17)
5 Power results (incl. the distance between measurement locations in the R&S FSH-K17)
6 Map area, including tags representing the measurement locations
7 Power bar including noise squelch level
8 Geotagging / Indoor Map softkey menu
Adding and removing elements
The result display is made up out of several elements that you can add or remove as
you like.
► Press the MEAS key.
► Press the "Settings" softkey.
► Select the element you want to add or remove.
- GPS receiver and antenna support
► Turn on with "Antenna", "Compass" or "GPS" menu item.
Supported by R&S FSH-K15 and -K16.
- Hardware settings
► Turn on with "Show Hardware Settings" menu item.
If on, the display contains the hardware settings.
- GPS and compass information
► Turn on with "Show GPS Information" or "Show Compass Information"
menu item.
If on, the display contains the GPS and compass information. The compass
information is available with the R&S HL300 antenna.
Supported by R&S FSH-K15 and -K16.
- Power results
► Turn on with "Show Power Results" menu item.
If on, the display contains the power results.
- Power bar
► Turn on with "Show Power Bar" menu item.
If on, the display contains the power bar.
In addition to the currently measured signal level, the power bar also shows
the squelch level for noise signals (vertical yellow line).
R&S FSH Interference Analyzer (R&S FSH-K15/ -K16)
Working with Maps
Operating Manual 1173.6275.12 - 31 162
5.2.3.1 Zooming in and out of the Map
If you have downloaded different zoom levels of your maps, or if you have created a
large (or very small) indoor map, you can change the scale of the map to get a more
detailed view or a more general overview.
Note that the original size of indoor maps depends on the size of the image these
maps are based on.
► Press the "Zoom In" softkey to decrease the scale of the map.
► Press the "Zoom Out" softkey to increase the scale of the map.
5.2.3.2 Aligning the Map (R&S FSH-K15 and -K16)
The R&S FSH provides several tools to align the map. This is useful if you want your
current location to be in the center of the display or if you have moved out of the visible
map area.
Manual alignment
► Use the cursor keys to move the map in a particular direction.
You can move the maps until you reach the borders of the downloaded content.
Note that the borders of the maps might be different for different scales.
Automatic alignment
For most automatic map alignment functions, you have to establish a GPS connection.
► Press the "GPS Position" softkey.
The R&S FSH opens a menu that contains various functions to control and work
with GPS data.
In this menu, you can select from the following automatic alignment functions.
● "Go To Current Position"
Moves your current position to the center of the display once.
● "[ ] Trace Current Position"
Keeps your current position in the center of the display, even if you move.
● "Go To Triangulation Position"
Moves the location of the triangulation result to the center of the display.
5.2.3.3 Aligning the Map (R&S FSH-K17)
The R&S FSH automatically aligns the map when you move the cross-hairs displayed
in the map. The cross-hairs represent your current position on the map.
Moving the cross-hairs is necessary to define another measurement location. This is
only possible by manually changing the position of the cross-hairs.

R&S FSH Interference Analyzer (R&S FSH-K15/ -K16)
Working with Maps
Operating Manual 1173.6275.12 - 31 163
Using the cursor keys
► Use the cursor keys to move your position in a particular direction.
You can move the cross-hairs representing your position until you reach the
borders of the indoor map.
When you are using the cursor keys to move the cross-hairs, you can also specify the
distance (pixels) the cross-hairs move on a single press of the cursor key.
► Press the "Settings" softkey.
► Select the "Cursor Sensitivity" menu item.
► Enter a number between 1 and 64 in the input field.
The number you enter corresponds to the number of pixels each movement of the
cross-hairs covers (for example "1" moves the cross-hairs one pixel in the selected
direction).
Using the rotary knob
Alternatively, you can move the cross-hairs with the rotary knob. However, if you are
using the rotary knob, you can only move the cross-hairs either sideways or vertically.
You have to select the direction of the rotary knob with the cursor keys. The cross-
hairs indicate the currently selected direction by little arrows.
● :Using the rotary knob moves the cross-hairs to the left or right.
● : Using the rotary knob moves the cross-hairs up or down.
The best way to use this functionality is to use the cursor keys for big steps and then
use the rotary knob for fine tuning of the cross-hair position.
5.2.3.4 Selecting Colors for Geotags and Measurement Locations
For more information on geotags (R&S FSH-K15 and -K16) in general see "Collecting
Geographic Data" on page 169.
For more information on measurement locations (R&S FSH-K17) in general see
"Collecting Measurement Data (R&S FSH-K17)" on page 173.
Default behavior of geotags (R&S FSH-K15 and -K16)
By default, all geotags (including all the labels associated with that geotag) have the
same color (black). Depending on the type of geotag, you can assign different colors to
the geotags.
Note that changing the color of a geotag in the interference analyzer (R&S FSH-K15)
also changes the color of the azimuth line.

R&S FSH Interference Analyzer (R&S FSH-K15/ -K16)
Working with Maps
Operating Manual 1173.6275.12 - 31 164
Default behavior of measurement locations (R&S FSH-K17)
Your current position is represented by a black cross-hairs. When you do a
measurement at that location, and save the results, a colored dot is added to the map.
The color represents the signal level at that location:
● Red dot: Signal recepetion is bad.
● Yellow dot: Signal reception is OK.
● Green dot: Signal reception is good.
Color of your current position (R&S FSH-K15 and -K16)
To emphasize your current position, you can define a different color to that geotag.
► Press the "Settings" softkey.
► Select the "Current Position Color" menu item.
The R&S FSH opens a submenu to select the color.
► Select one of the colors available in the submenu.
The R&S FSH applies the color as selected.
Color of previous positions (R&S FSH-K15)
In the Interference Analyzer (R&S FSH-K15), you can distinguish between your current
position and positions that you have visited (or saved) earlier.
► Press the "Settings" softkey.
► Select the "Saved Position Color" menu item.
The R&S FSH opens a submenu to select the color.
► Select one of the colors available in the submenu.
The R&S FSH applies the color as selected.
In addition to the geotag, you can also define a custom color for the triangulation
results. The R&S FSH displays triangulation results as circle with a dot in the middle.
By default, the circles and dot are blue. You can change the color of those as follows.
► Press the "Settings" softkey.
► Select the "Triangulation Color" menu item.
The R&S FSH opens a submenu to select the color.
► Select one of the colors available in the submenu.
The R&S FSH applies the color as selected.
Color of previous positions (R&S FSH-K16 and -K17)
In Geotagging mode (R&S FSH-K15) and Indoor Mapping mode (R&S FSH-K17), you
can distinguish between your current position and positions that you have visited (or
saved) earlier.

R&S FSH Interference Analyzer (R&S FSH-K15/ -K16)
Working with Maps
Operating Manual 1173.6275.12 - 31 165
The color a geotag (or measurement location) gets in this mode depends on the signal
strength that has been measured at the corresponding location. In addition to the color
itself, you can also define the signal levels associated with a particular color: a
separate color for "good" coverage, one for "average" coverage and one for "bad
coverage".
► Press the "Settings" softkey.
► Select the "Good Coverage Color", "Average Coverage Color" or "Bad Coverage
Color" menu item.
The R&S FSH opens a submenu to select the color.
► Select one of the colors available in the submenu.
The R&S FSH applies the color as selected.
The R&S FSH has default values that characterize "good", "average" and "bad"
coverage. If required, you can change the signal levels associated with these terms.
► Press the "Settings" softkey.
► Select the "Good Coverage Level", "Average Coverage Level" or "Bad Coverage
Level" menu item.
The R&S FSH opens an input field to define the signal level associated with the
coverage conditions.
Superimposed geotags
If one or more geotags superimpose each other, you can define rules which tag (or its
color) is actually displayed.
► Press the "Settings" softkey.
► Select the "Default Indicator" menu item.
The R&S FSH opens a submenu to select the tag that shall be displayed:
● Best: the tag with the best signal level is displayed.
● Average: the tag with the average level is displayed.
● Worst: the tag with the lowest signal level is displayed.

R&S FSH Interference Analyzer (R&S FSH-K15/ -K16)
Working with Maps
Operating Manual 1173.6275.12 - 31 166
5.2.4 Measuring Interference
Interference measurements usually require an antenna to locate the source of those
interferers. The R&S FSH supports several antenna models.
● R&S HL300
Connected to the R&S FSH at the AUX port and the RF input.
● R&S HE300
Connected to the R&S FSH at the power sensor jack and the RF input.
● R&S HE400
Connected to the R&S FSH at the power sensor jack and the RF input.
You can control the antenna functionality in several ways in the general setup of the
R&S FSH. For more information see the Quick Start Guide of the R&S FSH.
5.2.4.1 Selecting an Antenna Model
For easy access, the R&S FSH allows you to select the antenna model directly in the
interference analyzer or geotagging application.
► Press the "Settings" softkey.
► Select the "Antenna" menu item.
The R&S FSH opens a submenu to select or disable the antenna.
► Select the antenna type you are using or turn using the antenna off.
- Disabled
Disables the use of an antenna.
- HL300 Side
Selects the R&S HL300 antenna connected to the AUX port on the left side of
the R&S FSH.
- HE300 Top
Selects the R&S HE300 antenna connected to the power sensor jack on the
top of the R&S FSH.
- HE400 Top
Selects the R&S HE400 antenna connected to the power sensor jack on the
top of the R&S FSH.
The currently selected antenna model is displayed in the title bar. The color of the label
indicates the state of the satellite lock of the the GPS receiver of the antenna model.
For more information on the GPS receiver states see the Quick Start Guide.

R&S FSH Interference Analyzer (R&S FSH-K15/ -K16)
Working with Maps
Operating Manual 1173.6275.12 - 31 167
5.2.4.2 Using an Audio Signal to Locate Interferers
You can configure the R&S FSH to play back an audio signal when it receives a signal.
The audio signal changes its volume and frequency, depending on the strength of the
received signal.
► Press the "Settings" softkey.
► Select the "Tone [ ]" menu item.
The R&S FSH turns the audio signal on.
The R&S FSH allows you to define various aspects of this audio signal.
Defining a squelch level
The squelch level defines the signal level above which the audio signal starts to play.
The squelch level is variable.
► Press the "Settings" softkey.
► Select the "Squelch Level" menu item.
The R&S FSH opens an input field to define the squelch level.
► Enter a squelch level in dBm as required.
The R&S FSH displays the squelch level graphically in the power bar element of
the user interface.
Defining the threshold of the audio signal
The audio signal has a specific frequency that is coupled to a specific signal level, the
threshold. As the signal you are receiving during a measurement becomes stronger or
weaker, the audio signal changes its frequency:
● When the signal becomes stronger, the frequency of the audio signal gets higher
● When the signal becomes weaker, the frequency of the audio signal gets lower
You can define the threshold of the base tone as necessary.
► Press the "Settings" softkey.
► Select the "Tone Threshold" menu item.
The R&S FSH opens an input field to define the threshold.
► Enter a threshold level in dBm as required.
Note that it may be possible that the audio signal frequency becomes so high or low
that it is no longer audible.
R&S FSH Interference Analyzer (R&S FSH-K15/ -K16)
Working with Maps
Operating Manual 1173.6275.12 - 31 168
Defining the gain of the audio signal
The change of frequency of the audio signal is a constant change of frequency. It is
either one octave per 20 dB or one octave per 40 dB.
► Press the "Settings" softkey.
► Select the "Tone Gain" menu item.
The R&S FSH opens a submenu.
► Select the gain setting you prefer.
Defining the volume of the audio signal
The R&S FSH allows you to adjust the volume of the audio signal.
► Press the "Settings" softkey.
► Select the "Tone Volume" menu item.
The R&S FSH opens an input field to define the volume.
► Define a volume you are comfortable with.
The volume is a percentage from 0% to 100% with 100% being the loudest.
5.2.4.3 Using Limits
The R&S FSH allows you to define limits within which the signal level must be in order
to be recognized as a signal.
► Press the LINES key.
► Press the "Upper Limit" or "Lower Limit" softkey.
The R&S FSH opens an input field to define the limits: signals that are above the
upper limit are ignored as well as signals that are below the lower limit. Only the
signal with these boundaries are actually considered in the analysis.
The limits you have defined are displayed in the power bar as red triangles.

R&S FSH Interference Analyzer (R&S FSH-K15/ -K16)
Working with Maps
Operating Manual 1173.6275.12 - 31 169
5.2.5 Collecting Geographic Data (R&S FSH-K15 and -K16)
The main application of the "Maps" mode is to collect geographic data. The R&S FSH
provides two main applications, triangulation and geotagging.
5.2.5.1 Geotags
A geotag is a tag for a particular location that contains information about that location.
This information includes, for example, GPS coordinates, the time of the measurement
or level that has been measured. You can evaluate the geotag information directly on-
site or save the information for later evaluation.
With the geotagging functionality, you can mark locations where you have performed a
measurement. Thus, you are able to analyze the geographical distribution of the
received signal strength. This allows you to analyze, for example, the coverage
conditions around a base station's coverage area.
In the map display, a geotag is displayed as a dot with a number. Option R&S FSH-
K15 also shows a straight line. The straight line represents the direction you are facing.
You can create a geotag in several ways.
Creating geotags manually
You can create a geotag of your current position (which requires a GPS receiver) or
create a geotag of any other position that you would like to create.
► Press the "GPS Position" softkey.
► Select the "Save Current Position" menu item.
The R&S FSH creates a geotag of your current position. A geotag created this way
is based on the coordinates of the GPS receiver and includes the azimuth.
If required, you can assign a different azimuth for the GPS coordinates.
► Press the "GPS Position" softkey.
► Select the "Save Azimuth Only" menu item.
The R&S FSH opens an input field to change the azimuth (the GPS data itself is
not changed). Note that the azimuth line is updated in real time when you change
its angle.
Alternatively, create a geotag of an arbitrary location.
► Select the "Save Manual Position" menu item.
► Enter the GPS data and location information.
The R&S FSH creates a geotag with the geographic data you have entered.

R&S FSH Interference Analyzer (R&S FSH-K15/ -K16)
Working with Maps
Operating Manual 1173.6275.12 - 31 170
Creating geotags automatically
The R&S FSH is able to save geographic information automatically if you are using the
"Save on Event" functionality. For more information see "Saving Events" on page 22.
The R&S FSH adds all geotags that you create to the "GPS Position List".
If you are using the Geotagging application (R&S FSH-K16), you can turn on the "Save
on Event" functionality in the application itself.
► Press the MEAS key.
► Press the "Meas Mode" softkey.
► Select the "Geotagging" menu item.
► Press the MEAS key.
► Press the "Settings" softkey.
► Select the "[ ] Save on Event" menu item.
► Select the "Event Source" menu item to select the event that triggers data storage.
Managing geotags
The application features a "GPS Position List" that allows you to manage and edit
geotags. The "GPS Position List" contains all geotags that you have created.
► Press the "GPS Position" softkey.
► Select the "GPS Position List" menu item.
The R&S FSH opens a list of geotags that you have saved. In this list, the
R&S FSH shows some basic information about the geotag.
- Number: number of the location as displayed on the map.
- Include: checkbox to include the geotag on the map display
- Latitude, longitude and azimuth: GPS information of the location
- Name: name of the location
However, a geotag consists of more information than the information displayed in the
list.
► Select one of the geotags available in the list.
► Press the "View" softkey.
The R&S FSH displays the complete information of the geotag.
In addition to the geographic information, the details of the geotag also contain
information about the measurement. This information includes, for example, the
frequency, measured level or measurement bandwidth.
The R&S FSH allows you to change the name and description anytime you want. All
other geotag information is unchangeable after it has been saved.
► In the geotag information overview, press the "Edit" softkey.
The R&S FSH opens input fields to change the name and description of the
location.

R&S FSH Interference Analyzer (R&S FSH-K15/ -K16)
Working with Maps
Operating Manual 1173.6275.12 - 31 171
Displaying geotags
A geotag is represented by a dot and a number on the map. The R&S FSH-K15 also
displays an azimuth line.
The azimuth is the deviation from the direction you are facing and the north. It is a
number in degrees. For example, if you are looking east, the azimuth would be 90°.
The application shows the azimuth as a straight black line, beginning at your location
and pointing in the direction you are facing.
The azimuth line is always displayed when you are using the functionality of the
R&S FSH-K15, even if you are just walking around without saving any data.
The R&S FSH-K15 allows you display three geotags at the same time. If you want to
display a different geotag, you first have to remove one of those that are currently
displayed.
If you are using functionality of the R&S FSH-K16, you can display as many geotags
as you want.
► Press the "GPS Position" softkey.
► Select the "GPS Position List" menu item.
► Select the geotag you want to remove and press the "Include" softkey.
The R&S FSH unchecks the checkbox in the "Include" column of the list.
► Select the geotag you want to display instead and press the "Include" softkey.
The R&S FSH adds the geotag to the map display.
5.2.5.2 Triangulation (R&S FSH-K15)
With option R&S FSH-K15, the R&S FSH is able to locate the source of interference
using the triangulation method.
To perform triangulation, you have to create at least two geotags with azimuth
information. After creating the geotags, display them on the map. Based on these
geotags, the R&S FSH calculates the point at which the azimuth lines of the geotags
intersect. This intersection point represents the source of the interference.
► Press the "GPS Position" softkey.
► Select the "GPS Position List" menu item.
► Select at least two geotags and display them on the map.
(Selecting more geotags yields more accurate triangulation results.)
► Press the "GPS Position" softkey.
► Select the "Triangulation" menu item.
The R&S FSH calculate the intersection point of the geotags you have selected.
The result is displayed on the map as a dot that is surrounded by a circle.
By default, the dot and circle are blue. However, you can assign a different color to
the triangulation results. For more information see "Selecting Colors for Geotags
and Measurement Locations" on page 163.

R&S FSH Interference Analyzer (R&S FSH-K15/ -K16)
Working with Maps
Operating Manual 1173.6275.12 - 31 172
Adding the triangulation result to the GPS position list
► Press the "GPS Position" softkey.
► Select the "Save Triangulation" menu item.
The R&S FSH opens an input field to enter a name and description for the new
geotag.
► Enter a name and description.
After you have entered name and description, the R&S FSH opens a dialog box to
define a name for the file that conatins the new GPS information.
Note that the R&S FSH stores triangulation results in a .gpx file. The .gpx file
format is a common file format used to store GPS information.
► Press the "Save" softkey to save the new .gpx file.

R&S FSH Interference Analyzer (R&S FSH-K15/ -K16)
Working with Maps
Operating Manual 1173.6275.12 - 31 173
5.2.6 Collecting Measurement Data (R&S FSH-K17)
When you enter the "Indoor Mapping" application, the R&S FSH always shows the
signal strength you are currently receiving as a numeric value at the top of the display
or in the power bar at the right side of the display (if you have turned that feature on).
However, the main application of the "Maps" mode is to collect the signal strength of
various locations in enclosed areas, and save that data for later evaluation. This allows
you to analyze, for example, the coverage conditions within a building. Basically, the
method to collect this data is similar to that of collecting geotags in large scale map
mode.
When you perform a measurement at a particular spot on the map, the application
creates a tag (represented by a colored dot) and draws it on the map at your current
location. The color of the dot represents the signal strength received at that location
(see "Selecting Colors for Geotags and Measurement Locations" on page 163).
Creating tags
You can create a tag on any place of the map. To do so, you first have to move the
cross-hairs in the map display to the position you are currently at with the cursor keys
or the rotary knob. For more information see "Aligning the Map (R&S FSH-K17)" on
page 162.
When the cross-hairs is at the right
location, proceed as follows to save
the measured data.
► Press the ENTER key.
The R&S FSH creates a tag at
your current position, represented
by a colored dot on the map.
(Alternatively, you can press the
"Indoor Position" softkey and create a
tag with the "Capture Position" menu
item.)
In addition to the graphical representation of the tags, the R&S FSH also stores
additional (numerical) data of the measurement in the tag. You can view the additional
information in the "Indoor Position List".
Managing tags
The application features an "Indoor Position List" that allows you to manage and edit
tags and (to some degree) the information they conatin. The "Indoor Position List"
contains all tags that you have created.
► Press the "Indoor Position" softkey.
► Select the "Indoor Position List" menu item.
The R&S FSH opens a list of tags that you have saved. In this list, the R&S FSH
shows some basic information about the geotag.

R&S FSH Interference Analyzer (R&S FSH-K15/ -K16)
Working with Maps
Operating Manual 1173.6275.12 - 31 174
- Number: represents the number of the measurement (in consecutive order).
- Include: checkbox to include the tag on the map display
- Latitude, longitude and azimuth: GPS information of the location. This
information is only displayed if you have defined reference GPS points during
the creation of the map. Using this information, the application is able to
calculate the exact coordinates of the measurement locations.
- Name: name of the location (displayed only if you have defined a name in the
"Details" view; see below)
However, a tag consists of more information than the information displayed in the list.
► Select one of the tags available in the list.
► Press the "View" softkey.
The R&S FSH displays the complete information of the tag.
In addition to the signal information, the details of the tag also contain information
about the measurement. This information includes, for example, the frequency,
measured level or time of the measurement.
The R&S FSH allows you to change the name and description anytime you want. All
other tag information is unchangeable after it has been saved.
► In the tag information overview, press the "Edit" softkey.
The R&S FSH opens input fields to change the name and description of the
location.
Displaying tags
A tag is represented by a dot on the map. You can add or remove tags as you like.
► Press the "Indoor Position" softkey.
► Select the "Indoor Position List" menu item.
► Select the tag you want to remove and press the "Include" softkey.
The R&S FSH unchecks the checkbox in the "Include" column of the list and
removes it from the map (the information of the tag, however, remains).
► Select the tag you want to display instead and press the "Include" softkey.
The R&S FSH adds the tag to the map display.
Saving measurement data
When you are done with the measurement, you can save the measurement data in a
.gpx file for later evaluation in the R&S InstrumentView software or other applications
like Google Earth.
► Press the MEAS key.
► Press the "Indoor Position" softkey.
► Select the "Save Results" menu item.
The R&S FSH stores the measurement data in a gpx file (it does not matter if you
have specified any GPS data in your map).

R&S FSH Interference Analyzer (R&S FSH-K15/ -K16)
Working with Maps
Operating Manual 1173.6275.12 - 31 175
Restoring measurement data previously recorded
In the same way, you can also restore a gpx file that you have saved previously.
► Press the MEAS key.
► Press the "Indoor Position" softkey.
► Select the "Select GPX File" menu item.
The R&S FSH restores the measurement data saved in the selected gpx file. You
can then add or remove tags as required.
If you have specified GPS reference points for the indoor map, you can also load the
measurement data into a different map (for example a larger scale floor plan of a
building or embed the indoor data into an outdoor map).
To do so, load a different map via the "Map" softkey, and load the corresponding gpx
data. If the map and the gpx data are not compatible, the R&S FSH will not display the
measurement data stored in the gpx file.
Note that you have to load the map first, before restoring the gpx file.
If the gpx data is not compatible with the currently displayed map, or does not contain
any GPS information, the R&S FSH shows a corresponding message.

R&S FSH Interference Analyzer (R&S FSH-K15/ -K16)
Working with Maps
Operating Manual 1173.6275.12 - 31 176
5.2.7 Analyzing Geographic Data (R&S FSH-K15 and -K16)
The R&S InstrumentView software package provides an interface that allows you to
export and review your recorded data with Google Earth. This interface transforms .gpx
files into .kmz files (required by Google Earth). It also contains a plug-in that illustrates
the signal levels measured at the GPS coordinates that you have added to the .gpx
file.
► Start the R&S InstrumentView software.
► Select "Tools" → "Geotag Mapping".
The software opens a dialog box to select a .gpx file.
► Select (or remove) one or more .gpx files with the "Add" ( or "Remove") button.
In the pane on the right, the software shows a list of individual GPS coordinates.
You can include or exclude individual locations by adding or removing the
checkmark in the "Enabled" column.
► Press the "Save as KMZ" button.
► Define a name and location where you want to save the file to.
When you press "Save", the R&S InstrumentView saves the file and at the same
time opens Google Earth to show the data.
Each GPS coordinate is represented by a colored dot. The color of the dot represents
the signal level that has been measured at the corresponding coordinate. The color
map is displayed in the Google Earth window.
You can change the color map in R&S InstrumentView.
► Select "Tools" → "Geotag Mapping".
► Press the "Settings" button.
► In the "Color Settings" pane, select a color and assign a signal level to the color.
R&S FSH Interference Analyzer (R&S FSH-K15/ -K16)
Working with Maps
Operating Manual 1173.6275.12 - 31 177
5.2.8 Analyzing Indoor Data (R&S FSH-K17)
The R&S InstrumentView software package provides an interface that allows you to
export and review your recorded data with external tools. This interface transforms the
measurement data into an image or a csv file.
► Start the R&S InstrumentView software
► Select the "Indoor Mapping" tool ( ).
The software opens the "Map Viewer".
► Press the "Load Map" button to load a map.
► Press the "Load GPX File" button to restore the corresponding GPX data.
When both the map and the GPX file been loaded successfully (and compatible to
each other), the software displays the map, including the signal strength tags that
you have collected.
In addition, the software shows a pane that contains the measurement data as
numeric values (including the coordinates of the tags, measured level and a time
stamp). You can also add a numeric label to the tags that represents the order of
the measurements, and the measured level for each tag ("Show Indices on Map"
and "Show Levels on Map").
You can also change the colors of the signal levels.
► Select "Color Settings" and change the values and colors as you like.
► In the "Color Settings" pane, change the values and colors as you like.
Finally, you can export the measurement data as an image, which may contain a color
map ("Export Image with Legend"), or as a numeric list in the csv file format.
► Select the "Export Image" button, select the file type you prefer and the location
you want save the image in.
► Select the "Export CSV" button and the location you want to save the file in.
Importing data into Google Earth
When you add GPS reference information to the indoor map, it is also possible to
export the data collected indoors as a .kmz file and import it into Google Earth. For
more information see "Analyzing Geographic Data (R&S FSH-K15 and -K16)" on page
176.

R&S FSH Network Analyzer Mode
Working with Maps
Operating Manual 1173.6275.12 - 31 178
6 Network Analyzer Mode
The network analyzer mode provides the functionality to characterize networks with
one or two ports.
To enable the features of the network analyzer mode, you need at least an R&S FSH
with tracking generator or one that also has an internal VSWR bridge.
Scalar measurements
In its basic configuration, an R&S FSH with tracking generator can only perform scalar
measurements and determine the reflection or reverse transmission characteristics of
the device under test (DUT). However, scalar measurements determine the magnitude
of the transmitted or reflected power only.
Measurements yield the best results when you calibrate the R&S FSH to the test
setup. Although the accuracy of measurements is high in the default factory calibration,
the R&S FSH also provides all necessary calibration methods to correct the magnitude
for these kinds of measurements and make results even more accurate.
If the R&S FSH also has an internal VSWR bridge, the R&S FSH can also determine
the reflection on either port or the forward transmission characteristics. The VSWR
bridge enables the R&S FSH to switch the tracking generator to each of the
measurement ports (ports 1 and 2) and can therefore send signals from port 2 to port 1
and vice versa.
Vector measurements
To increase the dynamic range and measurement accuracy, you can equip the
R&S FSH with firmware option R&S FSH-K42 (order no. 1304.5629.02). This enables
vector measurements for the network analyzer operating mode. Note that vector
measurements are only possible with models that feature tracking generator and
VSWR bridge.
In addition to be able to determine the magnitude and phase characteristics of a DUT,
the option also features additional calibration methods and measurement functionality
and formats (e.g. group delay or phase).
► Press the MODE key.
► Press the "Network Analyzer" softkey.
The R&S FSH turns on the tracking generator. Frequency and level settings are
inherited from the previous operating mode.
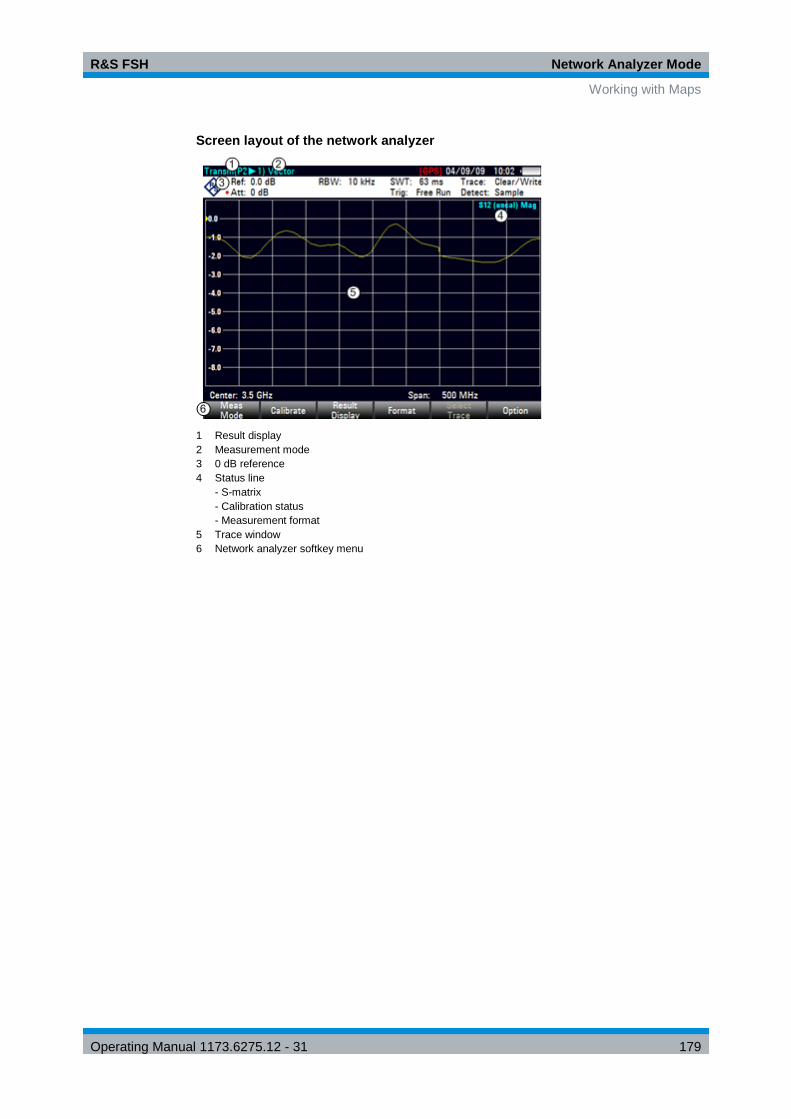
R&S FSH Network Analyzer Mode
Working with Maps
Operating Manual 1173.6275.12 - 31 179
Screen layout of the network analyzer
1 Result display
2 Measurement mode
3 0 dB reference
4 Status line
- S-matrix
- Calibration status
- Measurement format
5 Trace window
6 Network analyzer softkey menu

R&S FSH Network Analyzer Mode
Configuring the Tracking Generator
Operating Manual 1173.6275.12 - 31 180
6.1 Configuring the Tracking Generator
The tracking generator provides the stimulus signal for the network analyzer
measurement. For measurements in the frequency domain, the output frequency
depends on the current measurement frequency. For measurements in the time
domain (zero span), you can define a specific output frequency.
Defining the level of the stimulus signal
You can define the level of the stimulus signal in two different ways.
● As an absolute level in terms of dBm.
● As an attenuation relative to 0 dBm.
Example: Defining an attenuation of 0 dB corresponds to an output level of 0 dBm.
An attenuation of 40 dB corresponds to an output level of -40 dBm.
► Press the AMPT key.
► Press the “TG Settings” softkey.
► Select the “TG Power” menu item to define the output level as an absolute value.
► Select the “TG Attenuation” menu item to define the output level as a relative
value.
Note that the actual output level you measure can deviate from the value you enter and
may not be linear over the frequency range of the measurement. The level can also
vary depending on which port you use as the driving port - the signal generated on port
1 can differ from that on port 2 because of the system architecture. We recommend to
use port 2 in case an absolute source is required. Therefore a S22 or S12
measurement should be selected.
We also recommend to always normalize or calibrate a measurement to compensate
for any level variations caused by the tracking generator. For more information about
calibration, see "Calibrating Measurements" on page 182.
►
Tracking generator output level
Using a tracking generator attenuation of 0 dB for S12 or S21 measurements can
cause an overload at the RF input. It is therefore recommended to use an output level
of -10 dBm (default) or lower for these measurements.
This especially applies to measurements on amplifiers.
In addition to the level, you can also define a level offset, for example to take external
attenuators into account. Note that this is a purely mathematical value that does not
change the actual output level.
► Press the AMPT key.
► Press the “TG Settings” softkey.
► Select the “TG Power Offset” menu item and define the required offset.
The displayed values are adjusted by the offset.

R&S FSH Network Analyzer Mode
Configuring the Tracking Generator
Operating Manual 1173.6275.12 - 31 181
Defining the frequency of the generated signal (zero span only)
In case of frequency domain measurements (span > 0), the R&S FSH automatically
adjusts the tracking generator frequency to the current measurement frequency.
In the time domain (zero span mode), you can define a specific frequency of the signal
that is output by the tracking generator.
► Press the AMPT key.
► Press the “TG Settings” softkey.
► Select the “Use TG as CW source” menu item.
The R&S FSH changes into zero span mode.
This is not possible when you are using the High Accuracy calibration method (see
“Calibration Methods” on page 184.
► Press the “TG Settings” softkey.
► Select the “Source Frequency” menu item and define the required signal
frequency.
The R&S FSH generates a signal with the corresponding frequency. The
measurement frequency is adjusted accordingly.
Note that when you deselect the “Use TG as CW Source” menu item, the R&S FSH
restores the previously selected span. If the span is changed to a value greater than
0 Hz while “Use TG as CW Source” is active, this feature is automatically deselected.
Turning the tracking generator on and off (zero span only)
When you are using the tracking generator in zero span mode, you can turn it on and
off as required.
► Press the AMPT key.
► Press the “TG Settings” softkey.
► Select the Source On/Off” menu item.
When it is on, the tracking generator provides a signal with the characteristics that
you have defined. When it is off, no signal is generated.
Note that previously recorded calibration data is not lost when you turn the tracking
generator off. It is restored when you turn the tracking genartor back on.

R&S FSH Network Analyzer Mode
Calibrating Measurements
Operating Manual 1173.6275.12 - 31 182
6.2 Calibrating Measurements
In its default state, the R&S FSH uses factory calibration. Factory calibration is a full 2-
port calibration over the current frequency range (i.e. span) of the R&S FSH. When
factory calibration is active, the status line reads . In many cases, this calibration
already provides accurate results.
To get the best and most accurate results, however, you have to calibrate the
measurement manually, because factory calibration does not take the actual test setup
into account (e.g. cables). The R&S FSH provides several calibration methods. You
will need one of the available calibration standards R&S FSH-Z28, -Z29 (order no.
1300.7804.03 and 1300.7504.03) or R&S ZV-Z121 (order no. 1164.0496.02/.03).
Alternatively, you can create customized calibration kits with the functionality of the
R&S InstrumentView software package and transfer those to the R&S FSH.
Before you calibrate the R&S FSH for the current measurement, you should set the
frequency parameters, reference level and attenuation levels. If you change one of
these parameters after a successful calibration, it may become invalid.
To successfully calibrate the test setup, you have to connect the calibration standard at
the reference plane, usually the output of the RF measurement cable.
During calibration, the R&S FSH removes systematic errors from the measurement.
This process is based on correction data it gets while performing the calibration.
The correction data for transmission measurements is based on the results of
comparing the transmission characteristics of the test setup to the frequency response
of the tracking generator. The correction data for reflection measurements is based on
the results of a reflection measurement at a short and an open on the bridge.
Calibration remains valid after turning off the R&S FSH or changing into another operating mode as calibration data is saved in the internal memory of the R&S FSH. If you save the measurement in a dataset, calibration data is part of that dataset. When you restore the dataset and perform the same measurement again, you do not have to recalibrate the R&S FSH.
6.2.1.1 Calibration States
The R&S FSH features several calibration states. It displays the current state in the
status line. The possible states depend on the calibration type (see below).
● (fcal)
The R&S FSH uses factory calibration. Factory calibration is restored after a preset
or self alignment. The R&S FSH also uses factory calibration if you change a
frequency parameter (span, start, stop or center frequency) to a value outside the
calibrated frequency range or if you measure another s-parameter than the one the
R&S FSH is calibrated for.
The calibration data for the factory calibration is already in the memory of the
R&S FSH when it is delivered. The factory calibration is a full two-port calibration.

R&S FSH Network Analyzer Mode
Calibrating Measurements
Operating Manual 1173.6275.12 - 31 183
You can restore the factory calibration manually any time.
- Press the "Calibration" softkey.
- Select the "User Calibration Off" menu item.
● (fcal?)
The R&S FSH uses factory calibration. However, the calibration is not accurate
because the power of the tracking generator and the attenuation at the RF input
are not in line with the default settings. In that case you should repeat calibration.
● (cal)
The R&S FSH uses user calibration. To get that state you have to perform either a
full 1-port or a full 2-port calibration.
● (cal?)
The R&S FSH uses user calibration. However, the calibration is not accurate
because the TG power and receiver attenuation are not in line with the settings at
the time it has been calibrated. In that case you should repeat calibration.
● (norm) (network analysis only)
The R&S FSH uses normalization. To get that state you have to normalize the
transmission.
● (norm?) (network analysis only)
The R&S FSH uses normalization. However, the normalization is not accurate
because the TG power and receiver attenuation are not in line with the settings at
the time it has been calibrated. In that case you should repeat calibration.
● (interp) (network analysis only)
The R&S FSH interpolates the correction data between the reference points of the
calibration. Interpolation is used when you change one of the frequency
parameters (start, stop or center frequency). In that case the distribution of the
measurement points is different to the distribution during calibration. This could
result in an increasing measurement uncertainty.
When calibration has become invalid for any reason or the calibration data has
changed, you can restore the most recent calibration that was valid.
► Press the "Calibration" softkey.
► Select the "Restore Calibration Settings" menu item.
The R&S FSH restores the calibration data and the frequency settings that were
active.

R&S FSH Network Analyzer Mode
Calibrating Measurements
Operating Manual 1173.6275.12 - 31 184
6.2.1.2 Calibration Methods
The available calibration methods depend on whether you perform scalar or vector
measurements. In addition, calibration for reflection measurements is available only for
models with an VSWR bridge.
Scalar measurements
Scalar measurements provide normalization of transmission and reflection only.
Normalization is a simple but effective way to calibrate the measurement using one
calibration standard only. The correction data is deducted from this measurement. As
only one calibration standard is used, the accuracy is lower than that of a full
calibration available for vector measurements.
Vector measurements
Vector measurements provide several calibration methods that correct the magnitude
and the phase.
● Full 2-Port
Both test ports are calibrated for both reflection and transmission measurements
on either port or direction. The calibration routine therefore requires the connection
of the standards load, open and short to both test ports, and a through connection
of the test ports. The influences of the test setup and of the isolation between the
test ports are thereby determined and taken into account in the subsequent
measurement of the device under test.
While this method is the most time-consuming during calibration, it does provide
the greatest accuracy for all measurements at both test ports without recalibration
and is thus the most flexible.
● Full 2-Port High Accuracy
Both test ports are calibrated like the full 2-port calibration. In addition, the load
match is taken into account more accurately and correction data is applied in both
directions, forward and reverse.
This method provides even more accurate results than the normal full 2-port
calibration but takes a while longer to finish.
● Reflection Port 1/2
Test port 1 or 2 is calibrated for reflection measurements on that port (S11 or S22).
The calibration routine requires the calibration standards open, short and load to
be connected one after another.
● Transmission Fwd (Port 12) and Transmission Rev (Port 21)
Test port 1 or 2 is calibrated for transmission measurements (S12 or S21). For
measurements in forward direction, this method calibrates port 1, in case of
measurements in the reverse direction, it calibrates port 2.
The calibration requires a through connection and the calibration standards open
and short.
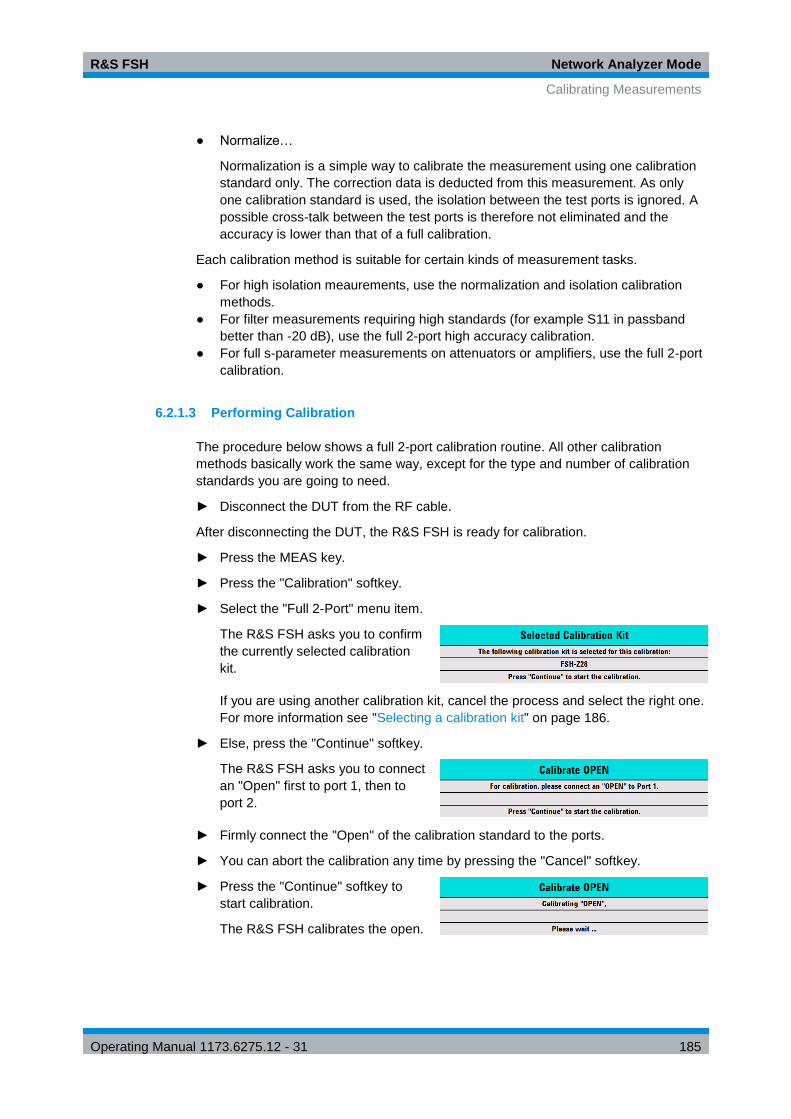
R&S FSH Network Analyzer Mode
Calibrating Measurements
Operating Manual 1173.6275.12 - 31 185
● Normalize…
Normalization is a simple way to calibrate the measurement using one calibration
standard only. The correction data is deducted from this measurement. As only
one calibration standard is used, the isolation between the test ports is ignored. A
possible cross-talk between the test ports is therefore not eliminated and the
accuracy is lower than that of a full calibration.
Each calibration method is suitable for certain kinds of measurement tasks.
● For high isolation meaurements, use the normalization and isolation calibration
methods.
● For filter measurements requiring high standards (for example S11 in passband
better than -20 dB), use the full 2-port high accuracy calibration.
● For full s-parameter measurements on attenuators or amplifiers, use the full 2-port
calibration.
6.2.1.3 Performing Calibration
The procedure below shows a full 2-port calibration routine. All other calibration
methods basically work the same way, except for the type and number of calibration
standards you are going to need.
► Disconnect the DUT from the RF cable.
After disconnecting the DUT, the R&S FSH is ready for calibration.
► Press the MEAS key.
► Press the "Calibration" softkey.
► Select the "Full 2-Port" menu item.
The R&S FSH asks you to confirm
the currently selected calibration
kit.
If you are using another calibration kit, cancel the process and select the right one.
For more information see "Selecting a calibration kit" on page 186.
► Else, press the "Continue" softkey.
The R&S FSH asks you to connect
an "Open" first to port 1, then to
port 2.
► Firmly connect the "Open" of the calibration standard to the ports.
► You can abort the calibration any time by pressing the "Cancel" softkey.
► Press the "Continue" softkey to
start calibration.
The R&S FSH calibrates the open.

R&S FSH Network Analyzer Mode
Calibrating Measurements
Operating Manual 1173.6275.12 - 31 186
► Disconnect the "Open".
Next, the R&S FSH asks you to
connect a "Short" first to port 1,
then to port 2.
► Firmly connect the "Short" of the calibration standard to the ports.
► Press the "Continue" softkey to start calibration.
The R&S FSH calibrates the "Short".
► Disconnect the "Short".
Next, the R&S FSH asks you to connect a "Load" (50 Ω termination) first to port 1, then to port 2.
► Firmly connect the "Load" of the calibration standard to port 1.
► Press the "Continue" softkey to start calibration.
The R&S FSH calibrates the "Load".
► Disconnect the "Load".
Next, the R&S FSH asks you to set up a "Through" connection from port 1 to port 2.
► Firmly connect the "Through" connection to port 1 and port 2.
► Press the "Continue" softkey to start calibration.
The R&S FSH calibrates the "Through" connection.
After finishing the calibration routine, the R&S FSH shows that calibration is
finished for a short time ( ). The status line now says (Cal) to indicate
successful calibration.
Selecting a calibration kit
To avoid phase errors, you have to define the characteristics of the calibration kit you'd
like to use and then select the calibration kit in use. The R&S FSH then corrects the
measurement results accordingly.
You can either use one of the calibration kits specifically designed for use with the
R&S FSH, e.g. the R&S FSH-Z28 and -Z29 calibration kits. Those provide an "Open",
"Short" and "Load" calibration standard in one piece. The characteristics of these
calibration kits are already part of the R&S FSH firmware.
You can create and edit calibration kits with the R&S InstrumentView software and
transfer them to the R&S FSH via the USB or the LAN interface. The number of
standards the R&S FSH can store in its memory depends on the number of other data
sets stored on the R&S FSH.
For more information see "Managing Datasets" on page 30.
R&S FSH Network Analyzer Mode
Calibrating Measurements
Operating Manual 1173.6275.12 - 31 187
► Press the MEAS key.
► Press the "Calibration" softkey.
► Select the "Select Calkit [ ]" menu item.
The R&S FSH opens a dialog box to select the calibration kit. The list of supported
calibration kits covers those supported by the R&S FSH and those that you have
customized.
► Select the calibration kit you are using.
The R&S FSH uses the characteristics specified for the calibration kit.
It also shows the calibration kit currently in use next to the "Select Calkit [ ]" menu
item.
You can also use calibration kits other than the R&S FSH-Z28 or -Z29 in combination
with their characteristics. However, make sure that the electrical length of the
calibration kit in use is similar to that of the R&S FSH-Z28 or -Z29. The electrical length
of the "Open" and "Short" of the R&S FSH calibration kits is 5.27 mm. If the electrical
length is different, it may cause additional phase error.
Some measurement setups may include additional cables or adapters that may have
an additional electrical length. To correct their phase error, you can include the
electrical length of additional test equipment. The R&S FSH distinguishes if the
equipment is connected to port 1 or port 2.
► Press the MEAS key.
► Press the "Calibration" softkey.
► Select the "Offset Length Port 1" or "Offset Length Port 2" menu item.
The R&S FSH opens an input field to define the electrical length of the accessory.
► Enter the electrical length.
The R&S FSH now includes the electrical length of the accessory for phase
measurements.

R&S FSH Network Analyzer Mode
Performing Scalar Measurements
Operating Manual 1173.6275.12 - 31 188
6.3 Performing Scalar Measurements
With scalar measurements, you can measure the magnitude of both reflection and
transmission characteristics of a device under test. To calibrate the measurements,
only normalization is available.
6.3.1 Measuring the Transmission
The example included here is based on a transmission measurement of a two-port
filter. The filter has a center frequency of 2060 MHz and a bandwidth of about 11 MHz.
Test setup
► Connect the input of the DUT to the tracking generator output (port 2).
► Connect the output of the DUT to the RF input (port 1).
Preset the R&S FSH
Before starting the measurement procedure, preset the R&S FSH to restore the default
configuration and connect the filter between the measurement ports.
► Press the PRESET key.
► Connect the DUT.
Start scalar measurements
► Press the MEAS key.
► Press the "Meas Mode" softkey.
► Select the "Scalar" menu item.
Select the type of transmission measurement
► Press the "Result Display" softkey.
► Select the "Transmission Fwd (Port 12)" menu item for transmission
measurements in forward direction or "Transmission Rev (Port 12)" menu item
for transmission measurements in reverse direction.
► Select the "Transmission Fwd and Rev" menu item for a simultaneous display of
both forward and reverse transmission measurements.
In case of a simultaneous display, the R&S FSH shows two traces with a different
color in the result display. One for the measurement in forward direction and one
for the measurement in reverse direction. A label in the result display shows the
direction a trace belongs to.
Note that the simultaneous display of both directions is only possible with a high
accuracy calibration.

R&S FSH Network Analyzer Mode
Performing Scalar Measurements
Operating Manual 1173.6275.12 - 31 189
Define the frequency parameters
Before calibrating the measurement, you should define the frequency parameters to
avoid inaccurate results because of invalid calibration.
► Press the FREQ key.
The R&S FSH opens an input field to set the center frequency.
► Enter a frequency of 2060 MHz.
► Press the SPAN key.
The R&S FSH opens an input field to define the span.
► Enter a span of 50 MHz to get a high resolution of the results.
Calibrate the measurement for scalar transmission measurements.
Scalar measurements provide normalization only. Normalization is not as accurate as
a full calibration, but yields pretty accurate results nonetheless. In addition,
normalization needs one calibration standard only and therefore is faster than a full
calibration.
► Press the "Calibration" softkey.
► Select the "Normalize
Transmission Rev (Port 12)
menu item.
► Perform normalization. For more
information see "Performing
Calibration".
► Reconnect the DUT.
The R&S FSH shows the results of
the scalar transmission
measurement on the filter.
You can change the measurement configuration (e.g. select another sweep time or
detector) without affecting the accuracy of the measurement except the frequency
parameters and attenuation.

R&S FSH Network Analyzer Mode
Performing Scalar Measurements
Operating Manual 1173.6275.12 - 31 190
6.3.2 Measuring the Reflection
The example included here is based on a reflection measurement of the same two-port
filter used for the transmission measurement. The filter has a center frequency of
2060 MHz and a bandwidth of about 11 MHz.
You can skip the preset, scalar measurement selection and frequency settings if you
have already set up the R&S FSH for the measurement. You can also skip the
calibration, if you have performed the appropriate calibration already.
Preset the R&S FSH
Before starting the measurement procedure, preset the R&S FSH to restore the default
configuration and connect the filter between the measurement ports.
► Press the PRESET key.
► Connect the DUT.
Start scalar measurements
► Press the MEAS key.
► Press the "Meas Mode" softkey.
► Select the "Scalar" menu item.
Select the type of reflection measurement
► Press the "Result Display" softkey.
► Select the "Reflection Port 1" menu item for reflection measurements on port 1 or
the "Reflection Port 2" menu item for reflection measurements on port 2.
► Select the "Reflection Port 1 and Port 2" menu item for a simultaneous display of
both the reflection on port 1 and on port 2.
In case of a simultaneous display, the R&S FSH shows two traces with a different
color in the result display. One for the measurement on port 1 and one for the
measurement on port 2. A label in the result display shows the port a trace belongs
to.
Note that the simultaneous display of both ports is only possible with a high
accuracy calibration.
Define the frequency parameters
Before calibrating the measurement, you should define the frequency parameters to
avoid inaccurate results because of invalid calibration.
► Press the FREQ key.
The R&S FSH opens an input field to set the center frequency.
► Enter a frequency of 2060 MHz.

R&S FSH Network Analyzer Mode
Performing Scalar Measurements
Operating Manual 1173.6275.12 - 31 191
► Press the SPAN key.
The R&S FSH opens an input field to define the span.
► Enter a span of 50 MHz to get a high resolution of the results.
Calibrate the measurement for scalar transmission measurements.
Scalar measurements provide normalization only. Normalization is not as accurate as
a full calibration, but yields pretty accurate results. In addition, normalization needs one
calibration standard only and therefore is faster than a full calibration.
► Press the MEAS key.
► Press the "Calibration" softkey.
► Select the appropriate menu item
(normalization on one or two
ports).
► Perform normalization. For more
information see "Performing
Calibration".
► Reconnect the DUT.
The R&S FSH shows the results of
the scalar reflection measurement
on the filter.
You can change the measurement configuration (e.g. select another sweep time or
detector) without affecting the accuracy of the measurement except the frequency
parameters and attenuation.

R&S FSH Network Analyzer Mode
Performing Vector Measurements (R&S FSH-K42)
Operating Manual 1173.6275.12 - 31 192
6.4 Performing Vector Measurements (R&S FSH-K42)
If you equip the R&S FSH with option R&S FSH-K42, vector measurements become
available. The R&S FSH also must feature an VSWR bridge in addition to the tracking
generator.
Unlike scalar measurements, vector measurements also measure the phase
characteristics of a DUT. Vector measurements also have a higher dynamic range and
accuracy because of the advanced calibration methods that vector measurements
provide.
In addition to normalization, vector measurements feature full calibration methods that
require a 50 Ω termination in addition to an open or short circuit. Instead of the
characteristics of the VSWR bridge, the decisive factor of the quality of results is the
quality of the calibration standards.
Because of the higher dynamic range, vector measurements allow more accurate
measurements of well matched DUTs at a higher display resolution.
Vector measurements also unlock more measurement formats and therefore provide
more information from different perspectives about the DUT.
Supplying DC voltage to active DUTs
If you are performing measurements on active DUTs (e.g. amplifiers), you can supply
them with DC voltage by connecting an RF cable to the BIAS ports. The DC voltage is
fed in from a suitable external power supply (max. 600 mA/max. 50 V).
To measure the antenna coupling of mobile radio base stations, the DC voltage must
be supplied to two tower-mounted amplifiers (TMA). This is done by applying a
suitable voltage at the BIAS 1 and BIAS 2 BNC ports.
6.4.1 Measuring the Transmission
The example included here is based on a transmission measurement of a two-port
filter. The filter works in the frequency from of 1920 MHz to 1980 MHz.
Test setup
► Connect the input of the DUT to the tracking generator output (port 2).
► Connect the output of the DUT to the RF input (port 1).
Preset the R&S FSH
Before starting the measurement procedure, preset the R&S FSH to restore the default
configuration and connect the filter between the measurement ports.
► Press the PRESET key.
► Connect the DUT.

R&S FSH Network Analyzer Mode
Performing Vector Measurements (R&S FSH-K42)
Operating Manual 1173.6275.12 - 31 193
Start vector measurements.
► Press the MEAS key.
► Press the "Meas Mode" softkey.
► Select the "Vector" menu item.
Select the type of transmission measurement
► Press the "Result Display" softkey.
► Select the "Transmission Fwd (Port 12)" menu item for transmission
measurements in forward direction or "Transmission Rev (Port 12)" menu item
for transmission measurements in reverse direction.
Simultaneous display of several results
You can also display two results simultaneously in a single diagram. In that case, the
R&S FSH shows two traces with a different color in the result display.
► Press the MEAS key.
► Press the "Result Display” softkey.
► Select one of the result combinations to be displayed in a single diagram.
- Reflection S11 + S22
- Transmission S21 + S12
- Transmission / Reflection S21 + S11
- Transmission / Reflection S12 + S22
The information, which trace carries which result, is indicated by a label in the
diagram area.
Note that the simultaneous display of more than one result in a single diagram is
only possible with a high accuracy calibration.
In addition, you can display two diagrams, so that you can view all four results at the
same time (S11, S12, S21, S22).
► Press the MEAS key.
► Press the "Result Display" softkey.
► Select the "Show Trace 2" menu
item.
► Press the TRACE key.
► Press the "Select Trace" softkey to
select the diagram.
► Trace 1 corresponds to the upper
diagram (contains trace 1 and
trace 3).
► Trace 2 corresponds to the lower diagram (contains trace 2 and trace 4).
► Select the contents from the "Measurement” menu as required.
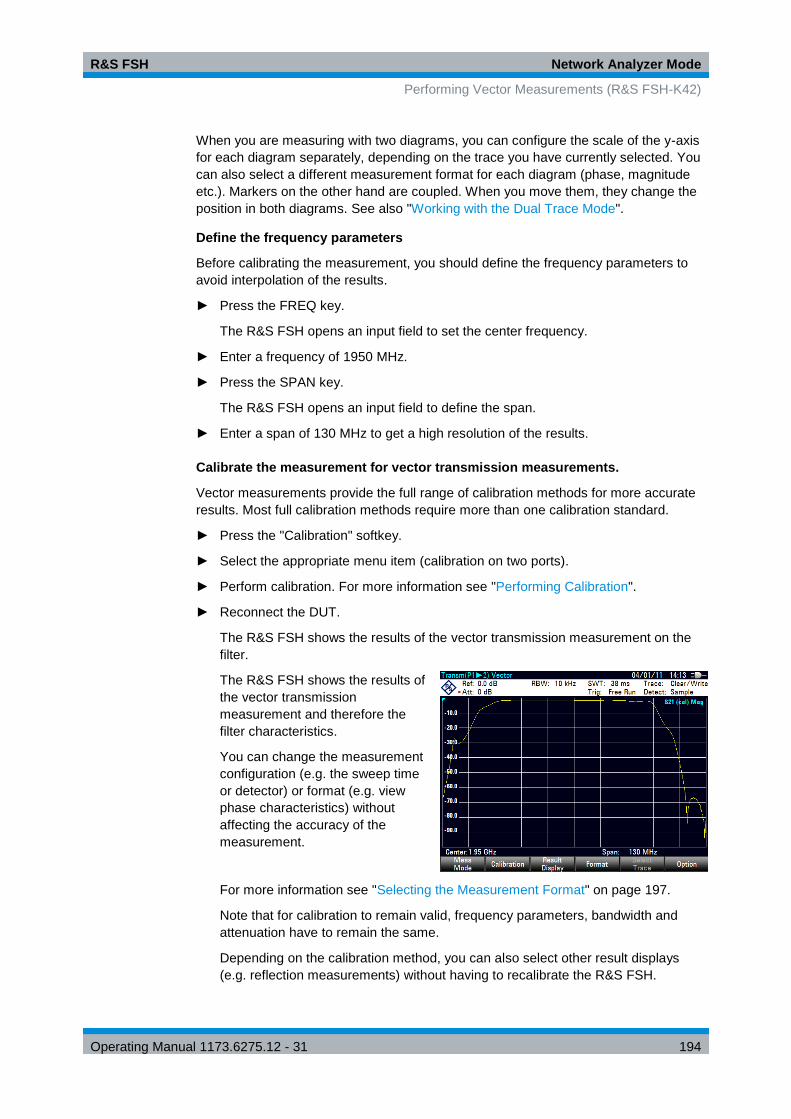
R&S FSH Network Analyzer Mode
Performing Vector Measurements (R&S FSH-K42)
Operating Manual 1173.6275.12 - 31 194
When you are measuring with two diagrams, you can configure the scale of the y-axis
for each diagram separately, depending on the trace you have currently selected. You
can also select a different measurement format for each diagram (phase, magnitude
etc.). Markers on the other hand are coupled. When you move them, they change the
position in both diagrams. See also "Working with the Dual Trace Mode".
Define the frequency parameters
Before calibrating the measurement, you should define the frequency parameters to
avoid interpolation of the results.
► Press the FREQ key.
The R&S FSH opens an input field to set the center frequency.
► Enter a frequency of 1950 MHz.
► Press the SPAN key.
The R&S FSH opens an input field to define the span.
► Enter a span of 130 MHz to get a high resolution of the results.
Calibrate the measurement for vector transmission measurements.
Vector measurements provide the full range of calibration methods for more accurate
results. Most full calibration methods require more than one calibration standard.
► Press the "Calibration" softkey.
► Select the appropriate menu item (calibration on two ports).
► Perform calibration. For more information see "Performing Calibration".
► Reconnect the DUT.
The R&S FSH shows the results of the vector transmission measurement on the
filter.
The R&S FSH shows the results of
the vector transmission
measurement and therefore the
filter characteristics.
You can change the measurement
configuration (e.g. the sweep time
or detector) or format (e.g. view
phase characteristics) without
affecting the accuracy of the
measurement.
For more information see "Selecting the Measurement Format" on page 197.
Note that for calibration to remain valid, frequency parameters, bandwidth and
attenuation have to remain the same.
Depending on the calibration method, you can also select other result displays
(e.g. reflection measurements) without having to recalibrate the R&S FSH.

R&S FSH Network Analyzer Mode
Performing Vector Measurements (R&S FSH-K42)
Operating Manual 1173.6275.12 - 31 195
6.4.2 Measuring the Reflection
The example included here is based on a reflection measurement of the two-port filter
that was also used for the transmission measurement.
You can skip the preset, vector measurement selection and frequency settings if you
have already set up the R&S FSH for the measurement. You can also skip the
calibration, if you have performed the appropriate calibration already.
Preset the R&S FSH
Before starting the measurement procedure, preset the R&S FSH to restore the default
configuration and connect the filter between the measurement ports.
► Press the PRESET key.
► Connect the DUT.
Start vector measurements.
► Press the MEAS key.
► Press the "Meas Mode" softkey.
► Select the "Vector" menu item.
Select the type of reflection measurement
► Press the "Result Display" softkey.
► Select the "Reflection Port 1" menu item for reflection measurements on port 1 or
the "Reflection Port 2" menu item for reflection measurements on port 2.
► Select the "Reflection on Port 1 and Port 2" menu item for simulatenous display of
the reflection on both ports.
For more information see "Performing Scalar Measurements" on page 188.
Simultaneous display of several results
You can also display two results simultaneously in a single diagram. In that case, the
R&S FSH shows two traces with a different color in the result display.
See “Measuring the Transmission” for more information.
Define the frequency parameters
Before calibrating the measurement, you should define the frequency parameters to
avoid interpolation of the results.
► Press the FREQ key.
The R&S FSH opens an input field to set the center frequency.
► Enter a frequency of 1950 MHz.
► Press the SPAN key.
The R&S FSH opens an input field to define the span.
► Enter a span of 130 MHz to get a high resolution of the results.

R&S FSH Network Analyzer Mode
Performing Vector Measurements (R&S FSH-K42)
Operating Manual 1173.6275.12 - 31 196
Calibrate the measurement for vector reflection measurements.
Vector measurements provide the full range of calibration methods for more accurate
results. Most full calibration methods require more than one calibration standard.
► Press the "Calibration" softkey.
► Select the appropriate menu item (calibration on one or two ports).
► Perform calibration. For more information see "Performing Calibration".
► Reconnect the DUT.
The R&S FSH shows the results of
the vector reflection measurement
on the filter.
You can change the measurement
configuration (e.g. the sweep time
or detector) or format (e.g. view
phase characteristics) without
affecting the accuracy of the
measurement. For more
information see "Selecting the
Measurement Format" on page
197.
Depending on the calibration method, you can also select another result display.

R&S FSH Network Analyzer Mode
Evaluating the Results
Operating Manual 1173.6275.12 - 31 197
6.5 Evaluating the Results
6.5.1 Selecting the Measurement Format
Depending on the measurement mode (scalar or vector) and result display (reflection
or transmission), you can select one of several measurement formats. Each of the
measurement formats shows a different aspect of the measurement results.
Note that some of the measurement formats become available only after you have
calibrated the measurement.
► Press the MEAS key.
► Press the "Format" softkey.
► Select the measurement format from the menu.
The R&S FSH displays the results in the new measurement format and adjusts the
trace and the scale of the vertical axis accordingly. The current measurement
format is part of the status line information ( )
Magnitude / dB Mag
Shows the magnitude of the transmission or reflection in dB. The diagram is a
Cartesian diagram with a logarithmic vertical axis. The horizontal axis represents the
measured frequency range.
The magnitude format is the default format for all measurements.
Available for all measurements.
Phase
Shows the phase characteristics of the DUT in degrees. The diagram is a Cartesian
diagram with a linear vertical axis. The horizontal axis represents the measured
frequency range.
In the default state, the R&S FSH shows the phase only from -200° to +200°. In that
case, the R&S FSH displays measurement results correctly only if the phase difference
between two adjacent test points is less than 180°.
You can unwrap the phase to expand the range of the phase.
► Press the AMPT key.
► Press the "Range" softkey.
► Select the "Phase Wrap" or "Phase Unwrap" menu item.
Available for all vector measurements.
Simultaneous display of magnitude and phase characteristics
Selecting the "Magnitude + Phase" format results in a split screen that shows the
magnitude characteristics in the upper screen and the phase in the lower screen.

R&S FSH Network Analyzer Mode
Evaluating the Results
Operating Manual 1173.6275.12 - 31 198
VSWR
Shows the (voltage) standing wave ratio of the DUT.
The VSWR is the ratio of the maximum to the minimum voltage that occur in an
electrical transmission line. It is a measure of the reflected power at the input of the
DUT. The results are displayed in a Cartesian diagram with a logarithmic vertical axis.
Available for vector reflection measurements.
Reflection coefficient
Shows the reflection coefficient of the DUT.
The reflection coefficient is the ratio of the amplitude of a reflected wave and that of the
incidental wave that occur in an electrical transmission line.
You can set the unit for the reflection coefficient.
► Press the AMPT key.
► Press the "Unit" softkey.
Available for vector reflection measurements.
Smith chart
Shows the measurement results in the Smith chart.
The Smith chart is a circular diagram that primarily shows impedance or reflection
characteristics of a DUT.
Available for vector reflection measurements.
For more information see "Working with the Smith Chart" on page 199
Cable loss
Shows the cable loss characteristics of a DUT.
The cable loss is a measure to determine the attenuation of a cable in a particular
frequency range. The diagram is a Cartesian diagram with a logarithmic vertical axis
that shows the cable attenuation. The horizontal axis represents the measured
frequency range. See “Selecting the Measurement Format” for more details about the
measurement.
Available for vector reflection measurements.
Group delay
Shows the group delay characteristics of the DUT.
The group delay is a measure that describes the time period or delay of the signal as it
goes through the DUT.
Available for vector measurements.

R&S FSH Network Analyzer Mode
Evaluating the Results
Operating Manual 1173.6275.12 - 31 199
Electrical length
Shows the electrical length of a DUT.
The electrical length is a numerical result that displayed in addition to another
measurement format. As long as it is active, the electrical length is displayed
regardless of the currently selected format.
The electrical length is calculated from the phase delay.
f
2
with being the phase deviation over the entire frequency range. The electrical
length is then derived by
0cl
with 0c being the velocity of light.
By definition, the electrical length is calculated from the vacuum velocity of light and
the differential group delay ( g ). Here, the group delay is replaced by the phase delay
for two reasons:
● An electrical length needs to be specified only for non-dispersive DUTs in which
phase delay and group delay match.
● Due to the significantly wider aperture, the measurement certainty is an order of
magnitude higher in the phase delay measurement than in the group delay
measurement.
The result for the electrical length is correct only if the phase difference between two
adjacent test points does not exceed 180°.
Available for vector measurements.
Delay time
Shows the delay time of a cable.
The delay time is a numerical result that is displayed in addition to another
measurement format.
The delay time is the propagation time of the wave or the time it takes the wave to
reach its destination..
Available for the vector phase measurements.
6.5.1.1 Working with the Smith Chart
If you are displaying measurement results in a Smith chart (available for vector
reflection measurements), the R&S FSH provides several special functionality.
► Press the MEAS key.
► Press the "Measurement Format" softkey.
► Select the "Smith Chart" menu item.
The R&S FSH shows the reflection of the DUT in the Smith chart.

R&S FSH Network Analyzer Mode
Evaluating the Results
Operating Manual 1173.6275.12 - 31 200
Zooming the Smith chart
To take a better look at the results, you can zoom and enlarge a particular part of the
Smitch chart.
The R&S FSH provides a 2x, 4x and
8x zoom.
► Press the TRACE key.
► Press the "Zoom" softkey.
The R&S FSH opens a submenu
to control the zoom function. It
also draws a rectangle on the
display that corresponds to the
parts of the display about to be
zoomed in.
The size of the rectangle depends on the zoom factor.
► Press the "Zoom Factor" softkey.
► Select the menu item with the
zoom factor you want.
The R&S FSH adjusts the size of
the rectangle.
By default, the position of the rectangle
is the area in the center of the display.
You can also change the position of
the rectangle.
The magnitude of the shift is a percentage and ranges from -50 % to +50 % for both
vertical and horizontal directions. The zero point (0 %) in vertical and horizontal
direction is the center of the Smith diagram.
► Press the "Move X" softkey.
The R&S FSH opens an input field.
► Enter a value between -50 % and 50 % to shift the window horizontally.
Entering negative values moves the rectangle to the left, positive values move it to
the right.
► Press the "Move Y" softkey.
The R&S FSH opens an input field.
► Enter a value between -50 % and 50 % to shift the window vertically.
Entering negative values moves the rectangle up, positive values move it down.

R&S FSH Network Analyzer Mode
Evaluating the Results
Operating Manual 1173.6275.12 - 31 201
► Press the "Zoom Active" softkey.
The R&S FSH now zooms in on
the area covered by the zoom
window. You can position the
zoom window more accurately
with the "Move X" and "Move Y"
softkeys as described.
► To deactivate the zoom
functionality, press the "Zoom
Active" softkey again.
Using markers
In addition to the standard marker functionality, the Smith chart also features several
marker output formats.
● dB Magnitude + Phase
Shows the magnitude (in dB) and the phase at the current marker position.
● Lin Magnitude + Phase (Rho)
Shows the converted magnitude (in %) and the phase (in rho) at the current
marker position.
● Real + Imag (Rho)
Shows the real and imaginary components at the current marker position.
● R + jX
Shows the real and imaginary components of the impedance at the marker
position. The imaginary component is converted to inductance or capacitance.
Marker frequency and sign are taken into account.
● G + jB
Shows the real and imaginary components of the admittance at the marker
position. The imaginary component is converted to inductance or capacintance.
Marker frequency and sign are taken into account.
● (R + jX/Z0)
Shows the real and imaginary components of the standardized impedance.
● (G + jB/Z0)
Shows the real and imaginary components of the standardized admittance.
► Press the MARKER key.
The R&S FSH activates a marker and opens the marker softkey menu. Like usual
traces, you can move the marker around with the rotary knob or the cursor keys, or
enter a specific marker position.

R&S FSH Network Analyzer Mode
Evaluating the Results
Operating Manual 1173.6275.12 - 31 202
In its default state, the marker position is specified by the marker frequency and
complex resistance in Ω. The complex resistance in that case is calculated according
to: (real component) + j (imaginary component)
► Press the "Marker Mode" softkey.
► Select one of the marker formats.
The R&S FSH adjusts the marker
information accordingly.
Selecting the reference impedance
The default reference impedance (the matching point in the center of the Smith chart)
is 50 Ω. It is, however, also possible to perform reflection measurements on networks
with another impedance.
► Press the MARKER key.
► Press the "Marker Mode" softkey.
► Select the "Ref Impedance: …" menu item.
The R&S FSH opens an input field to select the reference impedance.
► Enter the reference impedance you need.
The value range is from 1 mΩ to 10 kΩ.
6.5.1.2 Working with the Dual Trace Mode
When performing measurements, it is possible to perform and display two
measurements simultaneously. After activating this function, the R&S FSH shows the
two traces in two separate diagrams. This allows you to view any combination of two
results and measurement formats on the display.
Note that the Magnitude + Phase measurement format is an exception to this rule. This
format counts as one trace. To display the magnitude and phase as two separate
traces, assign the Phase format to trace 1 and the Magnitude format to trace 2.
► Press the MEAS key.
► Press the "Result Display" softkey.
► Select the "Show Trace 2" menu item.
The R&S FSH splits the screen. The upper screen shows trace 1, the bottom
screen shows trace 2. You can configure some aspects of the diagram
independently, like y-axis scale or displayed measurement format.
An [X] in front of the "Show Trace 2" menu item indicates that the dual trace mode
is active.
In addition, the menu of the "Result Display" softkey expands. It now shows the
available measurement formats that can be applied to trace 2.

R&S FSH Network Analyzer Mode
Evaluating the Results
Operating Manual 1173.6275.12 - 31 203
For vector measurements, you can also display two traces in each diagram. This
way, you can view four results at the same time (S11, S12, S21, S22). For more
information on how to configure such a screen layout, see "Measuring the
Transmission".
Screen layout in dual trace mode
1 Result display trace 1
2 Result display trace 2
3 Measurement mode
4 Trace window 1
5 Trace information trace 1
- S-matrix
- calibration status
- measurement format
6 Trace window 2
7 Measurement format trace 2
8 Active trace indicator
After activating the second trace, trace 1 is always the active trace. Only the active
trace can be configured, while the other is passive.
► To activate trace 2, press the "Select Trace" softkey in the trace menu.
When pressing the "Select Trace" softkey, the R&S FSH switches between trace 1
and 2. The trace indicator shows the currently active trace:
After selecting trace 2, you can set the measurement parameters for trace 2, while
the first trace is passive.
Note that you can display all four S-parameters at the same time in dual trace
mode by displaying the transmission measurement in both directions in one
window and displaying the reflection measurement on both ports in the other
window.
For more information see "Performing Scalar Measurements" on page 188.

R&S FSH Network Analyzer Mode
Evaluating the Results
Operating Manual 1173.6275.12 - 31 204
You can also use the trace memory using the "Show" softkey in the "Trace" menu.
Restoring a saved trace is possible only for the currently active trace (i.e. screen 1 or
screen 2). For more information see "Working with Memory Traces" on page 117.
6.5.2 Configuring the Vertical Axis
Some results may not fit in the diagram area as it is configured in the default state of
the R&S FSH (for example measurements on amplifiers).
If you are performing measurements on an amplifier, you most likely have to change
the scaling of the vertical axis in order to see the complete transmission function.
The R&S FSH provides several ways to adjust the scaling of the vertical axis.
Changing the reference value
Changing the reference value works like an attenuation or gain in that it moves the
trace to another level. The R&S FSH adjusts the scale of the vertical axis accordingly.
The R&S FSH indicates the value and position of the current reference value with a
triangle at the vertical axis ( ). In the default state, it is 0 dB and its position is the
grid line at the top of the diagram.
The reference value only changes the 0 dB reference without actually attenuating or
amplifying the signal level.
When changing the reference value, make sure that you do not overload the
R&S FSH. As long as the trace is completely within the diagram area and the
reference position at the top of the diagram, the risk of an overload is eliminated.
► Press the AMPT key.
► Press the "Ref" softkey.
The R&S FSH opens an input field.
► Enter the reference value you need to see the trace completely.
The R&S FSH moves the trace accordingly, relabels the vertical axis and shows
the new 0 dB reference in the hardware settings display.

R&S FSH Network Analyzer Mode
Evaluating the Results
Operating Manual 1173.6275.12 - 31 205
Changing the reference position
Changing the reference position moves the position of the reference value up or down.
The reference position also moves the trace up or down. The levels and the reference
value, however, remain the same. The default reference position is the grid line at the
top of the diagram. The reference position is indicated by a triangle at the vertical axis
( ).
The reference position is a number between 0 and 10 with 0 being the grid line at the
bottom and 10 being the grid line at the top of the diagram.
► Press the AMPT key.
► Press the "/Ref Pos" softkey.
The R&S FSH opens an input field.
► Enter the new position of the reference value.
The R&S FSH moves the trace accordingly and moves the triangle to the new
position.
Changing the display range
The display range is the value range the vertical axis covers. The default display range
depends on the measurement format. For more information see "Selecting the
Measurement Format" on page 197.
When you change the display range, the reference value and position remain the
same. Merely the scale of the vertical axis is compressed or expanded.
► Press the AMPT key.
► Press the "Range" softkey.
► Select the display range you need from the submenu.
The R&S FSH adjusts the vertical axis accordingly.

R&S FSH Network Analyzer Mode
Evaluating the Results
Operating Manual 1173.6275.12 - 31 206
Automatic scaling of the vertical axis
All measurement formats except the Smith chart feature an automatic scale function.
If you use automatic scaling, the R&S FSH automatically sets the display range in a
way that the trace best fits on the display.
► In the "Range" submenu, select the "Auto Scale" menu item.
For the SWR measurement format, instead of selecting one of the predefined ranges,
you can also define the exact top and bottom values of the vertical axis.
► Press the AMPT key.
► Press the Range softkey.
► Select the "Scale Max" or "Scale Min" menu items to define the top or bottom
values of the vertical axis.
The R&S FSH adjusts the vertical axis accordingly.
6.5.3 Using Markers
The network analyzer mode also features markers. The functionality is similar to that of
the spectrum analyzer.
For more information see "Using Markers" on page 118.
6.5.4 Working with Channel Tables
The R&S FSH allows you to use channel tables in network analyzer mode.
► Press the FREQ key.
► Press the "Channel Table" softkey.
The R&S FSH opens the list of channel tables loaded into the R&S FSH via
R&S InstrumentView.
► Select the channel table you need.
The R&S FSH scans the channel table for the channels with the lowest and
highest frequencies and sets those as the start and stop frequency.
The R&S FSH already comes with an assortment of channel tables that you can use
without doing anything. If you want to test telecommunications standards that are not
listed, you can also build channel tables manually with the "Channel Table Editor" of
the R&S InstrumentView software package that is delivered with the R&S FSH. To use
one of those, you just have to copy the channel table to the R&S FSH.

R&S FSH Network Analyzer Mode
Evaluating the Results
Operating Manual 1173.6275.12 - 31 207
6.5.5 Using Limit Lines
When working with the magnitude format in the network analyzer, you can use limit
lines to set limits for level characteristics on the display that must not be exceeded.
You can create and edit limit lines with the R&S InstrumentView software and load
them into the R&S FSH via the USB or the LAN interface. The number of limit lines the
R&S FSH can store in its memory depends on the number of other data sets on the
R&S FSH.
For more information see "Managing Datasets" on page 30 und "Using Limit Lines" on
page 128.
6.5.6 Using Trace Mathematics
Trace mathematics that subtract one trace from another are available for most
measurement formats in the network analyzer mode.
For more information see "Using Trace Mathematics" on page 117.

R&S FSH Network Analyzer Mode
Vector Voltmeter (R&S FSH-K45)
Operating Manual 1173.6275.12 - 31 208
6.6 Vector Voltmeter (R&S FSH-K45)
With firmware option R&S FSH-K45 (order no. 1304.5658.02) you can use a R&S FSH
with tracking generator and VSWR bridge as a vector voltmeter.
A vector voltmeter performs reflection (S11) and transmission measurements (S21).
The tracking generator provides the signal source that generates an unmodulated
sinewave signal on a single frequency. Typical applications for a vector voltmeter are:
● adjustment of the electrical length of cables with a reflection measurement
● testing of the antenna elements of a phase-controlled antenna-array relative to a
reference antenna with a transmission measurement
► Press the MODE key.
► Press the "Network Analyzer" softkey.
► Press the MEAS key.
► Press the "Meas Mode" softkey.
► Select the "Vector Voltmeter" menu item.
The R&S FSH starts the vector voltmeter mode. It turns on the tracking generator
and the zero span mode.
Screen layout of the vector voltmeter.
1 Result display
2 Hardware settings
3 Results: magnitude
4 Results: phase
5 Vector voltmeter softkey menu

R&S FSH Network Analyzer Mode
Vector Voltmeter (R&S FSH-K45)
Operating Manual 1173.6275.12 - 31 209
6.6.1 Calibrating Measurements
To get the best and most accurate results, you have to calibrate the measurement. The
reflection and transmission measurement of the vector voltmeter each have their own
calibration procedures. To successfully calibrate the test setup, you have to connect
one or more calibration standards at the reference plane.
The process of calibration including the selection of a calibration kit works like that for
scalar or vector measurement. For more information see "Calibrating Measurements"
on page 182.
6.6.2 Performing Measurements
With the vector voltmeter you can measure the reflection on port 1 and the
transmission in reverse direction.
The example included here is based on a transmission measurement of a two-port
filter. The filter works in the frequency from of 1920 MHz to 1980 MHz.
Select the type of reflection measurement
► Press the "Result Display" softkey.
► Select the "Reflection Port 1" menu item for reflection measurements on port 1 or
the "Transmission Rev (Port 21)" menu item for transmission measurements in
reverse direction.
Define the frequency parameters
Before calibrating the measurement, you should define the frequency parameters to
avoid interpolation of the results.
► Press the FREQ key.
The R&S FSH opens an input field to set the center frequency.
► Enter a frequency of 1950 MHz.

R&S FSH Network Analyzer Mode
Vector Voltmeter (R&S FSH-K45)
Operating Manual 1173.6275.12 - 31 210
6.6.2.1 Performing Transmission Measurements
Calibrate the measurement for transmission measurements.
► Press the "Calibration" softkey.
► Select the "Transmission Rev
(Port 21)" menu item.
► Perform calibration. For more
information see "Performing
Calibration".
► Reconnect the DUT.
The R&S FSH shows the
characteristics of the DUT
(magnitude and phase) as
numerical values.
You can change the measurement configuration (e.g. the sweep time) or format
(see "Selecting the Measurement Format") without affecting the accuracy of the
measurement.
6.6.2.2 Performing Reflection Measurements
Calibrate the measurement for reflection measurements.
► Press the "Calibration" softkey.
► Select the "Reflection Port 1" menu item.
► Perform calibration. For more information see "Performing Calibration".
► Reconnect the DUT.
The R&S FSH shows the characteristics of the DUT (magnitude and phase) as
numerical values.
You can change the measurement configuration (e.g. the sweep time) or format
(see "Selecting the Measurement Format") without affecting the accuracy of the
measurement.
Note that for calibration to remain valid, frequency parameters, bandwidth and
attenuation have to remain the same.
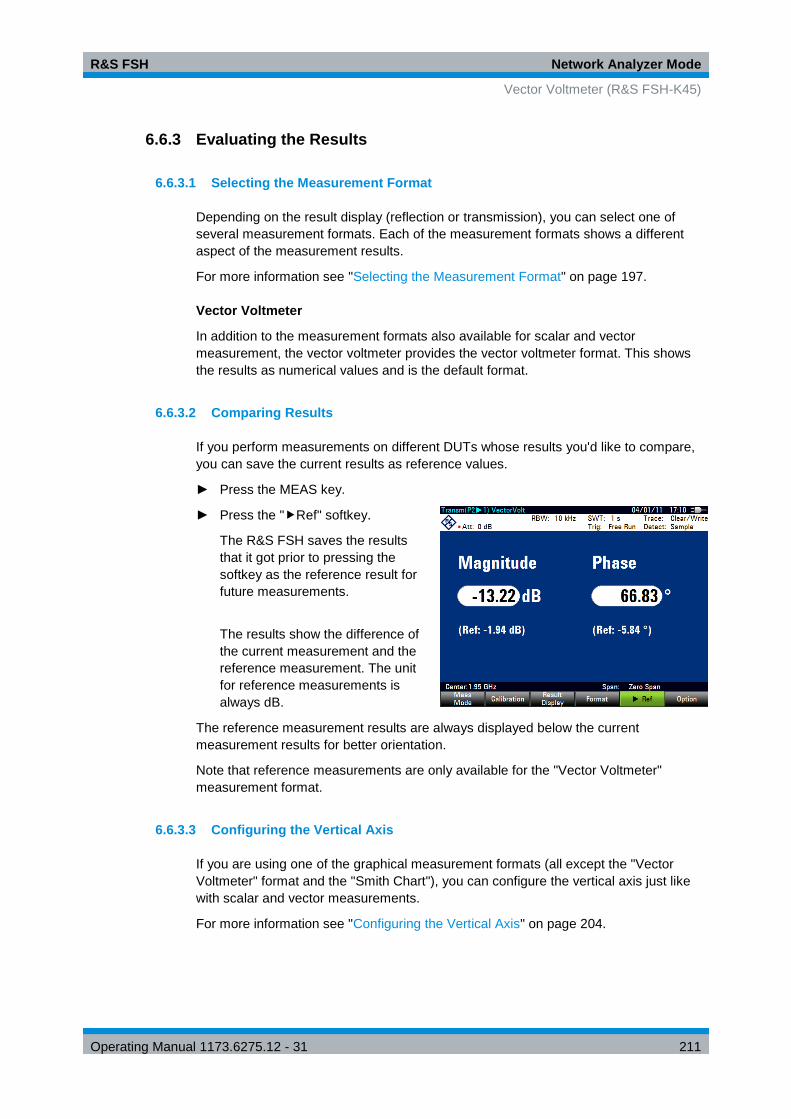
R&S FSH Network Analyzer Mode
Vector Voltmeter (R&S FSH-K45)
Operating Manual 1173.6275.12 - 31 211
6.6.3 Evaluating the Results
6.6.3.1 Selecting the Measurement Format
Depending on the result display (reflection or transmission), you can select one of
several measurement formats. Each of the measurement formats shows a different
aspect of the measurement results.
For more information see "Selecting the Measurement Format" on page 197.
Vector Voltmeter
In addition to the measurement formats also available for scalar and vector
measurement, the vector voltmeter provides the vector voltmeter format. This shows
the results as numerical values and is the default format.
6.6.3.2 Comparing Results
If you perform measurements on different DUTs whose results you'd like to compare,
you can save the current results as reference values.
► Press the MEAS key.
► Press the "Ref" softkey.
The R&S FSH saves the results
that it got prior to pressing the
softkey as the reference result for
future measurements.
The results show the difference of
the current measurement and the
reference measurement. The unit
for reference measurements is
always dB.
The reference measurement results are always displayed below the current
measurement results for better orientation.
Note that reference measurements are only available for the "Vector Voltmeter"
measurement format.
6.6.3.3 Configuring the Vertical Axis
If you are using one of the graphical measurement formats (all except the "Vector
Voltmeter" format and the "Smith Chart"), you can configure the vertical axis just like
with scalar and vector measurements.
For more information see "Configuring the Vertical Axis" on page 204.

R&S FSH Distance-to-Fault Mode (R&S FSH-K41)
Vector Voltmeter (R&S FSH-K45)
Operating Manual 1173.6275.12 - 31 212
7 Distance-to-Fault Mode (R&S FSH-K41)
Equipped with firmware option R&S FSH-K41 (order no. 1304.5612.02), you can
perform distance-to-fault measurements with your R&S FSH.
The distance-to-fault (DTF) mode provides functionality to measure cables for
mechanical defects in the system that cause a deterioration of the transmission quality.
The figure below shows some typical defects in a transmission system, including
defects on the cable.
The R&S FSH provides the necessary functionality to test the system equipment for its
characteristics and identify faults when it is being installed or maintained.
● Reflection Measurements on page 214
● Distance to Fault Measurements on page 215
● Spectrum Measurements on page 215
Test setup
A typical test setup to test cables and antennas includes the R&S FSH, an RF cable
(e.g. R&S FSH-Z320, order no. 1309.6600.00), a calibration standard (R&S FSH-Z28
or R&S FSH-Z29, order no. 1300.7804.03 and 1300.7504.03) and the cable under test.
Cable and antenna tests also require a tracking generator and VSWR bridge. The
tracking generator transmits a reference signal through the internal VSWR bridge to
the test port.
► Connect the RF cable to the RF input (port 1 or 2).
► Connect the test cable to the RF cable.

R&S FSH Distance-to-Fault Mode (R&S FSH-K41)
Vector Voltmeter (R&S FSH-K45)
Operating Manual 1173.6275.12 - 31 213
► For measurement on DUTs that need an external voltage supply (e.g. power
amplifiers), you can connect the supply voltage from a suitable AC power supply to
the BIAS Port 1 or use the internal bias.
By default, the R&S FSH is in spectrum analyzer mode after you have turned it on. To
switch to the DTF mode from another operating mode, proceed as follows.
► Press the MODE key.
► Press the "Distance-to-Fault" softkey.
The R&S FSH starts the DTF mode.
By default, the R&S FSH performs measurements on port 1. It however, also supports
measurements on port 2, but you have to configure those first.
► Press the "Meas Mode" softkey.
► Select the "DTF / Refl Measurement Port" menu item.
The R&S FSH opens a submenu.
► Select either "Port 1" or "Port 2".
Screen layout of the cable and antenna analyzer
1 Cable model
2 Hardware settings
3 Marker information
4 Status line:
- S-matrix
- Calibration status
- Measurement format
5 Trace window
6 Marker (blue line)
7 Cable length information
8 Cable frequency information
9 Cable test softkey menu
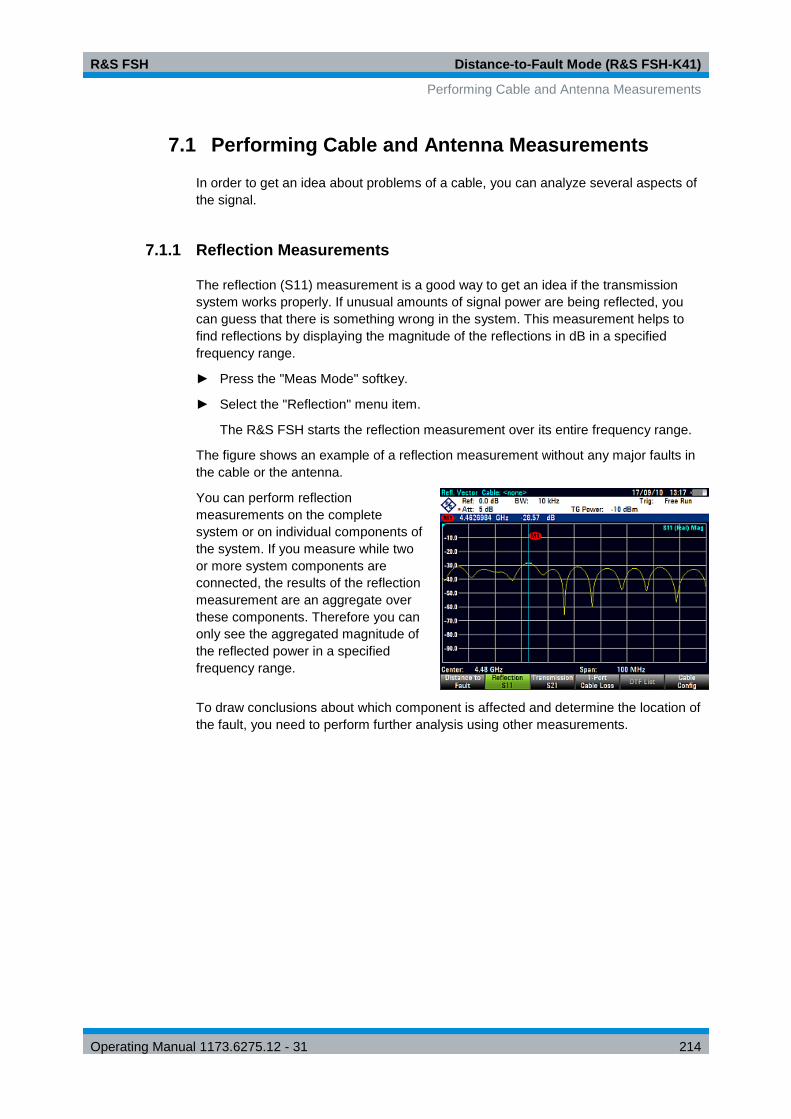
R&S FSH Distance-to-Fault Mode (R&S FSH-K41)
Performing Cable and Antenna Measurements
Operating Manual 1173.6275.12 - 31 214
7.1 Performing Cable and Antenna Measurements
In order to get an idea about problems of a cable, you can analyze several aspects of
the signal.
7.1.1 Reflection Measurements
The reflection (S11) measurement is a good way to get an idea if the transmission
system works properly. If unusual amounts of signal power are being reflected, you
can guess that there is something wrong in the system. This measurement helps to
find reflections by displaying the magnitude of the reflections in dB in a specified
frequency range.
► Press the "Meas Mode" softkey.
► Select the "Reflection" menu item.
The R&S FSH starts the reflection measurement over its entire frequency range.
The figure shows an example of a reflection measurement without any major faults in
the cable or the antenna.
You can perform reflection
measurements on the complete
system or on individual components of
the system. If you measure while two
or more system components are
connected, the results of the reflection
measurement are an aggregate over
these components. Therefore you can
only see the aggregated magnitude of
the reflected power in a specified
frequency range.
To draw conclusions about which component is affected and determine the location of
the fault, you need to perform further analysis using other measurements.

R&S FSH Distance-to-Fault Mode (R&S FSH-K41)
Performing Cable and Antenna Measurements
Operating Manual 1173.6275.12 - 31 215
7.1.2 Distance to Fault Measurements
The distance to fault (DTF) measurement determines the exact location of possible
faults in a transmission system. If you connect the end of the cable to the R&S FSH,
the DTF measurement shows you the exact distance to the fault (in meter or feet),
regardless by what the fault is caused. In addition, the measurement shows the degree
of the fault in dB. From this information, you can determine the component that has the
fault and its seriousness.
In order to determine the distance to a cable fault, the R&S FSH measures the
reflections of the cable under test in the frequency domain. The R&S FSH first
determines the magnitude of the reflections for a particular frequency by comparing the
phase of the reflected signal and a reference signal created by the tracking generator.
It then performs inverse fast fourier transformation (IFFT) on the signal that has been
received. In combination with the characteristics of the cable model, the R&S FSH is
able to determine the distance the reflections have been travelling.
Because of its sensitivity by first measuring in the frequency domain and subsequent
IFFT, the measurement is able to locate faults in a cable accurately. To keep this
accuracy, the R&S FSH also accounts for any attenuation that occurs over distance in
a cable.
If you are measuring the cable only, make sure to terminate the other end into a load.
► Press the "Meas Mode" softkey.
► Select the "DTF" menu item.
The R&S FSH calculates the
distance to cable faults.
The figure shows the results of a DTF
measurement. The peaks that the
trace shows at the marker positions
are possible faults. Depending on the
distance, you can also get an idea of
the component that is defective.
Marker 1, for example, shows a defect in the cable. Marker 2 shows a fault at the end
of the cable, probably a bad or loose connection.
7.1.3 Spectrum Measurements
The spectrum measurement provides an overview of the spectrum of the DUT without
the necessity to change the operating mode. This measurement is well suited for a
quick check if there are any interfering signals that may impair results before you start
the actual measurement.
► Press the "Meas Mode" softkey.
► Select the "Spectrum" menu item.
The R&S FSH shows the current spectrum.

R&S FSH Distance-to-Fault Mode (R&S FSH-K41)
Performing Cable and Antenna Measurements
Operating Manual 1173.6275.12 - 31 216
7.1.4 Selecting the Measurement Format
You can select several measurement formats for each measurement. The
measurement format selects the way the results are displayed.
● Magnitude (dB Mag)
This is the default format. It shows the magnitude of the results in dB.
● VSWR
The VSWR shows the standing wave ratio in a cartesian diagram. The VSWR is
the ratio of the maximum voltage and the minimum voltage that occur in an
electrical transmission line. The VSWR format is available for DTF and reflection
measurements.
● Reflection Coeffcient
Shows the reflection coefficient of the DUT.
The reflection coefficient is the ratio of the amplitude of a reflected wave and that
of the incidental wave that occur in an electrical transmission line.
● Cable Loss
The cable loss measurement is a
reflection measurement on an
open cable. It evaluates the
amount of energy that a signal
loses while traveling through a
cable. .The amount of lost energy
depends on the frequency and the
length of the cable
The R&S FSH shows the result
(graphically) over the specified
frequency range (span) in dB.
The numerical result is the average cable loss over the specified span. The image
above shows a typical cable loss result, with a steadily declining loss over the
selected frequency range and several maximums and minimums.
By default, the R&S FSH evaluates the cable loss over its entire frequency range
(full span of the R&S FSH). When you reduce the span, make sure to define a
span that is appropriate for the measurement, especially for high center
frequencies, and consider the cable length and the wavelength of the selected
center frequency. For a typical cable loss trace, you should select a span that is
large enough to evaluate at least one peak and one minimum. Otherwise, the
result might not be valid.
If the cable loss is constant over a large span (for example in case of low center
frequencies), you can select any span.
Note that if the cable loss is greater than 20 dB, you are better off using the S21
measurement, because the cable loss measurement might yield invalid results.
The cable loss format is available for reflection measurements.

R&S FSH Distance-to-Fault Mode (R&S FSH-K41)
Performing Cable and Antenna Measurements
Operating Manual 1173.6275.12 - 31 217
The following pictures show the results of a reflection measurement in Magnitude
format (left side) and VSWR format (right side).

R&S FSH Distance-to-Fault Mode (R&S FSH-K41)
Performing Cable and Antenna Measurements
Operating Manual 1173.6275.12 - 31 218
7.1.5 Calibrating Measurements
To get the best and most accurate results, you have to calibrate the measurement. The
R&S FSH provides several calibration methods. You will need one of the available
calibration standards R&S FSH-Z28, -Z29 (order no. 1300.7804.03 and 1300.7504.03)
or R&S ZV-Z121 (order no. 1164.0496.02/.03).
To successfully calibrate the test setup, you have to connect the calibration standard at
the reference plane, usually the output of the RF measurement cable.
Calibration is performed over the R&S FSH's entire frequency range (full span). This
eliminates the need for recalibration when you change a parameter or select a different
cable or DUT.
Calibration also remains valid after turning off the R&S FSH or changing into another
operating mode as calibration data is saved in the internal memory of the R&S FSH. If
you save the measurement in a dataset, calibration data is part of that dataset. When
you restore the dataset and perform the same measurement again, you do not have to
recalibrate the R&S FSH.
7.1.5.1 Calibration States
The calibration states are the same as for the network analyzer. For more information
see "Calibration States" on page 182.
7.1.5.2 Calibration Methods
In distance-to-fault mode, the calibration method is a full 1-port calibration. For more
information see "Calibration Methods" on page 184.
7.1.5.3 Performing a Full 2-Port Calibration
For a description of a complete calibration procedure see "Performing Calibration" on
page 185

R&S FSH Distance-to-Fault Mode (R&S FSH-K41)
Configuring Cable and Antenna Tests
Operating Manual 1173.6275.12 - 31 219
7.2 Configuring Cable and Antenna Tests
For valid measurement results, you need to specify the characteristics of the cable
under test like model or frequency range.
7.2.1 Selecting the Cable Model
To determine the speed of propagation, and therefore the precise distance to any
faults, you have to specify the cable model that you want to test.
The R&S FSH already comes with an assortment of predefined cable models that you
can use without doing anything. If you want to test a cable that is not listed, you can
also define cable models manually, either directly on the R&S FSH or with the "Cable
Model Editor" of the R&S InstrumentView software package that is delivered with the
R&S FSH.
7.2.1.1 Selecting a Predefined Cable Model
► Press the MEAS key.
► Press the "Cable Config" softkey.
► Select the "Select Cable Model"
menu item.
The R&S FSH opens the file
manager to select the cable
model.
► Select the cable model that you
are testing.
► Confirm the selection with the
"Select" softkey.
The R&S FSH shows the currently selected cable model in the diagram header.
► Select the "Deselect Cable Model" item from the "Cable Config" menu if you want
to perform measurements without using a particular cable model.
7.2.1.2 Creating a Cable Model
The R&S FSH provides two ways to define customized cable models.
The first way is to define a cable model with the "Cable Model Editor" that is part of the
R&S InstrumentView software package. The R&S InstrumentView is delivered with the
R&S FSH. With this software, you can define a cable model on a PC and then transfer
it to the R&S FSH. Then you can select it just like any other predefined cable model.
For more information see "Managing Datasets" on page 30.

R&S FSH Distance-to-Fault Mode (R&S FSH-K41)
Configuring Cable and Antenna Tests
Operating Manual 1173.6275.12 - 31 220
If you do not have access to a PC, but still need a cable model that is not stored on the
R&S FSH, you can also define the characteristics of a cable temporarily on the
R&S FSH itself. It is not possible to save these in a data set, however. They are lost as
soon as you change them or load another cable model.
► Press the MEAS key.
► Press the "Cable Config" softkey.
► Select the "Define User Model" menu item.
A submenu opens.
► Select the "Frequency" menu item.
► Enter the frequency of the cable you are testing.
► Select the "Velocity" menu item.
► Enter the cable velocity.
► Select the "Loss" menu item.
► Enter the cable loss.
You can now perform measurements on the temporary cable definition.
Note that as soon as you change any cable parameter or load another cable
model, the temporary data is lost and you have to define it again if you have to
perform further measurements.
After you have defined the cable characteristics, you still have to activate the use of the
customized cable.
► Press the "Cable Config" softkey.
► Select the "[ ] User Model" menu item.
If the R&S FSH uses the customized cable model, it shows an [X] at the "User
Model" menu item.
7.2.1.3 Working with a DTF List
The DTF list shows the results of the distance to fault measurement in numerical form.
► Press the MEAS key.
► Press the "DTF Settings" softkey.
► Press the "DTF List" softkey.
The R&S FSH opens a table that lists the peaks it has found during the
measurement.

R&S FSH Distance-to-Fault Mode (R&S FSH-K41)
Configuring Cable and Antenna Tests
Operating Manual 1173.6275.12 - 31 221
The table contains the following information.
● Peak
Shows the peak the results refer to.
● Distance
Shows the distance from the measurement plane to the peak.
● Return Loss
Shows the magnitude of the peak.
To limit the information in the list, you can define a threshold for the DTF list, so that
only peaks above a certain level are included in the list.
► Press the MEAS key.
► Press the "DTF Settings" softkey.
► Press the "DTF List Threshold" softkey.
The R&S FSH opens an input field to define a threshold in dB.
► Enter the threshold you want.
The R&S FSH now only shows the peaks that are above the level you have
entered.

R&S FSH Distance-to-Fault Mode (R&S FSH-K41)
Configuring Cable and Antenna Tests
Operating Manual 1173.6275.12 - 31 222
7.2.2 Configuring the Horizontal Axis
The FREQ key contains all necessary functions to define frequency and distance
parameters when performing cable measurements.
The contents of the menu depend on the currently selected measurement.
7.2.2.1 Setting the Frequency Range for DTF Measurements
In the default setting, the R&S FSH automatically selects a center frequency of
1.8 GHz (R&S FSH4) or 4 GHz (R&S FSH8) and a distance of 20 m. The R&S FSH
optimizes the settings for the best resolution, if you change the cable length.
If you have to keep the current frequency settings, it is best to define a manual span.
Setting the frequency span
When setting the frequency range, it is best to first set the span and then the center
frequency.
► Press the SPAN key.
► Press the "Manual Span" softkey.
By default, the R&S FSH automatically calculates the best span ("Auto Span") for
the best length resolution. If the required span is too large for the current center
frequency, the R&S FSH sets the center frequency to the smallest possible
frequency.
► Enter the span you need manually.
The R&S FSH sets the new span. Note that the maximum span you can set
depends on the maximum cable distance you have defined and is never greater
than the span calculated by the "Auto Span" function. The minimum span that you
can set is 10 MHz.
Setting the displayed frequency range
After you have selected the span, you can set a particular frequency range whose
results the R&S FSH displays.
In the default configuration, the R&S FSH adjusts the DTF start and DTF stop
frequency according to the span and the center frequency. The distance from center
frequency to the start and stop frequency is the same. Alternatively, you can directly
set a DTF start and DTF stop frequency.
► Press the FREQ key.
► Press the "Center Freq" softkey.
► Enter the frequency that you'd like to be in the center of the horizontal axis.
The R&S FSH adjusts the frequency range according to span and center
frequency.
► Press the FREQ key.

R&S FSH Distance-to-Fault Mode (R&S FSH-K41)
Configuring Cable and Antenna Tests
Operating Manual 1173.6275.12 - 31 223
► Press the "Start Freq" or the "Stop Freq" softkey.
► Enter the start frequency and stop frequency you need.
The R&S FSH adjusts the frequency range according to your settings.
Note that the distance from start to stop frequency has to be equal to the span.
The R&S FSH adjusts the values if you enter a frequency range that is not the
same as the span.
7.2.2.2 Selecting the Cable Length
The R&S FSH uses the cable length to determine the span for the measurement. The
longer the cable under test, the smaller the span. Together with the cable model, the
cable length is also the basis for the calculation of the cable attenuation. The cable
attenuation in turn is necessary for a correct calculation of the reflection magnitude at
the cable fault. The cable length also defines the scale of the horizontal axis. In the
default configuration, the R&S FSH shows the whole cable length.
If the cable length you have set is shorter than the actual cable length, the R&S FSH
does not display the faults of the whole cable. A reflection at the end of the cable will
not be shown. However, deliberately entering a cable length that is too short is a good
way to increase measurement accuracy for a fault that is near to the measurement
plane. If the entered cable length is greater than the actual length, the results for
lengths beyond the actual cable length are obsolete because they are caused by
multiple reflections.
► Press the MEAS key.
► Press the "Cable Length" softkey.
► Enter the length of the cable.
The range is from 3 m to 1500 m (about 10 ft to 5000 ft.). If you do not know the exact
length of the cable, define a length that is about 20 to 50 % larger than the best
estimate.
The maximum cable length that is suitable for measurements depends on the cable
attenuation. Since the test signal must be routed twice through the cable, the signal
reflected at the cable end arrives with twice the cable attenuation in attenuated form at
the input of the power divider. Dynamic range decreases with increasing cable length.
If the cable attenuation exceeds 10 dB, the R&S FSH displays a warning indicating that
the cable attenuation is too high. It also indicates the maximum recommended cable
length to get accurate results.

R&S FSH Distance-to-Fault Mode (R&S FSH-K41)
Configuring Cable and Antenna Tests
Operating Manual 1173.6275.12 - 31 224
7.2.3 Configuring the Amplitude Characteristics
The amplitude menu contains all settings related to the level display.
7.2.3.1 Adjusting the Scale of the Diagram
The R&S FSH provides several options to improve the vertical scaling of the
measurement diagram.
The unit of the level axis is dB.
Setting the reference value
The reference value defines the amplitude of the reference line. The unit of the
reference is dB.
The R&S FSH indicates the position of the reference value with a yellow triangle at the
vertical axis ( ).
When you change the reference value, the R&S FSH adjusts the labels of the vertical
axis. Changing the reference value changes the vertical position of the trace. It does
not change the position of the reference line.
► Press the AMPT key.
► Press the "Ref" softkey.
► Enter the reference value you want or move the reference with the rotary knob.
The R&S FSH sets up the display accordingly.
Defining the display range
The display range defines the scale of the vertical axis and therefore the amplitude
between two horizontal grid lines.
The unit depends on the measurement format.
When you change the display range, you can increase or decrease the amplitude the
R&S FSH displays and, e.g. include signal parts that are outside the displayed screen
area. The position of the reference value and the trace do not change.
► Press the AMPT key.
► Press the "Range" softkey.
► Select one of the menu items to select the display range you want.

R&S FSH Distance-to-Fault Mode (R&S FSH-K41)
Configuring Cable and Antenna Tests
Operating Manual 1173.6275.12 - 31 225
Adjusting the vertical axis automatically
The R&S FSH provides an automatic scaling routine that scales the vertical axis in a
way that the results fit ideally on the display. The R&S FSH does this by determining
the minimum and maximum trace values and scaling the vertical axis according to
these values.
► Press the AMPT key.
► Press the "Range" softkey.
► Select the "Auto Scale" menu item.
The R&S FSH performs automatic adjustment of the vertical axis.
Setting the reference position
The reference position defines the position of the reference line in the diagram. The
reference position is a linear value between 0 and 10. Each value represents one
horizontal grid line of the diagram. 0 corresponds to the top grid line and 10
corresponds to the bottom grid line.
When you change the reference position, the R&S FSH also shifts the position of the
trace by the magnitude of the reference position change. It has no effect on the
reference value itself.
► Press the AMPT key.
► Press the "Ref Pos" softkey.
► Enter the reference position you want.
The R&S FSH moves the trace accordingly.
7.2.3.2 Setting the Attenuation
The R&S FSH provides functions to attenuate the signal at the RF input.
► Press the "RF Att/Amp/Imp" softkey.
► Select the "Manual:" menu item or one of the automated attenuation modes.
► Enter the attenuation of the signal at the RF input.
You can set an RF attenuation in the range from 0 dB to 40 dB in 5 dB steps.

R&S FSH Distance-to-Fault Mode (R&S FSH-K41)
Configuring Cable and Antenna Tests
Operating Manual 1173.6275.12 - 31 226
7.2.4 Configuring the Tracking Generator
If your R&S FSH features a tracking generator, you can define several characteristics
of the generated signal.
► Press the AMPT key.
► Press the "TG Settings" softkey.
You can define the level of the generated signal as an absolute level or an
attenuation (value relative to 0 dBm).
► Select the “TG Power” menu item to define an absolute level.
► Select the “TG Attenuation” menu item to define a relative level.
An input of 10 dB, for example, corresponds to an attenuation of -10 dBm.
In addition, you can define an arithmetic level offset, for example to take external
attenuators into account.
► Press the "TG Settings" softkey.
► Select the “TG Power Offset” menu item to define a level offset.
Note the the level offset has no effect on the actual signal level.
Tracking generator output level
Using an output level of 0 dBm (or a receiver attenuation of 0 dB) for S12 or S21
measurements can cause an overload at the RF input. It is therefore recommended to
use an output level of -10 dBm (default) or lower for these measurements.
This especially applies to measurements on amplifiers.
R&S FSH Distance-to-Fault Mode (R&S FSH-K41)
Analyzing Measurement Results
Operating Manual 1173.6275.12 - 31 227
7.3 Analyzing Measurement Results
7.3.1 Working with Traces
For more information see "Working with Traces" on page 113.
7.3.2 Using Markers
For more information see "Using Markers" on page 118.
When measuring the distance-to-fault, the horizontal unit is meter or feet. For all other
measurements the horizontal axis is the frequency axis. The unit of the vertical axis is
dB for distance-to-fault and cable loss measurements and dBm for all others.
Sorting markers
A special marker function available for distance-to-fault measurements is that you can
sort them in ascending order.
► Press the MKR key.
► Press the "Sort Markers" softkey.
The R&S FSH sorts the markers in ascending order with marker 1 being positioned on the lowest distance. The marker values remain the same.
7.3.3 Using Display and Limit Lines
The display and limit line functionality in DTF mode is the same as that of the spectrum
analyzer mode.
For more information on using the display line see "Using Display Lines" on page 127.
For more information on using limit lines see "Using Limit Lines" on page 128.
R&S FSH Receiver Mode (R&S FSH-K43)
Analyzing Measurement Results
Operating Manual 1173.6275.12 - 31 228
8 Receiver Mode (R&S FSH-K43)
Equipped with firmware option R&S FSH-K43 (order no. 1304.5635.02), you can
perform receiver and channel measurements (or scans) with your R&S FSH.
In receiver mode, the R&S FSH measures the power level of a particular frequency or
a customized set of frequencies instead of sweeping over (parts of) the frequency
spectrum. The R&S FSH shows the scan results in result displays that have been
designed for just such measurement tasks.
The receiver mode also adds the necessary functions like bandwidths or detectors to
perform measurements according to CISPR.
By default, the R&S FSH is in the operating mode you have been in last after you have
turned it on. To switch to the receiver mode from another operating mode, proceed as
follows.
► Press the MODE key.
► Press the "Receiver Mode" softkey.
The R&S FSH starts the receiver mode in single frequency measurement mode.

R&S FSH Receiver Mode (R&S FSH-K43)
Selecting the Measurement Mode
Operating Manual 1173.6275.12 - 31 229
8.1 Selecting the Measurement Mode
In receiver mode, the R&S FSH features two measurement modes.
● Fixed Frequency / Channel
● Frequency Scan / Channel Scan
Fixed measurement mode is designed for measurements on single frequencies. Scan
measurement mode performs scans on a defined set of frequencies.
8.1.1 Performing Single Frequency Measurements
The R&S FSH shows the result of the single frequency measurement in a result
display that contains three main elements.
● Measurement (or receive) frequency
● Power level measured at the receive frequency
● Horizontal bargraph that graphically represents the currently measured power
level.
In the default state, the R&S FSH performs the measurement on a single receive
frequency. If it instead shows the result display for a frequency scan, you can access
the single frequency result display manually.
► Press the MEAS key.
► Press the "Fixed Freq" softkey.
The R&S FSH shows the result display for single frequency measurements.
Screen layout of the bargraph result display
1 Measurement mode
2 Operating mode
3 Header table
4 Receive frequency and corresponding power level (numerical)
5 Bargraph
6 Receiver softkey menu

R&S FSH Receiver Mode (R&S FSH-K43)
Selecting the Measurement Mode
Operating Manual 1173.6275.12 - 31 230
8.1.1.1 Defining the Receive Frequency
In single frequency measurement mode, the R&S FSH determines the power level of a
single frequency only. The available frequency range depends on the R&S FSH model
you are using.
► Press the FREQ key.
► Press the "Freq" softkey.
Enter the frequency you want to measure.
For a quick change of frequencies with the rotary knob, define a frequency stepsize.
► Press the "Freq Stepsize" softkey.
Enter a frequency stepsize.
For measurements on systems that use channels instead of single frequencies, you
can also load a channel table and measure the channel power.
► Press the "Channel Mode" softkey.
The R&S FSH opens a dialog box to select a channel table.
For measurements based upon a channel table, you can select a single channel
instead of a single receive frequency.
► Press the "Channel" softkey.
► Enter a channel number.
8.1.1.2 Customizing the Bargraph Aspects
The bargraph is a graphical representation of the power level with one dimension, the
power level of the receive freuqency. The R&S FSH provides several ways to
customize the aspects of the bargraph.
Selecting the Unit
By default, the unit the R&S FSH uses in receiver mode for the measured power levels
in general is dBµV. In addition to dBµV, the receiver mode provides other units as well.
► Press the AMPT key.
► Press the "Unit" softkey.
Select the unit you need.
Defining the Bargraph Scale
The scale of the bargraph is defined by the reference level and the level range.
The reference level is the maximum power level that the bargraph displays. You should
set the reference level in a way that the signal level does not exceed the reference
level and high enough so that the signal does not disappear in the inherent noise.
► Press the AMPT key.
► Press the "Ref Level" softkey.

R&S FSH Receiver Mode (R&S FSH-K43)
Selecting the Measurement Mode
Operating Manual 1173.6275.12 - 31 231
► Define the reference level that best fits the measurement.
In the default state, the reference level corresponds to the level at the right of the
bargraph.
The reference level position is
shown by a triangle in the
bargraph scale label.
You can move the reference position to another position on the scale.
► Press the AMPT key.
► Press the "Range/Ref Pos" softkey.
► Select the "Ref Position 10…" menu item.
The R&S FSH opens an input field to define the reference position.
► Enter the number of the grid line you want the reference level at.
The range is from 0 to 10. "0" corresponds to the left side of the bargraph, "10"
corresponds to right side of the bargraph.
You can also select the level range that the bargraph covers. In the default state, the
bargraph covers 100 values of the unit you have selected (e.g. 100 dBµV).
► Press the "Range / Ref Pos" softkey.
The R&S FSH opens a submenu to select the level range.
► Select the level range you need.
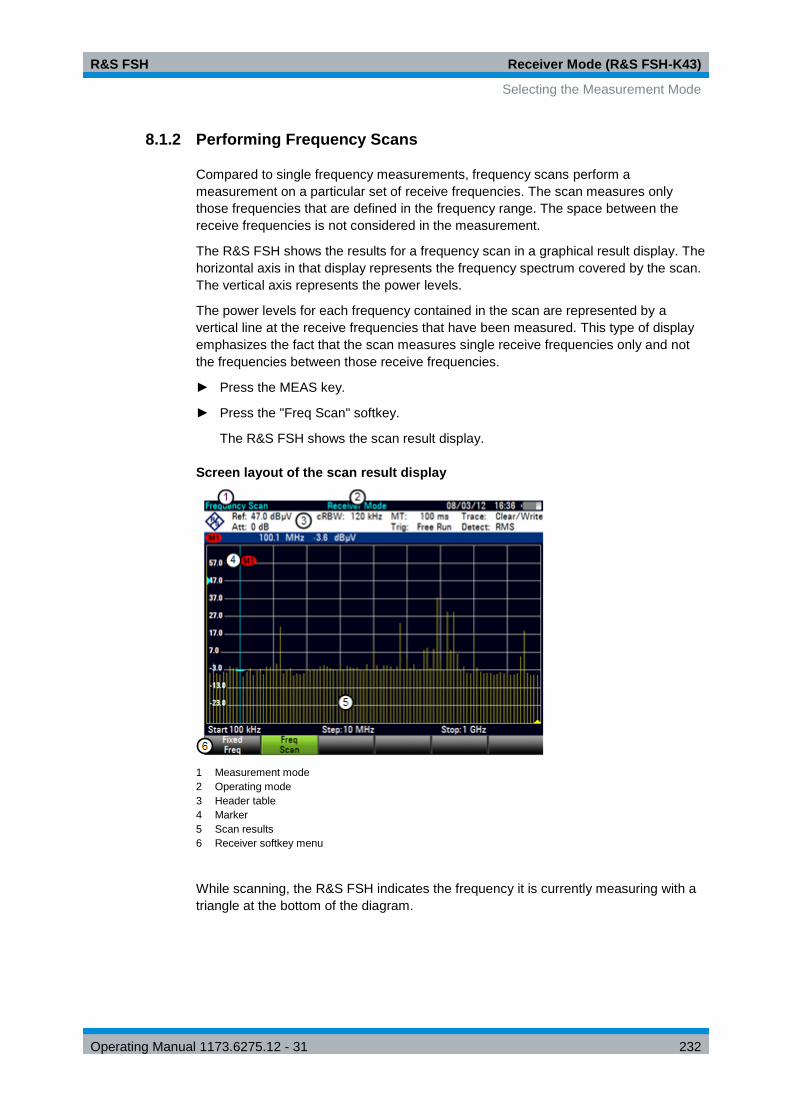
R&S FSH Receiver Mode (R&S FSH-K43)
Selecting the Measurement Mode
Operating Manual 1173.6275.12 - 31 232
8.1.2 Performing Frequency Scans
Compared to single frequency measurements, frequency scans perform a
measurement on a particular set of receive frequencies. The scan measures only
those frequencies that are defined in the frequency range. The space between the
receive frequencies is not considered in the measurement.
The R&S FSH shows the results for a frequency scan in a graphical result display. The
horizontal axis in that display represents the frequency spectrum covered by the scan.
The vertical axis represents the power levels.
The power levels for each frequency contained in the scan are represented by a
vertical line at the receive frequencies that have been measured. This type of display
emphasizes the fact that the scan measures single receive frequencies only and not
the frequencies between those receive frequencies.
► Press the MEAS key.
► Press the "Freq Scan" softkey.
The R&S FSH shows the scan result display.
Screen layout of the scan result display
1 Measurement mode
2 Operating mode
3 Header table
4 Marker
5 Scan results
6 Receiver softkey menu
While scanning, the R&S FSH indicates the frequency it is currently measuring with a
triangle at the bottom of the diagram.

R&S FSH Receiver Mode (R&S FSH-K43)
Selecting the Measurement Mode
Operating Manual 1173.6275.12 - 31 233
Selecting the trace style
The trace style defines the way the trace looks.
► Press the TRACE key.
► Press the "Trace Style" softkey.
► Select the trace style you prefer from the menu.
The R&S FSH provides two trace styles in receiver mode.
● "Lines"
The "Lines" trace style shows a vertical line for each receive frequency as
described above.
● "Polygon"
The "Polygon" trace style shows the trace as a continuous, horizontal line. The
gaps between the actual measurement frequencies are interpolated.
8.1.2.1 Defining the Scan Range
The scan range defines the frequency range that the scan takes place in. Therefore,
you have to define a start and stop frequency for the scan range and a scan step size.
The step size defines the (equidistant) space between the receive frequencies and
thus, in combination with the start and stop frequency, the number of receive
frequencies considered in the scan.
Example:
If you define a scan range from 100 MHz to 200 MHz with a step size of 10 MHz, the
receive frequencies that are analyzed are 100 MHz, 110 MHz, 120 MHz, …, 200 MHz.
Overall, this scan range defines a set of 11 receive frequencies.
► Press the SPAN key.
► Press the "Scan Start" softkey.
Enter the frequency you want the scan to start at.
► Press the "Scan Stop" softkey.
Enter the frequency you want the scan to stop at.
► Press the "Scan Step" softkey.
Enter the step size you want to apply. The R&S FSH starts the scan as soon as
you have finished defining the scan range.
Performing a channel scan
Instead of a frequency scan, you can also perform a channel scan. A channel scan is
based on the contents of a channel table. In case of measurements based on a
channel table, the set of receive frequencies (or channels) is defined in a channel
table.

R&S FSH Receiver Mode (R&S FSH-K43)
Selecting the Measurement Mode
Operating Manual 1173.6275.12 - 31 234
In a channel table, you can define the
receive frequencies as you wish. The
number of receive frequencies
depends on the number of channels
included in the channel table and there
may even be gaps between the
receive frequencies.
► Press the FREQ key.
► Press the "Channel Mode" softkey.
or
► Press the "Channel Table" softkey.
The R&S FSH opens a dialog box to select the channel table.
For more information on working with channel tables see "Working with Channel
Tables" on page 131.
8.1.2.2 Using Markers
The scan measurement in receiver mode features the same marker functionality as
that in Spectrum mode.
For more information see "Using Markers and Deltamarkers" on page 118.

R&S FSH Receiver Mode (R&S FSH-K43)
Configuring Measurements in Receiver Mode
Operating Manual 1173.6275.12 - 31 235
8.2 Configuring Measurements in Receiver Mode
In addition to the single frequency measurement and the scan measurement, the
receiver mode also adds features in accordance with EMI measurements.
8.2.1 Selecting Detectors for EMI Measurements
The receiver mode provides several types of detectors also available in other operating
modes. In addition, it adds the average and quasi peak detectors.
● Max Peak
If the max peak detector is active, the R&S FSH displays only the maximum power
of the signal that was measured during the measurement time.
● Average
If the average detector is active, the R&S FSH calculates and displays the (linear)
average power of the signal that was measured during the measurement time.
● RMS
If the RMS detector is active, the R&S FSH calculates and displays the RMS
power of the signal that was measured during the measurement time.
● Quasi Peak
If the quasi peak detector is active, the R&S FSH evaluates the signal in a way that
complies to the requirements defined by CISPR16.
It is designed for EMI measurements and especially useful for the evaluation of
pulse shaped spurious emissions.
When you use the quasi peak detector, the R&S FSH uses a particular evaluation
curve or bandwidth depending on the CISPR band.
- CISPR band A (frequencies < 150 kHz): 200 Hz bandwidth
- CISPR band B: (frequencies from 150 kHz to 30 MHz): 9 kHz bandwidth
- CISPR band C/D: (frequencies from 30 MHz to 1 GHz): 120 kHz bandwidth
- Frequencies > 1GHz: 120 kHz bandwidth
Bandwidth selection for the quasi peak detector
If you select the quasi peak detector, the R&S FSH automatically select a 6 dB filter
bandwidth depending on the measurement frequency.
If you select a 3 dB bandwidth while using the quasi peak detector, the R&S FSH
deactivates the quasi peak detector.
R&S FSH Receiver Mode (R&S FSH-K43)
Configuring Measurements in Receiver Mode
Operating Manual 1173.6275.12 - 31 236
► Press the TRACE key.
► Press the "Detector" softkey.
► Select the detector you want to use.
For more information on detectors in general, see "Selecting the Detector" on page
114.
Selecting the trace mode and working with memory traces
For more information on trace modes and memory traces see "Selecting the Trace Mode" and "Working with Memory Traces" on pages 113 and 117.

R&S FSH Receiver Mode (R&S FSH-K43)
Configuring Measurements in Receiver Mode
Operating Manual 1173.6275.12 - 31 237
8.2.2 Selecting the Measurement Bandwidths for EMI Measurements
The receiver mode adds 6 dB resolution bandwidths to the 3 dB resolution bandwidths
already available in other operating modes. The 6 dB bandwidths are special
bandwidths that are necessary for measurements according to CISPR16.
If automatic selection of the CISPR bandwidth is on, the R&S FSH selects an
appropriate CISPR bandwidth, depending on the receive frequency.
● Frequencies < 150 kHz: 200 Hz CISPR bandwidth
● Frequencies from 150 kHz to 30 MHz: 9 kHz CISPR bandwidth
● Frequencies from 30 MHz to 1 GHz: 120 kHz CISPR bandwidth
● Frequencies > 1 GHz: 1 MHz CISPR bandwidth
You can also select a 3 dB or 6 dB bandwidth manually.
► Press the BW key.
► Press the "Manual RBW" softkey to select a 3 dB bandwidth.
or
► Press the "Manual CISPR BW" to select a 6 dB bandwidth.
► Select the bandwidth you need with the rotary knob or by entering the corresping
number.
► Press the "Auto CISPR BW" to select the 6 dB bandwidth automatically according
to the list above.

R&S FSH Receiver Mode (R&S FSH-K43)
Configuring Measurements in Receiver Mode
Operating Manual 1173.6275.12 - 31 238
8.2.3 Defining the Measurement Time
The measurement time is the time that the R&S FSH collects data at each
measurement frequency to calculate the results for that frequency according to the
detector you have selected.
You can define a measurement time between 5 ms and 1000 s.
► Press the SWEEP key.
► Press the "Meas Time" softkey.
► Define the measurement time you need.
Selecting the scan mode
When you enter the receiver mode, the R&S FSH repeatedly measures the receive
frequency or set of frequencies over the measurement time you have defined. If you
want to perform a single measurement or scan only, select single scan mode.
► Press the SWEEP key.
► Press the "Single Scan" softkey to perform a single scan or measurement.
► Press the "Cont Scan" softkey to perform a continuous scan or measurement.
When you select single scan mode, the R&S FSH performs the measurement once
over the measurement time and then stops. In case of frequency scans, the
R&S FSH performs one measurement on each receive frequency in the scan
range over the measurement time and stops when it has measured all frequencies
that are part of the scan range.
8.2.4 Working with Traces
In Receiver mode, the R&S FSH provides several ways to configure the trace display,
like the trace mode or trace mathematics.
For more information see
● "Selecting the Trace Mode" on page 113
● "Working with a Second Trace" on page 116
● "Working with Memory Traces" on page 117
● "Using Trace Mathematics" on page 117
● "Performing Frequency Scans" on page 232
8.2.5 Using Transducers
For more information see "Using Transducer Factors" on page 132.
8.2.6 Using Limit Lines
For more information see "Using Limit Lines" on page 128.

R&S FSH Digital Modulation Analyzer
Configuring Measurements in Receiver Mode
Operating Manual 1173.6275.12 - 31 239
9 Digital Modulation Analyzer
In digital modulation analyzer operating mode, the R&S FSH is able to demodulate
signals of several telecommunications technologies. Thus it can provide results for
modulation characteristics, channel characteristics or information about the signal
quality.
The digital modulation analyzer consists of several firmware options. Each option
covers a specific telecommunications standard with functionality especially designed
for that technology.
● "Measurements on GSM Signals" on page 248
● "Measurements on 3GPP FDD Signals" on page 256
● "Measurements on CDMA2000 Signals" on page 271
● "Measurements on 1xEV-DO Signals" on page 284
● "Measurements on TD-SCDMA Signals" on page 290
● "Measurements on LTE Signals" on page 306
Each option of the digital modulation analyzer comes with a result summary. This
result display summarizes the most relevant results that you will need for successful
base station tests. For some options there is also an extended version that features
additional functionality like graphic results.

R&S FSH Digital Modulation Analyzer
General Settings of the Digital Modulation Analyzer
Operating Manual 1173.6275.12 - 31 240
9.1 General Settings of the Digital Modulation Analyzer
Several settings and numerical results are available for all mobile radio standards
supported by the digital modulation analyzer.
● "General Settings in the Result Summary" on page 240
● "Trace Mode Selection" on page 243
9.1.1 General Settings in the Result Summary
The result summary includes some basic settings of the analyzer. The contents are
similar to those of the "Hardware Settings" in the spectrum analyzer. Most of these
settings are available for every application.
This chapter provides a reference for those general settings that are available for all
applications of the digital modulation analyzer.
Center
Shows the current center frequency of the R&S FSH.
For valid results, the center frequency of the R&S FSH and the signal have to be the
same.
► Press the FREQ key.
► Press the "Center Freq" softkey.
► Enter the frequency you need.
Channel
Shows the number of the channel currently selected. The number depends on the
selected band(class).
Band
Shows the name of the band class you have selected.
► Press the FREQ key.
► Press the "Freq Mode" softkey.
► Select the "Channel" menu item.
The R&S FSH opens a dialog box to select a LTE channel table or band class.
► Select the channel table you need with the "Select" softkey.
The R&S FSH now applies the channel table to the measurement.
R&S FSH Digital Modulation Analyzer
General Settings of the Digital Modulation Analyzer
Operating Manual 1173.6275.12 - 31 241
Transducer
Shows the name of the transducer if one is in use.
For more information see Using Transducer Factors on page 132.
Ref Level
Shows the current reference level of the R&S FSH.
The reference level is the power level the R&S FSH expects at the RF input. If "Auto
Low Noise" or "Auto Low Distortion" is on, the R&S FSH uses it to determine the
attenuation and preamplification internally.For more information see "Setting the RF
Attenuation" on page 102.
Keep in mind that the power level at the RF input is the peak enevelope power in case
of signals with a high crest factor like LTE.
To get the best dynamic range, you have to set the reference level as low as possible.
At the same time, make sure that the maximum signal level does not exceed the
reference level. If it does, it will overload the A/D converter, regardless of the signal
power. Measurement results may deteriorate (e.g. EVM). This applies especially for
measurements with more than one active channel near the one you are trying to
measure (± 6 MHz).
Note that the signal level at the A/D converter may be stronger than the level the
R&S FSH displays, depending on the current resolution bandwidth. This is because the
resolution bandwidths are implemented digitally after the A/D converter.
In case of an IF overload, the R&S FSH shows a corresponding warning in the diagram
area ( ).
If you are not sure about the signal strength, you can avoid an IF overload and
determine the maximum level manually or perform an automatic level adjustment.
► Press the MEAS key.
► Press the "Level Adjust" softkey.
The R&S FSH performs a series of measurements to determine the ideal reference
level for the current signal.
Note that the current signal level does not necessarily have to correspond to the
reference level after an automatic adjustment. This is because the R&S FSH
measures a frequency range that is larger than current span and adjusts the
reference level to the measured peak which may be outside the visible span.
An automatic level adjustment will set the attenuation mode to "Manual" if it has
been set to "Auto Low Noise" or "Auto Low Distortion" previously.
You can also determine the reference level manually.
► Perform a measurement in spectrum mode with the largest resolution bandwidth
(3 MHz) and video bandwidth (3 MHz).
► Activate the peak detector.
The trace maximum corresponds to the ideal reference level.
For more information see "Setting the Reference Level" on page 100.
R&S FSH Digital Modulation Analyzer
General Settings of the Digital Modulation Analyzer
Operating Manual 1173.6275.12 - 31 242
Ref Offset
Shows the current reference level offset.
For more information see "Setting a Reference Offset" on page 101.
Att(enuation)
Shows the current RF attenuation of the R&S FSH.
For more information see "Setting the RF Attenuation" on page 102.
Preamp(lification)
Shows the current state of the preamplifier.
For more information see "Using the Preamplifier" on page 103.
Sweep
Shows the current sweep mode.
You can select from
● Single: data is captured and results are displayed one at a time.
● Continuous: data is captured and results are displayed continuously.
For more information see "Selecting the Sweep Mode" on page 108.
"Sync Not Found" / "Sync OK"
Indicates whether synchronization was successful or not.
To successfully synchronize the R&S FSH to the signal, you have to enter the correct
values for center frequency, reference level or, in case of, for example, a WCDMA
signal, the correct scrambling code.
To indicate successful synchronization, the R&S FSH shows the label.
If the synchronization was not successful, the R&S FSH shows the
label.
Position
Shows the current GPS coordinates if you have connected a GPS receiver and have
activated the GPS receiver. If not, this field stays empty.
For more information see the Quick Start Guide.

R&S FSH Digital Modulation Analyzer
General Settings of the Digital Modulation Analyzer
Operating Manual 1173.6275.12 - 31 243
9.1.2 Trace Mode Selection
The digital modulation analyzer supports trace modes for various result displays
available for those applications (numerical and graphical).
● Clear/Write
In its default state, the R&S FSH overwrites the results after each sweep.
● Average
The results are based on the moving average over several sweeps.
The R&S FSH calculates the (moving) average of the power levels over a
particular number of sweeps in the range from 2 to 999.
If you are using the average mode,
the R&S FSH adds the "avg" label
to numerical results.
● Max Hold
The results are based on the maximum values that have been measured.The
result is updated only if a higher value has been measured for a particular result.
If you are using the max hold mode, the R&S FSH adds the "max" label to
numerical results.
● Min Hold
The results are based on the minimum values that have been measured.The result
is updated only if a lower value has been measured for a particular result.
If you are using the min hold mode, the R&S FSH adds the "min" label to
numerical results.
In the graphical results (for example the Spectrum Overview), the trace modes have
the same effects as in Spectrum mode. For more information on trace modes see
"Selecting the Trace Mode" on page 113.
Carrier frequency error
Note that the "Carrier Frequency Error" result supports the average trace mode only if
you are using the Precision Reference Frequency R&S FSH-Z114.
Min Hold and Max Hold trace modes are not supported by the Carrier Frequency Error
result.

R&S FSH Digital Modulation Analyzer
General Settings of the Digital Modulation Analyzer
Operating Manual 1173.6275.12 - 31 244
► Press the TRACE key.
► Press the "Trace Mode" softkey.
The R&S FSH opens a submenu to select the trace mode.
► Select the trace mode you want to work with.
If you have selected the average trace mode ("Average: 10" menu item), the R&S FSH
opens an input field to set the number of sweeps the R&S FSH includes in the
averaging.
► Enter the number of sweeps to include in the averaging.
In continuous sweep mode, the R&S FSH now calculates the moving average over
the number of sweeps you have specified. In single sweep mode, it stops the
measurement after finishing the sweeps and averages the traces.

R&S FSH Digital Modulation Analyzer
General Result Displays of the Digital Modulation Analyzer
Operating Manual 1173.6275.12 - 31 245
9.2 General Result Displays of the Digital Modulation
Analyzer
The R&S FSH provides several result displays that are available for all digital
modulation options.
There are two methods to view and analyze the spectrum of the signal you are
currently measuring: the spectrum overview and the isotropic antenna result displays.
Both result displays are integrated into the digital modulation options, so you do not
have to switch modes if you want to have a quick glance at the spectrum. For a
detailed analysis of the signal, however, you should still use the spectrum analyzer
operating mode.
The screen layout and contents of the spectrum result displays are the same as those
of the spectrum analyzer mode.
The Spectrum Overview
The Spectrum Overview provides an overview of the frequency spectrum with limited
functionality.
The Spectrum Overview is meant for
fast measurements that give you a
rough idea about the signal's
frequency and level characteristics. To
maintain high measurement speed, the
R&S FSH analyzes one FFT and
shows the results of the signal and its
surrounding frequencies. Thus, you
should use this result display for
situations when measurement speed is
an issue, not accuracy.
In addition to the "RF Channel Power" and the "Power Within Span" results, the
Spectrum Overview shows the Occupied Bandwidth. The channel bandwidth depends
on the selected mobile standard.
While using the spectrum overview, you can only set the resolution bandwidth and the
span.
► Press the "Result Display" softkey.
► Select the "Spectrum Overview" menu item.
Note that the Spectrum Overview also features miscellaneous trace modes to display
different aspects of the measurement results. For more information see "Selecting the
Trace Mode" on page 113.

R&S FSH Digital Modulation Analyzer
General Result Displays of the Digital Modulation Analyzer
Operating Manual 1173.6275.12 - 31 246
The Isotropic Antenna Result Display
The isotropic antenna result display also provides an overview of the spectrum.
The results of measurements with an
isotropic antenna are based on data
from the three axes of the antenna.
When performing measurements with
an isotropic antenna, the R&S FSH
performs a measurement on each of
the three antenna axes and then
averages the results to draw the trace.
Measurement speed will decrease
because of the multiple
measurements.
You can see the results for each antenna axis (x, y and z) and for the channels that are
part of the signal in a table above the diagram area.
► Press the "Result Display" softkey.
► Select the "Isotropic Antenna" menu item.
For more information on isotropic antennas see "Using Isotropic Antennas" on page
94.
While using the isotropic antenna result display, you can set up the measurement as
usual.
Results in other result displays
When you measure with an isotropic antenna, the other result displays (for example
the numerical result summary) always show the results that were measured in the x-
direction.

R&S FSH Digital Modulation Analyzer
General Result Displays of the Digital Modulation Analyzer
Operating Manual 1173.6275.12 - 31 247
Limits
A limit check tests the actual results against a set of predefined values to see if the
measurement results are inside a specified boundary. In the Limits result display, the
R&S FSH shows the results of the limit check.
If the results are in the allowed range of values, the limit check has passed. The results
are highlighted green.
If the results violate one of the limits,
the limit check has failed. The results
are highlighted red.
A complete limit check usually consists
of the limit definition of several results.
The complete limit check only passes
if every individual limit check also
passed. In that case, the R&S FSH
shows "LIMITS PASSED" in the result
display. If even one limit has failed, the
R&S FSH shows "LIMITS FAILED".
By default, the R&S FSH tests against default limits. These limits have been defined
according to the standard.
► Press the "Result Display" softkey.
► Select the "Limits" menu item.
You can create and edit digital modulation limits with the R&S InstrumentView software
package and then transfer them into the internal memory of the R&S FSH.
For more information see "Managing Datasets" on page 30.

R&S FSH Digital Modulation Analyzer
Measurements on GSM Signals
Operating Manual 1173.6275.12 - 31 248
9.3 Measurements on GSM Signals
Equipped with the software application R&S FSH-K10, you can perform measurements
on downlink GSM signals in accordance to the 3GPP standard with your R&S FSH.
► Press the MODE key
► Press the "Dig Mod Analyzer" softkey.
► Select the "GSM / EDGE BTS" menu item.
The R&S FSH starts the signal analysis.
After you have started the measurement, the R&S FSH starts recording the signal you
have applied. It records an amount of data that makes sure that at eight GSM time
slots are captured. The signal analysis itself contains exactly eight time slots.
The R&S FSH performs various general measurements based on the complete frame
as well as measurements based on an individual slot. It then shows the results in
tabular form in the "Result Summary" display or graphically in various diagrams.
To get highest measurement accuracy, it is necessary to synchronize the reference
frequency of the R&S FSH with the base station via the EXT REF IN input or the
external GPS frequency reference.
The GSM option provides several result displays to display the measurement results.
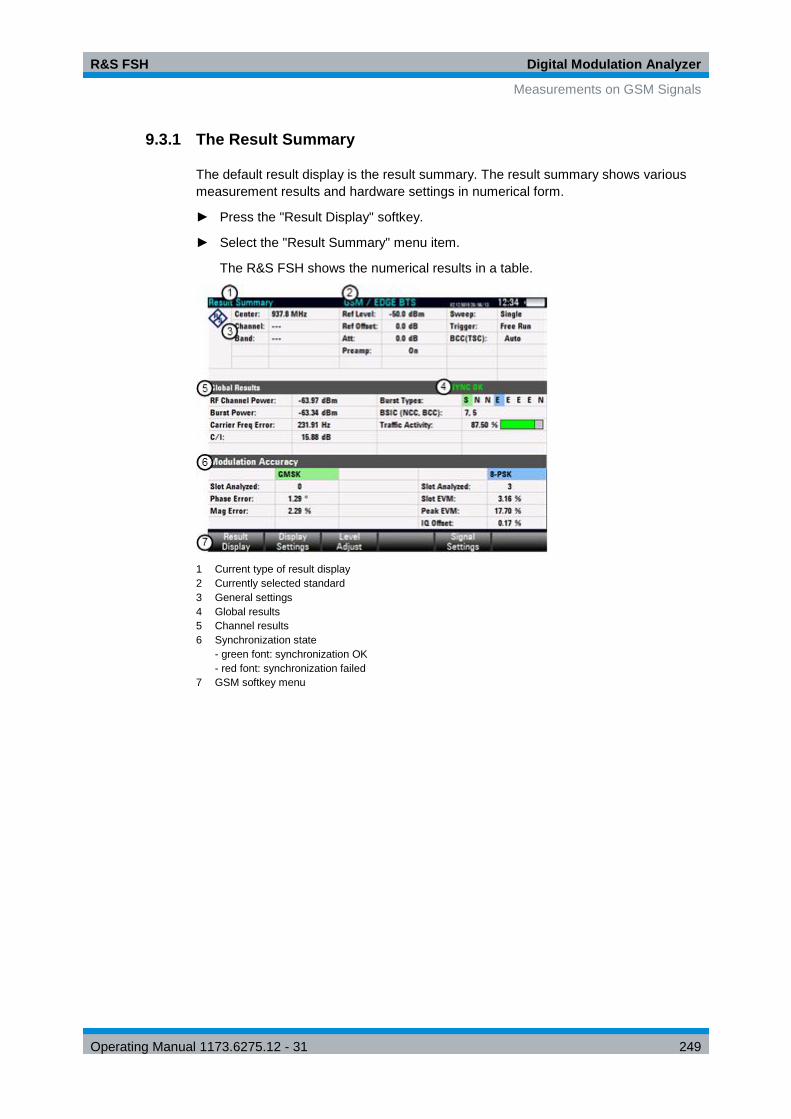
R&S FSH Digital Modulation Analyzer
Measurements on GSM Signals
Operating Manual 1173.6275.12 - 31 249
9.3.1 The Result Summary
The default result display is the result summary. The result summary shows various
measurement results and hardware settings in numerical form.
► Press the "Result Display" softkey.
► Select the "Result Summary" menu item.
The R&S FSH shows the numerical results in a table.
1 Current type of result display
2 Currently selected standard
3 General settings
4 Global results
5 Channel results
6 Synchronization state
- green font: synchronization OK
- red font: synchronization failed
7 GSM softkey menu

R&S FSH Digital Modulation Analyzer
Measurements on GSM Signals
Operating Manual 1173.6275.12 - 31 250
9.3.1.1 General Settings
For more information see "General Settings of the Digital Modulation Analyzer" on
page 240.
In addition the application features some settings specific to the 3GPP standard.
For more information on each type of parameter see "Configuring the Measurement"
on page 267.
Trigger
Shows the current trigger mode.
For more information see "Working with Trigger Functionality" on page 108.
BSIC (NCC, BCC)
Shows the way you have selected to determine the training sequence.
In case of manual selection, the field shows the actual number of the training
sequence. In case of automatic selection, the field shows an "Auto" label.
For more information see "Selecting the Training Sequence" on page 255.
Slot #
Shows the way you have selected to determine the slot that is analyzed.
In case of manual selection, the field shows the actual number of the selected slot. In
case of automatic selection, the field shows an "Auto" label.
9.3.1.2 Global Results
Global results contain various measurement results of the composite signal. These
results evaluate the total signal over the period of one slot.
RF Channel Power
Total power of the signal in dBm in the 200 kHz bandwidth around the center
frequency.
Burst Power
Shows the signal power in the first time slot (or burst) that has been found.
Carrier Frequency Error
Shows the frequency error in relation to the current center frequency of the R&S FSH.
For more information see "Selecting the Unit of the Carrier Frequency Error" on page
255.
Concerning uncertainty of the reference frequency of the GPS receiver, refer to the
data sheet.
R&S FSH Digital Modulation Analyzer
Measurements on GSM Signals
Operating Manual 1173.6275.12 - 31 251
C/I (8PSK modulated slots only)
Shows the ratio of the desired carrier power to the undesired signal power
(interference) in dB.
The C/I is an estimate derived from the EVM value.
Burst Types
Shows the modulation type for each slot in the analyzed frame.
Each of the eight slots in the GSM frame may have a different modulation. Thus, the
result is made up out of eight characters, e.g. "F I N I N I N I".
The characters have the following meanings.
● D: Dummy burst
● E: Normal burst with 8PSK modulation (EDGE)
● F: Frequency correction burst
● I: Idle burst
● N: Normal burst with GMSK modulation
● S: Synchronization burst
BSIC Found
Shows the Base Station Identity Code.
The BSIC is a code that uniquely identifies a base station. It is made up out of two
separate numbers.
● The first number is the network color code (NCC).
● The second number is the base station color code (BCC). This number is the same
as the training sequence (TSC).
Traffic Activity
Percentage of traffic slots with data.
9.3.1.3 Modulation Accuracy
Modulation accuracy results contain various results that are specific to a modulation
type (GMSK and 8PSK).
Slot Analyzed
Shows the currently analyzed GMSK or 8PSK time slot.
The currently analyzed time slot is always the first time slot the R&S FSH could find for
the corresponding modulation type. If the frame contains no slots with a GMSK or
8PSK modulation, the R&S FSH shows no results for that modulation type.

R&S FSH Digital Modulation Analyzer
Measurements on GSM Signals
Operating Manual 1173.6275.12 - 31 252
Phase Error (GMSK modulated slots only)
Shows the phase error of the analyzed time slot in degree.
The R&S FSH calculates the phase error over the useful part of the burst. The useful
part of a burst is defined in 3GPP TS 45.002.
A possible residual frequency error resulting from a mismatch between the reference
frequency of the R&S FSH and the base station is compensated.
Mag(nitude) Error (GMSK modulated slots only)
Shows the magnitude error of the analyzed time slot in %.
The R&S FSH calculates the magnitude error over the useful part of the burst. The
useful part of a burst is defined in 3GPP TS 45.002.
Slot EVM (8PSK modulated slots only)
Shows the Error Vector Magnitude (EVM) of the analyzed slot in %.
The EVM is defined as the ratio of the mean error power of the signal to the power of
an ideal reference signal.
Peak EVM (8PSK modulated slots only)
The Peak EVM is the peak value of the EVM of all symbols in the useful part
(excluding tail symbols) of the analyzed slot. The RMS EVM is the root mean square
value of the EVM of all symbols in the useful part (excluding tail symbols) of the
analyzed slot.
I/Q Offset (8PSK modulated slots only)
Shows the DC offset of the analyzed time slot in %.

R&S FSH Digital Modulation Analyzer
Measurements on GSM Signals
Operating Manual 1173.6275.12 - 31 253
9.3.2 The Burst Power Result Display
If you equip the R&S FSH with option R&S FSH-K10E, the Burst Power result display
becomes available.
The Burst Power result display shows the power of the signal over time. You can
choose to display the power over a single and complete GSM frame (4.615 ms) or over
a single timeslot (about 567 µs)
This result display is designed to check if the power and timing of the bursted signals
meet the requirements of the standard.
In order to capture a complete frame, you can apply a trigger from a GPS device or
another external trigger.
Screen layout of the burst power result display
1 Current type of result display
2 Currently selected standard
3 Global results
4 Diagram area
5 Modulation type for each slot
6 GSM softkey menu

R&S FSH Digital Modulation Analyzer
Measurements on GSM Signals
Operating Manual 1173.6275.12 - 31 254
Global results
For more information on the general results shown above the diagram area see
"Global Results" on page 250.
Diagram area
The diagram area contains the graphical representation of the power over time.
hen you display the complete frame, the result display also contains information about
the modulation (or burst type) applied to the slots that are displayed. This information is
shown in colored bars (one for each slot) at the bottom of the diagram area. The
R&S FSH supports detection of the following burst types.
● 8PSK (normal burst EDGE)
● Dummy burst
● Frequency correction burst
● Idle burst (no modulation)
● NB (normal burst GMSK)
● Synchronization burst

R&S FSH Digital Modulation Analyzer
Measurements on GSM Signals
Operating Manual 1173.6275.12 - 31 255
9.3.3 Configuring the Measurement
9.3.3.1 Selecting the Training Sequence
The training sequence (or midamble) is a known bit sequence required to synchronize
the user equipment and the base station. The number of bits that carry the training
sequence depend on the modulation. They are transmitted in the center of the GSM
burst.
The standard defines eight training sequences (numbered 0 to 7). The R&S FSH is
able to determine the training sequence in a burst automatically. Alternatively, you can
select the training sequence manually.
Manual selection of the training sequence may become necessary if two base stations
operate on the same frequency, for example. In that case, you can select to measure
one base station rather than the other.
► Press the "Signal Settings" softkey.
► Select either the "TSC Manual…" or "TSC Auto" menu item.
In case you have selected the "Manual" menu item, the R&S FSH opens an input field
to select a particular training sequence.
9.3.3.2 Selecting the Unit of the Carrier Frequency Error
If possible, you should synchronize the receiver and the transmitter.
The carrier frequency error can have the unit Hz or ppm.
► Press the MEAS key.
► Press the "Display Settings" softkey.
► Select the "Hz" or "ppm" menu item.
The R&S FSH shows the carrier frequency error in the unit you have selected.

R&S FSH Digital Modulation Analyzer
Measurements on 3GPP FDD Signals
Operating Manual 1173.6275.12 - 31 256
9.4 Measurements on 3GPP FDD Signals
Equipped with the software application R&S FSH-K44, you can perform measurements
on WCDMA signals in accordance to the 3GPP standard with your R&S FSH.
You can expand the functionality by adding the R&S FSH-K44E firmware application.
This application performs code domain power measurements on downlink WCDMA
signals according to the standard.
► Press the MODE key
► Press the "Dig Mod Analyzer" softkey
► Select "3GPP WCDMA BTS" menu item.
The R&S FSH starts the signal analysis.
When starting a measurement, the R&S FSH first records a section of the signal that
lasts 20 ms (or 2 WCDMA frames). From this information, it gets all necessary
information for further analysis of the WCDMA signal.
The R&S FSH performs various measurements on a WCDMA slot in general as well as
measurements on specific channels. When you perform measurements on slot level,
you can either analyze a single slot or over all of the 15 slots of one frame.
Measurements on slot level include the power level, error vector magnitude (EVM), the
code domain error and the frequency error. To get sufficient measurement accuracy, it
is necessary to synchronize the reference frequency of the base station and the
R&S FSH via the EXT REF IN input.
In addition, you can analyze the following channel types in more detail:
● Common Pilot Channel (CPICH)
Note: This channel is required by the channel configuration; without it,
synchronization is not possible.
● Primary Common Control Physical Channel (P-CCPCH)
● Primary Synchronization Channel (P-SCH)
● Secondary Synchronization Channel (S-SCH)
For the CPICH and P-CCPCH channels the R&S FSH measures the power level and
the Ec/Io. For the P-SCH and S-SCH channels, the R&S FSH measures the power
level.
The 3GPP option provides several result displays to display the measurement results.

R&S FSH Digital Modulation Analyzer
Measurements on 3GPP FDD Signals
Operating Manual 1173.6275.12 - 31 257
9.4.1 The Result Summary
The default result display is the result summary. The result summary shows various
measurement results and hardware settings in numerical form.
► Press the "Result Display" softkey.
► Select the "Result Summary" menu item.
The R&S FSH shows the numerical results in a table.
Availability of measurement results
Note that some results and support of HSDPA and HSPA+ channels are available only
with option R&S FSH-K44E.
For more information see the data sheet.
1 Current type of result display
2 Currently selected standard
3 General settings
4 Global results
5 Channel results
6 Synchronization state
- green font: synchronization OK
- red font: synchronization failed
7 3GPP WCDMA softkey menu

R&S FSH Digital Modulation Analyzer
Measurements on 3GPP FDD Signals
Operating Manual 1173.6275.12 - 31 258
9.4.1.1 General Settings
For more information see "General Settings of the Digital Modulation Analyzer" on
page 240.
In addition the application features some settings specific to the 3GPP standard.
For more information on each type of parameter see "Configuring the Measurement"
on page 267.
Scrambling Code
Shows the way you have selected to determine the scrambling code.
In case of manual selection, the field shows the actual number of the scrambling code.
In case of automatic selection, the field shows an "Auto" label.
Antenna Div(ersity)
Shows the currently selected antenna diversity.
P-CPICH Slot
Shows the slot number the results are displayed for.
Ch(annel) Search
Shows the status of the channel search.
9.4.1.2 Global Results
Global results contain various measurement results of the composite signal. These
results evaluate the total signal over the period of one slot.
Channel Power
Shows the power of the complete signal in dBm.
Carrier Frequency Error
Shows the frequency error in relation to the current center frequency of the R&S FSH.
The absolute frequency error is the sum of the frequency error of the R&S FSH and
that of the device under test. If the frequency error is more than 1 kHz, the R&S FSH is
not able to synchronize with the signal. If possible, you should synchronize the receiver
and the transmitter.
I/Q Offset
Shows the DC offset of the signal in %.
This value is valid only when the R&S FSH is in channel search mode.

R&S FSH Digital Modulation Analyzer
Measurements on 3GPP FDD Signals
Operating Manual 1173.6275.12 - 31 259
I/Q Imbalance
Shows the I/Q Imbalance of the signal in %.
This value is valid only when the R&S FSH is in channel search mode.
Composite EVM
Shows the Error Vector Magnitude in %.
The EVM is defined as the ratio of the mean error power of the signal to the power of
an ideal reference signal. To calculate the mean error power, the root mean square
average (of the real and imaginary parts of the signal) is used.
This value is valid only when the R&S FSH is in channel search mode.
Active Channels
Shows the number of active channels in the signal.
Scr Code Found
Shows the number of the primary and secondary scrambling code, regardless if it has
been found automatically or entered manually.
Occupied Bandwidth
Shows the occupied bandwidth of the signal in Hz.
You can control if the occupied bandwidth is measured or not. By default, it is not.
► Press the MEAS key.
► Press the "Meas Settings" softkey.
► Select the "[ ] Occupied Bandwidth" menu item.
The R&S FSH determines the occupied bandwidth in addition to the other global
results. When the measurement has been turned on, the menu item is marked by
an [X].
Peak CDE (15 ksps)
Shows the Peak Code Domain Error of the signal in dB.
The Peak Code Domain Error is defined as the maximum code domain error power
that occurs in the measurement. The code domain error is the difference in power of
the test signal and an ideal reference signal.
This value is valid only when the R&S FSH is in channel search mode.
Avg. RCDE (64QAM)
Shows the Average Relative Code Domain Error of the signal.
Note that only channels with a 64QAM modulation are considered in this
measurement.
This value is valid only when the R&S FSH is in channel search mode.

R&S FSH Digital Modulation Analyzer
Measurements on 3GPP FDD Signals
Operating Manual 1173.6275.12 - 31 260
9.4.1.3 Channel Results
Channel results contain various results that are specific to one or more channels.
P-CPICH Power
Shows the power of the P-CPICH in dBm.
P-CPICH Ec / Io
Shows the ratio of the power of the pilot channel to the total power of the signal.
Therefore this value shows the usable part of the signal.
P-CPICH Symbol EVM rms
Shows the averaged (root mean square) EVM on symbol level of the P-CPICH.
P-CCPCH Power
Shows the power of the P-CCPCH in dBm.
The abbreviation in brackets shows if it is the absolute power or the power in relation to
the pilot channel (P-CPICH).
P-CCPCH Ec / Io
Shows the ratio of the power of the control channel to the total power of the signal.
Therefore this value shows the usable part of the signal.
P-CCPCH Symbol EVM rms
Shows the averaged (root mean square) EVM on symbol level of the P-CCPCH.
P-SCH Power
Shows the power of the P-SCH in dBm.
The abbreviation in brackets shows if it is the absolute power or the power in relation to
the pilot channel (P-CPICH).
S-SCH Power
Shows the power of the S-SCH in dBm.
The abbreviation in brackets shows if it is the absolute power or the power in relation to
the pilot channel (P-CPICH).

R&S FSH Digital Modulation Analyzer
Measurements on 3GPP FDD Signals
Operating Manual 1173.6275.12 - 31 261
9.4.2 The Code Domain Analyzer
If you equip the R&S FSH with option R&S FSH-K44E, code domain analysis becomes
available to visualize the results in a diagram.
► Press the "Result Display" softkey.
► Select the "Code Domain Power" menu item.
The R&S FSH starts the code domain analyzer.
Screen layout of the code domain power result display
1 Current type of result display
2 Currently selected standard
3 Header table
4 Diagram header
5 Diagram area
6 WCDMA softkey menu

R&S FSH Digital Modulation Analyzer
Measurements on 3GPP FDD Signals
Operating Manual 1173.6275.12 - 31 262
9.4.2.1 Header Table
The header table contains an assortment of settings already discussed in the section
about the result summary. For more information see "The Result Summary" on page
257.
In addition, it contains the following information.
RBW
Shows the currently selected resolution bandwidth.
For more information see "Setting the Resolution Bandwidth" on page 104.
Trace mode
Shows the currently selected trace mode.
Clear/Write and Max Hold are available for 3GPP measurements.
For more information see "Selecting the Trace Mode" on page 113.
9.4.2.2 Diagram Header
The diagram header shows the results for individual code channels.
Code channel
Shows the number of the code channel the results are displayed for.
For more information see "Selecting the Slot and Code Channel" on page 269.
Slot
Shows the slot number.
For more information see "Selecting the Slot and Code Channel" on page 269.
Symbol rate
Shows the symbol rate of the currently selected code channel.
Channel power
Shows the power of the complete signal.
Power
Shows the power of the currently selected code channel. The result is either in
absolute values or relative to the P-CPICH channel.
If more than one code belongs to a channel, the R&S FSH shows the power of the
complete channel.
For more information see "Changing the Code Power" on page 270.
R&S FSH Digital Modulation Analyzer
Measurements on 3GPP FDD Signals
Operating Manual 1173.6275.12 - 31 263
Composite EVM
Shows the EVM of the complete signal.
9.4.2.3 Diagram Area
The Code Domain Power result display contains the measurement results in graphic
form. It shows the power of all codes in the signal. In the graph, each bar represents
one code channel. A complete channel may consist of more than one code.
The displayed codes have different colors. The color of the code depends on the state
of the channel it belongs to.
● Yellow: active code (channels)
● Turquoise: inactive (code channels)
● Red: currently selected code (channel)
The power of the codes is a relative value. The reference power is the power of the
pilot channel. You can also display the absolute powers of the code channels. For
more information see "Changing the Code Power" on page 270.
R&S FSH Digital Modulation Analyzer
Measurements on 3GPP FDD Signals
Operating Manual 1173.6275.12 - 31 264
9.4.3 The Code Domain Channel Table
If you equip the R&S FSH with option R&S FSH-K44E, the code domain channel table
becomes available to visualize the channel structure of the signal.
The code domain channel table shows various parameters and measurement results
on (code) channel level.
Screen layout of the code domain channel table result display
1 Current type of result display
2 Currently selected standard
3 Header table
4 Synchronization state and GPS information
- green font: synchronization OK
- red font: synchronization failed
5 Global results
6 Channel table
7 WCDMA softkey menu

R&S FSH Digital Modulation Analyzer
Measurements on 3GPP FDD Signals
Operating Manual 1173.6275.12 - 31 265
9.4.3.1 Header Table
The header table contains various settings already discussed in the sections above.
For more information see "General Settings of the Digital Modulation Analyzer" on
page 240 and "The Result Summary" on page 257.
9.4.3.2 Global Results
The global results include information about the complete signal.
Channel Power
Shows the power of the complete signal.
Active Channels
Shows the number of the currently measured channels.
9.4.3.3 Channel Table
The channel table is made up out of seven columns that show various information
about each channel. The number of rows depends on the number of channels that are
currently active. If a channel occupies more than one code, the results correspond to
all codes in the channel.
Channel Type
Type of code channel.
All code channels that the R&S FSH is able to recognize are shown with the correct
channel type and spreading factor.
Channels with the label CHAN are active code channels whose type could not be
detected. Codes that are inactive are not shown.
Chan#.SF
Code channel number including the spreading factor (in the form <Channel>.<SF>).
Symb. Rate (ksps)
Symbol rate that the code channel is transmitted with (7.5 ksps to 960 ksps).
T Offs (chips)
Shows the timing offset of the code channel in chips.
Pilot Bits
Shows the number of pilot bits the code channel contains.

R&S FSH Digital Modulation Analyzer
Measurements on 3GPP FDD Signals
Operating Manual 1173.6275.12 - 31 266
Status
Status display of the code channel.
Power Abs (dBm)
Absolute power of the code channel in dBm.
Power Rel to CPICH (dB)
Relative power of the code channel in dB. The reference channel is the C-PICH or the
total signal, depending on the reference power you have selected.

R&S FSH Digital Modulation Analyzer
Measurements on 3GPP FDD Signals
Operating Manual 1173.6275.12 - 31 267
9.4.4 Configuring the Measurement
Some of the results depend on the measurement configuration.
9.4.4.1 Selecting the Analysis Length
The R&S FSH allows you to analyze one slot only, or a complete WCDMA frame
(which is made up out of 15 slots).
► Press the MEAS key.
► Press the "Display Settings" softkey.
► Select the "One Slot" or "One Frame" menu item.
The R&S FSH analyzes the slot or frame, depending on your selection. The results
are updated accordingly.
Defining the scope of the frequency error
In case of the frequency error, you can display the results on a frame or slot basis,
regardless of the selected analysis length.
► Press the MEAS key.
► Press the "Display Settings" softkey.
► Select the "Slot" or "Frame" menu item (→ Carrier Freq Error Meas Range).
The R&S FSH updates the frequency error accordingly.
9.4.4.2 Specifying the Scrambling Code
To demodulate a 3GPP signal, you have to know the primary and secondary
scrambling codes of the base station you are testing. You can enter the scrambling
code manually or let the R&S FSH automatically find the right scrambling code(s).
Defining the scrambling code manually
► Press the MEAS key.
► Press the "Signal Settings" softkey.
► Select the "Primary Code…" or "Secondary Code…" menu item.
► Enter the primary or secondary scrambling code of the base station you are
testing.
In most cases, the secondary scrambling code has the value '0'.

R&S FSH Digital Modulation Analyzer
Measurements on 3GPP FDD Signals
Operating Manual 1173.6275.12 - 31 268
Performing a search for the scrambling code
If you don't know the scrambling code, the R&S FSH is able to determine the
scrambling code of one or more 3GPP base stations by itself.
► Press the MEAS key.
► Press the "Signal Settings" softkey.
► Select the "[ ] Auto" menu item.
With each sweep, the R&S FSH starts a search for the scrambling code. If it finds
the code, the synchronization will be successful. If not, the synchronization fails.
The R&S FSH shows a corresponding message ( ).
Comparing the power of multiple scrambling codes
You can also view the scrambling codes and their power graphically.
► Press the MEAS key.
► Press the "Result Display" softkey.
► Select the "Scrambling Code"
menu item.
The R&S FSH shows all primary
and corresponding secondary
scrambling codes that it has found
during the search in descending
order regarding the power level.
In addition, the R&S FSH shows the power of the common pilot channels (CPICH)
belonging to the scrambling code. You can see the power in numerical form in a
table above the diagram area and in graphical form.
Trace modes
Note that the PN Scanner supports several trace modes.
If you are using a trace mode other than Clear / Write, the bars depicting the
scrambling codes may turn grey. A grey color indicates time periods during which no
scrambling codes can be found.
For more information on the trace modes see "Selecting the Trace Mode" on page 113.

R&S FSH Digital Modulation Analyzer
Measurements on 3GPP FDD Signals
Operating Manual 1173.6275.12 - 31 269
9.4.4.3 Setting the Antenna Diversity
By default, the R&S FSH does measurements on base stations with one antenna. For
base stations with two antennas, you have to specify the antenna to synchronize to.
► Press the MEAS key.
► Press the "Signal Settings" softkey.
► Select the "Antenna Settings" menu item.
The R&S FSH opens another submenu.
► In the submenu, select the "Antenna #1" menu item.
The R&S FSH synchronizes to the CPICH of antenna 1.
The procedure to select antenna 2 is the same.
You can also perform a measurement on base stations with multiple antennas, but
display the results of both antennas as a combined result.
► Instead of selecting one of the antennas, select the "Combined" menu item.
► To measure base stations with one antenna, select the menu item "Antenna
Diversity Off".
9.4.4.4 Selecting the Slot and Code Channel
The code domain power and code domain channel table result displays show the
power of each code channel contained in one slot. By default, the R&S FSH shows the
results for slot 0.
► Press the MEAS key.
► Press the "Display Settings" softkey.
► Select the "Slot Number…" menu item.
The R&S FSH opens an input field to select the slot.
► Enter the number of the slot you want to analyze.
In the code domain power result display, the numerical results that the R&S FSH
displays belong to one code channel only. By default, the R&S FSH shows the results
for the first code channel (which is always the pilot channel).
► Press the MEAS key.
► Press the "Display Settings" softkey.
► Select the "Code Channel…" menu item.
The R&S FSH opens an input field to select the code channel.
► Enter a number between 0 and 511 to select a particular code channel.
If you select a code that is part of a channel made up of more than one code, results
correspond to the channel, not the one code.

R&S FSH Digital Modulation Analyzer
Measurements on 3GPP FDD Signals
Operating Manual 1173.6275.12 - 31 270
9.4.4.5 Changing the Code Power
By default, the application displays the absolute power of all code channels.
Alternatively, you can display the power relative to the P-CPICH.
► Press the MEAS key.
► Press the "Power Settings" softkey.
► Select the "Relative to CPICH" menu item.
All power display now relate to the pilot channel.
9.4.4.6 Performing Fast Measurements
Faster measurements are possible if you skip the channel search during the
measurement.
► Press the MEAS key.
► Press the "Signal Settings" softkey.
► Select the Channel Search Off menu item.
The R&S FSH stops performing a channel search.
If the channel search is off, measurements are faster. However, some results, like the
Composite EVM, can not be calculated if the channels are not known. Thus, turning
the channel search off is useful if you are interested in signal powers only.
The channel search is always on for the Code Domain Power and Code Domain
Channel Table result displays. All other result displays work both ways.

R&S FSH Digital Modulation Analyzer
Measurements on CDMA2000 Signals
Operating Manual 1173.6275.12 - 31 271
9.5 Measurements on CDMA2000 Signals
Equipped with the software application R&S FSH-K46, you can perform measurements
on downlink CDMA2000 signals according to the 3GPP2 standard with your R&S FSH.
You can expand the functionality by adding the R&S FSH-K46E firmware application.
This application performs code domain power measurements on downlink CDMA2000
signals according to the standard.
► Press the MODE key
► Press the "Dig Mod Analyzer" softkey
► Select the "CDMA2000 BTS" menu item.
The R&S FSH starts the signal analysis.
When starting a measurement, the R&S FSH first records a section of the signal that
lasts approximately 27 ms (or about 1 Sync Frame Period).
If the instrument is in a triggered mode (external or GPS trigger), it searches for the
start of the PN code in the vicinity of the PN offset you have entered. If you are using
the automatic PN Offset, the R&S FSH performs a full search for the PN offset and
reports the PN found. In a "free run" situation, the R&S FSH searches for the start of
the PN sequence over the entire signal length.
The R&S FSH performs various general measurements over one PCG (power control
group) as well as measurements on specific channels. It then shows the results in one
of three formats:
● tabular form in the "Result Summary" display,
● scrollable table form in the "Code Domain Channel Table", or
● graphical form in the "Code Domain Power" result display.
To get highest measurement accuracy, it is necessary to synchronize the reference
frequency of the R&S FSH with the base station via the EXT REF IN input or with an
optional GPS receiver.

R&S FSH Digital Modulation Analyzer
Measurements on CDMA2000 Signals
Operating Manual 1173.6275.12 - 31 272
9.5.1 The Result Summary
The default result display is the result summary. The result summary shows various
measurement results and hardware settings in numerical form.
► Press the "Result Display" softkey.
► Select the "Result Summary" menu item.
The R&S FSH shows the numerical results in a table.
1 Current type of result display
2 Currently selected standard
3 General settings
4 Synchronization state and GPS information
- green font: synchronization OK
- red font: synchronization failed
5 Global results
6 Channel results
7 CDMA2000 softkey menu

R&S FSH Digital Modulation Analyzer
Measurements on CDMA2000 Signals
Operating Manual 1173.6275.12 - 31 273
9.5.1.1 General Settings
For more information see "General Settings of the Digital Modulation Analyzer" on
page 240.
In addition the application features some settings specific to the 3GPP standard.
PN Offset
Shows the current Pseudo Noise (PN) Offset of the base station.
For more information see "Changing the PN Offset" on page 283
The PN Offset only takes effect in combination with an external or GPS trigger.
Trigger
Shows the current trigger mode.
For more information see "Working with Trigger Functionality" on page 108.
In addition to the trigger also available with the base unit, the application also feature a
GPS Sync trigger. It triggers measurements on synchronization with the base station.
Base SF
Shows the current Base Spreading factor (Base SF).
For more information see "Setting the Base Spreading Factor" on page 281
9.5.1.2 Global Results
Global results contain various measurement results of the composite signal. These
results evaluate the total signal over the period of one Power Control Group (PCG).
Channel Power
Total power of the signal in dBm in the 1.23 MHz bandwidth around the center
frequency.
Rho
According to the CDMA2000 standard, Rho is the normalized, correlated power
between the measured and the ideally generated reference signal. When you measure
Rho, the CDMA2000 standard requires that only the pilot channel be supplied.
Composite EVM
Shows the composite Error Vector Magnitude (EVM) in %. The EVM is the root of the
ratio of the mean error power (root mean square) to the power of an ideally generated
reference signal.
An EVM of 0 % means a perfect signal.
R&S FSH Digital Modulation Analyzer
Measurements on CDMA2000 Signals
Operating Manual 1173.6275.12 - 31 274
Carrier Frequency Error
Shows the frequency error in relation to the current center frequency of the R&S FSH.
For more information see "Selecting the Unit of the Carrier Frequency Error" on page
282.
Concerning uncertainty of the reference frequency of the GPS receiver, refer to the
data sheet.
Peak to Average
Shows the difference between the peak power and the average power of the signal
(crest factor).
PN Found
The PN offset found during auto PN offset operation.
Tau
According to the CDMA2000 standard, Tau shows the timing error of the signal. The
maximum offset is specified at 10 µs.
Active Channels
Number of currently active channels.
9.5.1.3 Channel Results
Channel results contain various results specific to one or more channels. The table
contains
● the absolute channel power in dBm
● the channel power in relation to the total signal power in dB
● the channel power in relation to the pilot channel in dB
for the pilot channel (PICH) and the synchronization channel (SYNC).
The pilot channel always occupies code 0 and the synchronization channel always
occupies code number 32.

R&S FSH Digital Modulation Analyzer
Measurements on CDMA2000 Signals
Operating Manual 1173.6275.12 - 31 275
9.5.2 The Code Domain Analyzer
If you equip the R&S FSH with option R&S FSH-K46E, code domain analysis becomes
available to visualize the results in a diagram.
► Press the "Result Display" softkey.
► Select the "Code Domain Power" menu item.
The R&S FSH starts the code domain analyzer.
Screen layout of the code domain power result display
1 Current type of result display
2 Currently selected standard
3 Header table
4 Diagram header
5 Diagram area
6 CDMA2000 softkey menu
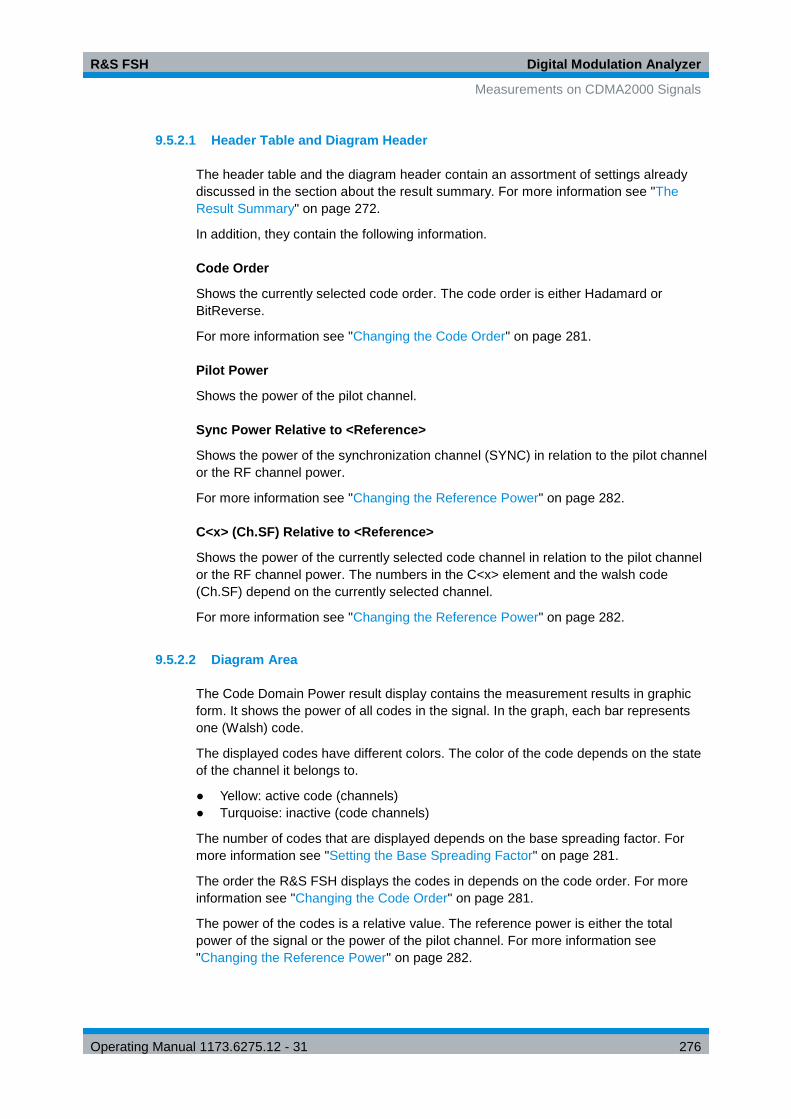
R&S FSH Digital Modulation Analyzer
Measurements on CDMA2000 Signals
Operating Manual 1173.6275.12 - 31 276
9.5.2.1 Header Table and Diagram Header
The header table and the diagram header contain an assortment of settings already
discussed in the section about the result summary. For more information see "The
Result Summary" on page 272.
In addition, they contain the following information.
Code Order
Shows the currently selected code order. The code order is either Hadamard or
BitReverse.
For more information see "Changing the Code Order" on page 281.
Pilot Power
Shows the power of the pilot channel.
Sync Power Relative to <Reference>
Shows the power of the synchronization channel (SYNC) in relation to the pilot channel
or the RF channel power.
For more information see "Changing the Reference Power" on page 282.
C<x> (Ch.SF) Relative to <Reference>
Shows the power of the currently selected code channel in relation to the pilot channel
or the RF channel power. The numbers in the C<x> element and the walsh code
(Ch.SF) depend on the currently selected channel.
For more information see "Changing the Reference Power" on page 282.
9.5.2.2 Diagram Area
The Code Domain Power result display contains the measurement results in graphic
form. It shows the power of all codes in the signal. In the graph, each bar represents
one (Walsh) code.
The displayed codes have different colors. The color of the code depends on the state
of the channel it belongs to.
● Yellow: active code (channels)
● Turquoise: inactive (code channels)
The number of codes that are displayed depends on the base spreading factor. For
more information see "Setting the Base Spreading Factor" on page 281.
The order the R&S FSH displays the codes in depends on the code order. For more
information see "Changing the Code Order" on page 281.
The power of the codes is a relative value. The reference power is either the total
power of the signal or the power of the pilot channel. For more information see
"Changing the Reference Power" on page 282.

R&S FSH Digital Modulation Analyzer
Measurements on CDMA2000 Signals
Operating Manual 1173.6275.12 - 31 277
9.5.3 The Code Domain Channel Table
If you equip the R&S FSH with option R&S FSH-K46E, the code domain channel table
becomes available to visualize the channel structure of the signal.
The code domain channel table shows various parameters and measurement results
on (code) channel level.
Screen layout of the code domain channel table result display
1 Current type of result display
2 Currently selected standard
3 Header table
4 Synchronization state and GPS information
- green font: synchronization OK
- red font: synchronization failed
5 Channel table
6 CDMA2000 softkey menu

R&S FSH Digital Modulation Analyzer
Measurements on CDMA2000 Signals
Operating Manual 1173.6275.12 - 31 278
9.5.3.1 Header Table
The header table contains various settings already discussed in the sections above.
For more information see "The Result Summary" on page 272.
9.5.3.2 Global Results
The global results contain various settings already discussed in the sections above.
For more information see "The Result Summary" on page 272.
9.5.3.3 Channel Table
The channel table is made up out of seven columns and a number of rows that depend
on the number of channels.
The columns show the following information.
Channel Type
Type of channel. (---) indicates an inactive channel. The following channels can be
detected:
Channel Type Channel
F-PICH Pilot channel (displayed as PICH)
F-SYNC Synchronization channel (displayed as SYNC)
All other channel types are not automatically differentiated and named as “CHAN”.
Walsh Ch.SF
Channel number including the spreading factor (in the form <Channel>.<SF>).
Symb. Rate (ksps)
Symbol rate that the channel is transmitted with (9.6 ksps to 307.2 ksps).
RC
Radio configuration. The RC is a predefined physical layer configuration for the
transmit signal. It defines the physical channel configuration based upon a specific
channel data rate. In the current CDMA2000 Standard nine RCs are defined in the
forward link.

R&S FSH Digital Modulation Analyzer
Measurements on CDMA2000 Signals
Operating Manual 1173.6275.12 - 31 279
Status
Status display. Unassigned codes are identified as inactive channels.
Power Abs (dBm)
Absolute power of the channel in dBm.
Power Rel to PICH [Total] (dB)
Relative power of the channel in dB. The reference channel is the PICH or the total
signal, depending on the reference power you have selected.

R&S FSH Digital Modulation Analyzer
Measurements on CDMA2000 Signals
Operating Manual 1173.6275.12 - 31 280
9.5.4 The PN Scanner
If you equip the R&S FSH with option R&S FSH-K46E, the PN scanner becomes
available.
If you are measuring over-the-air (OTA) signals, you can use the PN scanner to
identify base stations in the area. Every base station is identified by its PN offset. The
PN Scanner shows the PN offset for every base station it has detected. For every base
station it also shows the its power graphically (each yellow bar represents an active
and detected base station) and numerically in a table above the diagram.
Note that a GPS trigger is necessary to detect the PN offset of the base stations you
are scanning. GPS trigger is available with the R&S FSH GPS receiver, for example.
Trace modes
Note that the PN Scanner supports several trace modes.
If you are using a trace mode other than Clear / Write, the bars depicting the PN offset
may turn grey. A grey bar is shown in case of base stations that have been detected in
the past but are not currently detected.
For more information on the trace modes see "Selecting the Trace Mode" on page 113.

R&S FSH Digital Modulation Analyzer
Measurements on CDMA2000 Signals
Operating Manual 1173.6275.12 - 31 281
9.5.5 Configuring the Measurement
Some of the results depend on the measurement configuration.
9.5.5.1 Setting the Base Spreading Factor
The number of codes the R&S FSH displays in the diagram depends, in addition to the
signal constellation itself, on the base spreading factor you have set.
► Press the MEAS key.
► Press the "Signal Settings" softkey.
► Select either the "64" or "128" menu item.
The R&S FSH applies the corresponding spreading factor to the measurement. A
base spreading factor of 64 results in a display of 64 codes on the x-axis (0 to 63),
a base spreading factor of 128 in a display of 128 codes on the x-axis (0 to 127).
In the code domain analyzer result display, the number of displayed codes
changes accordingly.
Take care of setting the base spreading factor of the code domain to either 64 or 128.
If you set the base spreading factor to 64 for channels with a base spreading factor of
128 (code class 7), an alias power may be displayed in the Code Domain Power result
display, because of the ambiguity of the Hadamard Matrix. An alias power is a
displayed code power, where no power would be if the spreading factor was correct.
9.5.5.2 Changing the Code Order
The code order defines the order the codes are displayed.
Hadamard order means that there's no distinction between channels. The R&S FSH
shows codes in ascending order regardless of the channel that it belongs to.
BitReverse order means that the R&S FSH combines codes of a channel if a channel
consists of more than one code. When using BitReverse order, the codes of a channel
are next to one another. In this way you can see the total power of a concentrated
channel.
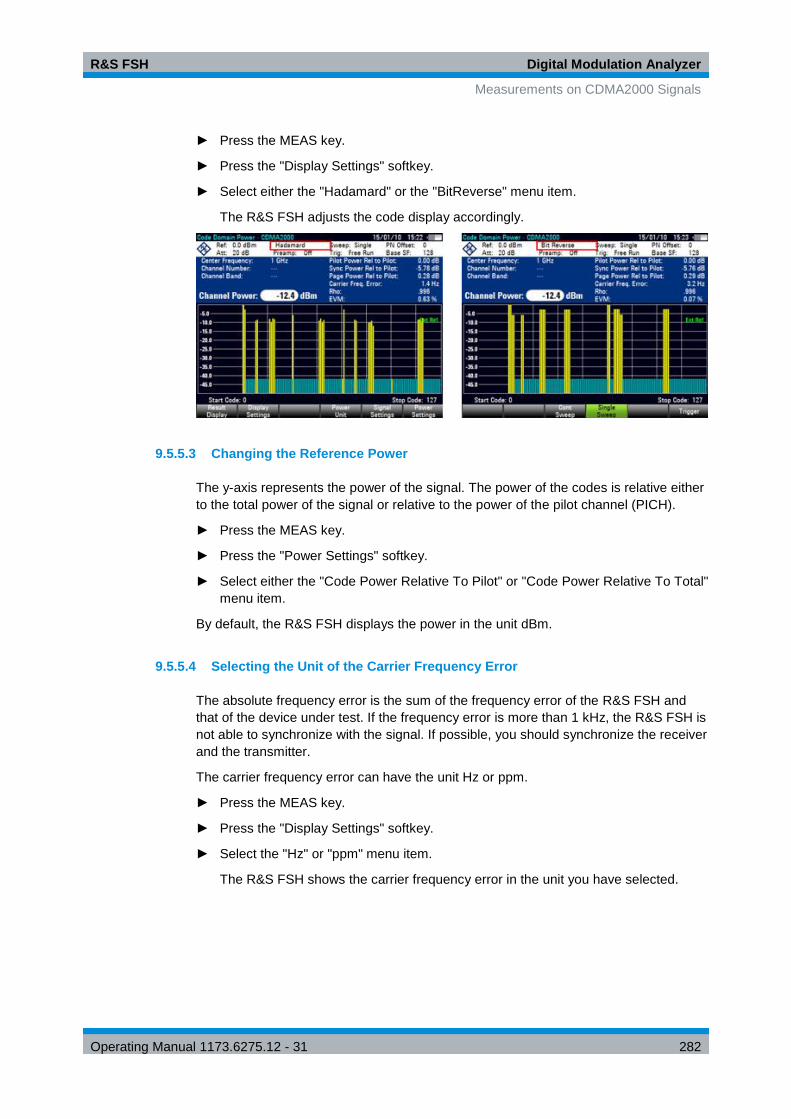
R&S FSH Digital Modulation Analyzer
Measurements on CDMA2000 Signals
Operating Manual 1173.6275.12 - 31 282
► Press the MEAS key.
► Press the "Display Settings" softkey.
► Select either the "Hadamard" or the "BitReverse" menu item.
The R&S FSH adjusts the code display accordingly.
9.5.5.3 Changing the Reference Power
The y-axis represents the power of the signal. The power of the codes is relative either
to the total power of the signal or relative to the power of the pilot channel (PICH).
► Press the MEAS key.
► Press the "Power Settings" softkey.
► Select either the "Code Power Relative To Pilot" or "Code Power Relative To Total"
menu item.
By default, the R&S FSH displays the power in the unit dBm.
9.5.5.4 Selecting the Unit of the Carrier Frequency Error
The absolute frequency error is the sum of the frequency error of the R&S FSH and
that of the device under test. If the frequency error is more than 1 kHz, the R&S FSH is
not able to synchronize with the signal. If possible, you should synchronize the receiver
and the transmitter.
The carrier frequency error can have the unit Hz or ppm.
► Press the MEAS key.
► Press the "Display Settings" softkey.
► Select the "Hz" or "ppm" menu item.
The R&S FSH shows the carrier frequency error in the unit you have selected.
R&S FSH Digital Modulation Analyzer
Measurements on CDMA2000 Signals
Operating Manual 1173.6275.12 - 31 283
9.5.5.5 Changing the PN Offset
The standard uses the PN Offset to distinguish between base stations. The PN offset
determines the offset in the circulating PN sequence in multiples of 64 chips with
reference to the event second clock trigger.
Each signal is spread with a Walsh code of a length of 64 or 128 and a pseudo-random
noise code (PN code) of a length of 215. Each BTS sector in the network is assigned a
PN offset in steps of 64 chips.
If you use an external or GPS sync trigger, you have to adjust the PN Offset according
to the base station / sector you are measuring.
► Press the MEAS key.
► Press the "Signal Settings" softkey.
► Select the PN OFFSET menu.
► Enter the PN Offset you need (between 0 and 511).
9.5.5.6 Synchronizing to a Base Station Using a GPS Receiver
If you use a GPS receiver while performing measurements on a base station, you can
synchronize the sweep via the GPS receiver.
► Press the SWEEP key.
► Press the "Trigger" softkey.
► Select "GPS Sync" menu item.
The R&S FSH now synchronizes the sweep to the signal using the GPS receiver.
For more information about the external trigger that is also available see "Working with
Trigger Functionality" on page .

R&S FSH Digital Modulation Analyzer
Measurements on 1xEV-DO Signals
Operating Manual 1173.6275.12 - 31 284
9.6 Measurements on 1xEV-DO Signals
Equipped with the software application R&S FSH-K47, you can perform measurements
on downlink 1xEV-DO signals in accordance to the 3GPP2 standard with your
R&S FSH.
► Press the MODE key
► Press the "Dig Mod Analyzer" softkey.
► Select the "1xEVDO BTS" menu item.
The R&S FSH starts the signal analysis.
After you have started the measurement, the R&S FSH first records a section of the
signal that lasts approximately 27 ms (or about 1 Sync Frame Period). If the instrument
is in a triggered mode (external or GPS trigger), it then searches for the start of the PN
code in the vicinity of the PN offset you have entered. If you are using the automatic
PN Offset, the R&S FSH performs a full search for the PN offset and reports the PN
found. For a "free run" situation, the R&S FSH searches for the start of the PN
sequence over the entire signal length.
The R&S FSH performs various general measurements over one slot as well as
measurements on specific channels. It then shows the results in tabular form in the
"Result Summary" display,
To get highest measurement accuracy, it is necessary to synchronize the reference
frequency of the R&S FSH with the base station via the EXT REF IN input or with an
optional GPS receiver.

R&S FSH Digital Modulation Analyzer
Measurements on 1xEV-DO Signals
Operating Manual 1173.6275.12 - 31 285
9.6.1 The Result Summary
The result summary shows various measurement results and hardware settings in
numerical form.
► Press the "Result Display" softkey.
► Select the "Result Summary" menu item.
The R&S FSH shows the numerical results in a table.
1 Current type of result display
2 Currently selected standard
3 General settings
4 Synchronization state and GPS information
- green font: synchronization OK
- red font: synchronization failed
5 Global results
6 Channel results
7 CDMA2000 softkey menu

R&S FSH Digital Modulation Analyzer
Measurements on 1xEV-DO Signals
Operating Manual 1173.6275.12 - 31 286
9.6.1.1 General Settings
For more information see "General Settings of the Digital Modulation Analyzer" on
page 240.
In addition the application features some settings specific to the 3GPP standard.
PN Offset
Shows the current Pseudo Noise (PN) Offset of the base station.
For more information see "Changing the PN Offset" on page 289.
The PN Offset only takes effect in combination with an external or GPS trigger.
Trigger
Shows the current trigger mode.
For more information see "Working with Trigger Functionality" on page 108.
In addition to the trigger also available with the base unit, the application also feature a
GPS Sync trigger. It triggers measurements on synchronization with the base station.
9.6.1.2 Global Results
Global results contain various measurement results of the composite signal. These
results evaluate the total signal over the period of one frame. Global results also
contain information about the queliaty of the composite signal.
Channel Power
Total power of the signal in dBm in the 1.23 MHz bandwidth around the center
frequency.
Carrier Frequency Error
Shows the frequency error in relation to the current center frequency of the R&S FSH.
For more information see "Selecting the Unit of the Carrier Frequency Error" on page
289.
Concerning uncertainty of the reference frequency of the GPS receiver, refer to the
data sheet.
Peak to Average
Shows the difference between the peak power and the average power of the signal
(crest factor).
PN Found
The PN offset found during auto PN offset operation.
R&S FSH Digital Modulation Analyzer
Measurements on 1xEV-DO Signals
Operating Manual 1173.6275.12 - 31 287
Tau
Tau is specified in the CDMA2000 standard. It shows the timing error of the signal. The
maximum offset is specified at 10 µs.
Traffic Activity
Percentage of traffic slots with data.
9.6.1.3 Channel Results
Channel results contain various results specific to one or more channels. The table
contains
● the absolute channel power in dBm
● the channel power in relation to the total signal power in dB
● the channel power in relation to the pilot channel in dB
for the pilot channel (PICH), the MAC channel and the data channel.
The absolute and relative channel power is an average over the time the channel is
active in the measured slot.
In addition to the powers of the channels, the channel results also show quality
parameters for the pilot channel (PICH):
EVM
Error vector magnitude (EVM) of the pilot channel in %.
The EVM is the root of the ratio of the mean error power (root mean square) to the
power of an ideal reference signal.
An EVM of 0 % means a perfect signal.
Rho
Quality parameter Rho of the pilot channel.
Rho is specified in the CDMA2000 standard. It is the normalized, correlated power
between the measured signal and an ideal reference signal. The standard requires that
only the pilot channel is measured to get the results for Rho.

R&S FSH Digital Modulation Analyzer
Measurements on 1xEV-DO Signals
Operating Manual 1173.6275.12 - 31 288
9.6.2 The PN Scanner
If you equip the R&S FSH with option R&S FSH-K47E, the PN scanner becomes
available.
If you are measuring over-the-air (OTA) signals, you can use the PN scanner to
identify base stations in the area. Every base station is identified by its PN offset. The
PN Scanner shows the PN offset for every base station it has detected. For every base
station it also shows the its power graphically (each yellow bar represents an active
and detected base station) and numerically in a table above the diagram.
Note that a GPS trigger is necessary to detect the PN offset of the base stations you
are scanning. GPS trigger is available with the R&S FSH GPS receiver, for example.
Trace modes
Note that the PN Scanner supports several trace modes.
If you are using a trace mode other than Clear / Write, the bars depicting the PN offset
may turn grey. A grey bar is shown in case of base stations that have been detected in
the past but are not currently detected.
For more information on the trace modes see "Selecting the Trace Mode" on page 113.
9.6.3 The Burst Power Result Display
If you equip the R&S FSH with option R&S FSH-K47E, the Burst Power result display
becomes available.
The Burst Power result display shows the power of the signal over a single 1xEV-DO
frame (26.66 ms). This measurement is necessary to check if the power and timing of
the bursted signals meets the requirements of the standard.
In order to capture a complete frame, you can apply a trigger from a GPS device or
another external trigger.

R&S FSH Digital Modulation Analyzer
Measurements on 1xEV-DO Signals
Operating Manual 1173.6275.12 - 31 289
9.6.4 Configuring the Measurement
Some of the results depend on the measurement configuration.
9.6.4.1 Selecting the Unit of the Carrier Frequency Error
The absolute frequency error is the sum of the frequency error of the R&S FSH and
that of the device under test. If the frequency error is more than 1 kHz, the R&S FSH is
not able to synchronize with the signal. If possible, you should synchronize the receiver
and the transmitter.
The carrier frequency error can have the unit Hz or ppm.
► Press the MEAS key.
► Press the "Display Settings" softkey.
► Select the "Hz" or "ppm" menu item.
The R&S FSH shows the carrier frequency error in the unit you have selected.
9.6.4.2 Changing the PN Offset
The standard uses the PN Offset to distinguish between base stations. The PN offset
determines the offset in the circulating PN sequence in multiples of 64 chips with
reference to the event second clock trigger.
Each signal is spread with a Walsh code of a length of 64 or 128 and a pseudo-random
noise code (PN code) of a length of 215. Each BTS sector in the network is assigned a
PN offset in steps of 64 chips.
If you use an external or GPS sync trigger, you have to adjust the PN Offset according
to the base station / sector you are measuring.
► Press the MEAS key.
► Press the "Signal Settings" softkey.
► Select the PN OFFSET menu.
► Enter the PN Offset you need (between 0 and 511).
9.6.4.3 Synchronizing to a Base Station Using a GPS Receiver
If you use a GPS receiver while performing measurements on a base station, you can
synchronize the sweep via the GPS receiver.
► Press the SWEEP key.
► Press the "Trigger" softkey.
► Select GPS Sync menu item.
The R&S FSH now synchronizes the sweep to the signal using the GPS receiver.
For more information about the external trigger that is also available see "Working with
Trigger Functionality" on page .

R&S FSH Digital Modulation Analyzer
Measurements on TD-SCDMA Signals
Operating Manual 1173.6275.12 - 31 290
9.7 Measurements on TD-SCDMA Signals
Equipped with the software application R&S FSH-K48, you can perform measurements
on downlink TD-SCDMA signals in accordance to the 3GPP standard with your
R&S FSH.
► Press the MODE key
► Press the "Dig Mod Analyzer" softkey.
► Select the "TD-SCDMA BTS" menu item.
The R&S FSH starts the signal analysis.
After you have started the measurement, the R&S FSH first records a section of the
signal that lasts at least two frames. When it has found the beginning of a frame, the
R&S FSH includes one frame in the signal analysis.
The R&S FSH performs various general measurements based on the composite signal
of one slot as well as measurements based on the special parts of the slot. It then
shows the results in tabular form in the "Result Summary" display,
To get highest measurement accuracy, it is necessary to synchronize the reference
frequency of the R&S FSH with the base station via the EXT REF IN input.

R&S FSH Digital Modulation Analyzer
Measurements on TD-SCDMA Signals
Operating Manual 1173.6275.12 - 31 291
9.7.1 The Result Summary
The result summary shows various measurement results and hardware settings in
numerical form.
► Press the "Result Display" softkey.
► Select the "Result Summary" menu item.
The R&S FSH shows the numerical results in a table.
1 Current type of result display
2 Currently selected standard
3 General settings
4 Synchronization state and GPS information
- green font: synchronization OK
- red font: synchronization failed
5 Global results for a TD-SCDMA time slot
6 Power results for a TD-SCDMA time slot
7 TD-SCDMA softkey menu

R&S FSH Digital Modulation Analyzer
Measurements on TD-SCDMA Signals
Operating Manual 1173.6275.12 - 31 292
9.7.1.1 General Settings
For more information see "General Settings of the Digital Modulation Analyzer" on
page 240.
In addition the application features some settings specific to the 3GPP standard.
Scrambling Code
Shows the scrambling code of the base station. The scrambling code is a number
between 0 and 127.
If you have selected automatic detection of the code, the R&S FSH shows the label
"Auto". Automatic detection is the default method to find the scrambling code.
For more information see "Specifying the Scrambling Code" on page 302.
Switching Point
Shows the switching point in a subframe that separates uplink and downlink.
For more information see "Defining the Switching Point" on page 304.
Slot Number
Shows the time slot (0 to 6) of the TD-SCDMA subframe that is currently analyzed.
For more information see "Selecting a Time Slot" on page 304.
Max Users
Shows the maximum number of midamble shifts in a cell. Because each midamble is
user-specific, the midamble shifts also define the number of users that can be served
in one cell.
Channel Phases
Shows the phase characteristics of the code channels.
For more information see "Selecting the Phase Characteristics of the Code Channels"
on page 305.
9.7.1.2 Global Results
Global results contain various measurement results of the composite signal. These
results evaluate the total signal over the period of one slot. The global results also
contain information about the quality of the measured signal.
Note that some results are only evaluated if the channel search has been turned on.
For more information see "Using the Channel Search" on page 302.

R&S FSH Digital Modulation Analyzer
Measurements on TD-SCDMA Signals
Operating Manual 1173.6275.12 - 31 293
RF Channel Power
Shows the total power of the currently measured TD-SCDMA signal.
Note that the RF Channel Power shown in the Result Summary is measured over one
time slot. The RF Channel Power shown in the Spectrum Overview is measured over
one complete subframe.
In case of over-the-air measurements, the total power includes all received signals in
the channel bandwidth.
Carrier Freq Error
Shows the frequency error in related to the current center frequency of the R&S FSH.
For more information see "Selecting the Unit of the Carrier Frequency Error" on page
305.
Concerning uncertainty of the reference frequency of the GPS receiver, refer to the
data sheet.
I/Q Offset
Shows the DC offset of the signal in %.
Displayed only if the channel search has been turned on.
Gain Imbalance
Shows the gain Imbalance of the signal in %.
Displayed only if the channel search has been turned on.
Composite EVM
Shows the composite Error Vector Magnitude (EVM) in %. The EVM is the root of the
ratio of the mean error power (root mean square) to the power of an ideally generated
reference signal.
An EVM of 0 % means a perfect signal.
Displayed only if the channel search has been turned on.
Peak CDE
Shows the Peak Code Domain Error of the signal in dB.
The Peak Code Domain Error is defined as the maximum code domain error power
that was found in the measurement. The code domain error is the difference in power
of the test signal and an ideal reference signal.
Displayed only if the channel search has been turned on.
Avg RCDE
Shows the Average Relative Code Domain Error of the signal.
Displayed only if the channel search has been turned on.

R&S FSH Digital Modulation Analyzer
Measurements on TD-SCDMA Signals
Operating Manual 1173.6275.12 - 31 294
PCCPCH Symbol EVM
Shows the EVM of the PCCPCH in %rms for the time slot 0.
Note that the R&S FSH only calculates the EVM if the PCCPCH is actually transmitted.
PCCPCH Ec/Io
Shows the ratio of the power of the pilot channel to the total power of the signal.
Therefore this value shows the usable part of the signal.
Scrambling Code Found
Shows the number of the scrambling code, if one has been found.
Active Channels
Shows the number of active channels currently received.
Displayed only if the channel search has been turned on.
9.7.1.3 Power Results
Power results contain various results specific to one timeslot. The timeslot consist of
two data fields, a midamble and a guard period.
The table contains
● the absolute channel power in dBm
● the channel power in relation to the total signal power in dB
of the data parts and midamble parts of a timeslot.
Data Power
Power of the data parts in the timeslot you have selected. The R&S FSH shows the
power of both data parts together and the power of each individual data part ("Data 1
Power" and "Data 2 Power").
Midamble Power
Power of the midamble part in the timeslot you have selected.
R&S FSH Digital Modulation Analyzer
Measurements on TD-SCDMA Signals
Operating Manual 1173.6275.12 - 31 295
9.7.2 The Code Domain Analyzer
If you equip the R&S FSH with option R&S FSH-K48E, code domain analysis becomes
available to visualize the results in a diagram.
► Press the "Result Display" softkey.
► Select the "Code Domain Power" menu item.
The R&S FSH starts the code domain analyzer.
Screen layout of the code domain power result display
1 Current type of result display
2 Currently selected standard
3 Header table
4 Diagram header
5 Diagram area
6 TD-SCDMA softkey menu
Spreading factor 0
Note that the Code Domain Analyzer result display does not display the code domain
power for code channels with a spreading factor of 0.

R&S FSH Digital Modulation Analyzer
Measurements on TD-SCDMA Signals
Operating Manual 1173.6275.12 - 31 296
9.7.2.1 Header Table and Diagram Header
The header table and the diagram header contain an assortment of settings already
discussed in the section about the result summary. For more information see "The
Result Summary" on page 291.
In addition, they contain the following information.
Code / SF
Shows the currently selected code and its spreading factor.
The first value is the code number, the second value is the spreading factor.
The spreading factor for the codes is variable in the range between 0 and 16.
Mod(ulation) Type
Shows the modulation type of the currently selected code.
For more information see "Selecting a Code Channel" on page 305.
Symbol EVM
Shows the EVM of the currently selected code.
For more information see "Selecting a Code Channel" on page 305.
Code Power
Shows the power level of the currently selected code.
For more information see "Selecting a Code Channel" on page 305.
Slot Number
Shows the number of the time slot that the code domain is analyzed for.
For more information see "Selecting a Time Slot" on page 304.
RF Channel Power
Shows the total power of the signal.
For more information see "Global Results" on page 292.
Composite EVM
Shows the composite Error Vector Magnitude (EVM) in %.
For more information see "Global Results" on page 292.

R&S FSH Digital Modulation Analyzer
Measurements on TD-SCDMA Signals
Operating Manual 1173.6275.12 - 31 297
9.7.3 The Code Domain Channel Table
If you equip the R&S FSH with option R&S FSH-K48E, the code domain channel table
becomes available to visualize the channel structure of the signal.
The code domain channel table shows various parameters and measurement results
on (code) channel level.
Screen layout of the code domain channel table result display
1 Current type of result display
2 Currently selected standard
3 Header table
4 Synchronization state and GPS information
- green font: synchronization OK
- red font: synchronization failed
5 Channel table
6 TD-SCDMA softkey menu

R&S FSH Digital Modulation Analyzer
Measurements on TD-SCDMA Signals
Operating Manual 1173.6275.12 - 31 298
9.7.3.1 Header Table
The header table contains various settings already discussed in the sections above.
For more information see "The Result Summary" on page 291.
9.7.3.2 Global Results
The global results contain various settings already discussed in the sections above.
For more information see "The Result Summary" on page 291.
9.7.3.3 The Code Domain Channel Table
The channel table is made up out of seven columns and a number of rows that depend
on the number of channels.
The columns show the following information.
Code#.SF
Number of the code channel and its spreading factor.
Status
Status of the code channel.
Modulation Type
Modulation type of the code channel.
Code Symbol EVM
EVM of the corresponding code channel.
Power Abs(olute) (dBm)
Absolute power of the corresponding code channel in dBm.
Power Rel(ative) to RF Channel Power (dB)
Relative power of the corresponding code channel in dB. The power value is relative to
the RF channel power.
R&S FSH Digital Modulation Analyzer
Measurements on TD-SCDMA Signals
Operating Manual 1173.6275.12 - 31 299
9.7.4 The Sync ID Result Display
If you equip the R&S FSH with option R&S FSH-K48E, the Sync ID result display
becomes available.
If you are measuring over-the-air (OTA) signals, you can use the Sync ID result display
to identify base stations in the area. Every base station is identified by its
synchronization ID. The Sync ID result display shows the ID for every base station it
has detected. For every base station it shows its power graphically (each yellow bar
represents an active and detected base station) and numerically in a table above the
diagram. In addition, the R&S FSH evaluates the delay of the synchronization IDs
relative to the first one.
Trace modes
Note that the Sync ID result display supports several trace modes.
If you are using a trace mode other than Clear / Write, the bars showing the ID may
turn grey. A grey bar is shown in case of base stations that have been detected in the
past but are not currently detected.
For more information on the trace modes see "Selecting the Trace Mode" on page 113.
R&S FSH Digital Modulation Analyzer
Measurements on TD-SCDMA Signals
Operating Manual 1173.6275.12 - 31 300
9.7.5 The Time Domain Power Result Display
If you equip the R&S FSH with option R&S FSH-K48E, the Time Domain Power result
display becomes available.
The Time Domain Power result display shows the power of the signal over one TD-
SCDMA subframe (5.42 ms or 7 time slots, including the pilot time slots). This
measurement is useful to determine which time slots contain power.
Screen layout of the time domain power result display
1 Current type of result display
2 Currently selected standard
3 Header table
4 Result table
5 Diagram
6 TD-SCDMA softkey menu
The result display consists of a result table in the upper part of the display and a
diagram in the lower half of the display.
The diagram contains a trace that shows the power of the signal over one TD-SCDMA
subframe. The time slots in the frame are represented by blue vertical lines. Each time
slot is also labeled with a number. A subframe consists of 7 normal time slots,
therefore the range of numbers is 0 through 6. The trace always begins with time slot
0.
Note that the diagram also shows three time slots which are not numbered and have a
shorter duration than the normal time slots. These are the special time slots that
belong to each subframe: two time slots that conatin the pilot information and one time
slot that serves as a guard period.
R&S FSH Digital Modulation Analyzer
Measurements on TD-SCDMA Signals
Operating Manual 1173.6275.12 - 31 301
The switching point is represented by a red vertical line. All time slots after the
switching point are considered as downlink slots. Because the R&S FSH-K48 only
allows measurements on the downlink, it evaluates the results (EVM or C/I) only for the
time slots that carry downlink information. So, if a time slot contains power, but does
not show EVM or C/I results, the switching point is probably set in a way that this time
slot is considered as an uplink slot.
For each time slot (0 to 6) and the two pilot time slots (DwPTS and UpPTS), the result
display shows the following results.
Slot number
Shows the time slot type.
The normal time slots are numbered from 0 to 6. Time slot 0 is always reserved for the
downlink and time slot 1 always reserved for the uplink. The remaining time slots can
either carry uplink or downlink information, depending on the switching point you have
set.
The special time slots are labeled DwPTS and UpPTS. They are shorter than normal
time slots and carry the pilot information for uplink (UpPTS) and downlink (DwPTS).
Note that the UpPTS is not analyzed by the R&S FSH-K48. Thus, the software does
not display results for this time slot.
Power
Shows the absolute power level of each time slot.
C/I
Shows the carrier-to-interference ratio.
The C/I is the usable signal power in relation to the error power (difference between
the measured signal and the reference signal).
Composite EVM
Shows the composite EVM of each time slot in %.

R&S FSH Digital Modulation Analyzer
Measurements on TD-SCDMA Signals
Operating Manual 1173.6275.12 - 31 302
9.7.6 Configuring the Measurement
Some of the results depend on the measurement configuration.
9.7.6.1 Using the Channel Search
The R&S FSH-K48E supports the analysis of the code domain power of all channels.
Thus, it needs to detect active and inactive channels in the code domain automatically.
For a quick and basic analysis of the signal, you can turn off the channel search. The
R&S FSH in that case evaluates several basic parameters in the Result Summary.
If you turn the channel search on, the I/Q data is also analyzed in the code domain.
Thus, the measurement consumes slightly more time, but yields more results.
► Press the MEAS key.
► Press the "Display Settings" softkey.
► Select the "Channel Search On - Normal" menu item.
The R&S FSH turns the channel search on.
Note that the R&S FSH automatically turns on the channel search when you are using
the Code Domain Power result display or the Code Domain Channel Table.
Measurements without channel search
Measurements without channel search are only possible for result displays that do not
analyze the code domain.
In the Result Summary only results that do not require analysis in the code domain are
displayed.
9.7.6.2 Specifying the Scrambling Code
To demodulate a 3GPP signal, you have to know the scrambling code of the base
station you are testing.
You can enter the scrambling code manually or let the R&S FSH automatically find the
right scrambling code(s).
Defining the scrambling code manually
► Press the MEAS key.
► Press the "Signal Settings" softkey.
► Select the "Set Code Manually…" menu item.
► Enter the scrambling code of the base station you are testing.

R&S FSH Digital Modulation Analyzer
Measurements on TD-SCDMA Signals
Operating Manual 1173.6275.12 - 31 303
Performing a search for the scrambling code
If you don't know the scrambling code, the R&S FSH is able to determine the
scrambling code of one or more 3GPP base stations by itself.
► Press the MEAS key.
► Press the "Signal Settings" softkey.
► Select the "[ ] Auto" menu item in the "Scrambling Code" category.
With each sweep, the R&S FSH starts a search for the scrambling code. If it finds
the code, the synchronization will be successful. If not, the synchronization fails.
9.7.6.3 Selecting the Maximum Number of Users
The TD-SCDMA standard allows the assignment of resources to a variable number of
users (2, 4, 6, 8, 10, 12, 14 or 16). The maximum number of users is determined by the
number of midamble shifts K in a particular time slot.
You can enter the number of midamble shifts manually or let the R&S FSH
automatically determine the number of midamble shifts.
Defining the number of users manually
► Press the MEAS key.
► Press the "Signal Settings" softkey.
► Select the "Set K Manually…" menu item.
► Enter the maximum number of allowed users.
Performing a search for the current number of users
If you don't know the number of users currently served, the R&S FSH is able to
determine the supported number of users by itself.
► Press the MEAS key.
► Press the "Signal Settings" softkey.
► Select the "[ ] Auto" menu item in the "Maximum Users (K)" category.
With each sweep, the R&S FSH starts a search for the supported maximum
number of users.

R&S FSH Digital Modulation Analyzer
Measurements on TD-SCDMA Signals
Operating Manual 1173.6275.12 - 31 304
9.7.6.4 Defining the Switching Point
A TD-SCDMA subframe contains two switching points where the signal switches from
downlink to uplink or vice versa. The first switching point is fix after the guard period of
the special time slot, the second switching point is arbitrary and is between one of the
last six time slots. The switch point is thus a number between 0 and 6.
► Press the MEAS key.
► Press the "Signal Settings" softkey.
► Select the "Set Switch Point Manually" menu item.
The R&S FSH opens an input field to enter the switching point.
► Enter the number of the time slot after which the switching point occurs.
9.7.6.5 Selecting a Time Slot
In the several result result displays, the R&S FSH shows the power of a particular time
slot. By default, the R&S FSH shows the results for slot 0.
► Press the MEAS key.
► Press the "Display Settings" softkey.
► Select the "Slot Number" menu item.
The R&S FSH opens an input field to select the slot.
► Enter the number of the timeslot you want to analyze.
The R&S FSH adjusts the results accordingly.
Note that you can select only slots that are assigned to the downlink. The location of
downlink slots is defined by the switching point.
9.7.6.6 Changing the Code Power
By default, the application displays the absolute power of the code channels in the
Code Domain Power result display. Alternatively, you can display the power relative to
the RF channel power.
► Press the MEAS key.
► Press the "Power Settings" softkey.
► Select the "Relative to RF Channel Power" menu item.
The code domain power values are now relative to the RF channel power.

R&S FSH Digital Modulation Analyzer
Measurements on TD-SCDMA Signals
Operating Manual 1173.6275.12 - 31 305
9.7.6.7 Selecting a Code Channel
The "Code Domain Analyzer" contains results for a particular code channel. By default,
the R&S FSH shows the results for the first active code channel in the analyzed time
slot.
► Press the MEAS key.
► Press the "Display Settings" softkey.
► Select the "Code Channel" menu item.
The R&S FSH opens an input field to select a code channel.
► Enter the number of the code channel you want to analyze.
The R&S FSH adjusts the results accordingly.
The bar of the currently selected code channel is highlighted in red.
9.7.6.8 Selecting the Phase Characteristics of the Code Channels
The phase of the code channels is either fixed or arbitrary.
► Press the MEAS key.
► Press the "Signal Settings" softkey.
► Select the "Fixed" or the "Arbitrary" menu item.
In "Fixed" mode, the phase of all code channels has to be the same.
In "Arbitrary" mode, the phase of the code channels is allowed to rotate.
9.7.6.9 Selecting the Unit of the Carrier Frequency Error
If possible, you should synchronize the receiver and the transmitter.
The carrier frequency error can have the unit Hz or ppm.
► Press the MEAS key.
► Press the "Display Settings" softkey.
► Select the "Hz" or "ppm" menu item.
The R&S FSH shows the carrier frequency error in the unit you have selected.
9.7.6.10 Selecting the Unit for EVM Results
EVM results are usually calculated either in % or in dB.
► Press the MEAS key.
► Press the "Display Settings" softkey.
► Select either the "%" or "dB" menu item.
The R&S FSH shows the EVM in the unit you have selected.

R&S FSH Digital Modulation Analyzer
Measurements on LTE Signals
Operating Manual 1173.6275.12 - 31 306
9.8 Measurements on LTE Signals
Equipped with the software application R&S FSH-K50 and R&S FSH-K51, you can
perform measurements on downlink LTE FDD (R&S FSH-K50) and TDD (R&S FSH-
K51) signals in accordance to the 3GPP standard with your R&S FSH.
Bandwidth of LTE signals
Because of the bandwidth of LTE signals, measurements are possible only with
instruments that support a bandwidth of 20 MHz (serial numbers 105000 and higher).
► Press the MODE key
► Press the "Dig Mod Analyzer" softkey.
► Select the "LTE-FDD BTS" menu item for FDD measurements.
► Select the "TD-LTE BTS" menu item for TDD measurements.
The R&S FSH starts the signal analysis.
To get highest measurement accuracy, it is necessary to synchronize the reference
frequency of the R&S FSH with the base station via the EXT REF IN input.

R&S FSH Digital Modulation Analyzer
Measurements on LTE Signals
Operating Manual 1173.6275.12 - 31 307
9.8.1 The Result Summary
The result summary shows various measurement results and hardware settings in
numerical form.
1 Current type of result display
2 Currently selected standard
3 General settings
4 Synchronization state and GPS information
- green font: synchronization OK
- red font: synchronization failed
5 Global results
6 Allocation summary or reference signal overview
7 LTE softkey menu
Contents of the Result Summary
Note that the contents of the last block of results in the Result Summary depend on the
"Antenna Settings".
● Over-the-air (MIMO):
Reference Signal Overview.
● Over-the-air (SISO) and measurements on a single antenna (MIMO)
Allocation Summary.

R&S FSH Digital Modulation Analyzer
Measurements on LTE Signals
Operating Manual 1173.6275.12 - 31 308
9.8.1.1 General Settings
For more information see "General Settings of the Digital Modulation Analyzer" on
page 240.
In addition the application features some settings specific to the 3GPP standard.
Ch BW
Shows the current base channel bandwidth and number of resource blocks (RB).
For more information see "Selecting the Channel Bandwidth" on page 319.
UL / DL
Shows the configuration of the subframes in a radio frame for TDD systems.
For more information see "Selecting the Subframe Configuration for TDD Signals" on
page 320.
Cell [Grp/ID]
Shows the identity of the radio cell that is tested. If you enter a specific cell identity, the
numbers in brackets show the group the cell identity belongs to and the ID in that
group.
For more information see "Selecting the Cell Identity" on page 319.
Cyclic Prefix
Shows the type of cyclic prefix in use.
For more information see "Selecting the Cyclic Prefix" on page 319.
Antenna
Shows the current antenna configuration.
For more information see "Selecting the MIMO Configuration" on page 321.
Subframes
Shows the number of subframes the R&S FSH records and analyzes during a single
sweep.
Trigger
Shows the current trigger mode.
For more information see "Working with Trigger Functionality" on page 108.
In addition to the trigger also available with the base unit, the application also feature a
GPS Sync trigger. It triggers measurements on synchronization with the base station.

R&S FSH Digital Modulation Analyzer
Measurements on LTE Signals
Operating Manual 1173.6275.12 - 31 309
9.8.1.2 Global Results
Global results contain various measurement results of the composite signal. These
results evaluate the total signal over the period of one frame. The global results also
contain information about the quality of the measured signal of up to one frame. The
exact amount of data that is analyzed depends on the number of selected subframes.
RF Channel Power
Shows the total power of the currently measured LTE signal.
The channel power includes all subcarriers covered by the channel bandwidth. Signal
power outside the channel bandwidth is not included in the total power, even if it is
visible in the spectrum overview.
In case of over-the-air measurements, the total power includes all received signals in
the channel bandwidth.
Overall EVM
Shows the overall EVM of the signal.
The overall EVM includes all signal components, regardless of the modulation or
channel type.
Carrier Freq Error
Shows the frequency error in relation to the current center frequency of the R&S FSH.
For more information see "Selecting the Unit of the Carrier Frequency Error" on page
322.
Concerning uncertainty of the reference frequency of the GPS receiver, refer to the
data sheet.
Sync Signal Power
Shows the power of the synchronization signal.
For more information see "Selecting the Synchronization Signal" on page 321.
OSTP
Shows the OSTP of the signal.
RSRP (3GPP TS 36.214)
Shows the Reference Signal Received Power (RSRP).
The RSRP is the average power of the cell-specific reference signals. It is calculated
over all subcarriers and the complete channel bandwidth.
Note that the R&S FSH bases its calculation of the RSRP on the channel bandwidth
you have selected for measurement, not the channel bandwidth it actually receives.
R&S FSH Digital Modulation Analyzer
Measurements on LTE Signals
Operating Manual 1173.6275.12 - 31 310
Frame Offset
Shows the time difference between the (sub)frame start and capture buffer start.
Occupied Bandwidth
Shows the occupied bandwidth of the signal in Hz.
You can control if the occupied bandwidth is measured or not. By default, it is not.
► Press the MEAS key.
► Press the "Meas Settings" softkey.
► Select the "[ ] Occupied Bandwidth" menu item.
The R&S FSH determines the occupied bandwidth in addition to the other global
results. When the measurement has been turned on, the menu item is marked by
an [X].
Cell Identity [Grp/ID]
Shows the cell identity, cell group and cell ID the current results correspond to.
For more information see "Selecting the Cell Identity" on page 319.
Cyclic Prefix
Shows the cyclic prefix the current results correspond to.
For more information see "Selecting the Cyclic Prefix" on page 319.
Traffic Activity
Percentage of traffic slots with data.
SINR
Shows the Signal to Interference and Noise ratio.
The SINR is the ratio of the signal power and the sum of interference and noise power.
RSSI (3GPP TS 36.214)
Shows the Received Signal Strength Indicator (RSSI).
The RSSI is the complete signal power of the channel that has been measured,
regardless of the origin of the signal.

R&S FSH Digital Modulation Analyzer
Measurements on LTE Signals
Operating Manual 1173.6275.12 - 31 311
RSRQ (3GPP TS 36.214)
Shows the Reference Signal Received Quality (RSRQ).
The RSRQ is the ratio of the RSRP and the RSSI.
I/Q Offset
Shows the power at spectral line 0 normalized to the total transmitted power.
The I/Q offset may be an indicator for a baseband DC offset or for carrier leakage.
9.8.1.3 Allocation Summary
The allocation summary becomes active when you have set the MIMO settings to a
specific antenna connected by cable. The allocation summary contains the results for
specific aspects of the signal like channels and modulation.
For each value, the R&S FSH shows the power in dBm and the average error vector
magnitude (EVM). For more information see "Configuring EVM Results" on page 322.
All results in the allocation summary are normalized to one resource element or one
subcarrier, respectively.
Ref Signal
Power and EVM of the reference signal.
The R&S FSH evaluates the results over all resource blocks and subframes.
QPSK, 16QAM, 64QAM, 256QAM
Power and EVM of the data channels (PDSCH) that you are measuring.
The R&S FSH evaluates the results over all resource blocks and subframes of the
respective modulation.
P-SYNC, S-SYNC, PBCH, PCFICH
Power and EVM of the corresponding channel.

R&S FSH Digital Modulation Analyzer
Measurements on LTE Signals
Operating Manual 1173.6275.12 - 31 312
9.8.1.4 Reference Signal Overview
The reference signal overview becomes active when you perform over-the-air MIMO
measurements. The reference signal overview contains the power and EVM for each
antenna. The number of results depends on the number of antennas you are
measuring (1, 2 or 4).
In addition, the R&S FSH shows the Time Alignment Error vor each antenna. The Time
Alignment Error is the deviation of an antenna from the reference antenna. The
reference antenna is antenna 1.
The power values are normalized to one resource element or one subcarrier
respectively. The R&S FSH evaluates the results over all resource blocks and
subframes.
If you know the cell ID, you can synchronize the R&S FSH with the reference signal.
Synchronizing with the reference signal
► Press the MEAS key.
► Press the "Signal Settings" softkey.
► Select the "Reference Signal" menu item.
The R&S FSH synchronizes itself with the reference signal.
R&S FSH Digital Modulation Analyzer
Measurements on LTE Signals
Operating Manual 1173.6275.12 - 31 313
9.8.2 The Result Summary for Carrier Aggregation
The R&S FSH supports measurements on LTE signals with carrier aggregation. In that
case, you can define and analyze the characteristics of up to five component carriers.
The results are displayed in a separate result summary for carrier aggregation.
► Press the "Result Display" softkey.
► Select the "Carrier Aggregation" menu item.
The R&S FSH starts the result summary.
When you start the measurement, the R&S FSH performs a measurement on each
carrier and displays the results.
For each component carrier, the R&S FSH displays several results that are similar to
those displayed in the regular result summary. The size of the table depends on the
number of selected carriers. For more information about the results see "The Result
Summary" on page 307.
For more information about configuring component carriers see "Configuring
Component Carriers" on page 323.

R&S FSH Digital Modulation Analyzer
Measurements on LTE Signals
Operating Manual 1173.6275.12 - 31 314
9.8.3 The Constellation Diagram
If you equip the R&S FSH with option R&S FSH-K50E or -K51E, the constellation
diagram becomes available to visualize the results in a diagram.
► Press the "Result Display" softkey.
► Select the "Constellation Diagram" menu item.
The R&S FSH starts the constellation diagram.
Screen layout of the constellation diagram
1 Current type of result display
2 Currently selected standard
3 Color map
4 Diagram area
5 Currently selected allocation
6 LTE softkey menu
The constellation diagram shows the location of the transmitted symbols in the
complex plane. It is therefore an indicator of the quality of the modulation of the signal.
By default, the result display shows the symbol locations over all allocations. In that
case, the R&S FSH distinguishes modulation schemes used in the transmission of
data channels by using different colors.
● QPSK modulation
● 16QAM modulation
● 64QAM modulation
● 256QAM modulation
For easy identification of the pilot, synchronization and control channels in the diagram,
the R&S FSH also uses different colors.
● PSYNC
● SSYNC
● Control channels with QPSK modulation

R&S FSH Digital Modulation Analyzer
Measurements on LTE Signals
Operating Manual 1173.6275.12 - 31 315
In addition to an overview of all allocations, you can also view the constellations of
particular channels or modulation schemes.
► Press the TRACE key.
► Select the "Show Allocations…" menu item.
(The "Show Ideal Points" menu item shows the ideal symbol locations as a
guideline.)
► Select the allocation type you want to see the results for.
The R&S FSH adjusts the contents of the diagram and shows the channel you
have selected to the right of the diagram.

R&S FSH Digital Modulation Analyzer
Measurements on LTE Signals
Operating Manual 1173.6275.12 - 31 316
9.8.4 The BTS Scanner
If you equip the R&S FSH with option R&S FSH-K50E or -K51E, the BTS scanner
becomes available.
If you are measuring over-the-air (OTA) signals, you can use the BTS scanner to
identify base stations in the area. Every base station is identified by its Cell ID. The
BTS Scanner shows the Cell ID for every base station it has detected. For every base
station it also shows the power graphically (each yellow bar represents an active and
detected base station) and numerically in a table above the diagram. The table also
shows the power of the S-SYNC or P-SYNC of the basestation.
Trace modes
Note that the BTS Scanner supports several trace modes.
If you are using a trace mode other than Clear / Write, the bars depicting the Cell ID
may turn grey. A grey bar is shown in case of base stations that have been detected in
the past but are not currently detected.
For more information on the trace modes see "Selecting the Trace Mode" on page 113.

R&S FSH Digital Modulation Analyzer
Measurements on LTE Signals
Operating Manual 1173.6275.12 - 31 317
9.8.5 The Resource Allocations Result Display
If you equip the R&S FSH with option R&S FSH-K50E or -K51E, the resource
allocations result display becomes available to visualize the results in a diagram.
► Press the "Result Display" softkey.
► Select the "Resource Allocations" menu item.
The R&S FSH shows the resource allocation.
Screen layout of the resource allocations result display
1 Current type of result display
2 Currently selected standard
3 Color map
4 Diagram area
5 General signal information
6 LTE softkey menu
The resource allocations result display shows the power of each resource element in
the signal. Each row of the diagram corresponds to a resource block. The columns
represent a subframe each.
The resource allocation is thus a good way to measure the amount of traffic currently
on the carrier based on the power levels of each resource block.
The power of the resource elements is represented by colors, with a map showing the
corresponding power levels next to the diagram. By default, the R&S FSH
automatically scales the color map according the signal powers it receives.

R&S FSH Digital Modulation Analyzer
Measurements on LTE Signals
Operating Manual 1173.6275.12 - 31 318
Customizing the color map
Alternatively, you can customize the color map and customize it for over-the-air
measurements and cable connected measurements separately.
► Press the "Display Settings" softkey.
► Select the "Over-The-Air Maximum…" or the "Over-The-Air-Minimum…" menu item
to define a color map for over-the-air measurements.
► Select the "Cable Connected Maximum…" or the "Cable Connected Minimum…"
menu item to define a color map for cable connected measurements.
In both cases, the "Minimum…" menu item defines the lower threshold of the color
map while the "Maximum…" menu item defines the upper threshold of the color
map. The threshold is the minimum or maximum signal level that is included in the
color map.
The application also allows you to select the color scheme.
► Press the "Display Settings" softkey.
► Select the "Color Table" menu item.
The R&S FSH opens a submenu.
► Select the color scheme you want.

R&S FSH Digital Modulation Analyzer
Measurements on LTE Signals
Operating Manual 1173.6275.12 - 31 319
9.8.6 Configuring the Measurement
Some of the results depend on the measurement configuration.
9.8.6.1 Selecting the Channel Bandwidth
The LTE standard specifies the following bandwidths with the appropriate number of
resource blocks.
Channel bandwidth (MHz) 1.4 3 5 10 15 20
Number of resource blocks 6 15 25 50 75 100
► Press the MEAS key.
► Press the "Signal Settings" softkey.
► Select the "Channel Bandwidth" menu item.
The R&S FSH opens a submenu to select the bandwidth.
► Select one of the bandwidths available in the menu.
The R&S FSH sets the bandwidth you have entered and calculates the
corresponding number of resource blocks according to the standard.
9.8.6.2 Selecting the Cyclic Prefix
The cyclic prefix serves as a guard interval between OFDM symbols to avoid
interferences. The cyclic prefix is either "Normal" (slot contains 7 OFDM symbols),
"Extended" (slot contains 6 OFDM symbols) or "Auto" (the application automatically
detects the type of cyclic prefix).
► Press the MEAS key.
► Press the "Signal Settings" softkey.
► Select either the "Normal", "Extended" or "Auto" menu item.
9.8.6.3 Selecting the Cell Identity
The cell ID, cell identity group and physical layer identity are interdependent
parameters. In combination they are responsible for synchronization between network
and user equipment.
The LTE standard defines 504 unique physical-layer cell identities. These are split in
168 cell identity groups with 3 unique identities per group.
In the default state, the R&S FSH automatically detects the cell identity, its group and
ID. If you need results for a specific identity, you can also select it manually.

R&S FSH Digital Modulation Analyzer
Measurements on LTE Signals
Operating Manual 1173.6275.12 - 31 320
Setting the cell ID
► Press the MEAS key.
► Press the "Signal Settings" softkey.
► Select the "Cell Identity" menu item.
The R&S FSH opens an input field to define the cell identity.
► Enter a number between 0 and 503 to set the cell identity.
Setting the cell group and the cell ID
► Press the MEAS key.
► Press the "Signal Settings" softkey.
► First, select the "Group" menu item.
The R&S FSH opens an input field to select a cell group.
► Enter a number between 0 and 167 to select a cell identity group.
► Press the "Signal Settings" softkey.
► Select the "ID…" menu item.
The R&S FSH opens an input field to select an ID.
► Enter a number between 0 and 2 to select an ID.
The R&S FSH now shows the results to that cell identity.
Selecting automatic detection of the cell ID
► Press the MEAS key.
► Press the "Signal Settings" softkey.
► Select the "Auto" menu item in the "Physical Layer Cell Identity" category.
9.8.6.4 Selecting the Subframe Configuration for TDD Signals
According to the standard, the R&S FSH provides 7 configurations that each covers a
complete LTE frame and consists of 10 subframes.
► Press the MEAS key.
► Press the "Signal Settings" softkey.
► Select the "UL/DL Configuration" menu item.
The R&S FSH opens a submenu that contains the configurations.
► Select the TDD configuration you need.

R&S FSH Digital Modulation Analyzer
Measurements on LTE Signals
Operating Manual 1173.6275.12 - 31 321
Each configuration is made up out of 10 of the following abbreviations:
● "D" stands for a downlink subframe
● "U" stands for a uplink subframe
● "S" stands for a special subframe
A configuration for a frame therefore would be, e.g. "DSUUU DSUUU".
Note that this is available with option R&S FSH-K51 (TDD measurements) only.
9.8.6.5 Selecting the Synchronization Signal
The synchronization signal selects the way the R&S FSH synchronizes to the LTE
signal. By default, the R&S FSH automatically determines the type of synchronization
signal to use.
Alternatively, you can select the synchroniztaion signal manually. You can either
synchronize to the PSYNC or SSYNC signals or synchronize to the reference signal.
► Press the "Signal Settings" softkey.
► Select the PSYNC/SSYNC menu item.
The R&S FSH synchronizes to the PSYNC or SSYNC.
► Select the "Reference Signal" menu item.
The R&S FSH synchronizes to the reference signal. For more information see
"Reference Signal Overview" on page 312.
9.8.6.6 Selecting the MIMO Configuration
You can perform measurements on equipment with 1, 2 or 4 transmission antennas.
For measurements on base stations with one or two transmit antennas it is possible to
perform detailed measurements on single antennas via cable connection.
Because the reference signals of the different antennas are orthogonal, it is possible to
determine and display their power and EVM during over-the-air measurements.
► Press the MEAS key.
► Press the "Antenna Settings" softkey.
► Select the menu item that corresponds to the setup of the equipment you are
measuring.
If you want to measure a specific antenna, select the antenna number. Note that
selecting a specific antenna in multiple antenna systems is available only for 2-antenna
systems.
If you want to measure all antennas of the system, select the "Over-the-air" menu item.

R&S FSH Digital Modulation Analyzer
Measurements on LTE Signals
Operating Manual 1173.6275.12 - 31 322
9.8.6.7 Selecting the Unit of the Carrier Frequency Error
The absolute frequency error is the sum of the frequency error of the R&S FSH and
that of the device under test. If the frequency error is more than 1 kHz, the R&S FSH is
not able to synchronize with the signal. If possible, you should synchronize the receiver
and the transmitter.
The carrier frequency error can have the unit Hz or ppm.
► Press the MEAS key.
► Press the "Display Settings" softkey.
► Select the "Hz" or "ppm" menu item.
The R&S FSH shows the carrier frequency error in the unit you have selected.
9.8.6.8 Configuring EVM Results
In case of the EVM, you can define the unit of the EVM and EVM calculation method.
To obtain EVM values according to standard, the channel estimation and EVM
windowing methods defined in 3GPP TS 36.141 are used. Prerequisites for a standard
compliant measurement are signals according to the enhanced test models defined in
36.141 and an external frequency reference delivered via the Ref In connector or via
GPS. The EVM according to standard measurement is mainly useful for high accuracy
signal quality measurements with cable-connected eNodeB antenna ports. The
measurement takes longer but the EVM value incorporates more signal errors like
inter-symbol-interference.
If the EVM is not measured with the “EVM According to Standard” option enabled,
optimum channel estimation and EVM calculation methods are used. Especially for
over-the-air measurements this setting is useful since influences of the air interface like
inter-symbol-interference are compensated. Additionally this mode is faster.
Selecting the unit of the EVM
► Press the MEAS key.
► Press the "Display Settings" softkey.
► Select either the "%" or "dB" menu item.
The R&S FSH shows the EVM in the unit you have selected.
Displaying the EVM according to standard
► Press the MEAS key.
► Press the "Meas Settings" softkey.
► Select the "EVM According to Standard" menu item.
If the R&S FSH displays the EVM according to standard, the menu item is marked
by an [X].

R&S FSH Digital Modulation Analyzer
Measurements on LTE Signals
Operating Manual 1173.6275.12 - 31 323
9.8.6.9 Configuring Component Carriers
When you are performing measurements on systems with carrier aggregation, the
R&S FSH allows you to define several characteristics for each component carrier.
Selecting the number of component carriers
The R&S FSH supports measurements on up to five component carriers.
► Press the MEAS key.
► Press the "Meas Settings" softkey.
► Select the "Number of Carriers" menu item.
The R&S FSH opens an input field to select the number of component carriers.
► Enter the number of component carriers in your system.
The R&S FSH adjusts the size of the result summary accordingly: each carrier is
represented by one column in the result summary table.
► Alternatively, press the FREQ key, and select the number of carriers via the
"Number of Carriers" softkey.
Defining the frequency of the component carrier
Each component carrier in the system is transmitted on a different frequency. Thus,
you have to provide their frequencies for valid measurement results.
► Press the FREQ key.
► Press the "Select Carrier" softkey.
► Select the carrier you want to define the frequency for ("Carrier <x>" menu item).
► Press the "Center Freq" softkey.
The R&S FSH opens an input field to define the frequency.
► Enter the frequency of the component carrier.
Defining the bandwidth of the carriers
You can select a different bandwidth for each component carrier in the system.
► Press the MEAS key.
► Press the "Signal Settings" softkey.
► Select the "Channel BW Carrier <x>" menu item.
The R&S FSH opens a submenu to select the channel bandwidth.
► Select the required bandwidth.
The available bandwidth for component carriers are the same as those for
measurements on regular systems.

R&S FSH Digital Modulation Analyzer
Measurements on LTE Signals
Operating Manual 1173.6275.12 - 31 324
Selecting the MIMO configuration of the component carriers
You can select a different MIMO configuration (number of antennas) for each
component carrier.
► Press the FREQ key.
► Press the "Select Carrier" softkey.
► Select the carrier you want to define the frequency for ("Carrier <x>" menu item).
► Press the MEAS key.
► Press the "Antenna Settings" softkey.
► Select the MIMO configuration for the selected carrier.
You can see the MIMO configuration of each carrier in the result summary for
carrier aggregation ("Antenna" row).
9.8.6.10 Synchronizing to a Base Station Using a GPS Receiver
If you use a GPS receiver while performing measurements on a base station, you can
synchronize the sweep via the GPS receiver.
► Press the SWEEP key.
► Press the "Trigger" softkey.
► Select GPS Sync menu item.
The R&S FSH now synchronizes the sweep to the signal using the GPS receiver.
For more information about the external trigger that is also available see "Working with
Trigger Functionality" on page .

R&S FSH Digital Modulation Analyzer
Measurements on NB-IoT Signals
Operating Manual 1173.6275.12 - 31 325
9.9 Measurements on NB-IoT Signals
Equipped with the software application R&S FSH-K56, you can perform measurements
on downlink LTE NB-IoT signals in accordance to the 3GPP standard with your
R&S FSH.
Bandwidth of LTE signals
Because of the bandwidth of LTE signals, measurements are possible only with
instruments that support a bandwidth of 20 MHz (serial numbers 105000 and higher).
► Press the MODE key
► Press the "Dig Mod Analyzer" softkey.
► Select the "LTE-FDD NB-IoT" menu item.
The R&S FSH starts the signal analysis.
To get highest measurement accuracy, it is necessary to synchronize the reference
frequency of the R&S FSH with the base station via the EXT REF IN input.
Spectrum overview
For in band and guard band deployment, the spectrum overview result display shows
the spectrum of the complete LTE carrier rather than the NB-IoT carrier only. The
location of the NB-IoT carrier is indicated by a two vertical blue lines.
For more information about the spectrum overview see "The Spectrum Overview" on
page 245.
R&S FSH Digital Modulation Analyzer
Measurements on NB-IoT Signals
Operating Manual 1173.6275.12 - 31 326
9.9.1 The Result Summary
The result summary shows various measurement results and hardware settings in
numerical form.
1 Current type of result display
2 Currently selected standard
3 General settings
4 Synchronization state and GPS information
- green font: synchronization OK
- red font: synchronization failed
5 Global results
6 Allocation summary
7 NB-IoT softkey menu
9.9.1.1 General Settings
For more information see "General Settings of the Digital Modulation Analyzer" on
page 240.
In addition the application features some settings specific to the 3GPP standard.
Center
Shows the current center frequency of the R&S FSH.
For inband and guardband deployment, the displayed frequency is the center
frequency of the LTE carrier.
For standalone deployment, the displayed frequency is the center frequency of the NB-
IoT carrier.

R&S FSH Digital Modulation Analyzer
Measurements on NB-IoT Signals
Operating Manual 1173.6275.12 - 31 327
IoT BW / LTE BW
Shows the bandwidth of the NB-IoT carrier (standalone deployment) or the LTE carrier
that contains the NB-IoT carrier (inband and guardband deployment).
Note that the NB-IoT channel always has a bandwidth of 180 kHz (1RB), regardless of
the deployment.
For more information see "Defining the LTE Channel Bandwidth" on page 333.
Antenna
Shows the current antenna configuration.
For more information see "Selecting the Antenna Configuration" on page 335.
Deployment
Shows the currently selected deployment.
For more information see "Selecting the Deployment" on page 332.
Trigger
Shows the current trigger mode.
For more information see "Working with Trigger Functionality" on page 108.
In addition to the trigger also available with the base unit, the application also feature a
GPS Sync trigger. It triggers measurements on synchronization with the base station.
SEQ / PRB
Inband and guardband deployment only.
Shows the current E-UTRA CRS sequence info and E-UTRA PRB index.
For more information see "Selecting the CRS Sequence and PRB Index" on page 333.
IoT Freq Offset
Inband and guardband deployment only.
Shows the frequency offset of the NB-IoT channel relative to the center frequency of
the E-UTRA channel. The frequency offset of the NB-IoT channel is defined by the
CRS sequence info and the PRB index.
Subframes
Shows the number of subframes currently analyzed.
For more information see "Defining the Number of Subframes to Analyze" on page
335.

R&S FSH Digital Modulation Analyzer
Measurements on NB-IoT Signals
Operating Manual 1173.6275.12 - 31 328
9.9.1.2 Global Results
Global results contain various measurement results of the composite signal. These
results evaluate the total signal over the period of one frame. The global results also
contain information about the quality of the measured signal of up to one frame. The
exact amount of data that is analyzed depends on the number of selected subframes.
IoT Channel Power
Shows the total power of the currently measured NB-IoT channel.
The channel power includes all NB-IoT subcarriers covered by the channel bandwidth.
Signal power outside the NB-IoT channel bandwidth is not included in the total power,
even if it is visible in the spectrum overview.
In case of over-the-air measurements, the total power includes all received signals in
the channel bandwidth.
Overall EVM
Shows the overall EVM of the signal.
The overall EVM includes all signal components, regardless of the modulation or
channel type.
Carrier Freq Error
Shows the frequency error in relation to the current center frequency of the R&S FSH.
For more information see "Selecting the Unit of the Carrier Frequency Error" on page
335.
Concerning uncertainty of the reference frequency of the GPS receiver, refer to the
data sheet.
Sync Signal Power
Shows the power of the synchronization signal (NPSS and NSSS).
OSTP
Shows the OSTP of the signal.
Frame Offset
Shows the time difference between the (sub)frame start and capture buffer start.
NCell ID [Grp/ID]
Shows the cell identity, cell group and cell ID the current results correspond to.
For more information see "Selecting the Cell Identity" on page 334.
Traffic Activity
Percentage of traffic slots with data.

R&S FSH Digital Modulation Analyzer
Measurements on NB-IoT Signals
Operating Manual 1173.6275.12 - 31 329
SINR
Shows the Signal to Interference and Noise ratio.
The SINR is the ratio of the signal power and the sum of interference and noise power.
RSSI (3GPP TS 36.214)
Shows the Received Signal Strength Indicator (RSSI).
The RSSI is the complete signal power of the channel that has been measured,
regardless of the origin of the signal.
9.9.1.3 Allocation Summary
The allocation summary becomes active when you have set the MIMO settings to a
specific antenna connected by cable. The allocation summary contains the results for
specific aspects of the signal like channels and modulation.
For each value, the R&S FSH shows the power in dBm and the average error vector
magnitude (EVM). For more information see "Configuring EVM Results" on page 336.
All results in the allocation summary are normalized to one resource element or one
subcarrier, respectively.
NRS
Power and EVM of the reference signal.
The R&S FSH evaluates the results over all resource blocks and subframes.
QPSK
Power and EVM of the data channels (NPDSCH) that you are measuring.
The R&S FSH evaluates the results over all resource blocks and subframes of the
respective modulation.
NPSS, NSSS, NPBCH
Power and EVM of the corresponding channel.

R&S FSH Digital Modulation Analyzer
Measurements on NB-IoT Signals
Operating Manual 1173.6275.12 - 31 330
9.9.2 The Constellation Diagram
The constellation diagram shows the location of the transmitted symbols in the
complex plane. It is therefore an indicator of the quality of the modulation of the signal.
► Press the "Result Display" softkey.
► Select the "Constellation Diagram" menu item.
The R&S FSH starts the constellation diagram.
Screen layout of the constellation diagram
1 Current type of result display
2 Currently selected standard
3 Color map
4 Diagram area
5 Carrier information
6 NB-IoT softkey menu
By default, the result display shows the symbol locations over all allocations. In that
case, the R&S FSH distinguishes modulation schemes used in the transmission of
data channels by using different colors.
● QPSK modulation
For easy identification of the pilot, synchronization and control channels in the diagram,
the R&S FSH also uses different colors.
● PSSS
● NSSS
● Control channels with QPSK modulation
R&S FSH Digital Modulation Analyzer
Measurements on NB-IoT Signals
Operating Manual 1173.6275.12 - 31 331
In addition to an overview of all allocations, you can also view the constellations of
particular channels or modulation schemes.
► Press the TRACE key.
► Press the "Constell Settings" softkey.
► Select the "Show Allocations…" menu item.
(The "Show Ideal Points" menu item shows the ideal symbol locations as a
guideline.)
► Select the allocation type you want to see the results for.
The R&S FSH adjusts the contents of the diagram and shows the channel you
have selected to the right of the diagram.

R&S FSH Digital Modulation Analyzer
Measurements on NB-IoT Signals
Operating Manual 1173.6275.12 - 31 332
9.9.3 Configuring the Measurement
Some of the results depend on the measurement configuration.
9.9.3.1 Selecting the Deployment
The 3GPP standard specifies several operating modes, or deployment. The
deployment specifies where the NB-IoT signal is located in the frequency spectrum.
● "In Band"
The NB-IoT signal uses resource blocks within an LTE carrier.
● "Guard Band"
The NB-IoT signal uses the resource blocks of the guard band of an LTE carrier.
● "Standalone" / "Standalone (Adjacent)"
The NB-IoT signal uses its own band outside of an LTE band, for example a
frequency band currently used by GSM. With a carrier bandwidth of 200 kHz in
GSM, there is enough room for an NB-IoT carrier (180 kHz), including a guard
interval of 10 kHz on both sides of the carrier.
Note: Select "Standalone (Adjacent)" if the standalone NB-IoT carrier is adjacent
to another channel, for example a GSM or WCDMA carrier. The application
automatically turns on a multicarrier filter to filter out interferences of the adjacent
channel during signal analysis.
► Press the MEAS key.
► Press the "Signal Settings" softkey.
► Select the "Deployment" menu item.
► Select the deployment of your system.
Turning the multicarrier filter on and off
You can also use the NB-IoT multicarrier filter for the other deployments if there are
interfering signals close to the NB-IoT channel.
► Press the MEAS key.
► Press the "Meas Settings" softkey.
► Select the "NB-IoT Filter" menu item.
The R&S FSH applies the filter to attenuate signals outside the NB-IoT bandwidth
and remove them from the results.
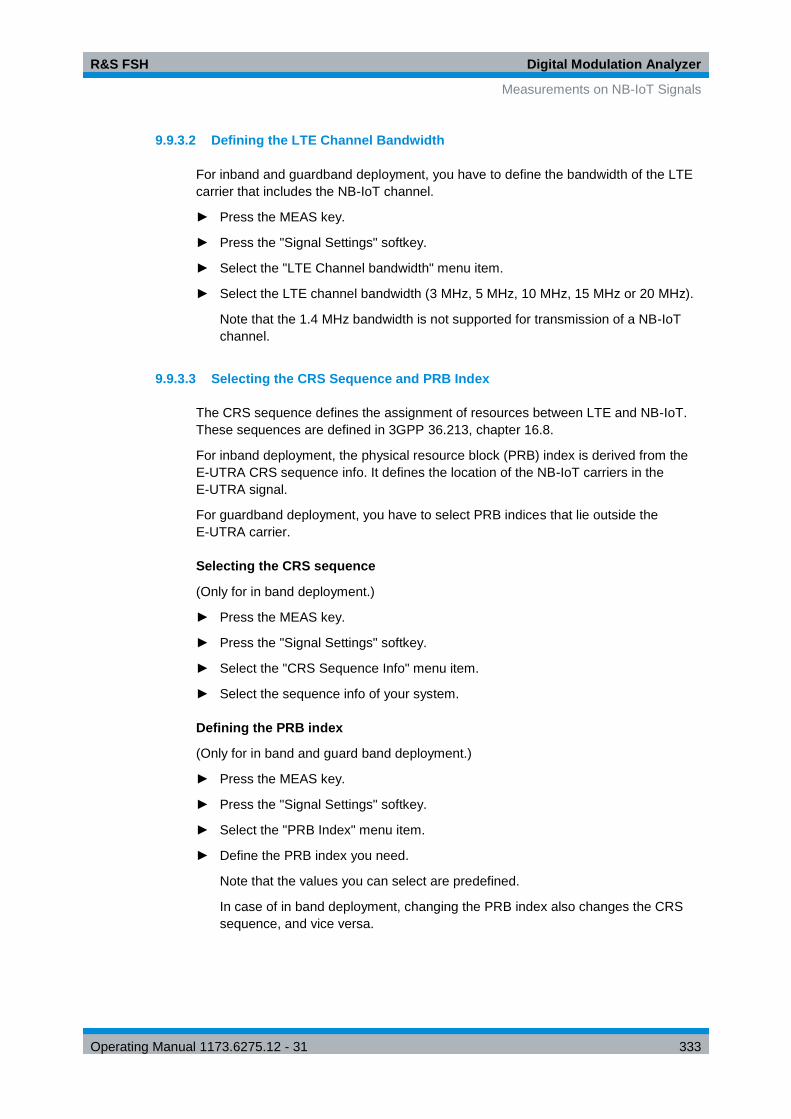
R&S FSH Digital Modulation Analyzer
Measurements on NB-IoT Signals
Operating Manual 1173.6275.12 - 31 333
9.9.3.2 Defining the LTE Channel Bandwidth
For inband and guardband deployment, you have to define the bandwidth of the LTE
carrier that includes the NB-IoT channel.
► Press the MEAS key.
► Press the "Signal Settings" softkey.
► Select the "LTE Channel bandwidth" menu item.
► Select the LTE channel bandwidth (3 MHz, 5 MHz, 10 MHz, 15 MHz or 20 MHz).
Note that the 1.4 MHz bandwidth is not supported for transmission of a NB-IoT
channel.
9.9.3.3 Selecting the CRS Sequence and PRB Index
The CRS sequence defines the assignment of resources between LTE and NB-IoT.
These sequences are defined in 3GPP 36.213, chapter 16.8.
For inband deployment, the physical resource block (PRB) index is derived from the
E-UTRA CRS sequence info. It defines the location of the NB-IoT carriers in the
E-UTRA signal.
For guardband deployment, you have to select PRB indices that lie outside the
E-UTRA carrier.
Selecting the CRS sequence
(Only for in band deployment.)
► Press the MEAS key.
► Press the "Signal Settings" softkey.
► Select the "CRS Sequence Info" menu item.
► Select the sequence info of your system.
Defining the PRB index
(Only for in band and guard band deployment.)
► Press the MEAS key.
► Press the "Signal Settings" softkey.
► Select the "PRB Index" menu item.
► Define the PRB index you need.
Note that the values you can select are predefined.
In case of in band deployment, changing the PRB index also changes the CRS
sequence, and vice versa.

R&S FSH Digital Modulation Analyzer
Measurements on NB-IoT Signals
Operating Manual 1173.6275.12 - 31 334
9.9.3.4 Defining a PRB Symbol Offset
(Only for in band and guard band deployment.)
The PRB Symbol Offset specifies the symbol offset of the NPDSCH allocations relative
to the subframe start. This setting applies to all subframes in a frame.
► Press the MEAS key.
► Press the "Signal Settings" softkey.
► Select the "PRB Symbol Offset" menu item.
► Define the PRB symbol offset you need.
9.9.3.5 Selecting the Cell Identity
The NCell ID, NCell identity group and physical layer identity are interdependent
parameters. In combination they are responsible for synchronization between network
and user equipment.
The NB-IoT standard defines 504 unique physical-layer cell identities. These are split
in 168 cell identity groups with 3 unique identities per group.
In the default state, the R&S FSH automatically detects the cell identity, its group and
ID. If you need results for a specific identity, you can also select it manually.
Setting the cell ID
► Press the MEAS key.
► Press the "Signal Settings" softkey.
► Select the "Cell Identity" menu item.
The R&S FSH opens an input field to define the cell identity.
► Enter a number between 0 and 503 to set the cell identity.
Setting the cell group and the cell ID
► Press the MEAS key.
► Press the "Signal Settings" softkey.
► First, select the "Group" menu item.
The R&S FSH opens an input field to select a cell group.
► Enter a number between 0 and 167 to select a cell identity group.
► Press the "Signal Settings" softkey.
► Select the "ID…" menu item.
The R&S FSH opens an input field to select an ID.
► Enter a number between 0 and 2 to select an ID.
The R&S FSH now shows the results to that cell identity.
R&S FSH Digital Modulation Analyzer
Measurements on NB-IoT Signals
Operating Manual 1173.6275.12 - 31 335
Selecting automatic detection of the cell ID
► Press the MEAS key.
► Press the "Signal Settings" softkey.
► Select the "Auto" menu item in the "Physical Layer Cell Identity" category.
9.9.3.6 Defining the Number of Subframes to Analyze
The NB-IoT frame consists of 10 subframes with a length of 1 ms each. By default, the
R&S FSH captures and analyzes all 10 subframes. However, you can select to capture
less subframes.
► Press the MEAS key.
► Press the "Meas Settings" softkey.
► Select the "Subframes To Analyze" menu item.
► Define the number of subframes you want to analyze (1 to 10).
The R&S FSH adjusts the results accordingly.
9.9.3.7 Selecting the Antenna Configuration
The antenna configuration selects the type of measurement, You can either measure
the signal quality in a conducted setup by connecting the R&S FSH to the base station
with a cable or over-the-air.
► Press the MEAS key.
► Press the "Antenna Settings" softkey.
► Select the menu item that corresponds to the setup of the equipment you are
measuring.
● "Over-The-Air": Capture and analyze the data with an antenna connected to the
RF input.
● "Connected to Tx1": Capture and analyze the data from the DUT connected with a
cable to the RF input.
9.9.3.8 Selecting the Unit of the Carrier Frequency Error
The absolute frequency error is the sum of the frequency error of the R&S FSH and
that of the device under test. If the frequency error is more than 1 kHz, the R&S FSH is
not able to synchronize with the signal. If possible, you should synchronize the receiver
and the transmitter.
The carrier frequency error can have the unit Hz or ppm.
► Press the MEAS key.
► Press the "Display Settings" softkey.
► Select the "Hz" or "ppm" menu item.
The R&S FSH shows the carrier frequency error in the unit you have selected.

R&S FSH Digital Modulation Analyzer
Measurements on NB-IoT Signals
Operating Manual 1173.6275.12 - 31 336
9.9.3.9 Configuring EVM Results
In case of the EVM, you can define the unit of the EVM and EVM calculation method.
To obtain EVM values according to standard, the channel estimation and EVM
windowing methods defined in 3GPP TS 36.141 are used. Prerequisites for a standard
compliant measurement are signals according to the enhanced test models defined in
36.141 and an external frequency reference delivered via the Ref In connector or via
GPS. The EVM according to standard measurement is mainly useful for high accuracy
signal quality measurements with cable-connected eNodeB antenna ports. The
measurement takes longer but the EVM value incorporates more signal errors like
inter-symbol-interference.
If the EVM is not measured with the “EVM According to Standard” option enabled,
optimum channel estimation and EVM calculation methods are used. Especially for
over-the-air measurements this setting is useful since influences of the air interface like
inter-symbol-interference are compensated. Additionally this mode is faster.
Selecting the unit of the EVM
► Press the MEAS key.
► Press the "Display Settings" softkey.
► Select either the "%" or "dB" menu item.
The R&S FSH shows the EVM in the unit you have selected.
Displaying the EVM according to standard
► Press the MEAS key.
► Press the "Meas Settings" softkey.
► Select the "EVM According to Standard" menu item.
If the R&S FSH displays the EVM according to standard, the menu item is marked
by an [X].
9.9.3.10 Synchronizing to a Base Station Using a GPS Receiver
If you use a GPS receiver while performing measurements on a base station, you can
synchronize the sweep via the GPS receiver.
► Press the SWEEP key.
► Press the "Trigger" softkey.
► Select GPS Sync menu item.
The R&S FSH now synchronizes the sweep to the signal using the GPS receiver.
For more information about the external trigger that is also available see "Working with
Trigger Functionality" on page .

R&S FSH Menu and Softkey Overview
General Functions
Operating Manual 1173.6275.12 - 31 337
10 Menu and Softkey Overview
This chapter shows an overview of all instrument functions in the form of softkey and
menu overviews.
10.1 General Functions
General functions are those that are available for all operating modes.
10.1.1 General R&S FSH Setup
The SETUP key opens the setup menu that contains functionality to set up the
R&S FSH in general and functionality to set up the measurement.

R&S FSH Menu and Softkey Overview
General Functions
Operating Manual 1173.6275.12 - 31 338
10.1.2 File Management
The SAVE/RECALL key opens the file manager that contains functionality to manage
datasets and other files.
10.1.3 Operating Mode Selection
The MODE key opens the mode menu that contains functionality to select the
operating mode of the R&S FSH.

R&S FSH Menu and Softkey Overview
Functions of the Spectrum Analyzer
Operating Manual 1173.6275.12 - 31 339
10.2 Functions of the Spectrum Analyzer
This section contains all softkeys and menus that are available in spectrum analyzer
mode.
10.2.1 Measurement Selection
The MEAS key opens the measurement menu that contains functionality to select and
configure the measurement.
The spectrogram is available only if you have installed option R&S FSH-K14.
Channel Power

R&S FSH Menu and Softkey Overview
Functions of the Spectrum Analyzer
Operating Manual 1173.6275.12 - 31 340
Occupied Bandwith
TDMA Power
Spectrum Emission Mask
Spurious Emission
Harmonic Distortion
AM Modulation Depth

R&S FSH Menu and Softkey Overview
Functions of the Spectrum Analyzer
Operating Manual 1173.6275.12 - 31 341
Spectrogram
Spectrogram Playback

R&S FSH Menu and Softkey Overview
Functions of the Spectrum Analyzer
Operating Manual 1173.6275.12 - 31 342
10.2.2 Frequency Parameters
The FREQ key opens the frequency menu that contains functionality to set up the
horizontal axis of the measurement diagram.
10.2.3 Span Selection
The SPAN key opens the span menu that contains functionality to set the span.
10.2.4 Amplitude Parameters
The AMPT key opens the amplitude menu that contains functionality to set up the
vertical axis of the measurement diagram.

R&S FSH Menu and Softkey Overview
Functions of the Spectrum Analyzer
Operating Manual 1173.6275.12 - 31 343
10.2.5 Sweep Configuration
The SWEEP key opens a menu that contains all functionality to configure the sweep.
10.2.6 Bandwidth Selection
The BW key opens a menu that contains all functionality to set the bandwidths.
10.2.7 Trace Functionality
The TRACE key opens the trace menu that contains functionality to set up the traces.
10.2.8 Display and Limit Lines
The LINES key opens a menu that contains the functionality to control display and limit
lines.
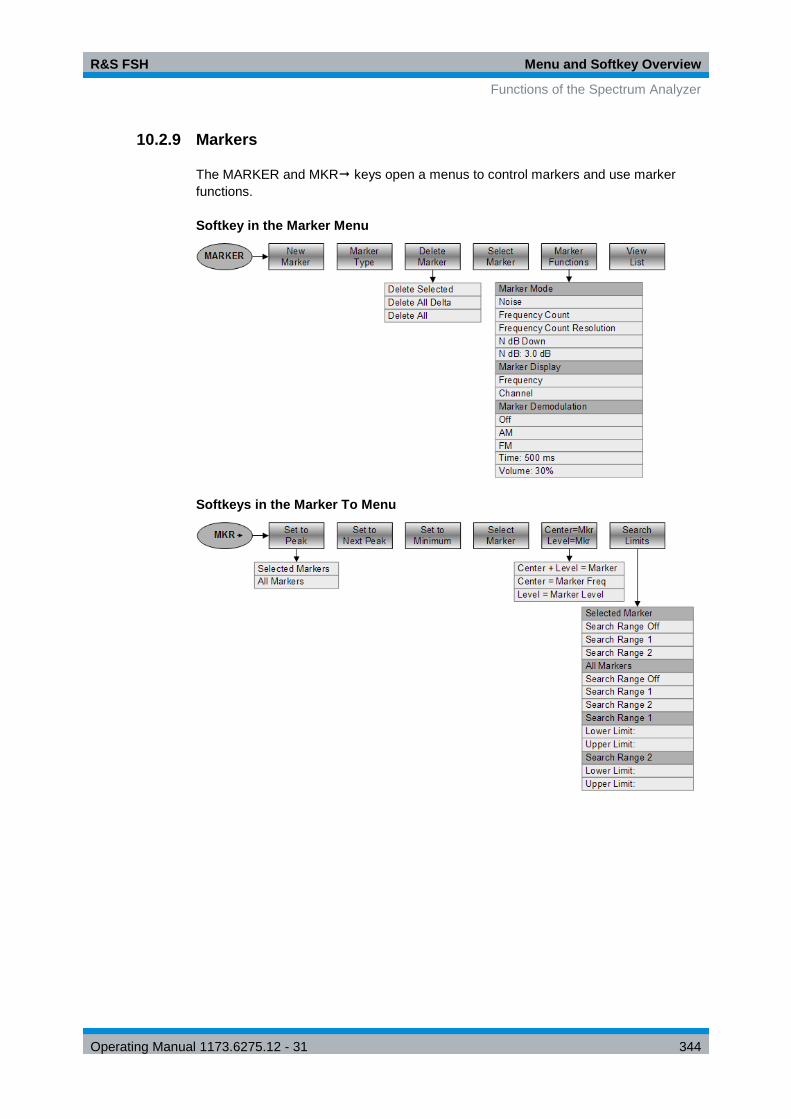
R&S FSH Menu and Softkey Overview
Functions of the Spectrum Analyzer
Operating Manual 1173.6275.12 - 31 344
10.2.9 Markers
The MARKER and MKR keys open a menus to control markers and use marker
functions.
Softkey in the Marker Menu
Softkeys in the Marker To Menu

R&S FSH Menu and Softkey Overview
Functions of the Network Analyzer
Operating Manual 1173.6275.12 - 31 345
10.3 Functions of the Network Analyzer
This section contains all softkeys and menus that are available in network analyzer
mode.
Vector network analyzer functionality is available only with option R&S FSH-K42.
10.3.1 Measurement Configuration
The MEAS key opens the measurement menu that contains functionality to select and
configure the measurement.
10.3.2 Frequency Parameters
The FREQ key opens the frequency menu that contains functionality to set up the
horizontal axis of the measurement diagram.

R&S FSH Menu and Softkey Overview
Functions of the Network Analyzer
Operating Manual 1173.6275.12 - 31 346
10.3.3 Span Selection
The SPAN key opens the span menu that contains functionality to set the span.
10.3.4 Amplitude Parameters
The AMPT key opens the amplitude menu that contains functionality to set up the
vertical axis of the measurement diagram.
10.3.5 Sweep Configuration
The SWEEP key opens a menu that contains all functionality to configure the sweep.
10.3.6 Bandwidth Selection
The BW key opens a menu that contains all functionality to set the bandwidths.

R&S FSH Menu and Softkey Overview
Functions of the Network Analyzer
Operating Manual 1173.6275.12 - 31 347
10.3.7 Trace Functionality
The TRACE key opens the trace menu that contains functionality to set up the traces.
10.3.8 Limit Lines
The LINES key opens a menu that contains the functionality to control limit lines.
10.3.9 Markers
The MARKER and MKR keys open a menus to control markers and use marker
functions.
Softkey in the Marker Menu

R&S FSH Menu and Softkey Overview
Functions of the Network Analyzer
Operating Manual 1173.6275.12 - 31 348
Softkeys in the Marker To Menu
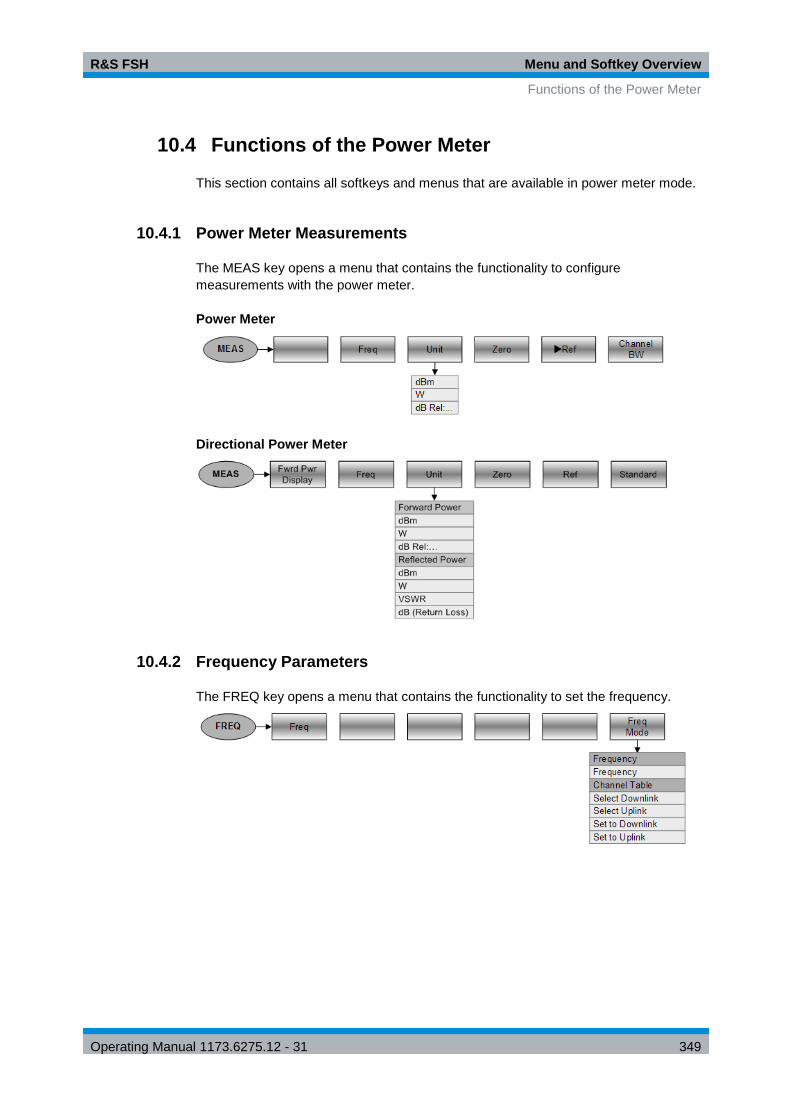
R&S FSH Menu and Softkey Overview
Functions of the Power Meter
Operating Manual 1173.6275.12 - 31 349
10.4 Functions of the Power Meter
This section contains all softkeys and menus that are available in power meter mode.
10.4.1 Power Meter Measurements
The MEAS key opens a menu that contains the functionality to configure
measurements with the power meter.
Power Meter
Directional Power Meter
10.4.2 Frequency Parameters
The FREQ key opens a menu that contains the functionality to set the frequency.

R&S FSH Menu and Softkey Overview
Functions of the Power Meter
Operating Manual 1173.6275.12 - 31 350
10.4.3 Amplitude Parameters
The AMPT key contains functionality to configure level parameters.
10.4.4 Sweep Configuration
The SWEEP key opens a menu that contains functionality to configure the sweep.
Power Meter and Directional Power Meter
Pulse Power Measurements

R&S FSH Menu and Softkey Overview
Functions of the Power Meter
Operating Manual 1173.6275.12 - 31 351
10.4.5 Bandwidth Configuration
The BW key opens a menu that contains functionality to configure the bandwidth. This
is only available with Pulse Power Measurements.
10.4.6 Trace Configuration
The TRACE key opens a menu that contains functionality to configure the trace. This is
only available with Pulse Power Measurements.

R&S FSH Menu and Softkey Overview
Functions of the Distance-to-Fault Mode
Operating Manual 1173.6275.12 - 31 352
10.5 Functions of the Distance-to-Fault Mode
This section contains all softkeys and menus that are available in distance-to-fault
mode.
Distance-to-fault functionality is available with option R&S FSH-K41.
10.5.1 Measurement Configuration
The MEAS key opens the measurement menu that contains functionality to select and configure the measurement.
10.5.2 Frequency Parameters
The FREQ key opens the frequency menu that contains functionality to set up the
horizontal axis of the measurement diagram.
10.5.3 Span Selection
The SPAN key opens the span menu that contains functionality to set the span.
DTF measurements

R&S FSH Menu and Softkey Overview
Functions of the Distance-to-Fault Mode
Operating Manual 1173.6275.12 - 31 353
Reflection and spectrum measurements
10.5.4 Amplitude Parameters
The AMPT key opens the amplitude menu that contains functionality to set up the
vertical axis of the measurement diagram.
10.5.5 Sweep Configuration
The SWEEP key opens a menu that contains all functionality to configure the sweep.
10.5.6 Bandwidth Selection
The BW key opens a menu that contains all functionality to set the bandwidths.

R&S FSH Menu and Softkey Overview
Functions of the Distance-to-Fault Mode
Operating Manual 1173.6275.12 - 31 354
10.5.7 Trace Functionality
The TRACE key opens the trace menu that contains functionality to set up the traces.
10.5.8 Markers
The MARKER and MKR keys open a menus to control markers and use marker
functions.
Softkey in the Marker Menu
Softkeys in the Marker To Menu

R&S FSH Menu and Softkey Overview
Functions of the Receiver Mode
Operating Manual 1173.6275.12 - 31 355
10.6 Functions of the Receiver Mode
This section contains all softkeys and menus that are available in receiver mode.
Receiver functionality is available with option R&S FSH-K43.
10.6.1 Measurement Configuration
The MEAS key opens the measurement menu that contains functionality to select and
configure the measurement.
Single frequency measurements
Channel scans
10.6.2 Frequency Parameters
The FREQ key opens the frequency menu that contains functionality to set up the
horizontal axis of the measurement diagram.
10.6.3 Span Selection
The SPAN key opens the span menu that contains functionality to set the span.

R&S FSH Menu and Softkey Overview
Functions of the Receiver Mode
Operating Manual 1173.6275.12 - 31 356
10.6.4 Amplitude Parameters
The AMPT key opens the amplitude menu that contains functionality to set up the
vertical axis of the measurement diagram.
10.6.5 Sweep Configuration
The SWEEP key opens a menu that contains all functionality to configure the sweep.
10.6.6 Bandwidth Selection
The BW key opens a menu that contains all functionality to set the bandwidths.
10.6.7 Trace Functionality
The TRACE key opens the trace menu that contains functionality to set up the traces.

R&S FSH Menu and Softkey Overview
Functions of the Receiver Mode
Operating Manual 1173.6275.12 - 31 357
10.6.8 Markers
The MARKER and MKR keys open a menus to control markers and use marker
functions.
Softkeys in the Marker Menu
Softkeys in the Marker To Menu

R&S FSH Menu and Softkey Overview
Functions of the Interference Analyzer (Map Mode)
Operating Manual 1173.6275.12 - 31 358
10.7 Functions of the Interference Analyzer (Map Mode)
This section contains all softkeys and menus that are available in the Maps mode of
the interference analyzer.
Map mode functionality is available only with options R&S FSH-K15 and / or -K16..
10.7.1 Measurement Configuration
The MEAS key opens the measurement menu that contains functionality to select and
configure the measurement.
10.7.2 Frequency Parameters
The FREQ key opens the frequency menu that contains functionality to set up the
horizontal axis of the measurement diagram.

R&S FSH Menu and Softkey Overview
Functions of the Interference Analyzer (Map Mode)
Operating Manual 1173.6275.12 - 31 359
10.7.3 Amplitude Parameters
The AMPT key opens the amplitude menu that contains functionality to set up the
vertical axis of the measurement diagram.
10.7.4 Sweep Configuration
The SWEEP key opens a menu that contains all functionality to configure the sweep.
10.7.5 Bandwidth Selection
The BW key opens a menu that contains all functionality to set the bandwidths.
10.7.6 Trace Functionality
The TRACE key opens the trace menu that contains functionality to set up the traces.

R&S FSH Menu and Softkey Overview
Functions of the Digital Modulation Analyzer
Operating Manual 1173.6275.12 - 31 360
10.8 Functions of the Digital Modulation Analyzer
This section contains all softkeys and menus that are available in digital modulation
mode.
Digital modulation functionality is available only with one of the corresponding options.
10.8.1 Measurement Configuration
The MEAS key opens the measurement menu that contains functionality to select and configure the measurement.
GSM
3GPP WCDMA

R&S FSH Menu and Softkey Overview
Functions of the Digital Modulation Analyzer
Operating Manual 1173.6275.12 - 31 361
CDMA2000
1xEV-DO
TD-SCDMA

R&S FSH Menu and Softkey Overview
Functions of the Digital Modulation Analyzer
Operating Manual 1173.6275.12 - 31 362
LTE FDD and TDD
LTE NB-IoT

R&S FSH Menu and Softkey Overview
Functions of the Digital Modulation Analyzer
Operating Manual 1173.6275.12 - 31 363
10.8.2 Frequency Parameters
The FREQ key opens the frequency menu that contains functionality to set up the
horizontal axis of the measurement diagram.
10.8.3 Amplitude Parameters
The AMPT key opens the amplitude menu that contains functionality to set up the
vertical axis of the measurement diagram.
3GPP WCDMA, TD-SCDMA and LTE FDD / TDD
GSM, CDMA2000 and 1xEV-DO

R&S FSH Menu and Softkey Overview
Functions of the Digital Modulation Analyzer
Operating Manual 1173.6275.12 - 31 364
10.8.4 Sweep Configuration
The SWEEP key opens a menu that contains all functionality to configure the sweep.
3GPP WCDMA and TD-SCDMA
GSM, CDMA2000, 1xEV-DO, LTE FDD/TDD and NB-IoT
10.8.5 Trace Functionality
The TRACE key opens the trace menu that contains functionality to set up the traces.
3GPP WCDMA and LTE (Spectrum Overview and Isotropic Antenna only)
GSM, CDMA2000 and 1xEV-DO (Spectrum Overview only)
TD-SCDMA (Spectrum Overview only)

R&S FSH Menu and Softkey Overview
Functions of the Digital Modulation Analyzer
Operating Manual 1173.6275.12 - 31 365
3GPP WCDMA (BTS Scanner only)
TD-SCDMA (Sync ID only)

R&S FSH How a Spectrum Analyzer Works
Functions of the Digital Modulation Analyzer
Operating Manual 1173.6275.12 - 31 366
11 How a Spectrum Analyzer Works
Basically, it is possible to measure and analyze RF signals either in the time domain or
the frequency domain.
Measurements in the time domain show signal variations over time. You can perform
these with an oscilloscope, for example. Measurements in the frequency domain show
the frequency components of a signal. To perform measurements in the frequency
domain, you can use a spectrum analyzer.
Both modes are essentially equivalent because applying the Fourier transform to any
signal converts it into its spectral components. Depending on the signal characteristic
to be measured, one method is usually more appropriate than the other. With an
oscilloscope, it is possible to tell whether a signal is a sine wave, a square wave with a
certain on/off ratio or a sawtooth wave. However, detecting superimposed low-level
signals or monitoring the harmonic content of the signal is easier with a spectrum or
signal analyzer.
Figure 11-1 shows the theoretical basis of the two measurement methods. In the time
domain, an oscilloscope would, for example, show a section of the signal that is a
square wave. The same signal, when viewed with a spectrum analyzer, would show a
line spectrum (the fundamental and its harmonics).
Figure 11-1: Visualization of time domain and frequency domain
Applying the Fourier transform to the periodic square wave transforms it into the
frequency domain. The spectrum analyzer would show the fundamental (or frequency
of the square wave) and its harmonics.
The spectrum analyzer uses a narrow bandpass filter for measurements in the
frequency domain. Only at frequencies containing a signal there is a reading that gives
the amplitude of the frequency component.
Figure 11-2 shows the basic principle of how a spectrum analyzer works.

R&S FSH How a Spectrum Analyzer Works
Functions of the Digital Modulation Analyzer
Operating Manual 1173.6275.12 - 31 367
Figure 11-2: Block diagram showing the basic functionality of a spectrum analyzer
The precision attenuator at the R&S FSH input attenuates the signal to a level that the
mixer can handle without overdriving the mixer. The attenuator is directly coupled to
the reference level. You can attenuate the signal in the range from 0 dB to 40 dB in
steps of 5 dB.
The mixer converts the RF signal to a fixed intermediate frequency (IF). This process
usually involves several stages. It lasts until you get an IF for which good narrowband
filters are available. The R&S FSH needs three mixing stages to get an IF that the filter
can handle. Figure 11-3 graphically shows the mixing process.
For models with a frequency limit of 3.6 GHz, the IFs are 4892.8 MHz, 860.8 MHz and
54.4 MHz. The conversion from a specific input frequency to the first IF is done by a
local oscillator (LO). This LO can be tuned from 4.8 GHz to 8.4 GHz. All other
conversions are handled by single-frequency oscillators.
In case of models with a frequency limit of 8 GHz, the IFs are 8924.8 MHz, 860.8 MHz
and 54.4 MHz. The conversion from the first to the second IF for these models is done
by a second local oscillator.
The frequency of the local oscillator determines the input frequency at which the
spectrum analyzer performs measurements:
fin = fLO – fIF.
The first mixer produces the sum frequency fLO + fin (= image frequency fimage) as well
as the difference frequency fLO – fin.
The image frequency is rejected by the bandpass at the IF so that it does not interfere
with the subsequent frequency conversions.
Figure 11-3: Mixing process

R&S FSH How a Spectrum Analyzer Works
Functions of the Digital Modulation Analyzer
Operating Manual 1173.6275.12 - 31 368
The first local oscillator is tuned with a sawtooth which simultaneously acts as the x
deflection voltage for the display. In practice, synthesizer technology is used to
generate the frequency of the first local oscillator and for a digital display.
The instantaneous sawtooth voltage therefore determines the input frequency of the
spectrum analyzer.
The bandwidth of the IF filter at the IF determines the bandwidth that is used for
measurements. Pure sine signals are passed by the IF filter characteristics. This
means that signals closer together than the bandwidth of the IF filter cannot be
resolved. This is why the bandwidth of the IF filter in a spectrum analyzer is referred to
as the resolution bandwidth. The R&S FSH has resolution bandwidths from 1 Hz to
3 MHz.
The bandlimited IF is passed to the envelope detector. The envelope detector removes
the IF from the signal and outputs its envelope. The output signal from the envelope
detector is referred to as the video signal. As it has been demodulated, it only contains
amplitude information. The phase information is lost.
With RF sine signals, the video signal is a DC voltage. With AM signals the video
signal contains a DC component whose amplitude corresponds to the carrier power
and an AC component whose frequency is equal to the modulation frequency, provided
the modulation frequency is inside the resolution bandwidth.
The video filter comes after the envelope detector. The filter is a lowpass with an
adjustable cutoff frequency which limits the bandwidth of the video signal. It is
particularly useful when sine signals are to be measured in the vicinity of the spectrum
analyzer’s intrinsic noise. The sine signal produces a video signal that is a DC voltage.
At the IF, however, the noise is distributed over the whole bandwidth or, in the case of
the video signal, over half the bandwidth of the resolution filter. By selecting a narrow
video bandwidth relative to the resolution bandwidth, the noise can be suppressed,
while the sine signal to be measured (= DC) is not affected.
The figures below show a weak sine signal. In the first picture, it is measured with a
large video bandwidth and in the second with a narrow video bandwidth.

R&S FSH How a Spectrum Analyzer Works
Functions of the Digital Modulation Analyzer
Operating Manual 1173.6275.12 - 31 369
Limiting the video bandwidth smoothes the trace considerably. This makes it much
easier to determine the level of the measured signal.
The detector comes after the video filter. The detector combines the measured
spectrum so that it can be represented as one pixel in the trace. The R&S FSH uses
631 pixels to form the trace, i.e. the whole measured spectrum has to be represented
using just 631 pixels. Common types of spectrum analyzer detectors are the peak
detector (PEAK), the sample detector (SAMPLE) and the RMS detector (RMS). An
Auto Peak detector which simultaneously displays the maximum peak and the
minimum peak is usually also provided. The Fig. below explains how these detectors
work.
The figure above shows 30 measured values which are represented by a single pixel.
The peak detector determines and displays the maximum measured value. The Auto
Peak detector takes the maximum and minimum and displays them together. The two
values are joined by a vertical line segment. This gives a good indication of the level
variation over the measured values represented by a single pixel. The RMS detector is
used by the spectrum analyzer to determine the RMS value of the measured values. It
is therefore a measure of the spectral power represented by a pixel. The sample
detector takes an arbitrary measurement value and displays it (in the Fig. above, the
first). The other measured values are ignored.

R&S FSH How a Spectrum Analyzer Works
Functions of the Digital Modulation Analyzer
Operating Manual 1173.6275.12 - 31 370
On the basis of the operating principles of detectors, a few recommendations can be
made as to their use.
● It is best to use the Auto Peak detector or the peak detector for spectrum analysis
over large frequency ranges. This ensures that all signals are displayed.
● The RMS detector is recommended for power measurements on modulated
signals. However, the display range should be chosen so as not to exceed 100
times the bandwidth of the signal or the resolution bandwidth, whichever is larger.
● The sample detector or the RMS detector (preferred) should be used for noise
measurements. Only these two detectors are capable of measuring noise power
correctly.
● When measurements are made on sine signals, the level display does not depend
on the detector. However, if you use the RMS detector or the sample detector,
ensure that the span is not too great. Otherwise, the displayed levels of sine
signals may be lower than their true value.
R&S FSH Index
Operating Manual 1173.6275.12 - 31 371
Index 1xEV-DO ......................................................................... 284
carrier frequency error .................................................. 289
EVM ............................................................................. 287
PN offset ....................................................................... 289
power ........................................................................... 286
result summary ............................................................. 285
rho ................................................................................ 287
Tau ............................................................................... 287
6 dB bandwidth ................................................................ 237
ACLR
absolute results .............................................................. 70
adjacent channel............................................................. 67
channel bandwidth .......................................................... 68
channel spacing .............................................................. 68
limit check ....................................................................... 71
measurement configuration............................................. 67
measurement settings..................................................... 65
normalization .................................................................. 70
reference channel ........................................................... 70
relative results ................................................................ 70
standard ......................................................................... 67
transmission channel ...................................................... 67
Adjacent channel ............................................................... 67
Adjacent Channel Leakage Ratio (ACLR) .......................... 64
Adjust level
channel power ................................................................ 54
occupied bandwidth ........................................................ 58
TDMA power ................................................................... 62
Adjust settings
AM modulation depth ...................................................... 79
carrier-to-interference ................................................... 157
carrier-to-noise ............................................................. 156
harmonic distortion ......................................................... 77
AM demodulator .............................................................. 125
AM modulation depth ......................................................... 78
adjust settings ................................................................. 79
threshold ......................................................................... 79
Amplitude ................................................................. 100, 204
Antenna diversity ............................................................. 269
Attenuation ............................................... 102, 145, 225, 242
Audio demodulation
time .............................................................................. 126
volume .......................................................................... 126
Audio demodulator ........................................................... 125
Auto low noise/distortion .................................................. 102
Auto peak ........................................................................ 114
Auto span ........................................................................ 222
Automatic scaling ............................................................. 225
Average (detector) ........................................................... 235
Average trace .................................................................. 113
Averaging time ................................................................. 139
Band class ....................................................................... 240
Bandwidth ........................................................................ 104
resolution ...................................................................... 104
video ............................................................................. 105
Base station test ............... 248, 256, 271, 284, 290, 306, 325
Beeper ............................................................................. 129
BitReverse ....................................................................... 281
BSIC ................................................................................ 251
BTS scanner .................................................................... 316
Burst length ....................................................................... 62
Burst power ..................................................................... 253
Cable length .................................................................... 223
Cable loss ........................................................................ 216
Cable measurement
test setup ...................................................................... 212
Cable model .................................................................... 219
Cable tests....................................................................... 212
Calibration ........................................................ 182, 209, 218
state ............................................................................. 182
Calibration kit .................................................... 182, 186, 218
Calibration method ........................................................... 184
Calibration procedure ....................................................... 185
Carrier frequency error
1xEV-DO ...................................................................... 289
CDMA2000 ................................................................... 282
GSM ............................................................................. 255
LTE ............................................................................... 322
NB-IoT .......................................................................... 335
TD-SCDMA .................................................................. 305
W-CDMA ...................................................................... 258
Carrier-to-Interference ..................................................... 157
Carrier-to-Noise ............................................................... 156
CDMA2000 ...................................................................... 271
carrier frequency error .................................................. 282
code order .................................................................... 281
EVM ..................................................................... 273, 293
PN offset ....................................................................... 283
power ........................................................................... 273
result summary ............................................................. 272
Rho ............................................................................... 273
synchronization ............................................................. 273
Tau ............................................................................... 274
Cell ID ...................................................................... 319, 334
Center frequency ........................ 96, 138, 143, 222, 240, 326
CF step size ....................................................................... 96
Channel bandwidth
ACLR .............................................................................. 68
channel power ................................................................ 55
LTE ............................................................................... 319
occupied bandwidth ........................................................ 59
Channel number .............................................................. 240
Channel power................................................................... 53
adjust level ..................................................................... 54
channel bandwidth .......................................................... 55
display mode .................................................................. 56
reference level ................................................................ 54
span ............................................................................... 55
standard ......................................................................... 54
unit ................................................................................. 56
Channel scan ................................................................... 228
Channel spacing ................................................................ 68

R&S FSH Index
Operating Manual 1173.6275.12 - 31 372
Channel table........................................................... 131, 206
Channels
1xEV-DO ...................................................................... 287
CDMA2000 ........................................................... 274, 278
LTE ............................................................................... 311
NB-IoT .......................................................................... 329
TD-SCDMA................................................................... 298
WCDMA ....................................................................... 265
W-CDMA ...................................................................... 260
CISPR bandwidth ............................................................ 237
Clear / write ............................................................. 113, 243
Clear spectrogram ............................................................. 84
Code domain channel table ..............................264, 277, 297
Code domain power
CDMA2000 ................................................................... 275
TD-SCDMA................................................................... 295
WCDMA ....................................................................... 261
Code order ....................................................................... 281
Color map
constellation diagram ............................................ 314, 330
resource allocations ...................................................... 318
Color schemes
LTE ............................................................................... 318
spectrogram.................................................................... 85
Constellation Diagram .......................................314, 317, 330
Continuous sweep ........................................................... 108
Conventions ....................................................................... 11
Correction data ................................................................ 182
CPICH ............................................................................. 260
Cursor keys ....................................................................... 16
Cyclic prefix ..................................................................... 319
Data management ............................................................. 30
Data parts ........................................................................ 294
Delay time ........................................................................ 110
Deltamarker ..................................................................... 118
Detector ........................................................................... 114
Digital modulation ............................................................ 239
1xEV-DO ...................................................................... 284
CDMA2000 ................................................................... 271
GSM ............................................................................. 248
LTE ....................................................................... 306, 325
settings ......................................................................... 240
synchronization ............................................................. 242
TD-SCDMA................................................................... 290
W-CDMA ...................................................................... 256
Directional power sensor.................................................. 141
Display configuration (spectrogram) ................................... 85
Display elements ............................................................... 12
Display line ...................................................................... 127
Display mode ..................................................................... 56
Display range ....................................................101, 205, 224
spectrogram.................................................................... 87
Distance parameters ........................................................ 222
Distance-to-fault ............................................................... 215
Dual trace ........................................................................ 202
Error vector magnitude
1xEV-DO ...................................................................... 287
CDMA2000 ........................................................... 273, 293
LTE ....................................................................... 322, 336
Events ............................................................................... 22
EVM
LTE (overall) ................................................................. 309
NB-IoT (overall) ............................................................ 328
External trigger ................................................................ 108
Factory calibration ........................................................... 182
File management ............................................................... 30
Firmware ........................................................................... 40
FM demodulator ............................................................... 125
Forward power display ..................................................... 144
Frame ................................................................................ 89
spectrogram ................................................................... 89
Free run ........................................................................... 108
Frequency
counter ......................................................................... 123
mode ............................................................................ 131
offset .............................................................................. 97
range ...................................................................... 98, 222
settings .................................................... 96, 138, 143, 222
start/stop ................................................................. 98, 222
Full span ............................................................................ 99
Gate settings ................................................................... 111
Gated sweep ........................................................... 108, 110
GPS position .................................................................... 242
GPS synchronization ................................ 283, 289, 324, 336
GSM ................................................................................ 248
burst power ................................................................... 253
carrier frequency error .................................................. 255
EVM ............................................................................. 252
I/Q offset ....................................................................... 252
power ........................................................................... 250
result summary ............................................................. 249
Hadamard ........................................................................ 281
Harmonic distortion ............................................................ 76
adjust settings ................................................................. 77
harmonics ....................................................................... 77
harmonics list.................................................................. 77
THD ................................................................................ 77
History ............................................................................... 84
Hold spectrogram .............................................................. 84
Horizontal axis ........................................................... 96, 222
Impedance ....................................................................... 103
Smith chart ................................................................... 202
Input
cancellation .................................................................... 15
characters ....................................................................... 14
confirmation .................................................................... 15
numbers ......................................................................... 14
Instrument setup ................................................................ 18
Isotropic antenna ............................................................... 94
digital modulation .......................................................... 246
Key
Ampt (CAT) .................................................................. 224
Ampt (NA) ..................................................................... 204
Ampt (SA) ..................................................................... 100
BW ............................................................................... 104
Cal ........................................................................ 182, 218
Freq (CAT) ................................................................... 222
Freq (SA) ........................................................................ 96
Marker .......................................................................... 118
Meas (DTF) .................................................................. 214

R&S FSH Index
Operating Manual 1173.6275.12 - 31 373
Meas (NA) ............................................. 182, 188, 192, 197
Meas (PM) ............................................................ 138, 143
Meas (SA) ...................................................................... 52
MKR -> ......................................................................... 118
Sweep .......................................................................... 107
Trace ............................................................................ 113
Last span ........................................................................... 99
Limit check ....................................................................... 129
ACLR .............................................................................. 71
Limit lines ................................................................. 128, 207
LTE .......................................................................... 306, 325
carrier frequency error .................................................. 322
cell ID ........................................................................... 319
channel bandwidth ........................................................ 319
cylic prefix ..................................................................... 319
EVM ..................................................................... 322, 336
MIMO............................................................................ 321
power ........................................................................... 309
reference signal ............................................................ 312
subframe configuration ................................................. 320
synchronization ............................................................. 312
MAC ................................................................................ 287
Manual span .................................................................... 222
Marker ..................................................................... 118, 206
automatic positioning .................................................... 120
delta marker.................................................................. 119
distance ........................................................................ 124
format ........................................................................... 201
functions ....................................................................... 123
list ................................................................................. 119
mode ............................................................................ 201
position ................................................................. 119, 124
removal ......................................................................... 121
search limit ................................................................... 122
selection ....................................................................... 120
Smith chart ................................................................... 201
spectrogram.................................................................... 89
type .............................................................................. 120
Marker list
AM modulation depth ...................................................... 79
harmonic distortion ......................................................... 77
spectrogram.................................................................... 89
Mathematics .................................................................... 117
Max hold .................................................................. 113, 243
Max peak ................................................................. 114, 235
Measurement ................................................................... 107
ACLR .............................................................................. 64
AM modulation depth ...................................................... 78
audio demodulation ...................................................... 125
cable loss (NA) ............................................................. 198
carrier-to-interference ................................................... 157
carrier-to-noise ............................................................. 156
channel power ................................................................ 53
directional power sensor ............................................... 143
distance-to-fault ............................................................ 215
electrical length ............................................................. 199
frequency counter ......................................................... 123
group delay ................................................................... 198
harmonic distortion ......................................................... 76
isotropic antenna ............................................................ 94
magnitude ..................................................................... 197
n dB down .................................................................... 124
noise power density ...................................................... 123
occupied bandwidth ........................................................ 57
phase ........................................................................... 197
power sensor ................................................................ 138
reflection ....................................................................... 214
reflection (VV) ............................................................... 210
reflection coefficient ...................................................... 198
reflection scalar ............................................................ 190
reflection vector ............................................................ 195
scalar ............................................................................ 188
Smith chart ................................................................... 198
spectrogram ................................................................... 83
spectrum analyzer .......................................................... 52
spectrum emission mask ................................................ 73
spurious emissions ......................................................... 80
TDMA power................................................................... 61
transmission (VV) ......................................................... 210
transmission scalar ....................................................... 188
transmission vector ....................................................... 192
vector ........................................................................... 192
vector voltmeter .................................................... 208, 211
VSWR .......................................................................... 198
Measurement format ......................................... 197, 211, 216
Measurement setup ........................................................... 17
Measurement wizard.......................................................... 41
dataset ........................................................................... 42
evaluation ....................................................................... 51
measurement set ............................................................ 42
measurements ................................................................ 48
Memory trace ........................................................... 117, 204
Menus .............................................................................. 337
DTF ...................................................................... 352, 360
general ......................................................................... 337
maps ............................................................................ 358
network analyzer .......................................................... 345
power meter ................................................................. 349
receiver......................................................................... 355
spectrum analysis ......................................................... 339
Midamble ......................................................................... 294
MIMO ............................................................................... 321
Min hold ................................................................... 113, 243
Min peak .......................................................................... 114
Multiple traces ................................................................. 116
n dB down........................................................................ 124
NB-IoT
carrier frequency error .................................................. 335
cell ID ........................................................................... 334
power ........................................................................... 328
Network analysis .............................................................. 178
Noise power ..................................................................... 123
Normalization (NA) .......................................................... 182
Normalization (SA) ............................................................. 70
NPBCH ............................................................................ 329
NPSS............................................................................... 329
NSSS............................................................................... 329
Number of harmonics ......................................................... 77
Occupied bandwidth .......................................................... 57
adjust level ..................................................................... 58

R&S FSH Index
Operating Manual 1173.6275.12 - 31 374
channel bandwidth .......................................................... 59
power percentage ........................................................... 59
reference level ................................................................ 58
span ............................................................................... 60
standard ......................................................................... 58
Offset
frequency ........................................................................ 97
reference level .............................................................. 101
Operating mode
digital modulation .......................................................... 239
distance-to-fault ............................................................ 212
network analyzer........................................................... 178
receiver ......................................................................... 228
spectrum analyzer .......................................................... 52
Options .............................................................................. 40
PBCH .............................................................................. 311
P-CCPCH ........................................................................ 260
PCFICH ........................................................................... 311
PICH ........................................................................ 274, 287
Playback ............................................................................ 89
PN offset
1xEV-DO ...................................................................... 289
CDMA2000 ................................................................... 283
PN scanner
1xEV-DO ...................................................................... 288
CDMA2000 ................................................................... 280
Power meter .................................................................... 135
Power percentage .............................................................. 59
Power sensor ................................................................... 137
attenuation .................................................................... 145
averaging time .............................................................. 139
directional ..................................................................... 141
errors ............................................................................ 137
reference level .............................................................. 139
standard ....................................................................... 144
unit ....................................................................... 139, 144
weighting mode ............................................................ 144
zeroing.......................................................................... 138
Preamplifier ............................................................. 103, 242
Preset ................................................................................ 17
Preview dataset ................................................................. 37
Primary transducer........................................................... 132
P-SCH ............................................................................. 260
P-SYNC ........................................................................... 311
Quasi peak ...................................................................... 235
R&S InstrumentView
ACLR .............................................................................. 65
calibration kit ................................................................. 186
creating standards ................................... 54, 58, 62, 67, 74
isotropic antenna ............................................................ 95
spectrum emission mask ................................................ 73
Radio configuration .......................................................... 278
RBW ................................................................................ 104
Receiver .......................................................................... 228
Record spectrogram .......................................................... 88
Reference channel ............................................................. 70
Reference frequency ........................................................ 124
Reference impedance ...................................................... 202
Reference level ................................................................ 100
channel power ................................................................ 54
digital modulation .......................................................... 241
directional power sensor ............................................... 144
occupied bandwidth ........................................................ 58
offset .................................................................... 101, 242
power sensor ................................................................ 139
spectrogram ................................................................... 86
TDMA power................................................................... 62
transducer .................................................................... 133
Reference position ............................................ 100, 205, 225
Reference power ............................................................. 282
Reference signal .............................................................. 312
Reference value....................................................... 204, 224
Reflection......................................................................... 214
Resolution bandwidth............................................... 104, 107
Result summary
1xEV-DO ...................................................................... 285
CDMA2000 ................................................................... 272
GSM ............................................................................. 249
TD-SCDMA .................................................................. 291
W-CDMA ...................................................................... 257
Result table
spectrum emission mask ................................................ 75
spurious emission ........................................................... 81
RF attenuation ................................................................. 102
Rho
1xEV-DO ...................................................................... 287
CDMA2000 ................................................................... 273
RMS ................................................................................ 115
RMS (detector) ................................................................ 235
Rotary knob ....................................................................... 15
Sample ............................................................................ 115
Save on event .................................................................... 22
Scalar measurement ........................................................ 178
Scaling .............................................................. 101, 205, 224
horizontal axis ................................................................. 96
Scrambling code ...................................................... 267, 302
graphic display .............................................................. 268
Screen layout ..................................................................... 12
1xEV-DO ...................................................................... 285
ACLR .............................................................................. 64
AM modulation depth ...................................................... 78
CDMA2000 ................................................................... 272
channel power ................................................................ 53
code domain channel table ............................ 264, 277, 297
code domain power ....................................... 261, 275, 295
constellation diagram ............................................ 314, 330
DTF mode .................................................................... 213
file manager .................................................................... 32
geotagging .................................................................... 161
GSM ............................................................................. 249
harmonic distortion ......................................................... 76
LTE ............................................................................... 307
measurement wizard ...................................................... 45
NB-IoT .......................................................................... 326
occupied bandwidth ........................................................ 57
power meter ................................................................. 135
power meter (directional) .............................................. 141
power meter (pulse) ...................................................... 148
report generator .............................................................. 51
resource allocations ...................................................... 317

R&S FSH Index
Operating Manual 1173.6275.12 - 31 375
spectrogram.................................................................... 83
spectrum emission mask ................................................ 73
spurious emission ........................................................... 80
TDMA power ................................................................... 61
TD-SCDMA................................................................... 291
time domain power ....................................................... 300
triangulation .................................................................. 161
w/ active markers .......................................................... 118
W-CDMA .............................................................. 229, 257
wizard set editor.............................................................. 42
Screenshot ........................................................................ 21
Search limits .................................................................... 122
Secondary transducer ...................................................... 132
Signal power
1xEV-DO ...................................................................... 286
CDMA2000 ................................................................... 273
GSM ............................................................................. 250
LTE ............................................................................... 309
NB-IoT .......................................................................... 328
TD-SCDMA................................................................... 293
W-CDMA ...................................................................... 258
Single sweep ................................................................... 108
Smith chart ...................................................................... 199
Softkey
new marker ................................................................... 119
Softkeys ........................................................................... 337
DTF ...................................................................... 352, 360
general ......................................................................... 337
maps ............................................................................ 358
network analyzer........................................................... 345
power meter.................................................................. 349
receiver ......................................................................... 355
spectrum analysis ......................................................... 339
Span .......................................................................... 98, 222
channel power ................................................................ 55
occupied bandwidth ........................................................ 60
Spectrogram ...................................................................... 83
clear ............................................................................... 84
display configuration ....................................................... 85
display range .................................................................. 87
hold ................................................................................ 84
marker ............................................................................ 89
playback ......................................................................... 89
record ............................................................................. 88
reference level ................................................................ 86
time line .......................................................................... 89
Spectrogram colors ............................................................ 85
Spectrogram history ........................................................... 84
Spectrum analyzer ............................................................. 52
Spectrum emission mask ................................................... 73
adjust settings ................................................................. 74
result table ...................................................................... 75
standard ......................................................................... 74
Spectrum overview .......................................................... 245
Split screen ...................................................................... 202
Spreading factor .............................................................. 281
Spurious emission
result table ...................................................................... 81
Spurious emissions ............................................................ 80
S-SCH ............................................................................. 260
S-SYNC ........................................................................... 311
Standard
ACLR .............................................................................. 67
channel power ................................................................ 54
directional power sensor ............................................... 144
occupied bandwidth ........................................................ 58
power sensor ................................................................ 144
spectrum emission mask ................................................ 74
TDMA power................................................................... 62
Start/stop frequency ................................................... 98, 222
Step size ............................................................................ 96
Subframe configuration .................................................... 320
Sweep ..................................................................... 107, 114
Sweep mode ............................................................ 108, 242
Sweep number......................................................... 108, 113
Sweep time ...................................................................... 107
SYNC .............................................................................. 274
Sync ID
TD-SCDMA .................................................................. 299
Synchronization ...........31, 242, 273, 283, 289, 312, 324, 336
Synchronization signal ............................................. 309, 328
Tau
1xEV-DO ...................................................................... 287
CDMA2000 ................................................................... 274
TDMA power ...................................................................... 61
adjust level ..................................................................... 62
burst length ..................................................................... 62
reference level ................................................................ 62
standard ......................................................................... 62
TD-SCDMA ...................................................................... 290
carrier frequency error .................................................. 305
code domain error......................................................... 293
Gain imbalance ............................................................. 293
I/Q offset ....................................................................... 293
power ........................................................................... 293
result summary ............................................................. 291
scrambling code ........................................................... 294
Scrambling code ........................................................... 302
TD-SCDMA power ........................................................... 294
THD ................................................................................... 77
Threshold
AM modulation depth ...................................................... 79
Time domain ........................................................ 61, 99, 109
Time line ............................................................................ 89
Total harmonic distortion .................................................... 77
Total power
1xEV-DO ...................................................................... 286
CDMA2000 ................................................................... 273
GSM ............................................................................. 250
LTE ............................................................................... 309
NB-IoT .......................................................................... 328
TD-SCDMA .................................................................. 293
W-CDMA ...................................................................... 258
Trace ............................................................................... 113
Trace (second)................................................................. 116
Trace average ......................................................... 113, 243
Trace mathematics .......................................................... 117
Trace memory ................................................................. 117
Trace mode ...................................................... 113, 243, 245
Trace selection ................................................................ 116

R&S FSH Index
Operating Manual 1173.6275.12 - 31 376
Tracking generator ........................................................... 180
Tracking generator power ................................................ 225
Traffic activity ............................................ 251, 287, 310, 328
Training sequence ........................................................... 250
Transducer .............................................................. 103, 132
unit ............................................................................... 133
Transmission channel ........................................................ 67
Trigger .............................................. 108, 283, 289, 324, 336
Trigger delay .................................................................... 110
Trigger level ..................................................................... 110
Unit .................................................................................. 101
channel power ................................................................ 56
directional power sensor ............................................... 144
power sensor ................................................................ 139
transducer .................................................................... 133
User interface .................................................................... 12
User number .................................................................... 303
VBW ................................................................................ 105
Vector measurement ........................................................ 178
Vertical axis ............................................................. 100, 204
Video bandwidth .............................................................. 105
Video trigger .................................................................... 108
View trace ........................................................................ 113
Volume ............................................................................ 126
W-CDMA ......................................................................... 256
Antenna diversity .......................................................... 269
carrier frequency error .................................................. 258
channels ....................................................................... 260
code domain error......................................................... 259
EVM ............................................................................. 259
I/Q imbalance ............................................................... 259
I/Q offset ....................................................................... 258
power ........................................................................... 258
result summary ............................................................. 257
scrambling code ........................................................... 259
Scrambling code ........................................................... 267
spreading factor ............................................................ 281
Weighting mode ............................................................... 144
X axis......................................................................... 96, 222
Y axis....................................................................... 100, 204
Zero span .......................................................................... 99
Zeroing ............................................................................ 138
Zoom ............................................................................... 200
ZVHView
cable model .................................................................. 219
channel table ........................................................ 131, 206
limit lines ............................................................... 128, 207
measurement wizard ...................................................... 42