Embed Size (px)
Citation preview

RIVER REHABILITATIONOF SG. MUDA, KEDAH

Contents
• Objectives• Scope of Work• Sg. Muda Recent Floods• Hydrological Modelling• River Modelling
Objectives
• Ensure that design cross-sections and alignment of the main river channel are economic, effective and environmentally sound;
• Propose alternative designs for identified locations to meet the above requirements;
• Examine the long term river behaviour through model studies, to minimise expensive repair works in future resulting from the new alignment.

Scope of Work
(a) Rainfall data in space and time leading to chosen flood events.
(b) Runoff discharge and stage records of the chosen events;
(c) Computer simulation of the flood events;
(d) Computer simulation of long term river behaviour to determine stretches prone to meandering, hence needing extra protection;
(e) Changes in alluvial river geometry in terms of aggradation and degradation as well as lateral channel migration as a result of the flood events;
(f) Design criteria used for the Flood Control Remediation Plan;
(g) Specific design of the proposed structures including levee protection, riverbank protection works and protection of bridge crossings and other structures.

SITE VISITS
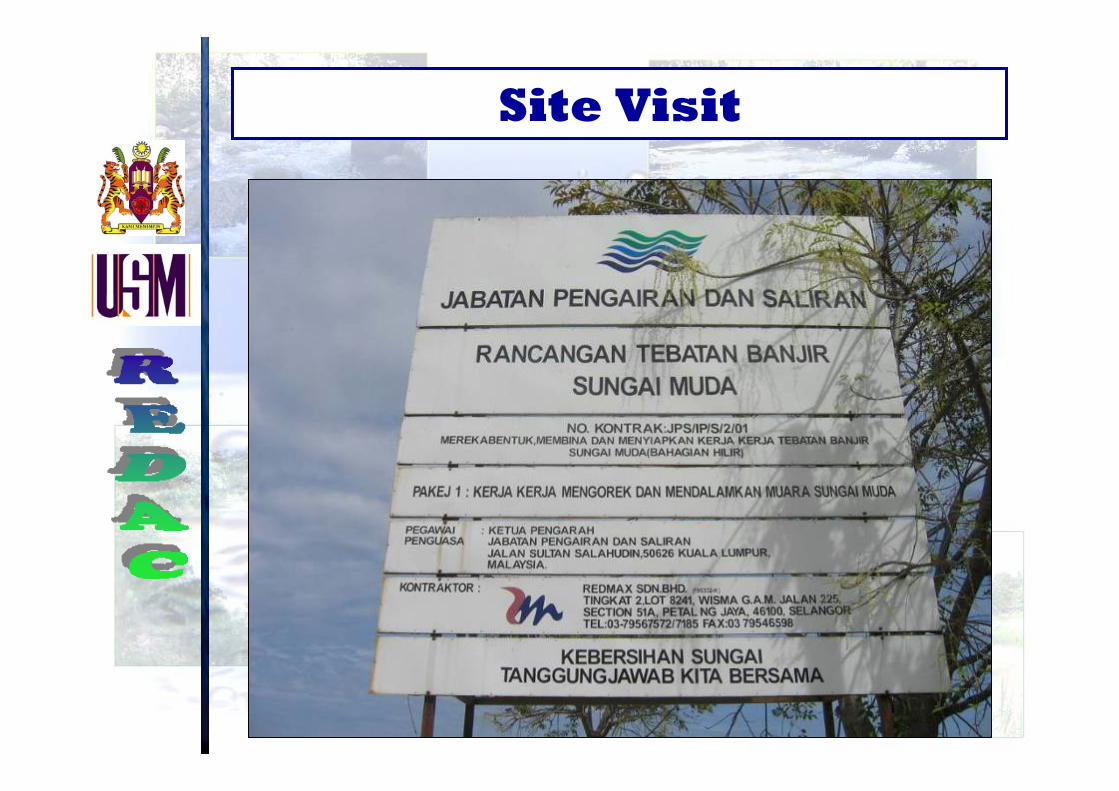
Site Visit

Site Visit
Sg. Muda River Mouth

Site Visit
New Bridge At Sg. Muda Near Kota Kuala Muda
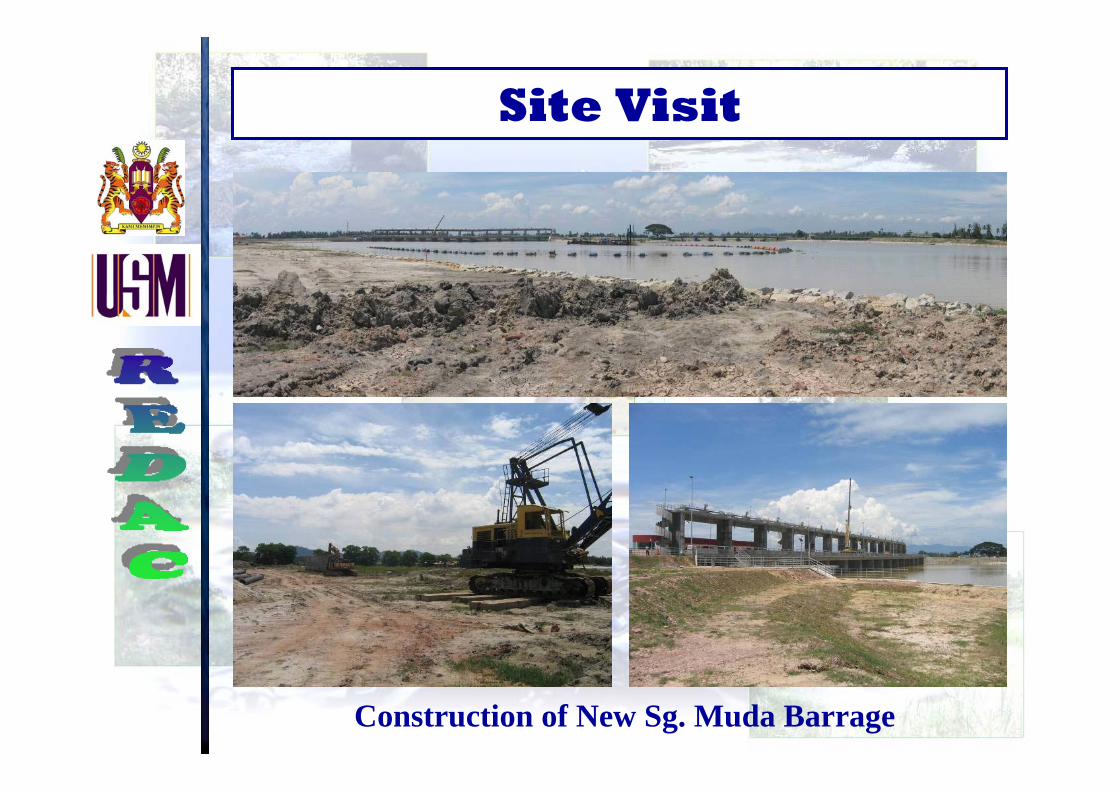
Site Visit
Construction of New Sg. Muda Barrage

Site Visit
New Sg. Muda Barrage

Site Visit
Houses Extended into River Reserve

Site Visit
Flood Plain (Padi Field) along Muda River Near Rantau Panjang

Site Visit
Phase II Flood Mitigation Project at Muda River
(Pekula Pumping Station)

Site Visit
Abandoned Recreational Park at Pekula Pumping Station

Site Visit
Construction Works at Pekula Pumping Station

Site Visit
Irrigation Canals at Pekula Pumping Station (25th May 2005)

Site Visit
Sand Mining Activities

Site Visit
Sg. Muda @ CH 12400

Sg. Muda Recent Floods

Study Area


October 1998 Flood
Flood Prone Areas (Oct 1998 Flood)

>100392403772427412KulimKulim10
50301372961159071SikJeniang9
>100396480852208096SikSik8
Normal12515126336033Kota SetarAlor Setar7
Normal14716215417234Kota SetarPendang6
>1003694166817712447Kuala MudaSg. Petani5
>100637765128252238147Kuala Muda
GunungJerai4
30284316571487932Kuala Muda
Jam. Syed Omar3
5219246271205643BalingKuala Pegang2
Normal15317346802720BalingPulai1
ARI (3 day Max)
Total Rainfall(3 Day Max)
Total(2-5 Oct)5/104/103/102/10DistrictRainfall
StationNo.
Summary of Rainfall Distribution for 2003 Flood

Gunung Jerai525 mm

No. Year Q (m3/s) No. Year Q (m3/s) No. Year Q (m3/s)1 1988 948 11 1976 542 21 1994 2872 1997 928 12 2000 508 22 1975 2793 1998 854 13 1990 464 23 2002 2674 2003 843 14 1983 370 24 1978 2655 1986 838 15 2005 368 25 1974 2516 1999 833 16 1993 349 26 1989 2237 1985 737 17 1996 348 27 1979 1968 1987 650 18 1982 341 28 1981 1769 1980 629 19 2001 321 29 1977 13710 1984 623 20 2004 314
Sg. Muda @ Ladang Victoria
Sg. Muda @ Syed Omar
No. Year Q (m3/s) No. Year Q (m3/s) No. Year Q (m3/s)1 2003 1340 17 1968 572 33 1983 3932 1988 1225 18 1975 565 34 1991 3823 1996 1070 19 2005 565 35 1987 3774 1998 980 20 1976 549 36 1978 3755 1967 912 21 1969 546 37 1961 3746 1965 861 22 1977 542 38 2004 3407 1973 780 23 2001 539 39 1989 3328 1972 706 24 1971 535 40 1993 3269 1966 661 25 1963 516 41 1992 31910 1999 651 26 1984 500 42 1986 31511 1964 640 27 1980 480 43 1962 26812 1997 626 28 1979 450 44 1974 26413 2000 626 29 1985 449 4514 2002 612 30 1981 436 4615 1970 602 31 1990 43316 1960 572 32 1982 399
Flood Ranking

14601887200Notes: 1988 Flood – 948 m3/s (10-yr ARI)
1998 Flood – 850 m3/s (10-yr ARI)2003 Flood – 831 m3/s (10-yr ARI)
Gumbel External Type I (Discharge Data from
1974 – 2005)
DID
167114611255987784497
Discharge (m3/s)
10050251052
Return Period
131711731028832678444
Flood Frequency Analyses for Sg. Muda @ Syed Omar

Flood Frequency Analyses for Sg. Muda @ Ladang Victoria
Gumbel External Type I
(Discharge Data from 1960 – 2005)
JICA (1995)DID
1340
1260
950
810
1572
1423
1275
1125
916
760
517
Discharge (m3/s)
Notes: 1988 Flood – 1225 m3/s (50-100 yr ARI)1998 Flood – 980 m3/s (25-yr ARI)2003 Flood – 1340 m3/s (100-yr ARI)
200
100
50
25
10
5
2
Return Period
1436
1309
1182
1053
880
742
536

2003 Hydrograph @ Jbt Syed Omar
0
100
200
300
400
500
600
700
800
900
1000
0 1000 2000 3000 4000 5000 6000 7000 8000
Hour
Dis
char
ge, Q
(m3 /s
)
Jan Feb Mac Apr May Jun Jul Aug Sep Oct Nov Dec
Q = 831m3/s

2003 Hydrograph @ Ldg Victoria
0
100
200
300
400
500
600
700
800
900
1000
1100
1200
1300
1400
0 1000 2000 3000 4000 5000 6000 7000 8000
Hour
Dis
char
ge, Q
(m3 /s
)
Jan Feb Mac Apr May Jun Jul Aug Sep Oct Nov Dec
Q = 1340m3/s

Hydrological Modelling

Hydrological Modeling
Design Flood Hydrograph of 5, 20, 50 and 100 yr ARI
for Sg Muda at LadangVictoria (JICA, 1995)
Design Flood Hydrograph of 5, 20, 50 and 100 yr ARI
for Sg Muda at LadangVictoria (Zaaba, 2002)
• DISCHARGE STATION:– Jambatan Syed Omar (5606410)– Ladang Victoria (5505412)
• RAINFALL STATION:– Bt. 27 Jln. Baling (5507076)– Bt. 61 Jln. Baling (5808001)– Jeniang Klinik (5806066)– Komplek Rumah Muda (6108001)
• MODEL SET UP– CALIBRATION –OCTOBER 2003– VALIDATION – NOVEMBER 1998
HEC-HMS

METHODOLOGY
• Catchment Routing:– Losses : Exponential– Transform : Clark Unit Hydrograph– Baseflow : Constant Monthly
• Channel Routing:– Kinematic Wave
• Rainfall Average:– Thiessen Polygon Method

RAINFALL & DISCHARGE STATION LOCATIONS
5806414
BARRAGEJENIANG
5606410
5505412
BARRAGEMUDA
PETANISUNGAI
KETILKUALA
REMANDAM
N
LUMPURKUALA
KEDAH
PINANG
SEMBILAN
PULAU
PERAK
SELANOGOR
NEGERI
MELAKAJOHOR
PAHANG
TERENGGANUKELANTAN
STUDY AREA
5608418
BALING
SCALE
SIK
NAMI
BERIS DAM
DAMMUDA
S.MUD
A
S.MUD
A
S.KETIL
S.KUPANG
S.KE
TIL
S.SIDAM
S.M
UD
A

RAINFALL GAGE WEIGHT
0.930.07--215Sg.Muda DS
1.00---616Sidam
0.410.250.34-1718Sik-Ketil
-0.120.270.611661Nami
5507076580606658080016108001(sq.km)
Weighted Rainfall StationsAreaCatchment

HEC-HMS MODEL LAYOUT
OUTPUT HYDROGRAPH

CALIBRATION RESULTS (2003 Flood)
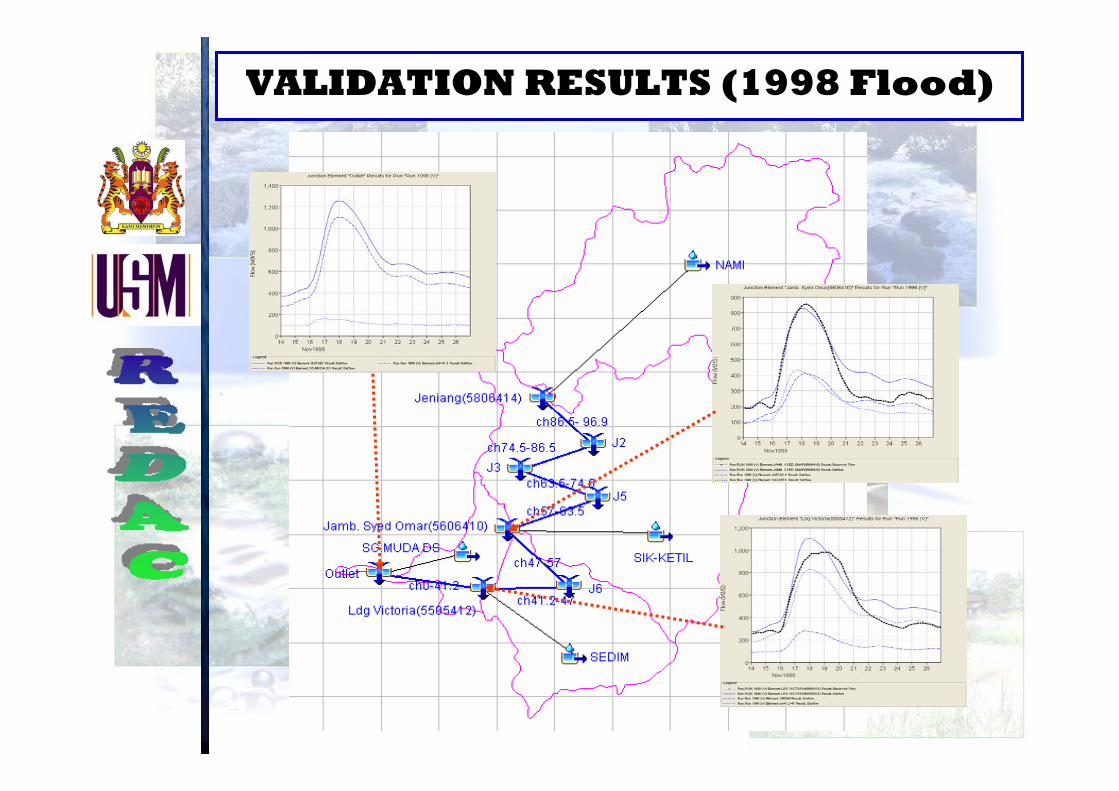
VALIDATION RESULTS (1998 Flood)

JAMBATAN SYED OMAR
(a) Calibration (b) Validation

LADANG VICTORIA
(a) Calibration (b) Validation

RIVER MOUTH
(a) Calibration (b) Validation

DESIGN RAINFALL
• Design rainfall for 50-year and 100-year, 72-hours duration are acquired from the JPZ design rainfall, which has been derived from the isohyetal map
• The temporal rainfall pattern distribution has been created in accordance with the HP-1 for duration 72-hours.
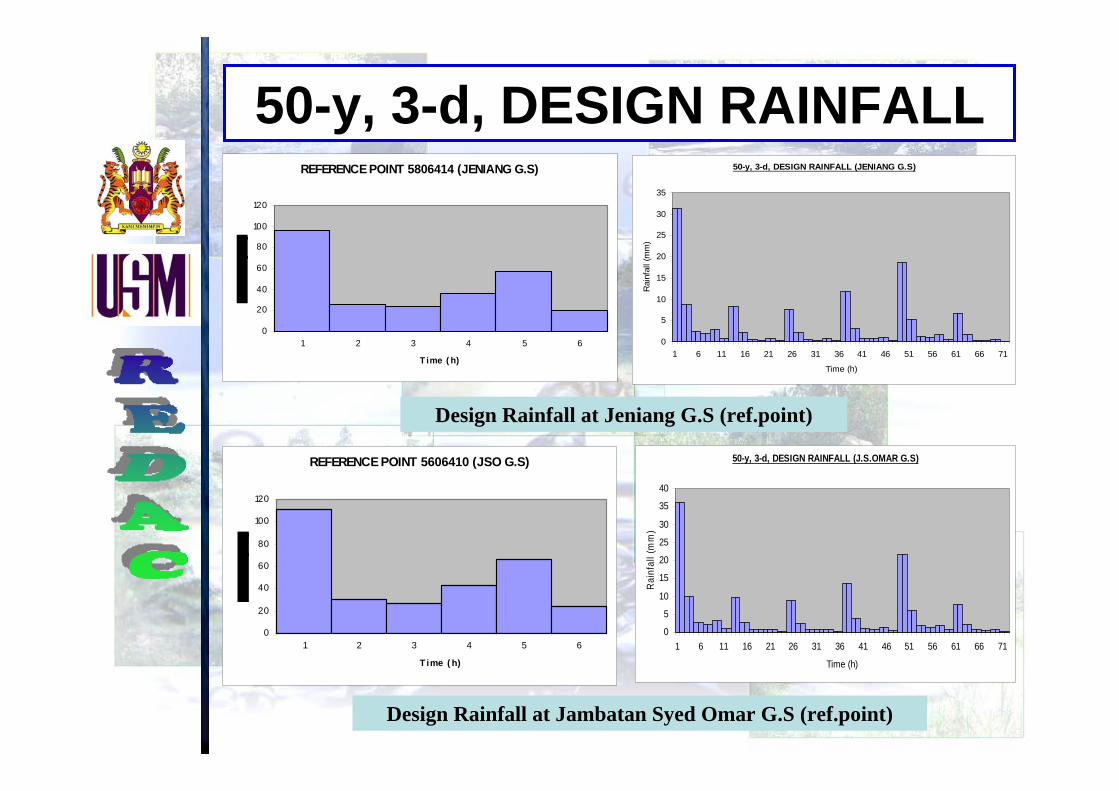
50-y, 3-d, DESIGN RAINFALL
REFERENCE POINT 5606410 (JSO G.S)
0
20
40
60
80
100
120
1 2 3 4 5 6
T ime ( h)
REFERENCE POINT 5806414 (JENIANG G.S)
0
20
40
60
80
100
120
1 2 3 4 5 6
T ime ( h)
Design Rainfall at Jeniang G.S (ref.point)
50-y, 3-d, DESIGN RAINFALL (JENIANG G.S)
0
5
10
15
20
25
30
35
1 6 11 16 21 26 31 36 41 46 51 56 61 66 71
Time (h)
Rai
nfal
l (m
m)
50-y, 3-d, DESIGN RAINFALL (J.S.OMAR G.S)
0
5
10
15
20
25
30
35
40
1 6 11 16 21 26 31 36 41 46 51 56 61 66 71
Time (h)R
ainf
all (
mm
)
Design Rainfall at Jambatan Syed Omar G.S (ref.point)

50-y, 3-d, DESIGN RAINFALL
OUTLET (RIVER MOUTH)
0
50
100
150
1 2 3 4 5 6
Time (h)
Rai
nfal
l (m
m)
REFERENCE POINT 5505412 (LV G.S)
0
50
100
150
1 2 3 4 5 6
Time (h)
Rai
nfal
l (m
m)
Design Rainfall at Ladang Victoria G.S (ref.point)
Design Rainfall at Outlet
50-y, 3-d, DESIGN RAINFALL (LDG.VICTORIA G.S)
0
510
15202530
3540
45
1 6 11 16 21 26 31 36 41 46 51 56 61 66 71
Time (h)
Rai
nfal
l (m
m)
50-y, 3-d, DESIGN RAINFALL (RIVER MOUTH)
05
101520253035404550
1 6 11 16 21 26 31 36 41 46 51 56 61 66 71
Time (h)
Rai
nfal
l (m
m)

100-y, 3-d, DESIGN RAINFALL
Design Rainfall at Ladang Victoria G.S (ref.point)
Design Rainfall at Jambatan Syed Omar G.S (ref.point)
REFERENCE POINT 5806414 (JENIANG G.S)
0.00
20.00
40.00
60.00
80.00
100.00
120.00
1 2 3 4 5 6
T ime ( h)
100-y, 3-d, DESIGN RAINFALL (JENIANG G.S)
0
5
10
15
20
25
30
35
40
1 6 11 16 21 26 31 36 41 46 51 56 61 66 71
Time (h)
Rai
nfal
l (m
m)
REFERENCE POINT 5606410 (JSO G.S)
0.00
20.00
40.00
60.00
80.00
100.00
120.00
140.00
1 2 3 4 5 6
T ime ( h)
100-y, 3-d, DESIGN RAINFALL (J.S.OMAR G.S)
05
1015202530354045
1 6 11 16 21 26 31 36 41 46 51 56 61 66 71
Time (h)
Rai
nfal
l (m
m)

100-y, 3-d, DESIGN RAINFALL
Design Rainfall at Ladang Victoria G.S (ref.point)
Design Rainfall at Outlet
REFERENCE POINT 5505412 (LV G.S)
0.00
50.00
100.00
150.00
1 2 3 4 5 6
Time (h)
Rai
nfal
l (m
m)
100-y, 3-d, DESIGN RAINFALL (LDG. VICTORIA G.S)
05
101520253035404550
1 6 11 16 21 26 31 36 41 46 51 56 61 66 71
Time (h)
Rai
nfal
l (m
m)
OUTLET (RIVER MOUTH)
0
50
100
150
200
1 2 3 4 5 6
Time (h)
Rai
nfal
l (m
m)
100-y, 3-d, DESIGN RAINFALL (RIVER MOUTH)
0
10
20
30
40
50
60
1 6 11 16 21 26 31 36 41 46 51 56 61 66 71
Time (h)
Rai
nfal
l (m
m)

DESIGN HYDROGRAPH
Design Hydrograph at Jeniang G.S
Design Hydrograph at Jambatan Syed Omar G.S
(HEC-HMS) JENIANG G.S DESIGN HYDROGRAPH
0
100
200
300
400
500
600
700
800
900
1 25 49 73 97 121 145 169 193 217 241 265 289 313
Time (h)
Disch
arge
(cum
ec)
50-year (Qmax=667 cumec)100-year (Qmax=767 cumec)
(HEC-HMS) JAMBATAN SYED OMAR G.S DESIGN HYDROGRAPH
0200
400600800
100012001400
16001800
1 25 49 73 97 121 145 169 193 217 241 265 289 313
Time (h)
Dis
char
ge (c
umec
)
50-year (Qmax=1386 cumec)100-year (Qmax=1579 cumec)

DESIGN HYDROGRAPH
Design Hydrograph at Ladang Victoria G.S
Design Hydrograph at River Mouth (Outlet)
(HEC-HMS) LADANG VICTORIA G.S DESIGN HYDROGRAPH
0200400600800
1000120014001600180020002200
1 25 49 73 97 121 145 169 193 217 241 265 289 313
Time (h)
Disch
arge
(cum
ec)
50-year (Qmax=1768 cumec)100-year (Qmax=2001 cumec)
(HEC-HMS) RIVER MOUTH OUTLET DESIGN HYDROGRAPH
0200400600800
10001200140016001800200022002400
1 25 49 73 97 121 145 169 193 217 241 265 289 313
Time (h)
Dis
char
ge (c
umec
)
50-year (Qmax=1911 cumec)
100-year (Qmax=2101 cumec)

DESIGN HYDROGRAPH COMPARISON ( n = 0.025, 0.030)
HEC-RAS MODELLING

Simulated Flood Profiles for Alternative 2 under 50-year and 100-year ARI with Proposed Bund Levels
along Sg. Muda

Input Hydrograph @ Ladang Victoria for Flood 2003
2003 Hydrograph @ Ldg Victoria
0
100
200
300
400
500
600
700
800
900
1000
1100
1200
1300
1400
4000 4500 5000 5500 6000 6500 7000 7500 8000 8500
Time Step (Hour)
Dis
char
ge, Q
(m3 /s
)
Jun Jul Aug Sep Oct Nov Dec
6th October (4pm)
(Q=1340m3/s) 19th October (9pm)
(Q=164m3/s)
2nd October (1am)
(Q=69m3/s)

Comparison of Hydrograph at Ladang Victoria
Comparison of Hydrograph at Ladang Victoria
0200400600800
10001200140016001800200022002400
6 24 42 60 78 90 108 126 144 162 180 198 216 234 252 270 288
Time (h)
Disc
harg
e (c
umec
)50 yr (Qmax=1768 cumec)-Hec-Hms100 yr (Qmax=2001 cumec)-Hec-Hms50 yr (Qmax=1815 cumec)-JPZ100 yr (Qmax=2130 cumec)-JPZFlood 2003 (Qmax=1340 cumec)

66481.9024000020031004
66471.8023000020031004
66461.8022000020031004
66451.6021000020031004
66441.5020000020031004
66431.4019000020031004
66421.3018000020031004
66411.2017000020031004
66401.2016000020031004
66391.3015000020031004
66381.4014000020031004
66371.5013000020031004
66361.6012000020031004
66351.7011000020031004
66341.8010000020031004
66331.809000020031004
66321.808000020031004
66311.807000020031004
66301.806000020031004
66291.805000020031004
66281.704000020031004
66271.703000020031004
66261.602000020031004
66251.601000020031004
66722.1024000020031005
66712.0023000020031005
66701.8022000020031005
66691.5021000020031005
66681.3020000020031005
66671.1019000020031005
66661.0018000020031005
66651.1017000020031005
66641.2016000020031005
66631.4015000020031005
66621.6014000020031005
66611.8013000020031005
66601.9012000020031005
66591.9011000020031005
66581.9010000020031005
66571.809000020031005
66561.708000020031005
66551.607000020031005
66541.506000020031005
66531.605000020031005
66521.604000020031005
66511.703000020031005
66501.802000020031005
66491.801000020031005
66962.2024000020031006
66952.0023000020031006
66941.7022000020031006
66931.3021000020031006
66921.0020000020031006
66910.9019000020031006
66900.9018000020031006
66891.1017000020031006
66881.3016000020031006
66871.6015000020031006
66861.9014000020031006
66852.0013000020031006
66842.1012000020031006
66832.0011000020031006
66821.9010000020031006
66811.709000020031006
66801.508000020031006
66791.307000020031006
66781.306000020031006
66771.405000020031006
66761.604000020031006
66751.803000020031006
66742.002000020031006
66732.101000020031006
Times and Height of High and Low Water @ Kedah Pier

Tidal @ kedah Pier (1 - 31 Oct 2003)
0.0
0.5
1.0
1.5
2.0
2.5
3.0
3.5
6555 6605 6655 6705 6755 6805 6855 6905 6955 7005 7055 7105 7155 7205 7255
Time (Hour)
Hei
ght (
m)
Oct

HEC-RAS Modelling

Cross Section at CH 41.2 (Ladang Victoria)
CALIBRATION RESULT

Longitudinal Flood Profile for Sg Muda (Q=1340m3/s)
Mud
a B
arra
ge
Mer
deka
B
ridg
eE
xpre
ssw
ay
Bri
dge
Rai
lway
Bri
dge B
ridg
e
Pipe
Bri
dge
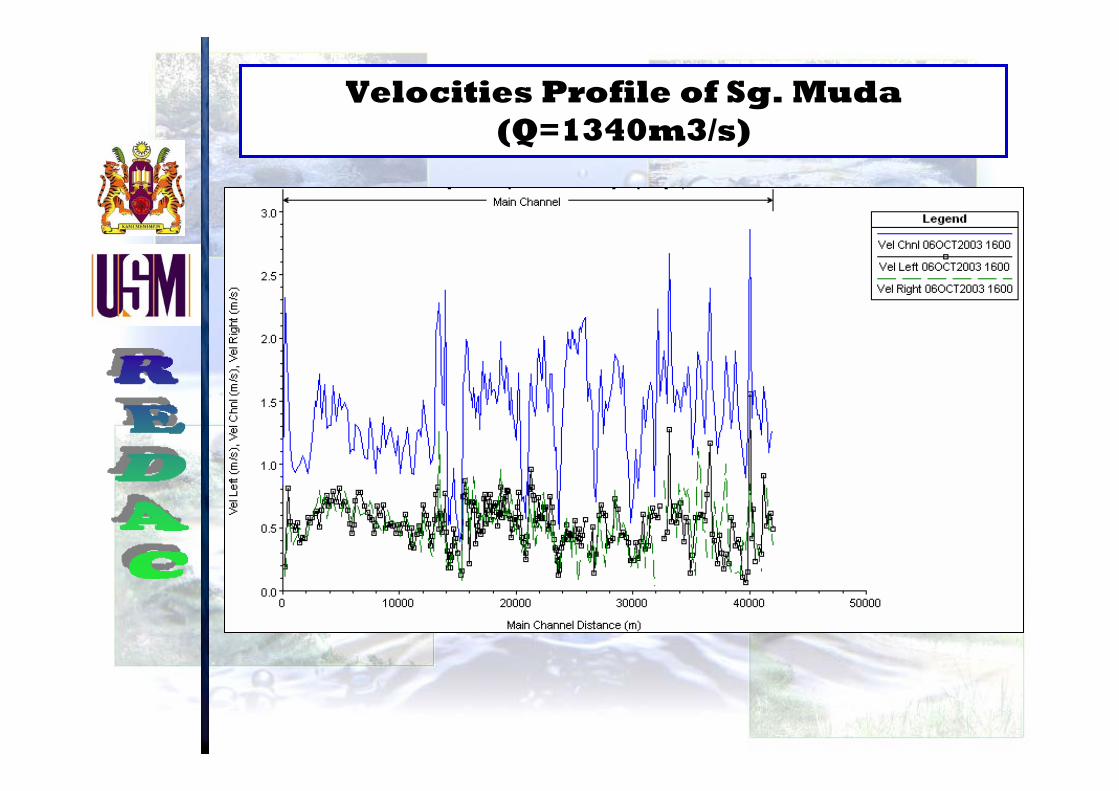
Velocities Profile of Sg. Muda (Q=1340m3/s)

Flood Profile Comparisons Using HEC-RAS (varies n value) and
JPZ (2000)

n = 0.025
-10
-5
0
5
10
15
0 5 10 15 20 25 30 35 40Chainage (km)
Ele
vatio
n (m
, LSD
)
Existing Bed Level Predicted Water Level (HEC-RAS) Observed
Longitudinal Section for Sg. Muda Kedah (n = 0.03)
-10
-5
0
5
10
15
0 5 10 15 20 25 30 35 40Chainage (km)
Ele
vatio
n (m
, LSD
)
Existing Bed Level Predicted Water Level (HEC-RAS) observed
Longitudinal Section for Sg. Muda Kedah (n = 0.035)
n = 0.030
n = 0.035
-10
-5
0
5
10
15
0 5 10 15 20 25 30 35 40Chainage (km)
Ele
vatio
n (m
, LSD
)
Existing Bed Level Predicted Water Level (HEC-RAS) observed
Longitudinal Section for Sg. Muda Kedah (n = 0.025)
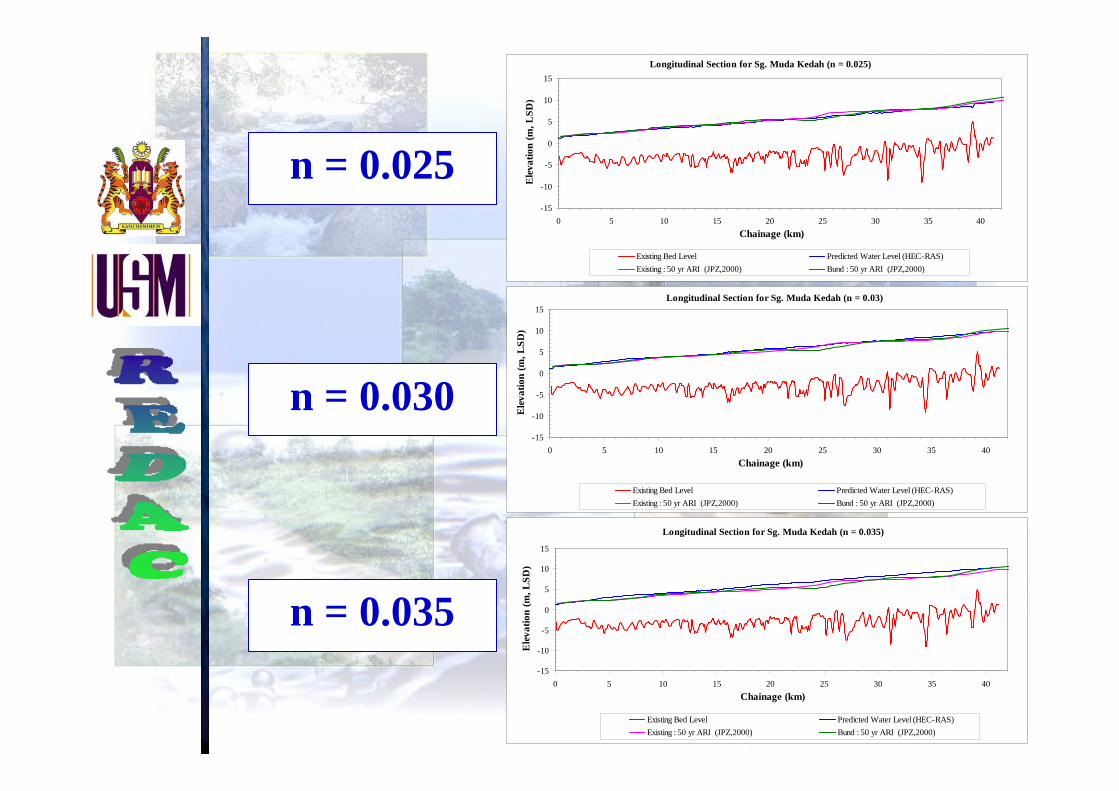
n = 0.025
n = 0.030
n = 0.035
-15
-10
-5
0
5
10
15
0 5 10 15 20 25 30 35 40Chainage (km)
Ele
vatio
n (m
, LSD
)
Existing Bed Level Predicted Water Level (HEC-RAS)Existing : 50 yr ARI (JPZ,2000) Bund : 50 yr ARI (JPZ,2000)
Longitudinal Section for Sg. Muda Kedah (n = 0.025)
-15
-10
-5
0
5
10
15
0 5 10 15 20 25 30 35 40Chainage (km)
Ele
vatio
n (m
, LSD
)
Existing Bed Level Predicted Water Level (HEC-RAS)Existing : 50 yr ARI (JPZ,2000) Bund : 50 yr ARI (JPZ,2000)
Longitudinal Section for Sg. Muda Kedah (n = 0.03)
-15
-10
-5
0
5
10
15
0 5 10 15 20 25 30 35 40Chainage (km)
Ele
vatio
n (m
, LSD
)
Existing Bed Level Predicted Water Level (HEC-RAS)Existing : 50 yr ARI (JPZ,2000) Bund : 50 yr ARI (JPZ,2000)
Longitudinal Section for Sg. Muda Kedah (n = 0.035)
Comparison of Predicted and Observed Water Level

Maximum Water Level Discharge Record at Sg. Muda
11.10.2003 @ 0200 Hrs2.702.702.70
River Mouth
7.10.2003 @ 0300 Hrs0.084.90-0.284.54-0.644.184.82
Rumah Pam Bumbong Lima
5504401
7.10.2003 @ 0600 Hrs-0.237.20-0.806.63-1.416.027.43
Rumah Pam Pinang Tunggal
5505413
6.10.2003 @ 1600 Hrs0.6910.340.139.78-0.319.349.65
Sg Muda @ Ldg. Victoria
5505412
DifferenceHEC – RASDifferenceHEC – RASDifferenceHEC – RASDate and Time of Maximum
Reading
n = 0.035n = 0.03n = 0.025
Observed
Maximum Water Level (m)Name of Station
Station No.

Cross Section at Ch 41.2 (Ladang Victoria) during Maximum Water Level (06.10.2003 @ 1600Hrs)
n = 0.025 n = 0.03
n = 0.035

Cross Section at Ch 25.2 (Rumah Pam Pinang Tunggal) during Maximum Water Level (07.10.2003 @ 0600Hrs)
n = 0.025 n = 0.03
n = 0.035
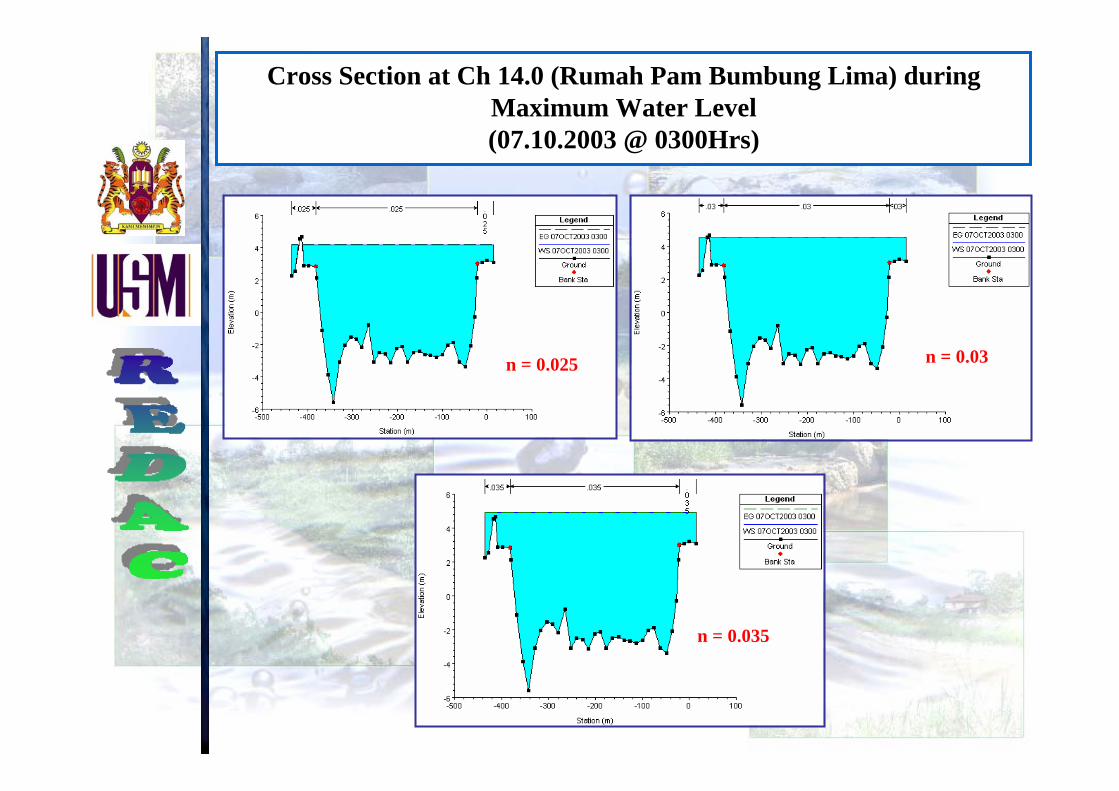
Cross Section at Ch 14.0 (Rumah Pam Bumbung Lima) during Maximum Water Level (07.10.2003 @ 0300Hrs)
n = 0.03n = 0.025
n = 0.035

Bumbung Lima (5504401)
23:00-0.422.77-0.672.52-0.962.233.1920
17:00-0.253.11-0.432.93-0.592.773.3619
6:00
12.10.2003
-0.213.40-0.413.20-0.613.003.6118
18:00-0.303.46-0.533.23-0.763.003.7617
6:0011.10.2003
-0.303.68-0.553.43-0.813.173.9816
18:00-0.224.00-0.523.70-0.833.394.2215
6:0010.10.2003
-0.144.30-0.453.99-0.783.664.4414
6:009.10.20030.014.67-0.334.33-0.683.984.6613
21:00-0.024.68-0.374.33-0.743.964.7012
18:000.024.73-0.334.38-0.694.024.7111
6:00
8.10.2003
0.044.80-0.324.44-0.684.084.7610
18:000.084.83-0.284.47-0.654.104.759
3:007.10.2003
0.154.90-0.214.54-0.574.184.758
18:000.094.84-0.264.49-0.634.124.757
12:000.054.79-0.284.46-0.644.104.746
6:000.044.70-0.294.37-0.634.034.665
24:00
6.10.2003
0.004.55-0.304.25-0.623.934.554
24:000.004.55-0.304.25-0.623.934.553
18:00-0.094.32-0.374.04-0.673.744.412
12:00
5.10.2003
-0.224.05-0.463.81-0.723.554.271
DifferenceHEC-RASDifferenceHEC-RASDifferenceHEC-RASObserved
Time ( Hours)
Daten = 0.035n = 0.03n = 0.025
Maximum Water Level (m)No.

Maximum Water Level at BumbungLima (Varies n value)
Comparison of Predicted and Observed Water Level at Bumbung Lima
0.00
1.00
2.00
3.00
4.00
5.00
6.00
12:00
18:00
24:0
0 2
4:00
6:00
12:00
18:00 3:0
018
:00 6:00
18:00
21:00 6:0
0
6:00
18:00 6:0
018
:00 6:00
17:00
23:00
Time (Hours)
Wat
er L
evel
(m)
Observed Hec-Ras,n=0.025 Hec-Ras,n=0.03 Hec-Ras,n=0.035
5/10/03 7/10/036/10/03 11/10/0310/10/039/10/038/10/03 12/10/03

Ladang Victoria (5505412)
23:002.208.142.428.362.758.695.9410
6:0012.10.2003
1.678.271.738.331.998.596.609
18:0011.10.2003-0.958.40-0.948.41-0.728.639.358
18:0010.10.2003-0.538.82-0.748.610.338.689.357
18:009.10.20030.289.63-0.159.20-0.418.949.356
21:000.7110.030.219.53-0.179.159.325
12:008.10.2003
0.7510.100.239.58-0.169.199.354
12:007.10.20030.9310.280.379.72-0.069.299.353
6:000.7610.180.259.67-0.169.269.422
24:006.10.2003
0.7710.030.299.55-0.069.209.261
DifferenceHEC-RASDifferenceHEC-RASDifferenceHEC-RASObserved
Time ( Hours)Daten = 0.035n = 0.03n = 0.025
Maximum Water Level (m)No.

Maximum Water Level at Ladang Victoria (Varies n value)
Comparison of Predicted and Observed Water Level at Ladang Victoria
0.00
2.00
4.00
6.00
8.00
10.00
12.00
24:00 6:00 12:00 12:00 21:00 18:00 18:00 18:00 6:00 23:00
Time (Hours)
Wat
er L
evel
(m)
Observed Hec-Ras,n=0.025 Hec-Ras,n=0.03 Hec-Ras,n=0.035
7/10/036/10/03 11/10/0310/10/039/10/038/10/03 12/10/03

SIMULATION RESULT

Flood Levels under 1 in 50 yr and 100 yr ARIs, with Proposed Bund Levels for Sg Muda
1.301.901.902.391.391.39-7.80River Mouth
1.572.162.102.841.841.84-2.091294CH1
1.742.312.223.172.192.17-2.282152CH2
1.862.412.313.462.542.46-3.463413CH3
4.135.104.765.504.924.50-2.4713142CH14
5.967.326.858.027.726.770.1724821CH25
9.3210.7110.1611.0110.6810.011.0940275CH41
100 yr ARI50 yr ARI
Flood 2003
Design Hydrograph
Bund100 yr ARI50 yr ARI
Existing Cross Section;HEC-RAS (n = 0.025)
Proposed Cross Section; EXTRAN-XP (JPZ, 2000)
Flood ProfilesExistingInvert
CumulativeDistance
Node

Proposed Bund Levels for Sg Muda
1.30
1.57
1.74
1.86
4.13
5.96
9.32
Flood 2003
2.39
2.84
3.17
3.46
5.50
8.02
11.01
Bund(JPZ, 2000)
1.091.39River Mouth
1.271.84CH1
1.432.17CH2
1.602.46CH3
1.374.50CH14
2.066.77CH25
1.6910.01CH41
Difference50 yr ARI(JPZ, 2000)
Node

Longitudinal Flood Profiles 50 ARI (n = 0.025)
-10
-5
0
5
10
15
0 5 10 15 20 25 30 35 40Chainage (km)
Ele
vatio
n (m
, LSD
)
Existing Bed Level Flood 2003 50 yr ARI (HEC-RAS) 50 yr ARI (JPZ) Bund
Longitudinal Section for Sg. Muda Kedah (n = 0.025)

Longitudinal Flood Profiles 100 ARI (n = 0.025)
-10
-5
0
5
10
15
0 5 10 15 20 25 30 35 40Chainage (km)
Ele
vatio
n (m
, LSD
)
Existing Bed Level Flood 2003 100 yr ARI (HEC-RAS) 100 yr ARI (JPZ) Bund
Longitudinal Section for Sg. Muda Kedah (n = 0.025)

River Modelling

River Bed and Bank Sampling
2310321147Total
1719Kg Lahar TiangCh. 21.90M17
1719Kg Matang BeranganCh. 23.10M16
1719Kg Pantai PeraiCh. 30.80M15
1719Kg Lubok EkorCh. 33.80M14
1719Kg Sidam KananCh. 36.80M13
-3-3Kuari Kg Terat BatuCh. 33.40M12
-3-3Kuari Kg Pantai PeraiCh. 31.00M11
-3-3Kuari 2Ch. 25.60M10
-3-3Kuari 1Ch. 23.60M9
37313Ladang Victoria BridgeCh. 39.50M8
37313Pinang Tunggal BridgeCh. 25.20M7
37313Merdeka BridgeCh. 12.64M6
37313Kuala Muda BridgeCh. 4.86M5
27110Kg. Pulau MertajamCh. 2.97M4
27110Kg. Sg DerakaCh. 1.40M3
27110River MouthCh. 0.80M2
0718River MouthCh. 0.20M1
Bank Material(right)
Bed Material
Bank Material
(left)
No. of Samples
Total SampleName of LocationChainage No.
Site No.

Grab Sampling @ Ch 1.40, Kg. Sg Deraka

Bank Material Sampling @ Ch 1.40, Kg. Sg Deraka

Mean Sediment Size for Bed Material
0.0700.2120.036Kg Lahar TiangCh. 21.90M17
0.0360.0360.036Kg Matang BeranganCh. 23.10M16
2.0000.0500.050Kg Pantai PeraiCh. 30.80M15
0.0200.0360.014Kg Lubok EkorCh. 33.80M14
0.0361.1800.040Kg Sidam KananCh. 36.80M13
-1.800-Kuari Kg Terat BatuCh. 33.40M12
-1.500-Kuari Kg Pantai PeraiCh. 31.00M11
-1.000-Kuari 2Ch. 25.60M10
-1.180-Kuari 1Ch. 23.60M9
0.0501.8000.212Ladang Victoria BridgeCh. 39.50M8
0.0630.4250.212Pinang Tunggal BridgeCh. 25.20M7
0.0501.0000.090Merdeka BridgeCh. 12.64M6
0.0630.1500.150Kuala Muda BridgeCh. 4.86M5
0.0400.3000.300Kg. Pulau MertajamCh. 2.97M4
0.0400.1500.063Kg. Sg DerakaCh. 1.40M3
0.6000.0630.216River Mouth 2Ch. 0.80M2
-0.4250.900River Mouth 1Ch. 0.20M1
Right Bank
Main Channel
Left Bank
D50 (mm)Name of LocationChainage
No.Site No.

Bed Load Sampling @ Ladang Victoria

Suspended Load Sampling @ Ladang Victoria

Pinang Tunggal (2 August 2006)
0
10
20
30
40
50
60
70
80
90
100
0.01 0.1 1 10 100 1000 10000
Particle size ((m)
Per
cent
age
Pas
sing
(%)
Left
CenterRight
Average
d50 = 0.0000110 m

Ladang Victoria (21 August 2006)
0
10
20
30
40
50
60
70
80
90
100
0.01 0.1 1 10 100 1000 10000
Particle size (μm)
Per
cent
age
Pas
sing
(%)
Left
CenterRight
Average
d50 = 0.0000095 m
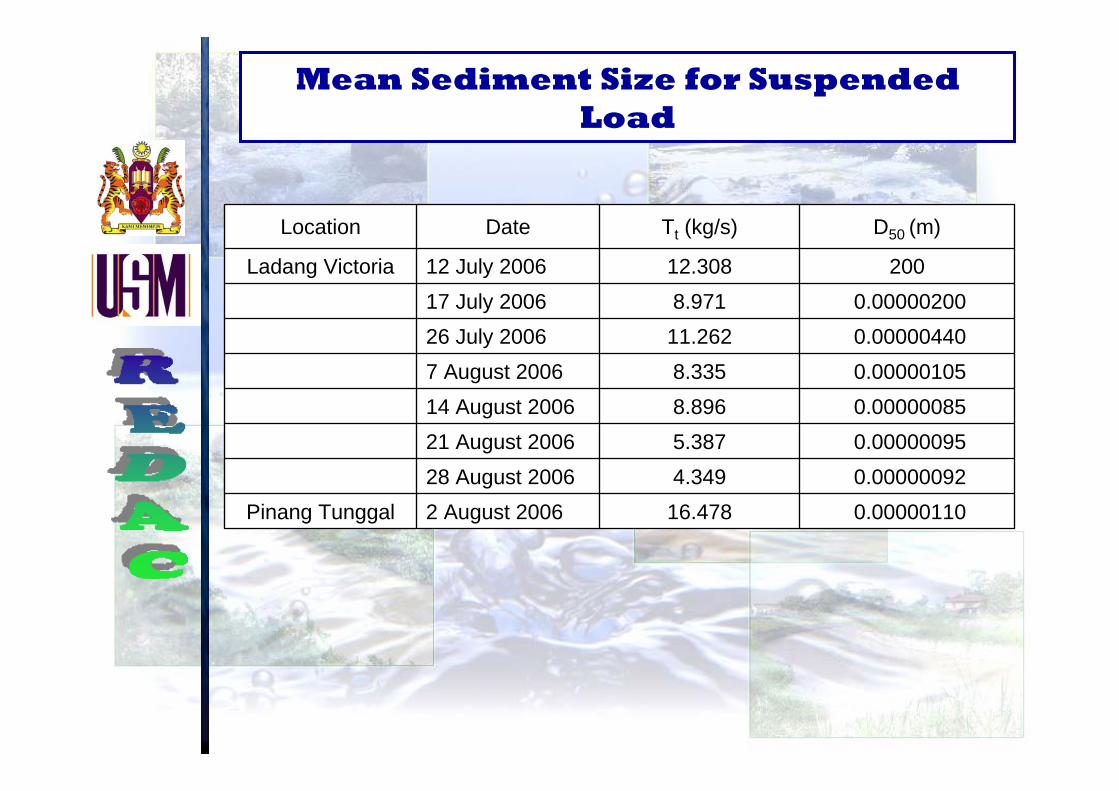
Mean Sediment Size for Suspended Load
16.4784.3495.3878.8968.33511.2628.97112.308
Tt (kg/s)
0.000001102 August 2006Pinang Tunggal0.0000009228 August 20060.0000009521 August 20060.0000008514 August 20060.000001057 August 20060.0000044026 July 20060.0000020017 July 2006
20012 July 2006Ladang Victoria
D50 (m)DateLocation

Grab Sampling @ Ch 1.40, Kg. Sg Deraka

Summary of Data Collection
0.01900.00020.6868.89647.0851.5748.00.5427.1828.08.2006LV07
0.01710.00020.6570.525145.6751.3346.00.5928.3521.08.2006LV06
0.01650.00020.5970.584641.311.3642.00.5324.7114.08.2006LV05
0.02330.00020.7672.82755.1351.4172.00.5927.7807.08.2006LV04
0.01620.00020.6380.96751.4001.5380.00.5933.1226.07.2006LV03
0.01740.00020.8182.80866.8351.8082.00.7147.2119.07.2006LV02
0.01590.00021.1795.150111.1652.5294.00.94109.8912.07.2006LV01
( m )( m )( m2 )( m )( m )( m/s )( m3/s )Sample
nS0RPAYoBVQDateNo.

Input Hydrograph @ Ladang Victoria for Flood 2003
2003 Hydrograph @ Ldg Victoria
0
100
200
300
400
500
600
700
800
900
1000
1100
1200
1300
1400
4000 4500 5000 5500 6000 6500 7000 7500 8000 8500
Time Step (Hour)
Dis
char
ge, Q
(m3 /s
)
Jun Jul Aug Sep Oct Nov Dec
6th October (4pm) (Q=1340m3/s) 9th December
(11am) (Q=58m3/s)
2nd October (7am)
(Q=64m3/s)

Tidal @ kedah Pier (1 - 31 Oct 2003)
0.0
0.5
1.0
1.5
2.0
2.5
3.0
3.5
6555 6605 6655 6705 6755 6805 6855 6905 6955 7005 7055 7105 7155 7205 7255
Time (Hour)
Hei
ght (
m)
Oct

Initial Bed Material Size Distributions Sidam Bridge (Ladang Victoria)
0.00
10.00
20.00
30.00
40.00
50.00
60.00
70.00
80.00
90.00
100.00
0.01 0.1 1 10 100Particle size mm
Per
cent
age
pass
ing
Medium Fine CoarseMedium MediumFine Coarse Fine Coarse Fine
CLAY SILT GRAVELSAND
63u 212u 425u 1.18mm3.35
6.314 mmBS sieve aperture size, mm
d50 = 0.0018 m
River Mouth 1
0
10
20
30
40
50
60
70
80
90
100
0.001 0.01 0.1 1 10 100Particle size mm
Per
cent
age
pass
ing
Medium Fine CoarseMedium MediumFine Coarse Fine Coarse Fine
CLAY SILT GRAVELSAND
63u 212u 425u 1.18mm3.35
6.314 mmBS sieve aperture size, mm
d50 = 0.000425 m
(b) Ch. 0.20 (M1-River Mouth)
(a) Ch. 39.50 (M8-Ladang Victoria Bridge)

Geometry Data
Calibration

Calibration of FLUVIAL Model (FL-14) at Peak 2003 Flood Discharge
-0.241.06-0.241.06-0.241.061.30Ch 0.1 (River Mouth)
0.99Ch 0.2
1.21Ch 0.4
+1.266.10+0.975.71+0.575.314.74Ch 14.0 (Bumbong Lima)
+1.0011.00+0.5210.52-0.019.9910.00Ch 41.2 (LdgVictoria)
DifferencePredict DifferencePredict DifferencePredict ObserveLocation
n = 0.035n = 0.030n = 0.025Location

Longitudinal Section for Sg Muda, Kedah - (Yang Equation -n=0.025)
-10
-5
0
5
10
15
0 5 10 15 20 25 30 35 40Chainage (m)
Lev
el (m
)
Existing Bed Level Water Level (Peak Discharge)Bed Level (Peak Discharge) Observe Water Level
Longitudinal Section for Sg Muda, Kedah - (Yang Equation -n=0.030)
-10
-5
0
5
10
15
0 5 10 15 20 25 30 35 40
Chainage (m)L
evel
(m)
Existing Bed Level Water Level (Peak Discharge)Bed Level (Peak Discharge) Observe Water Level
Longitudinal Section for Sg Muda, Kedah - (Yang Equation -n=0.035)
-10
-5
0
5
10
15
0 5 10 15 20 25 30 35 40
Chainage (m)
Lev
el (m
)
Existing Bed Level Water Level (Peak Discharge)Bed Level (Peak Discharge) Observe Water Level

Simulation

0
200
400
600
800
1000
1200
1400
1600
1800
2000
2200
2400
6 24 42 60 78 90 108 126 144 162 180
Time (h)
Disc
harg
e (c
umec
)
50 yr (Qmax=1768 cumec)-Hec-Hms100 yr (Qmax=2001 cumec)-Hec-Hms50 yr (Qmax=1815 cumec)-JPZ100 yr (Qmax=2130 cumec)-JPZFlood 2003 (Qmax=1340 cumec)

-20
-15
-10
-5
0
5
10
15
0 5 10 15 20 25 30 35 40Chainage (km)
Ele
vatio
n (m
, LSD
)
Existing Bed Level Flood 2003 50 yr ARI (FL-12)50 yr ARI (JPZ) Bund Predicted Bed Level (FL-12)Predicted Bed Level (JPZ)
Longitudinal Section for Sg. Muda Kedah (n = 0.025)
Flood Levels under 1 in 50 yr ARI, with Proposed Bund Levels for Sg Muda

-20
-15
-10
-5
0
5
10
15
0 5 10 15 20 25 30 35 40Chainage (km)
Ele
vatio
n (m
, LSD
)
Existing Bed Level Flood 2003 100 yr ARI (FL-12)100 yr ARI (JPZ) Bund Predicted Bed Level (FL-12)Predicted Bed Level (JPZ)
Longitudinal Section for Sg. Muda Kedah (n = 0.025)
Flood Levels under 1 in 100 yr ARI, with Proposed Bund Levels for Sg Muda

-10
-5
0
5
10
15
0 5 10 15 20 25 30 35 40Chainage (km)
Ele
vatio
n (m
, LSD
)
Existing Bed Level Flood 2003 50 yr ARI (FL-12)100 yr ARI (FL-12) 50 yr ARI (JPZ) 100 yr ARI (JPZ)
Longitudinal Section for Sg. Muda Kedah (n = 0.025)
Flood Levels under 1 in 50 yr and 100 yr ARIs

1.691.791.062.391.391.39River Mouth
2.252.241.442.841.841.84CH1
2.442.41.653.172.192.17CH2
2.632.571.943.462.542.46CH3
2.982.92.413.622.742.62CH4
5.585.385.315.504.924.50CH14
11.5411.219.9711.0110.6810.01CH41
100 yr ARI50 yr ARIFlood 2003
Design HydrographBund100 yr ARI50 yr ARI
Existing Cross Section;Fluvial-12 (n = 0.025)
Proposed Cross Section; EXTRAN-XP (JPZ, 2000)
Flood ProfilesChainage No.
Summary of Flood Levels under 1 in 50 yr and 100 yr ARIs, with Proposed Bund Levels for Sg Muda

-6
-4
-2
0
2
4
6
8
10
12
-200 -150 -100 -50 0 50Distance (m)
Ele
vatio
n (m
)
Predicted Bed Level (Design: ARI-50) Predicted Water Level (Design: ARI-50)Predicted Bed Level (Design: ARI-100) Predicted Water Level (Design: ARI-100)Predicted Bed Level (JPZ: ARI-50) Predicted Water Level (JPZ: ARI-50)Predicted Bed Level (JPZ: ARI-100) Predicted Water Level (JPZ: ARI-100)Existing Bed Level
Cross Section Changes (n=0.025)
(a) Ch. 39.50 (M8-Ladang Victoria Bridge)
(b) Ch 31.60 (Kuari Kg
Pantai Perai )

-8
-6
-4
-2
0
2
4
6
8
10
-200 -150 -100 -50 0 50Distance (m)
Ele
vatio
n (m
)
Predicted Bed Level (Design: ARI-50) Predicted Water Level (Design: ARI-50)Predicted Bed Level (Design: ARI-100) Predicted Water Level (Design: ARI-100)Predicted Bed Level (JPZ: ARI-50) Predicted Water Level (JPZ: ARI-50)Predicted Bed Level (JPZ: ARI-100) Predicted Water Level (JPZ: ARI-100)Existing Bed Level
Cross Section Changes (n=0.025)
(c) Ch. 25.20 (M7-Pinang Tunggal Bridge )
-6
-4
-2
0
2
4
6
8
10
-400 -350 -300 -250 -200 -150 -100 -50 0 50 100Distance (m)
Ele
vatio
n (m
)
Predicted Bed Level (Design: ARI-50) Predicted Water Level (Design: ARI-50)Predicted Bed Level (Design: ARI-100) Predicted Water Level (Design: ARI-100)Predicted Bed Level (JPZ: ARI-50) Predicted Water Level (JPZ: ARI-50)Predicted Bed Level (JPZ: ARI-100) Predicted Water Level (JPZ: ARI-100)Existing Bed Level
(d) Ch. 23.00 (Kg Lahar Tiang)

Cross Section Changes (n=0.025)
-8
-6
-4
-2
0
2
4
6
8
10
-200 -150 -100 -50 0 50Distance (m)
Ele
vatio
n (m
)
Predicted Bed Level (Design: ARI-50) Predicted Water Level (Design: ARI-50)Predicted Bed Level (Design: ARI-100) Predicted Water Level (Design: ARI-100)Predicted Bed Level (JPZ: ARI-50) Predicted Water Level (JPZ: ARI-50)Predicted Bed Level (JPZ: ARI-100) Predicted Water Level (JPZ: ARI-100)Existing Bed Level
(e) Ch. 21.90 (M17-Kg Lahar Tiang)
-20
-15
-10
-5
0
5
10
-200 -150 -100 -50 0 50Distance (m)
Ele
vatio
n (m
)
Predicted Bed Level (Design: ARI-50) Predicted Water Level (Design: ARI-50)Predicted Bed Level (Design: ARI-100) Predicted Water Level (Design: ARI-100)Predicted Bed Level (JPZ: ARI-50) Predicted Water Level (JPZ: ARI-50)Predicted Bed Level (JPZ: ARI-100) Predicted Water Level (JPZ: ARI-100)Existing Bed Level
(f) Ch. 15.40 (Bumbong Lima)

-10
-8
-6
-4
-2
0
2
4
-200 -150 -100 -50 0 50 100 150 200 250Distance (m)
Ele
vatio
n (m
)
Predicted Bed Level (Design: ARI-50) Predicted Water Level (Design: ARI-50)Predicted Bed Level (Design: ARI-100) Predicted Water Level (Design: ARI-100)Predicted Bed Level (JPZ: ARI-50) Predicted Water Level (JPZ: ARI-50)Predicted Bed Level (JPZ: ARI-100) Predicted Water Level (JPZ: ARI-100)Existing Bed Level
-5-4-3-2-10123456
-200 -150 -100 -50 0 50 100 150 200 250Distance (m)
Ele
vatio
n (m
)
Predicted Bed Level (Design: ARI-50) Predicted Water Level (Design: ARI-50)Predicted Bed Level (Design: ARI-100) Predicted Water Level (Design: ARI-100)Predicted Bed Level (JPZ: ARI-50) Predicted Water Level (JPZ: ARI-50)Predicted Bed Level (JPZ: ARI-100) Predicted Water Level (JPZ: ARI-100)Existing Bed Level
Cross Section Changes (n=0.025)
(h) Ch. 4.86 (M5-Kuala Muda Bridge )
(g) Ch. 12.64 (M6-Merdeka Bridge )

Sediment Delivery (Flood Oct 2003)
0
50000
100000
150000
200000
0 10 20 30 40Chainage (km)
Sedi
men
t Del
iver
y (to
ns)
Peak After Flood

Mitigation and Protection Works

Sand and Gravel Mining
Kampong Kubang Bedengong Kampong Lubok Segintah
River Sand Mining
Sand Mining Pumping Activity

Bridge Crossing Protection
-Sand mining has caused serious degradation of Sg Muda
-In-stream sand and gravel mining should not be allowed

KG. BUMBUNG LIMA
PEKULA
KG. JAWA
KG. BUKITLALANG
MerdekaBridge
PLUS Highway
-20
-15
-10
-5
0
5
10
-200 -150 -100 -50 0 50Distance (m)
Ele
vatio
n (m
)
Predicted Bed Level (Design: ARI-50) Predicted Water Level (Design: ARI-50)Predicted Bed Level (Design: ARI-100) Predicted Water Level (Design: ARI-100)Predicted Bed Level (JPZ: ARI-50) Predicted Water Level (JPZ: ARI-50)Predicted Bed Level (JPZ: ARI-100) Predicted Water Level (JPZ: ARI-100)Existing Bed Level
CH 13.1 CH 15.4
-14-12-10-8-6-4-202468
-200 -150 -100 -50 0 50Distance (m)
Ele
vatio
n (m
)
Predicted Bed Level (Design: ARI-50) Predicted Water Level (Design: ARI-50)Predicted Bed Level (Design: ARI-100) Predicted Water Level (Design: ARI-100)Predicted Bed Level (JPZ: ARI-50) Predicted Water Level (JPZ: ARI-50)Predicted Bed Level (JPZ: ARI-100) Predicted Water Level (JPZ: ARI-100)Existing Bed Level
Ch. 13.10 (Bumbong Lima)Ch. 15.40 (Bumbong Lima)

Channel realignment

CH 21.90
CH 23.00
-6
-4
-2
0
2
4
6
8
10
-400 -350 -300 -250 -200 -150 -100 -50 0 50 100Distance (m)
Ele
vatio
n (m
)Predicted Bed Level (Design: ARI-50) Predicted Water Level (Design: ARI-50)Predicted Bed Level (Design: ARI-100) Predicted Water Level (Design: ARI-100)Predicted Bed Level (JPZ: ARI-50) Predicted Water Level (JPZ: ARI-50)Predicted Bed Level (JPZ: ARI-100) Predicted Water Level (JPZ: ARI-100)Existing Bed Level
(d) Ch. 23.00 (Kg Lahar Tiang)
-8
-6
-4
-2
0
2
4
6
8
10
-200 -150 -100 -50 0 50Distance (m)
Ele
vatio
n (m
)
Predicted Bed Level (Design: ARI-50) Predicted Water Level (Design: ARI-50)Predicted Bed Level (Design: ARI-100) Predicted Water Level (Design: ARI-100)Predicted Bed Level (JPZ: ARI-50) Predicted Water Level (JPZ: ARI-50)Predicted Bed Level (JPZ: ARI-100) Predicted Water Level (JPZ: ARI-100)Existing Bed Level
(e) Ch. 21.90 (M17-Kg Lahar Tiang)

Channel Realignment

River Bank Protection
- The stability of the proposed riverbank protection measures can be seriously impacted by sand-gravel mining. In-stream mining activities should be prohibited to ensure stability of the proposed design.

•Diversion to Sg. Merbok not
recommended
• Likely sedimentation
upstream of Muda Barrage

RECOMMENDATIONS• The 2003 flood discharge of 1,340 cumecs is
recommended for the design. The bund height should be determined from the 2003 flood stage plus freeboard.
• Sand and gravel mining can cause major stability problems to river stabilization structures. In-stream mining should be prohibited. Off-stream mining should be allowed at a minimum distance of 50 m from the bank line.
• The cross section geometry of the channel should not be changed. The realignment of two reaches should be considered: Merdeka Bridge & Kg Lahar Tiang
• The diversion to Sg. Merbok is not recommended