Embed Size (px)
Citation preview
1
A PROBABILISTIC APPROACH TO FIRED HEATER TUBE REMAINING
LIFE ASSESSMENTS
ASME PVP 2015
JAMES V. LETA STAFF ENGINEER
THE EQUITY ENGINEERING GROUP, INC.
COAUTHORS: JON DOBIS, P.E.; THOMAS DIRHAM, P.E.; RUOHUA GUO; LIONEL ROBERTS, P. ENG.
Copyri
ght ©
2015
E²G
| The
Equ
ity E
ngine
ering
Grou
p, Inc
. All R
ights
Reserv
ed.

2 © 2015 E2G | The Equity Engineering Group, Inc. All rights reserved
PRESENTATION OUTLINE • Introduction
– Problem Background – Motivation for Probabilistic Approach
• Description of Methodology – Limit State Definition – Statistical Characterization of Uncertainty – Calculation of Probability of Failure
• Case Study – Equipment Description – Characterization of Input Parameters – Results and Discussion
• Conclusion – Summary – Questions
Copyri
ght ©
2015
E²G
| The
Equ
ity E
ngine
ering
Grou
p, Inc
. All R
ights
Reserv
ed.

3 © 2015 E2G | The Equity Engineering Group, Inc. All rights reserved
INTRODUCTION (PROBLEM BACKGROUND) • Fired heaters are core pieces of
equipment for the following oil refinery processes: • Distillation • Fluidized Catalytic Cracking • Alkylation • Catalytic Reforming • Thermal Cracking • Coking • Hydrocracking
Copyri
ght ©
2015
E²G
| The
Equ
ity E
ngine
ering
Grou
p, Inc
. All R
ights
Reserv
ed.
4 © 2015 E2G | The Equity Engineering Group, Inc. All rights reserved
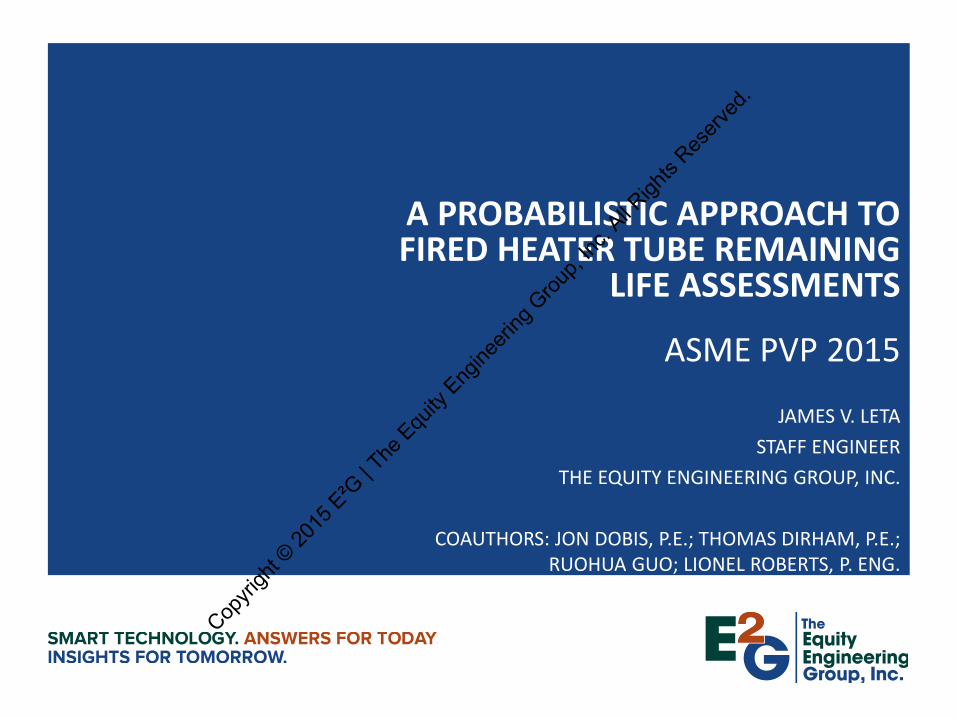
INTRODUCTION (PROBLEM BACKGROUND) • Regardless of a fired heater’s
application, fired heater tubes are susceptible to creep and corrosion damage due to typical operating conditions.
• Therefore, inspection intervals for fired heaters are determined based on remaining life estimates for the tube subjected to the most severe conditions. • API 530 (design life) • Part 10 of API 579 (in-service remaining life)
Copyri
ght ©
2015
E²G
| The
Equ
ity E
ngine
ering
Grou
p, Inc
. All R
ights
Reserv
ed.

5 © 2015 E2G | The Equity Engineering Group, Inc. All rights reserved
INTRODUCTION (MOTIVATION FOR PROBABILISTIC APPROACH) • Because of uncertainty associated with key parameters (e.g., tube
skin temperature, min. tube thickness), analysts often use conservative values in remaining life calculations.
• This ensures a conservative estimate of remaining life, but it is difficult (if not impossible) to quantify the margin of error associated with the estimate.
• Additionally, the remaining life estimate provides no insight as to how the risk of equipment failure increases as you approach the remaining life of a tube.
Copyri
ght ©
2015
E²G
| The
Equ
ity E
ngine
ering
Grou
p, Inc
. All R
ights
Reserv
ed.

6 © 2015 E2G | The Equity Engineering Group, Inc. All rights reserved
INTRODUCTION (MOTIVATION FOR PROBABILISTIC APPROACH) • An effective way of
answering such questions is to utilize a probabilistic approach to assessing the remaining lives of heater tubes.
• Probabilistic techniques provide a quantitative estimate of probability of failure at a given time rather than a single value of estimated remaining life.
• This allows for optimal decision making for both safety and cost.
Copyri
ght ©
2015
E²G
| The
Equ
ity E
ngine
ering
Grou
p, Inc
. All R
ights
Reserv
ed.

7 © 2015 E2G | The Equity Engineering Group, Inc. All rights reserved
PRESENTATION OUTLINE • Introduction
– Problem Background – Motivation for Probabilistic Approach
• Description of Methodology – Limit State Definition – Statistical Characterization of Uncertainty – Calculation of Probability of Failure
• Case Study – Equipment Description – Characterization of Input Parameters – Results and Discussion
• Conclusion – Summary – Questions
Copyri
ght ©
2015
E²G
| The
Equ
ity E
ngine
ering
Grou
p, Inc
. All R
ights
Reserv
ed.

8 © 2015 E2G | The Equity Engineering Group, Inc. All rights reserved
DESCRIPTION OF METHODOLOGY (LIMIT STATE DEFINITION)
• Accumulated creep damage is computed per Part 10 of API 579
where: =1 =1( ) = ,
iN NN i
T ii i
tD t DL∆
=∑ ∑
( ) ( ) ( )
( )( ) ( ) ( )
2 3
1 2 log 3 log 4 log
0 0
2 3
1 2 log 3 log 4 log
0
0
1
log ,
g |lo = ,
1
max ,3 ,i
sr
i i i
ii
i i i
ii i
m
i i i im
ii
A A S A S A SA
T
B B S B S B SB
T
L
n nδ
ε
ε
α
Ω
+
+ + += − − ∆ −
+ + +Ω + ∆ +
=Ω
Ω = Ω − +
Copyri
ght ©
2015
E²G
| The
Equ
ity E
ngine
ering
Grou
p, Inc
. All R
ights
Reserv
ed.

9 © 2015 E2G | The Equity Engineering Group, Inc. All rights reserved
DESCRIPTION OF METHODOLOGY (LIMIT STATE DEFINITION)
and
( ) ( )
( ) ( ) ( )1/ 22 2 2
1 2 1 3 2 3
1 2 3
2
2 3 4
log 10
1
2
1 ,
2 3,
log ( ),
.
( , )
i i i i i i
i i ii
ie
i ii
i
i ie
ie
i ijk
A A S A Sn
TS
f p t
σ σ σ σ σ σ
σ σ σδ β
σ
σ
σ
σ
− + − + −
+ += −
+ += −
=
=
=
Copyri
ght ©
2015
E²G
| The
Equ
ity E
ngine
ering
Grou
p, Inc
. All R
ights
Reserv
ed.

10 © 2015 E2G | The Equity Engineering Group, Inc. All rights reserved
DESCRIPTION OF METHODOLOGY (LIMIT STATE DEFINITION)
• Creep failure is defined as total accumulated creep damage reaching 100%.
• The limit state is defined as the difference between the allowable creep damage and the total accumulated creep damage.
• Therefore, a creep failure corresponds to .
= A Tg D D−
0g ≤
Copyri
ght ©
2015
E²G
| The
Equ
ity E
ngine
ering
Grou
p, Inc
. All R
ights
Reserv
ed.

11 © 2015 E2G | The Equity Engineering Group, Inc. All rights reserved
DESCRIPTION OF METHODOLOGY (STATISTICAL CHARACTERIZATION OF UNCERTAINTY) • Limit state input parameters with inherent uncertainty can be
treated as random variables. • Examples:
– Initial Tube Thickness – Initial Tube OD – Pressure – Initial Creep Damage
• The set of potential values for a random variable is characterized by specifying a mean value, coefficient of variation, and a probability distribution function (e.g., normal, lognormal).
• In the absence of measured data, the mean and COV are estimated based on experience of analyst.
Copyri
ght ©
2015
E²G
| The
Equ
ity E
ngine
ering
Grou
p, Inc
. All R
ights
Reserv
ed.

12 © 2015 E2G | The Equity Engineering Group, Inc. All rights reserved
DESCRIPTION OF METHODOLOGY (STATISTICAL CHARACTERIZATION OF UNCERTAINTY) • If historical time-series data is available, pressure and/or temperature are treated as
random processes (sequence of random variables). • If random process is Stationary and Gaussian, can use equation below to generate
random sequences of random processes :
• Use Fourier analysis to determine amplitudes 𝑆𝑆1 , 𝑆𝑆2, … 𝑆𝑆𝑁𝑁 at the corresponding
frequencies 𝑓𝑓1 ,𝑓𝑓2, … 𝑓𝑓𝑁𝑁 • 𝜙𝜙𝑛𝑛 is a random phase angle between 0 and 2𝜋𝜋. • Randomly generated sequences will contain the same amplitudes computed from
the data, but they will be associated with random phase angles.
( )1
( 2) 2 cosn
N
n nn
X t S f tπ φ=
= +∑
Copyri
ght ©
2015
E²G
| The
Equ
ity E
ngine
ering
Grou
p, Inc
. All R
ights
Reserv
ed.

13 © 2015 E2G | The Equity Engineering Group, Inc. All rights reserved
DESCRIPTION OF METHODOLOGY (CALCULATION OF PROBABILITY OF FAILURE) • The failure probability at time 𝑡𝑡 is defined as
𝑃𝑃𝑓𝑓 𝑡𝑡 = 1 − Pr (𝐷𝐷𝑇𝑇 𝑡𝑡 < 𝐷𝐷𝐴𝐴) • Due to the complexity of the creep damage model, a closed for expression
for failure probability is not available. Therefore, Monte Carlo Simulation (MCS) is recommended for estimating a distribution of 𝐷𝐷𝑇𝑇 at each desired time.
• One simulation consists of the following steps: 1. Generate random samples for parameters characterized as random variables and
random sequence for parameters characterized as random processes. 2. Calculate the total accumulated creep damage at times 𝑡𝑡1 to 𝑡𝑡𝑁𝑁. 3. Evaluate the limit state function.
• For estimating larger values of 𝑃𝑃𝑓𝑓 (say ~1/1000 and larger) the 𝑃𝑃𝑓𝑓 can be accurately estimated by dividing the number of simulations where 𝑔𝑔 ≤0 by the total number of simulations.
Copyri
ght ©
2015
E²G
| The
Equ
ity E
ngine
ering
Grou
p, Inc
. All R
ights
Reserv
ed.

14 © 2015 E2G | The Equity Engineering Group, Inc. All rights reserved
DESCRIPTION OF METHODOLOGY (CALCULATION OF PROBABILITY OF FAILURE) • For estimating smaller values of 𝑃𝑃𝑓𝑓, MCS is computationally prohibitive and a
different method is recommended. • By determining the PDF function 𝑓𝑓𝐷𝐷𝑇𝑇 that best fits the distribution of
simulated 𝐷𝐷𝑇𝑇 values is determined, 𝑃𝑃𝑓𝑓 can be estimated analytically with
𝑃𝑃𝑓𝑓 = 1 − 𝑓𝑓𝐷𝐷𝑇𝑇1
0𝑑𝑑𝐷𝐷𝑇𝑇
Copyri
ght ©
2015
E²G
| The
Equ
ity E
ngine
ering
Grou
p, Inc
. All R
ights
Reserv
ed.

15 © 2015 E2G | The Equity Engineering Group, Inc. All rights reserved
PRESENTATION OUTLINE • Introduction
– Problem Background – Motivation for Probabilistic Approach
• Description of Methodology – Limit State Definition – Statistical Characterization of Uncertainty – Calculation of Probability of Failure
• Case Study – Equipment Description – Characterization of Input Parameters – Results and Discussion
• Conclusion – Summary – Questions
Copyri
ght ©
2015
E²G
| The
Equ
ity E
ngine
ering
Grou
p, Inc
. All R
ights
Reserv
ed.

16 © 2015 E2G | The Equity Engineering Group, Inc. All rights reserved
CASE STUDY (EQUIPMENT BACKGROUND) • Basis of case study is a probabilistic creep
assessment of Catalytic Reformer heater tubes performed by E2G in January 2014.
• Prior to 2003, fired heater experienced temperature upsets for extended periods of time.
• This motived owner/user of equipment to perform creep test in November 2003.
• Goals of assessment were: – Assess damage that occurred from
November 2003 to November 2014. – Investigate risk associated with increasing
the tube mean operating temperature in the future.
• 𝑃𝑃𝑓𝑓 Tolerance was set at 1/100,000.
Catalytic Reformer Fired Heater
Copyri
ght ©
2015
E²G
| The
Equ
ity E
ngine
ering
Grou
p, Inc
. All R
ights
Reserv
ed.

17 © 2015 E2G | The Equity Engineering Group, Inc. All rights reserved
CASE STUDY (EQUIPMENT BACKGROUND) • Equipment Description:
– Location: Reforming Unit – Design Code: API RP 530 – Installation Year: 1971
• Tube Material: – Material: 2.25Cr-1Mo
• Tube Geometry: – Nominal Tube Diameter: 6.625 inch – Nominal Tube Thickness: 0.440 inch
Copyri
ght ©
2015
E²G
| The
Equ
ity E
ngine
ering
Grou
p, Inc
. All R
ights
Reserv
ed.

18 © 2015 E2G | The Equity Engineering Group, Inc. All rights reserved
CASE STUDY (EQUIPMENT BACKGROUND) • Process Conditions
– Process Fluid: Reformate – Heater Environment: Excess Air
(Oxidizing) – Avg. Operating Pressure: 425 psig – Avg. Tube Skin Thermocouple Temp: 1012˚F
Copyri
ght ©
2015
E²G
| The
Equ
ity E
ngine
ering
Grou
p, Inc
. All R
ights
Reserv
ed.

19 © 2015 E2G | The Equity Engineering Group, Inc. All rights reserved
CASE STUDY (EQUIPMENT BACKGROUND) • Assumptions:
– Tubes are able to expand axially; therefore, axial and bending loads can be neglected.
– All heater tubes had similar level of creep damage at the time of the Omega creep test performed on select tubes in 2003.
– ID corrosion is negligible for all tubes. – OD corrosion is uniform for all tubes.
Copyri
ght ©
2015
E²G
| The
Equ
ity E
ngine
ering
Grou
p, Inc
. All R
ights
Reserv
ed.

20 © 2015 E2G | The Equity Engineering Group, Inc. All rights reserved
CASE STUDY (CHARACTERIZATION OF INPUT PARAMETERS) • The following limit state input parameters were characterized as random
variables: – Strain rate adjustment factor (initial creep damage) – Initial outside diameter – Initial tube thickness – Outer corrosion rate multiplier – Pressure
• In lieu of available data, assumptions for COV values were made. The logic shown in Table 9.3 of API 579 was used as a reference. – Paraphrasing:
• COV = 0.1 if mean value of parameter is computed or is well known. • COV = 0.3 if the uncertainty associated with the specified mean value for a parameter
is significant.
Copyri
ght ©
2015
E²G
| The
Equ
ity E
ngine
ering
Grou
p, Inc
. All R
ights
Reserv
ed.

21 © 2015 E2G | The Equity Engineering Group, Inc. All rights reserved
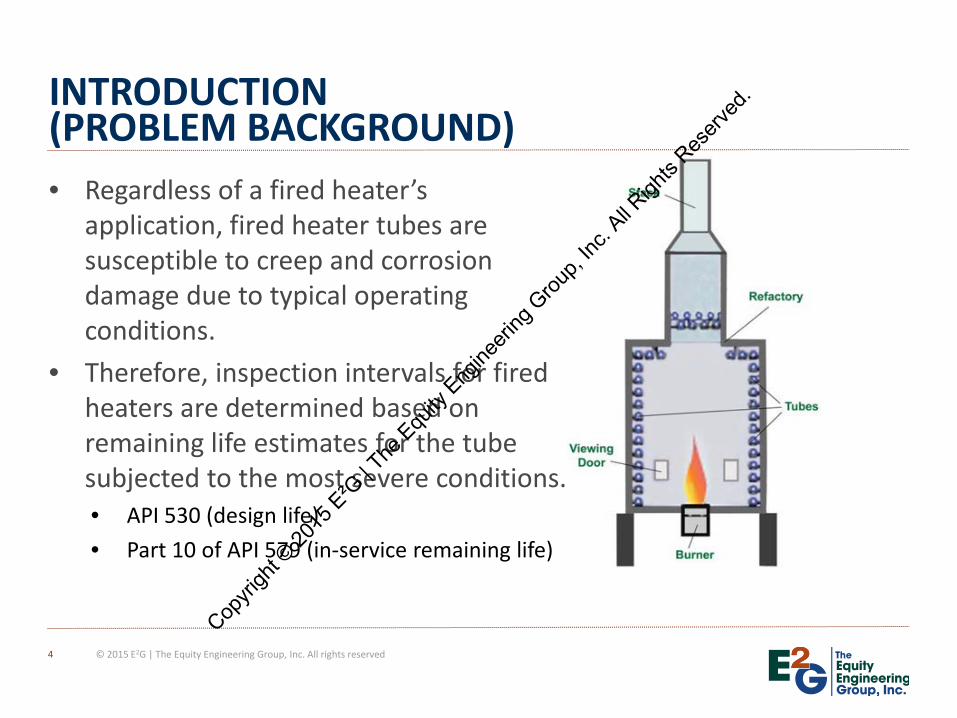
CASE STUDY (CHARACTERIZATION OF INPUT PARAMETERS) • In this assessment, either Normal or Lognormal PDF expression were used
for random variables.
Copyri
ght ©
2015
E²G
| The
Equ
ity E
ngine
ering
Grou
p, Inc
. All R
ights
Reserv
ed.
22 © 2015 E2G | The Equity Engineering Group, Inc. All rights reserved
CASE STUDY (CHARACTERIZATION OF INPUT PARAMETERS) Examples:
Copyri
ght ©
2015
E²G
| The
Equ
ity E
ngine
ering
Grou
p, Inc
. All R
ights
Reserv
ed.

23 © 2015 E2G | The Equity Engineering Group, Inc. All rights reserved
CASE STUDY (CHARACTERIZATION OF INPUT PARAMETERS) • The owner/user provided daily average temperature readings for the tube subjected to the
highest temperatures (on average) between November 2003 and November 2013. Therefore, temperature was treated as a random process.
• A monthly moving average curve was fitted through the data as shown below.
Copyri
ght ©
2015
E²G
| The
Equ
ity E
ngine
ering
Grou
p, Inc
. All R
ights
Reserv
ed.

24 © 2015 E2G | The Equity Engineering Group, Inc. All rights reserved
CASE STUDY (CHARACTERIZATION OF UNCERTAINTY) • By subtracting the estimated moving average temperature from each daily average
reading, we arrived at a dataset of the temperature fluctuations . The result is shown below.
Copyri
ght ©
2015
E²G
| The
Equ
ity E
ngine
ering
Grou
p, Inc
. All R
ights
Reserv
ed.

25 © 2015 E2G | The Equity Engineering Group, Inc. All rights reserved
CASE STUDY (CHARACTERIZATION OF UNCERTAINTY) • Analysis of fluctuation data set indicated that it could be treated as a
Stationary Gaussian process. • Therefore, equation shown earlier was used to generate sequences of
fluctuation data.
Copyri
ght ©
2015
E²G
| The
Equ
ity E
ngine
ering
Grou
p, Inc
. All R
ights
Reserv
ed.
26 © 2015 E2G | The Equity Engineering Group, Inc. All rights reserved
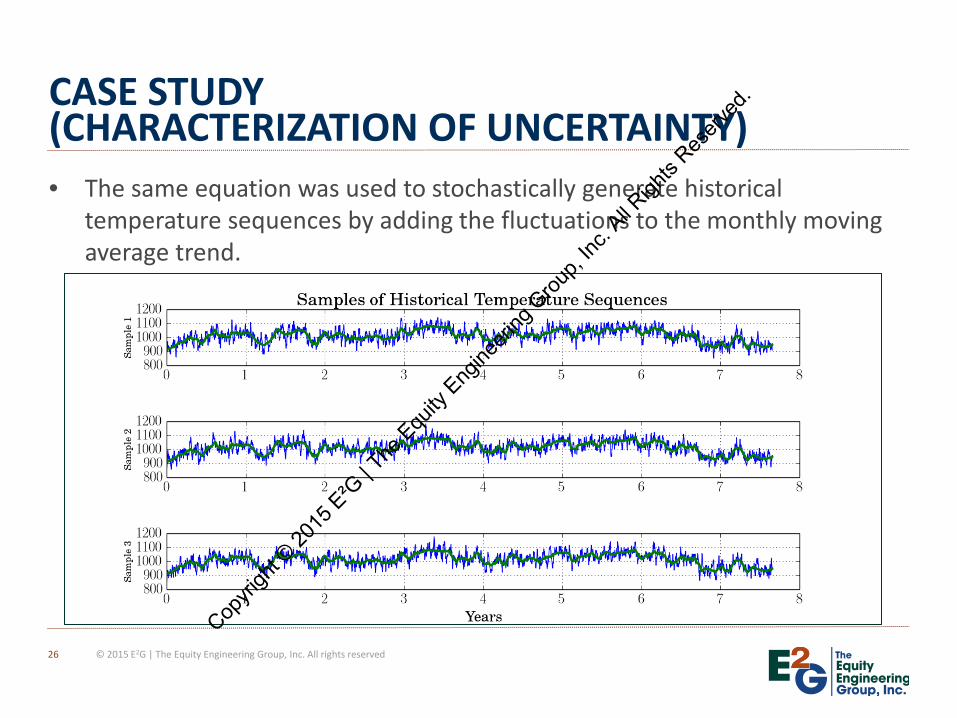
CASE STUDY (CHARACTERIZATION OF UNCERTAINTY) • The same equation was used to stochastically generate historical
temperature sequences by adding the fluctuations to the monthly moving average trend.
Copyri
ght ©
2015
E²G
| The
Equ
ity E
ngine
ering
Grou
p, Inc
. All R
ights
Reserv
ed.

27 © 2015 E2G | The Equity Engineering Group, Inc. All rights reserved
CASE STUDY (CHARACTERIZATION OF INPUT PARAMETERS) • Similarly, random sequences of future temperatures were generated by
adding the fluctuations to a projected mean temperature.
Copyri
ght ©
2015
E²G
| The
Equ
ity E
ngine
ering
Grou
p, Inc
. All R
ights
Reserv
ed.

28 © 2015 E2G | The Equity Engineering Group, Inc. All rights reserved
CASE STUDY (CHARACTERIZATION OF UNCERTAINTY) • 100,000 MC simulations were performed for each scenario considered. • Five different projected future mean temperatures were considered. • The methods described earlier for computing 𝑃𝑃𝑓𝑓 were used to tabulate and plot the
relationship between time and probability of tube rupture.
Copyri
ght ©
2015
E²G
| The
Equ
ity E
ngine
ering
Grou
p, Inc
. All R
ights
Reserv
ed.

29 © 2015 E2G | The Equity Engineering Group, Inc. All rights reserved
CASE STUDY (RESULTS AND DISCUSSION)
POF Versus Future Life for Various Temperatures
Temperature (F) Future Life (years)
Average 10 20
1025 <1/1,000,000 0.01%
1050 0.03% 9%
1075 12% 87%
1100 91% >99.9%
1125 >99.9% >99.9%
Copyri
ght ©
2015
E²G
| The
Equ
ity E
ngine
ering
Grou
p, Inc
. All R
ights
Reserv
ed.

30 © 2015 E2G | The Equity Engineering Group, Inc. All rights reserved
CASE STUDY (RESULTS AND DISCUSSION)
Copyri
ght ©
2015
E²G
| The
Equ
ity E
ngine
ering
Grou
p, Inc
. All R
ights
Reserv
ed.

31 © 2015 E2G | The Equity Engineering Group, Inc. All rights reserved
PRESENTATION OUTLINE • Introduction
– Problem Background – Motivation for Probabilistic Approach
• Description of Methodology – Limit State Definition – Statistical Characterization of Uncertainty – Calculation of Probability of Failure
• Case Study – Equipment Description – Characterization of Input Parameters – Results and Discussion
• Conclusion – Summary – Questions
Copyri
ght ©
2015
E²G
| The
Equ
ity E
ngine
ering
Grou
p, Inc
. All R
ights
Reserv
ed.
32 © 2015 E2G | The Equity Engineering Group, Inc. All rights reserved
CONCLUSION (SUMMARY OF PRESENTATION) • Uncertainty in operating conditions, material properties, etc.,
makes it difficult to quantify error associated with heater tube remaining life estimates.
• Advantages of probabilistic approach: – Can characterize uncertainty in input parameters using
probability and statistics. – The probability of tube failure at any future time can be
estimated. • This allows the owner/user to make informed decisions on
future operating conditions or repair/replacement strategies based on their internal risk tolerance.
Copyri
ght ©
2015
E²G
| The
Equ
ity E
ngine
ering
Grou
p, Inc
. All R
ights
Reserv
ed.

33 © 2015 E2G | The Equity Engineering Group, Inc. All rights reserved
QUESTIONS?
Copyri
ght ©
2015
E²G
| The
Equ
ity E
ngine
ering
Grou
p, Inc
. All R
ights
Reserv
ed.
Corporate Headquarters 20600 Chagrin Boulevard, Suite 1200 Shaker Heights, OH 44122 Satellite Offices Houston, TX Victoria, TX Alberta, Canada 216.283.9519 www.EquityEng.com
Copyri
ght ©
2015
E²G
| The
Equ
ity E
ngine
ering
Grou
p, Inc
. All R
ights
Reserv
ed.