Embed Size (px)
Citation preview

Repeated Glucose Stimulation Reveals Distinctand Lasting Secretion Patterns of Individual Rat Pancreatic B CellsEmanuele Giordano, Domenico Bosco, Vincenzo Cirulli,* and Paolo MedaDepartment of Morphology and *Laboratoires de Recherche "Louis Jeantet, " University of GenevaMedical School, CH-1211 Geneva 4, Switzerland
Abstract
To determine whether pancreatic B cells show a constant secre-tion pattern during repeated stimulations, we have used a se-quential hemolytic plaque assay to monitor their individual in-sulin release during several successive 30-min incubations inthe presence of 16.7 mMglucose. Wehave found that the totalB cell secretion did not vary significantly in these successiveglucose stimulations and that, under these conditions, the ma-jority of B cells that were stimulated to release insulin duringthe first incubation also secreted during the second, third, and,when this was tested, during the fourth incubation. Similarly,most of the B cells that did not release detectable amounts ofinsulin during the first incubation did not secrete also duringthe two (or three) subsequent secretion tests. Together, the twogroups of B cells that showed a constant secretory pattern,represented - 75%of the entire B cell population. The remain-ing 25% of B cells shifted from a secreting to a non-secretingstate, or vice versa, from one incubation to another. These ob-servations were made under three different time frames inwhich we tested single B cells as well as B cell clusters at ratherdifferent intervals. These findings support the existence of dis-tinct B cell subpopulations differing lastingly in their ability tosecrete insulin in response to glucose. (J. Clin. Invest. 1991.87:2178-2185.) Key words: glucose - heterogeneity - hemolyticplaque assay * insulin secretion * rat pancreatic B cells
Introduction
Within the islets of Langerhans, individual B cells differ mark-edly, in terms of organelle content (1, 2), extent of intercellularcoupling (3), threshold for both glucose-induced electrical activ-ity (4), and release of insulin-containing granules (5). Markeddifferences have also been observed in vitro between isolated Bcells in so far as the biosynthesis of new proteins (6), electricalactivity (7, 8), and glucose-activated metabolic redox response(9) are concerned. Furthermore, using a hemolytic plaque as-say for insulin, a wide heterogeneity in the secretory responseof B cells to glucose has been reported ( 10-12). Thus, in prepa-rations of islet cells stimulated by glucose, all intermediateswere seen between B cells that secreted huge amounts of insulin
Address reprint requests to Dr. Giordano, Department of Morphology,University of Geneva, C.M.U., 1, rue Michel Servet, CH-1211 Geneva4, Switzerland.
Received for publication 25 July 1990 and in revised form 18December 1990.
and B cells that did not secrete detectable amounts of the hor-mone, if they secreted at all (10-12).
The causes of this in vitro heterogeneity, under conditionsin which all B cells are exposed simultaneously to the sameenvironment (10-12), are unknown. Among the possibilitiesthat should be envisaged, the most obvious are that either all Bcells have the same ability to respond to glucose but do notsecrete synchronously, or that there are distinct B cell subpopu-lations differing lastingly in their ability to release insulin afterglucose stimulation. If the first hypothesis was true, the re-peated exposure of a same B cell population to a stimulatoryconcentration of glucose should reveal the changing responseof individual B cells that, with time, would fluctuate between asecreting and a non-secreting state. By contrast, if the secondhypothesis was correct, the same test should reveal a more con-stant activity of B cells, most of which would be expected eitherto secrete repeatedly upon successive stimulations or to be re-peatedly insensitive to the secretagogue. In order to addressthese possibilities, we have now developed a hemolytic plaqueassay that permits to study the insulin secretion of individual Bcells, during successive stimulations. Using this system, wehave found that individual B cells show distinct secretory pat-terns and that, in a large majority, they reproduce a given secre-tory pattern during successive glucose stimulations.
Methods
Preparation of islet cells. Islets of Langerhans were isolated by collage-nase digestion from the splenic portion of the pancreas of maleSprague-Dawley (SIVZ) rats weighing 250-350 g (5). The isolated isletswere incubated for 15 min at room temperature in 1 ml of a Krebs-Ringer-bicarbonate medium prepared without adding Ca2" and supple-mented with 11.2 mMglucose, 0.5% bovine serum albumin (BSA), and3 mMEGTA(10). At the end of this incubation, the islets were aspi-rated three times into a 2-ml syringe through a 18-gauge needle. Thisprocedure was repeated using a 22-gauge needle and, finally, a 25-gaugeneedle. The resulting suspension, consisting of single cells and clumpsof various size, was transferred into a rotating spinner flask and ex-posed for 3 min at room temperature to 1 mg/ml trypsin (1:250; DifcoLaboratories, Inc., Detroit, MI) in the same Krebs-Ringer-bicarbonateCa2+-free medium. The cells were then diluted with sterile RPMI 1640medium (Gibco Laboratories, Grand Island, NY) supplemented with10% fetal calf serum (FCS), 1 10 U/ml penicillin, and 1 10 4g/ml strep-tomycin (RPMI medium), centrifuged for 10 min at 130 g, and resus-pended in RPMI medium. This procedure was repeated twice morebefore aliquots of 2 X I05 cells, suspended in 4 ml of RPMI, were platedper 60-mm Petri dish to which cells do not adhere (no. 1007; FalconPlastics, Oxnard, CA). Cells were cultured 12-18 h at 370C in a humidi-fied incubator gassed with air and CO2to maintain medium pH at 7.4.
Sequential hemolytic plaque assay for insulin. The protocol wepreviously developed to quantitate insulin secretion using a reversehemolytic plaque assay (10), was modified to permit the sequentialstudy of very same B cells. Briefly, 50-,gl glass chambers coated with 0.1mg/ml of poly-L-lysine (mol wt 150,000-300,000; Sigma ChemicalCo., St. Louis, MO) were prepared using a photoetched grid coverslip
2178 Giordano et al.
J. Clin. Invest.© The American Society for Clinical Investigation, Inc.0021-9738/91/06/2178/08 $2.00Volume 87, June 1991, 2178-2185
(no. 1916-92525; Bellco Glass, Inc., Vineland, NJ). Overnight culturedislet cells were diluted to a density of 5 X I04 cells/ml in RPMImediumand 50-Ml aliquots of this preparation were injected per chamber. Aftera 45-min incubation at 370C in an air/CO2 incubator, during whichcells adhered to the polylysine-coated glass, the chambers were thor-oughly rinsed with RPMI medium and then filled with a modifiedKrebs-Ringer-bicarbonate medium supplemented with 4%protein A-coated sheep red blood cells (SRBC), 0.1% BSA, 0.1% ascorbic acid,16.7 mMglucose, a specific and heat-inactivated (45 min at 560C)anti-insulin serum (13) diluted 1:50, and guinea pig complement di-luted 1:50 (Behring Institut, Marburg, Federal Republic of Germany).This medium is hereafter referred to as test medium. After a 30-minincubation at 370C, the glass chambers were transferred to the stage ofan inverted microscope (IM 35; Zeiss, Oberkochen, Federal Republicof Germany) and photographed at a magnification of 100 for the subse-quent localization of individual cells and measurement of the hemo-lytic plaques they may have induced. 30 min later, once all photo-graphs had been taken, the chambers were rinsed with RPMI mediumto wash out completely the SRBCcarpet (the position of islet cells,which were firmly attached to the poly-L-lysine-coated slides, did notchange during this rinsing) and then refilled with test medium. After asecond 30-min incubation at 370C, the chambers were photographedagain and the entire washing-refilling-incubating-photographing pro-cedure repeated a third time. At the end of the third 30-min incubation,the chambers were filled with 0.02% Trypan blue in phosphate-buffered saline (PBS) and incubated for 10 min at room temperature.After rinsing with PBS, they were finally filled with Bouin's fixative.
A second series of experiments was performed according to thesame protocol, except that the interval between each ofthe three succes-sive 30-min incubations was set at 3 h. In this case, once the assaychambers had been photographed, they were filled with RPMImediumand incubated at 370C into a humidified incubator gassed with air andCO2until the beginning of the next secretion test.
A third series of experiments was designed to test B cell secretionduring another time frame by adding of a fourth incubation test afteran interval which was not a multiple or a fraction of the intervals testedbefore. To this end, insulin release was assessed during four successive30-min incubations at intervals of 30, 180, and 75 min, respectively.The rest of the protocol was otherwise identical to that of the two firstexperimental series.
Immunoidenti/ication of B cells. To identify the insulin-containingB cells, the Bouin's fixed chambers were rinsed in PBS, passed througha series of graded ethanols, and incubated for 2 h at room temperaturewith the same guinea pig anti-insulin serum which was used in theplaque assay test, diluted now 1:200 in PBS. Upon rinsing, thechambers were filled for 1 h, at room temperature, with a fluorescein-labeled rabbit serum against guinea pig IgG (Institut Pasteur, Paris,France) diluted 1:200 in PBS, rinsed in PBS, filled with a 0.02% p-phen-ylenediamine in a PBS/glycerine solution (1:2, vol/vol), and eventuallysealed.
Quantitative analysis. Two to three experiments were performedaccording to each of the protocols to evaluate (a) the percentage ofsingle B cells and B cell clusters forming hemolytic plaques, (b) theindividual areas of these plaques, and (c) the secretion pattern of indi-vidual B cells and clusters. To determine the proportion of cellssurrounded by hemolytic plaques, about 200 single B cells and clusterswere scored per experiment on the photographs taken at the end ofeach incubation. Counts were restricted to Trypan blue-excluding sin-gle B cells identified by a positive immunolabeling for insulin at the endof the last incubation. The same criteria were applied-for scoring clus-ters, i.e., little aggregates containing no more than five B cells and noother islet cell types. To evaluate the area of hemolytic plaques, photo-graphs of these plaques were projected on a graphic tablet (model 4953,Tektronix, Inc., Beaverton, OR) connected to a IBM PC-XT 5150programmed for automatic surface measurement. Data were com-puted separately for single B cells and B cell clusters. Total plaquedevelopment of single cells and clusters (14), was calculated by multi-plying the values of the percentage of secreting cells and of the average
hemolytic plaque area. Comparison of the photographs taken at theend of each of the three successive test incubations allowed us to iden-tify repeatedly a series of very same cells and clusters, because of theirconstant position with respect to the grid photoetched on the coverslip.In this way, individual cells could be scored repeatedly for the presenceor absence of a hemolytic plaque.
Percent data, average areas of hemolytic plaques and total plaquedevelopment values were expressed as mean±SEMand were comparedusing a Student's unpaired t test.
ResultsFig. 1 shows part of a plaque assay chamber at the end of a30-min incubation in the presence of 16.7 mMglucose. Theindividual position of single cells and clusters can be deter-mined precisely, with respect to the letters and grid bars pho-toetched on the coverslip that formed the top of the assaychamber. As shown, the B cells that secreted insulin have be-come surrounded by a clear circular plaque of hemolysis,whereas other B cells that did not secrete detectable levels ofinsulin are still closely surrounded by a regular and dense car-pet of intact red blood cells. Comparison of photographs takenat the end of each of the successive test incubations showed thatislet cells were firmly attached to the floor of the chamber anddid not modify their position during the assay, as judged bytheir constant relationships with the numbers and letters of thechambers' top (Fig. 2). These chambers were therefore used toassess repeatedly the secretion of a number of very same B cellsduring successive glucose stimulations.
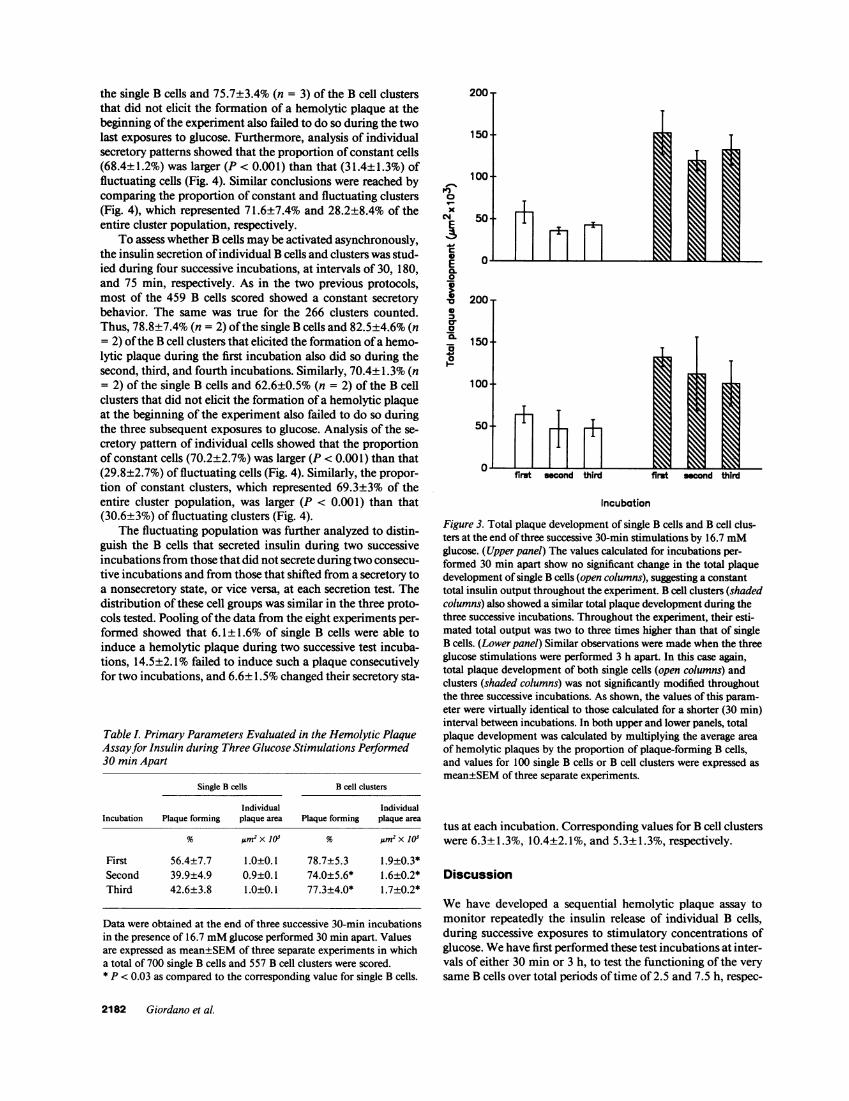
To this end, we evaluated the proportion of single B cellsand B cell clusters forming hemolytic plaques as well as theindividual areas of these plaques, two parameters that reflectthe number of secreting B cells and the amount of hormonethey released, respectively (10, 15). As shown in Table I, thevalues evaluated for single B cells did not change significantlybetween the first, second, and third incubation. The same wastrue for B cell clusters which gave values constantly higher (P< 0.03) than those evaluated for single B cells (Table I). Thetotal insulin output of single cells and clusters was estimated bymultiplying the values of the percentage of secreting cells andof the average hemolytic plaque area. As shown in Fig. 3, theresulting total plaque development of single B cells did notchange significantly between the three successive secretiontests. The same was true for B cell clusters which also secretedabout three times more (P < 0.03) than single B cells through-out the experiment (Fig. 3). This increase is consistent with theaverage size of clusters which, in these experiments, comprised2.8±0.1 (n = 8) B cells. The size distribution of clusters wassimilar from one experiment to another. Out of the 1,318 clus-ters that were scored, 52.5±3.7% comprised two B cells,26.8±1.9% three B cells, 1 1.6±1.9% four B cells, and 8.9±2.2%five B cells.
Whenthe secretory pattern of very same cells was analyzedrepeatedly, we found that whereas some B cells secretedthroughout the three incubations of each experiment, othersnever secreted detectable amounts of insulin' and others, even-
1. To assess whether these B cells were also insensitive to other secreta-gogues, preliminary experiments were performed by adding glucagonduring the third incubation. Under these conditions, we observed thatat least part of the B cells that did not secrete to a detectable level duringthe first two incubations in the presence of 16.7 mMglucose couldnevertheless release sizable amounts ofinsulin when subsequently stim-ulated by glucagon (E. Giordano, unpublished observation).
Secretion of Individual B Cells 2179

Figure 1. Low-magnification view of a plaque assay chamber after a 30-min stimulation by 16.7 mMglucose. The position of individual B cells (acouple of which are labeled a) and B cell clusters (a couple of which are labeled b) can be determined precisely with respect to the letters andgrid bars photoetched on the coverslip that forms the top of the chamber. Cells and clusters that have secreted insulin are surrounded by a he-molytic plaque which appears as a whitish round area within the dark grey carpet of intact red blood cells. Other islet cells (a couple of whichare circled) are not surrounded by a hemolytic plaque, an indication that they did not secrete detectable amounts of insulin, if they secreted atall. Scale bar, 100 ,m.
tually, secreted in only one or two of the three test incubations(Fig. 2). Scores showed that the majority of single cells andclusters retained throughout the experiment the secretory pat-tern they showed during the first incubation. Thus, 65.7±4.9%(n = 3) of the single B cells that secreted during the first incuba-tion were also stimulated by glucose during the two successivesecretion tests. In the same preparations, 91.8±0.2% of the Bcells that did not elicit the formation of a hemolytic plaqueduring the first incubation also failed to secrete detectableamounts of insulin during the last two incubations of the exper-iment. Corresponding values for B cell clusters were 90.9±0.9%and 78.3±5.0% (n = 3), respectively.
The B cells that secreted constantly represented 36.6±4.4%of the 700 single and viable B cells that could be followedthroughout the three successive glucose stimulations. The Bcells that failed constantly to induce the formation of a hemo-lytic plaque represented 39.8±6.9% of this same population.Pooling these two groups revealed that 76.5±8.8% of single Bcells showed a constant secretory pattern throughout the exper-iment, i.e., they were either repeatedly sensitive or repeatedlyinsensitive to glucose stimulation (Fig. 4). The proportion of
these "constant" cells was significantly (P < 0.001) higher thanthat (22.9±5.1%) of the remaining "fluctuating" B cells, thatshifted from a secreting to a non-secreting pattern from oneincubation to another (Fig. 4). Analogous observations weremade with the 557 B cell clusters that could be identified at theend of the three successive test incubations of each experiment.71.7±4.8% of these clusters secreted in each of these three incu-bations, whereas 16.2±2.4% never did so to a detectable level.Thus, the total proportion of clusters showing a constant secre-tion pattern (87.9±1.1%) was significantly (P < 0.001) largerthan that (1 1.7± 1. %) of clusters showing a changing secretoryresponse from one incubation to another (Fig. 4).
To assess whether these findings were dependent on theparticular protocol we had chosen (three glucose stimulations30 min apart) or could be reproduced within a different timeframe, we repeated the experiments, leaving a 3-h interval be-tween each of the three successive 30-min glucose stimulations.The primary data evaluated under these new experimentalconditions (Table II) showed that single B cells secreted in simi-lar proportions and to a same extent in each of the three succes-sive incubations. As a result, the total development of hemo-
2180 Giordano et al.
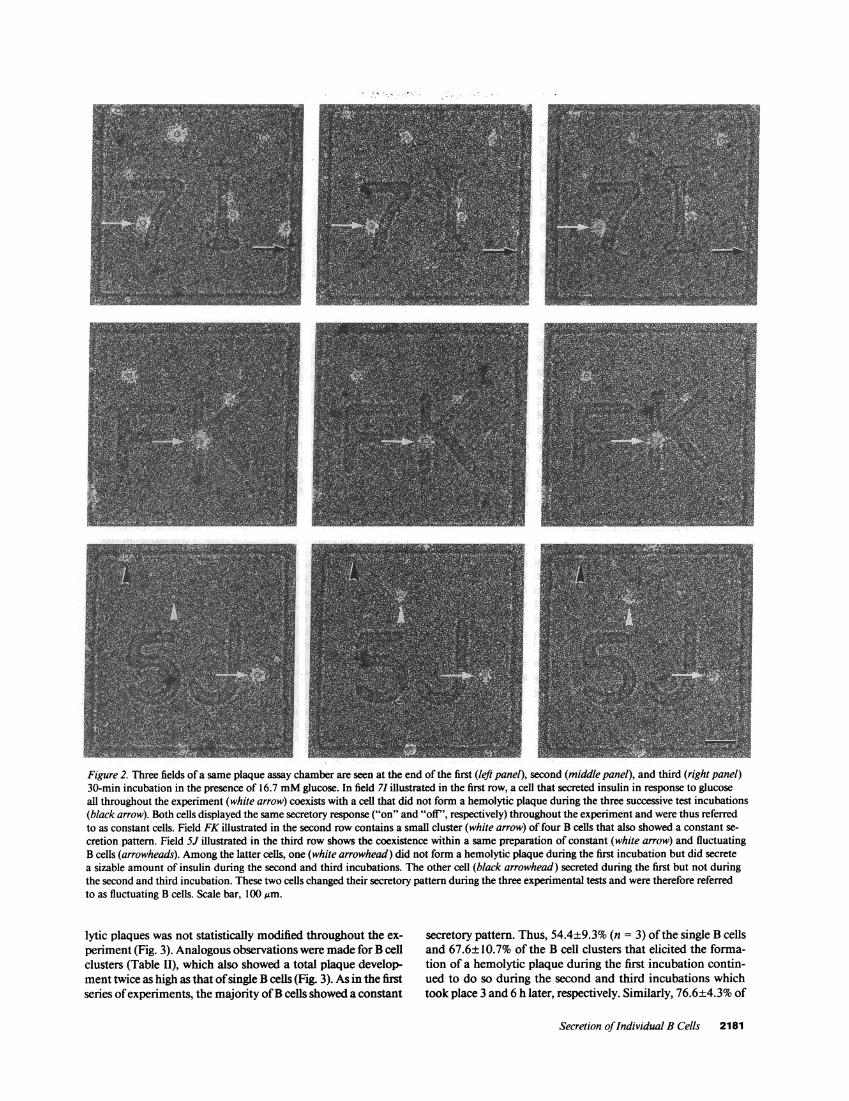
Figure 2. Three fields of a same plaque assay chamber are seen at the end of the first (left panel), second (middle panel), and third (right panel)30-min incubation in the presence of 16.7 mMglucose. In field 71 illustrated in the first row, a cell that secreted insulin in response to glucoseall throughout the experiment (white arrow) coexists with a cell that did not form a hemolytic plaque during the three successive test incubations(black arrow). Both cells displayed the same secretory response ("on" and "off", respectively) throughout the experiment and were thus referredto as constant cells. Field FK illustrated in the second row contains a small cluster (white arrow) of four B cells that also showed a constant se-cretion pattern. Field 5J illustrated in the third row shows the coexistence within a same preparation of constant (white arrow) and fluctuatingB cells (arrowheads). Amongthe latter cells, one (white arrowhead) did not form a hemolytic plaque during the first incubation but did secretea sizable amount of insulin during the second and third incubations. The other cell (black arrowhead) secreted during the first but not duringthe second and third incubation. These two cells changed their secretory pattern during the three experimental tests and were therefore referredto as fluctuating B cells. Scale bar, 100 ,m.
lytic plaques was not statistically modified throughout the ex-periment (Fig. 3). Analogous observations were made for B cellclusters (Table II), which also showed a total plaque -develop-ment twice as high as that of single B cells (Fig. 3). As in the firstseries of experiments, the majority of B cells showed a constant
secretory pattern. Thus, 54.4±9.3% (n = 3) of the single B cellsand 67.6±10.7% of the B cell clusters that elicited the forma-tion of a hemolytic plaque during the first incubation contin-ued to do so during the second and third incubations whichtook place 3 and 6 h later, respectively. Similarly, 76.6±4.3% of
Secretion of Individual B Cells 2181
the single B cells and 75.7±3.4% (n = 3) of the B cell clustersthat did not elicit the formation of a hemolytic plaque at thebeginning of the experiment also failed to do so during the twolast exposures to glucose. Furthermore, analysis of individualsecretory patterns showed that the proportion of constant cells(68.4±1.2%) was larger (P < 0.001) than that (31.4±1.3%) offluctuating cells (Fig. 4). Similar conclusions were reached bycomparing the proportion of constant and fluctuating clusters(Fig. 4), which represented 71.6±7.4% and 28.2±8.4% of theentire cluster population, respectively.
To assess whether B cells maybe activated asynchronously,the insulin secretion of individual B cells and clusters was stud-ied during four successive incubations, at intervals of 30, 180,and 75 min, respectively. As in the two previous protocols,most of the 459 B cells scored showed a constant secretorybehavior. The same was true for the 266 clusters counted.Thus, 78.8±7.4% (n = 2) of the single B cells and 82.5±4.6% (n= 2) of the B cell clusters that elicited the formation of a hemo-lytic plaque during the first incubation also did so during thesecond, third, and fourth incubations. Similarly, 70.4±1.3% (n= 2) of the single B cells and 62.6±0.5% (n = 2) of the B cellclusters that did not elicit the formation of a hemolytic plaqueat the beginning of the experiment also failed to do so duringthe three subsequent exposures to glucose. Analysis of the se-cretory pattern of individual cells showed that the proportionof constant cells (70.2±2.7%) was larger (P < 0.001) than that(29.8±2.7%) of fluctuating cells (Fig. 4). Similarly, the propor-tion of constant clusters, which represented 69.3±3% of theentire cluster population, was larger (P < 0.001) than that(30.6±3%) of fluctuating clusters (Fig. 4).
The fluctuating population was further analyzed to distin-guish the B cells that secreted insulin during two successiveincubations from those that did not secrete during two consecu-tive incubations and from those that shifted from a secretory toa nonsecretory state, or vice versa, at each secretion test. Thedistribution of these cell groups was similar in the three proto-cols tested. Pooling of the data from the eight experiments per-formed showed that 6.1±1.6% of single B cells were able toinduce a hemolytic plaque during two successive test incuba-tions, 14.5±2.1% failed to induce such a plaque consecutivelyfor two incubations, and 6.6±1.5% changed their secretory sta-
Table I. Primary Parameters Evaluated in the Hemolytic PlaqueAssayfor Insulin during Three Glucose Stimulations Performed30 min Apart
Single B cells B cell clusters
Individual IndividualIncubation Plaque forming plaque area Plaque forming plaque area
% LUM2axly %JUMm2XlO'
First 56.4±7.7 1.0±0.1 78.7±5.3 1.9±0.3*Second 39.9±4.9 0.9±0.1 74.0±5.6* 1.6±0.2*Third 42.6±3.8 1.0±0.1 77.3±4.0* 1.7±0.2*
Data were obtained at the end of three successive 30-min incubationsin the presence of 16.7 mMglucose performed 30 min apart. Valuesare expressed as mean±SEMof three separate experiments in whicha total of 700 single B cells and 557 B cell clusters were scored.* P < 0.03 as compared to the corresponding value for single B cells.
200
150
011
0.
-
x
.5
A0j
cs
0
CL0.
la
I-
100
50
150
100-
50
Incubation
Figure 3. Total plaque development of single B cells and B cell clus-ters at the end of three successive 30-min stimulations by 16.7 mMglucose. (Upper panel) The values calculated for incubations per-formed 30 min apart show no significant change in the total plaquedevelopment of single B cells (open columns), suggesting a constanttotal insulin output throughout the experiment. B cell clusters (shadedcolumns) also showed a similar total plaque development during thethree successive incubations. Throughout the experiment, their esti-mated total output was two to three times higher than that of singleB cells. (Lower panel) Similar observations were made when the threeglucose stimulations were performed 3 h apart. In this case again,total plaque development of both single cells (open columns) andclusters (shaded columns) was not significantly modified throughoutthe three successive incubations. As shown, the values of this param-eter were virtually identical to those calculated for a shorter (30 min)interval between incubations. In both upper and lower panels, totalplaque development was calculated by multiplying the average areaof hemolytic plaques by the proportion of plaque-forming B cells,and values for 100 single B cells or B cell clusters were expressed asmean±SEMof three separate experiments.
tus at each incubation. Corresponding values for B cell clusterswere 6.3±1.3%, 10.4+2. 1%, and 5.3±1.3%, respectively.
Discussion
We have developed a sequential hemolytic plaque assay tomonitor repeatedly the insulin release of individual B cells,during successive exposures to stimulatory concentrations ofglucose. Wehave first performed these test incubations at inter-vals of either 30 min or 3 h, to test the functioning of the verysame B cells over total periods of time of 2.5 and 7.5 h, respec-
2182 Giordano et al.

%1XT
75-
50-
25+rT
"constant" "fluctuating"
Figure 4. Proportion of single B cells and B cell clusters showing aconstant and a fluctuating secretory pattern during several successive30-min stimulations by 16.7 mMglucose. (Upper panel) The per-centage of single B cells (open columns) that either secreted or did notrelease detectable amounts of insulin during three successive incuba-tions performed 30 min apart ("constant" cells), was about four timeshigher (P < 0.03) than that of B cells that secreted during only oneor two of these incubations ("fluctuating" cells). The same observa-tion was made for B cell clusters (shaded columns). (Middle panel)The proportions of constant and fluctuating cells were not modifiedwhen three glucose stimulations were performed 3 h apart. In this caseagain, a majority of both single cells (open columns) and clusters(shaded columns) were attributed to the constant group, which wassignificantly (P < 0.03) larger than the fluctuating group. (Lowerpanel) The proportion of constant and fluctuating B cells remainedvirtually the same also during four glucose stimulations performedat intervals of 30, 180, and 75 min, respectively. With this time frametoo, most of the single B cells (open columns) and B cell clusters(shaded columns) were attributed to the constant group, which wassignificantly (P < 0.03) larger than the fluctuating group. Values wereexpressed as mean±SEMof two (lower panel) or three (upper andmiddle panels) separate experiments. Cells were attributed to theconstant group whenever they induced the development of a hemo-lytic plaque, or failed to do so, during all the successive incubations.By contrast, cells were attributed to the fluctuating group wheneverthey induced the formation of a hemolytic plaque in only some ofthe successive incubations.
Table II. Primary Parameters Evaluated in the Hemolytic PlaqueAssayfor Insulin during Three Glucose Stimulations Performed3 h Apart
Single B cells B cell clusters
Individual IndividualIncubation Plaque forming plaque area Plaque forming plaque area
% LaM2Xly %ai2XyiO
First 41.2±2.0 1.6±0.3 61.6±4.6* 2.2±0.1Second 34.1±11.3 1.3±0.2 53.1±12.2 2.0±0.3Third 39.3±4.0 1.2±0.1 54.2±8.5 1.8±0.2
Data were obtained at the end of three successive 30-min incubationsin the presence of 16.7 mMglucose performed 180 min apart. Valuesare expressed as mean±SEMof three separate experiments in whicha total of 550 single B cells and 495 B cell clusters were scored.* P < 0.01 as compared to the corresponding value for single B cells.
tively. Within these two time frames, we have found that thetotal development of hemolytic plaques, which is a reflection ofthe entire insulin output of a B cell population (14, 16), was notsignificantly modified from one incubation to another. Wehave also observed that, as previously reported (10-12, 14, 16),this unchanged total secretion was not contributed to a similarextent by each B cell but was actually the integrated result ofindividual secretory activities that differed markedly from oneB cell to another. Indeed, in all preparations, actively secretingB cells coexisted with apparently non-secreting B cells, and allintermediates were seen between these two extremes. This ap-parent heterogeneity,2 under conditions in which all B cells areexposed simultaneously to the same environment, could bedue to the asynchronous activation of functionally alike B cells,or to the existence of distinct B cell subpopulations differinglastingly in their ability to release insulin in response to glucose.
To distinguish between these possibilities, we have moni-tored repeatedly individual B cells, in order to determinewhether their secretory pattern changed in a random fashionfrom one incubation to another or, in contrast, remained thesame throughout the experiment. Wehave found that most ofthe B cells that secreted actively during the first incubationremained secretory active also during the two successive stimu-lations. Similarly, the B cells that did not release detectableamounts of insulin, if they secreted at all, during the first stimu-lation also failed to secrete appreciably during the rest of theexperiment. Together, the secreting and non-secreting B cellsthat showed a constant secretory pattern throughout the exper-iment, represented - 75% of the entire B cell population, i.e.,they were about three times more abundant than the B cellsthat turned from a secreting to a non-secreting state, or viceversa, from one incubation to another. The observation that"constant" B cells predominated "fluctuating" B cells in each
2. Virtually every (99±0.9%; n = 2) B cell pair selected by cell sortingfor glucose-activated metabolic redox response (9) forms a plaque ofiysis under the conditions used in this study (V. Cirulli, unpublisheddata). This preliminary finding suggests that the absence of hemolyticplaques around some B cells most likely reflects their highly variablelevels of insulin secretion rather than a methodological limit of theplaque assay.
Secretion of Individual B Cells 2183

experiment and under two experimental protocols (stimula-tion every 30 or 180 min) devised to test rather different timeframes argues against a random fluctuation of B cells betweenan active and an inactive secretory state, as would be expectedif all B cells were similarly sensitive to glucose but were releas-ing insulin asynchronously. To further dismiss such anasynchronous behavior, a protocol was designed to test B cellsduring a different time frame, including an interval which wasnot a multiple or a fraction of the intervals tested before. Again,in this protocol constant B cells predominated fluctuating Bcells. Irrespective of the protocol chosen, the three subcategor-ies of B cells that were distinguished in the fluctuating popula-tion were similarly represented from one experiment to an-other. These data suggest that a previous exposure to a stimula-tory level of glucose is not a prerequisite for a subsequentsugar-induced stimulation of insulin release, at least for a siz-able proportion of B cells. Although these data do not excludethe possibility that the threshold for glucose-induced insulinsecretion may be modulated at the level of individual B cells,they provide direct evidence that this threshold is not markedlylowered in the majority of B cells during repeated exposures tothe sugar.
Taken together, these data support the existence of B cellsubpopulations differing markedly in their ability to releaseinsulin and able to reproduce a given secretory pattern last-ingly, and during repeated challenges by their major naturalsecretagogue. This tentative conclusion raises questions as tothe factors that may modulate differentially the glucose sensitiv-ity of individual B cells. Insulin-producing cells have alreadybeen shown to differ in terms of threshold for glucose-stimu-lated electrical activity (4, 7, 8), protein biosynthesis (6, 17),metabolic redox state (9), and secretagogue-induced oscilla-tions of intracellular Ca2l concentrations (18). However,whether any of these apparently intrinsic biophysical and meta-bolic characteristics are related to, or may be even responsiblefor the differences we have observed in the secretory behaviorof individual B cells, remains to be established. It is also uncer-tain why some B cells appear unable to release insulin, at leastto any significant level, when properly and repeatedly stimu-lated by glucose. Wehave recently obtained evidence that theseB cells are equipped with the same glucose transporter (D. Bo-sco, unpublished observation) and ionic membrane channelsthan secreting B cells, and share with them the same secretago-gue-induced changes of major electrical conductances (19).These two observations suggest that at least the first steps of themechanism that normally couples the stimulus by glucose toinsulin secretion (20) are preserved in the B cells which cannotinduce the formation of a hemolytic plaque. That the more
distal steps of the secretory machinery of these cells can also beactivated is suggested by our preliminary observation that atleast some of these glucose-insensitive B cells can be induced toform an insulin-dependent hemolytic plaque when stimulatedby glucagon. Therefore, these cells appear to have a normalsecretory machinery which is not properly activated by glucose.
Contact-dependent cell interactions may play a role in thisdefect. Indeed, as in previous studies (10, 14, 16), we haveobserved that the proportion of B cell clusters secreting insulinis significantly larger than that of single B cells. Actually, thisproportion is larger than that which can be computed, assum-ing that B cells reaggregate at random and that contact has noinfluence on their individual secretory pattern. These observa-tions suggest that at least some of the single B cells that are
insensitive to glucose do recognize the sugar as a stimulus forinsulin release after contacting other B cells. Whatever the con-tact-dependent mechanism responsible for such an importantchange (10, 14, 16), it did not, however, permit to recruit all Bcells to secrete lastingly. Thus, at least in vitro, some function-ally intact B cells appear repeatedly unable to respond to glu-cose, including after they have become part of a cluster.
It remains to be established whether these in vitro findingshave any relevance for in vivo conditions. Wehave previouslyshown that, within individual islets of Langerhans, all B cellsdo not release insulin at the same rate during glucose infusion(5). Strikingly, the B cells located in the center of the isletsrelease insulin-containing secretory granules much faster thanthe B cells that are located at the islet periphery and that beganto degranulate only after the glucose infusion had been sus-tained for several hours (5). Whether these peripheral B cellscorrespond to the glucose-insensitive B cells detected in theplaque assay and, at any rate, what maybe their role in the isletcell community are presently two completely opened ques-tions.
In summary, we have shown that individual B cells differmarkedly in their ability to release insulin when challenged byglucose, and that these functional differences are maintainedsteadily during successive stimulations spanning variable pe-riods of time. As in other gland systems in which secretory cellshave been shown to be functionally heterogeneous (21-25), it ispossible that the existence of B cell subpopulations with con-stant but distinct functional characteristics may be of impor-tance to regulate precisely, in a graded and moment-to-mo-ment way, the amount insulin needed to be secreted in order tomatch the ever-changing requirements of the organism. To testthis hypothesis, an assessment of how the ratio of secreting tonon-secreting B cells may be affected under other experimentalconditions, such as after other time intervals and/or in the pres-ence of various concentrations of different secretagogues isnow required. The approach we report here now permits ad-dressing these questions.
Acknowledaments
Wethank L. Burkhardt, A. Charollais, S. De Mitri, J.-P. Gerber, L.Juliano, and P. Ruga for technical assistance.
This work was supported by grants 31-26625.89 and 3100-009394from the Swiss National Science Foundation, 187384 from the Juve-nile Diabetes Foundations International, and from the Sir Jules ThornCharitable Overseas Trust Rep., Schaan.
References1. Orci, L. 1974. A portrait ofthe pancreatic B-cell. Diabetologia. 10:163-187.2. Meda, P., J.-F. Denef, A. Perrelet, and L. Orci. 1980. Nonrandom distribu-
tion of gap junction between pancreatic B-cells. Am. J. Physiol. 238:C1 14-Cl 19.3. Michaels, R. L., and J. D. Sheridan. 1981. Islets of Langerhans: dye cou-
pling among immunocytochemically distinct cell types. Science (Wash. DC).2 14:801-803.
4. Beigelman, P. M., B. Ribalet, and I. Atwater. 1977. Electrical activity ofmouse pancreatic beta-cells. II. Effects of glucose and arginine. J. Physiol. (Paris).73:201-217.
5. Stefan, Y., P. Meda, M. Neufeld, and L. Orci. 1987. Stimulation of insulinsecretion reveals heterogeneity of pancreatic B cells in vivo. J. Clin. Invest.80:175-183.
6. Schuit, F. C., P. A. In 'T Veld, and D. G. Pipeleers. 1988. Glucose stimu-lates proinsulin biosynthesis by a dose-dependent recruitment of pancreatic betacells. Proc. NatL. Acad. Sci. USA. 85:3865-3869.
7. Meda, P., I. Atwater, A. Goncalves, A. Bangham, L. Orci, and E. Rojas.1984. The topography of electrical synchrony among B-cells in the mouse islet ofLangerhans. Q. J. Exp. Physiol. 69:719-735.
2184 Giordano et al.
8. Perez-Armendariz, E., I. Atwater, and E. Rojas. 1985. Glucose-inducedoscillatory changes in extracellular ionized potassium concentration in mouseislets of Langerhans. Biophys. J. 48:741-749.
9. Pipeleers, D., and M. Van de Winkel. 1989. Cellular endogenous fluores-cence: A basis for preparing subpopulations of functionally homogeneous cells.In Cell Structure and Function by Microspectrofluorometry. E. Kohen and J. G.Hirschberg, editors. Academic Press Inc. 391-404.
10. Salomon, D., and P. Meda. 1986. Heterogeneity and contact dependentregulation of hormone secretion by individual B cells. Exp. Cell Res. 162:507-520.
1 1. Hiriart, M., and R. Matteson. 1988. Na' channels and two types of Ca2lchannels in rat pancreatic B-cells identified with the reverse hemolytic plaqueassay. J. Gen. Physiol. 91:617-639.
12. Lewis, C. E., A. Clark, S. J. H. Ashcroft, G. J. S. Cooper, and J. F. Morns.1988. Calcitonine gene-related peptide and somatostatin inhibit insulin releasefrom individual rat B cells. Mol. Cell. Endocrinol. 57:41-49.
13. Wright, P. H., D. R. Makalu, and I. J. Posey. 1968. Guinea pig anti-insulinserum. Diabetes. 17:513-516.
14. Bosco, D., L. Orci, and P. Meda. 1989. Homologous but not heterologouscontact increases the insulin secretion of individual pancreatic B-cells. Exp. CellRes. 184:72-80.
15. Allaerts, W., A. Wouters, D. Van der Massen, A. Peerson, and C. Denef.1988. A diffusion-adsorption model for the computation of the amount of hor-mone around a secreting cell, detected by the reverse hemolytic plaque assay. J.Theor. Biot. 131:441-459.
16. Meda, P., D. Bosco, M. Chanson, E. Giordano, L. Vallar, C. Wollheim,and L. Orci. 1990. Rapid and reversible secretion changes during uncoupling ofrat insulin-producing cells. J. Clin. Invest. 86:759-768.
17. Meda, P., and D. Bosco. 1989. Actively synthesizing B-cells secrete prefer-entially after glucose stimulation. Diabetologia. 32:516a. (Abstr.)
18. Prentki, M., M. C. Glennon, A. P. Thomas, R. L. Morris, F. M. Mat-schinsky, and B. E. Corkey. 1988. Cell-specific patterns of oscillating free Ca2l incarbamylcholine-stimulated insulinoma cells. J. Biol. Chem. 263:11044-11047.
19. Soria, B., M. Chanson, and P. Meda. 1989. Glucose responsive and unre-sponsive B-cells show similar electrical characteristics. Diabetologia. 32:543A.(Abstr.)
20. Prentki, M., and F. M. Matschinsky. 1987. Ca2+, cAMP, and phospho-lipid-derived messengers in coupling mechanisms of insulin secretion. Physiol.Rev. 67:1185-1248.
21. Boockfor, F. R., J. P. Hoeffler, and L. S. Frawley. 1986. Analysis by plaqueassay ofGH and prolactin release from individual cells in cultures ofmale pituitar-ies. Neuroendocrinology. 42:64-70.
22. Keith, L. D., B. Tam, H. Ikeda, Z. Opsahl, and M. A. Greer. 1986. Dy-namics of thyrotropin-releasing hormone-induced thyrotropin and prolactin se-cretion by acutely dispersed rat adohypophyseal cells. Neuroendocrinology.43:445-452.
23. Lin, C.-T., W. Palmer, J.-Y. Wu, and L. Chan. 1986. Estrogen inductionof very low density apolipoprotein II synthesis, a major avian liver yolk protein,involves the recruitment of hepatocytes. Endocrinology. 118:538-551.
24. Studer, H., H. J. Peter, and H. Gerber. 1989. Natural heterogeneity ofthyroid cells: the basis for understanding thyroid function and nodular goitergrowth. Endocr. Rev. 10:125-135.
25. Boockfor, F. R., L. K. Schwarz, and F. C. Derrick III. 1989. Sertoli cells inculture are heterogeneus with respect to transfernin release: analysis by reversehemolytic plaque assay. Endocrinology. 125:1128-1133.
Secretion of Individual B Cells 2185