Embed Size (px)
Citation preview

University of Nebraska - LincolnDigitalCommons@University of Nebraska - Lincoln
USGS Staff -- Published Research US Geological Survey
2012
Remote Sensing of Evapotranspiration forOperational Drought Monitoring Using Principlesof Water and Energy BalanceGabriel B. SenayU.S. Geological Survey
Stefanie BohmsU.S. Geological Survey
James P. VerdinU.S. Geological Survey
Follow this and additional works at: http://digitalcommons.unl.edu/usgsstaffpub
Part of the Geology Commons, Oceanography and Atmospheric Sciences and MeteorologyCommons, Other Earth Sciences Commons, and the Other Environmental Sciences Commons
This Article is brought to you for free and open access by the US Geological Survey at DigitalCommons@University of Nebraska - Lincoln. It has beenaccepted for inclusion in USGS Staff -- Published Research by an authorized administrator of DigitalCommons@University of Nebraska - Lincoln.
Senay, Gabriel B.; Bohms, Stefanie; and Verdin, James P., "Remote Sensing of Evapotranspiration for Operational Drought MonitoringUsing Principles of Water and Energy Balance" (2012). USGS Staff -- Published Research. 979.http://digitalcommons.unl.edu/usgsstaffpub/979

Published in Remote Sensing of Drought: Innovative Monitoring Approaches, edited by Brian D. Wardlow, Martha C. Anderson, & James P. Verdin (CRC Press/Taylor & Francis, 2012).
This chapter is a U.S. government work and is not subject to copyright in the United States.
Authors:
Gabriel B. SenayEarth Resources Observation and Science CenterU.S. Geological SurveySioux Falls, South Dakota
Stefanie Bohms Earth Resources Observation and Science Center U.S. Geological Survey Sioux Falls, South Dakota
James P. VerdinEarth Resources Observation and Science CenterU.S. Geological SurveySioux Falls, South Dakota

123
6 Remote Sensing of Evapotranspiration for Operational Drought Monitoring Using Principles of Water and Energy Balance
Gabriel B. Senay, Stefanie Bohms, and James P. Verdin
CONTENTS
6.1 Introduction..................................................................................................1246.2 MaterialsandMethods.................................................................................124
6.2.1 DataRequirements........................................................................... 1256.2.1.1 PrecipitationData.............................................................. 1256.2.1.2 LandSurfacePhenologyData........................................... 1256.2.1.3 SoilData............................................................................. 1256.2.1.4 ReferenceET...................................................................... 1266.2.1.5 ThermalRemoteSensingData.......................................... 126
6.2.2 ModelDescriptions........................................................................... 1266.2.2.1 WaterBalanceModel:VegET........................................... 1266.2.2.2 EnergyBalanceModel:SSEB........................................... 1296.2.2.3 ComparisonofVegETandSSEB...................................... 132
6.2.3 ETaAnomalies.................................................................................. 1336.3 VegETandSSEBOutputovertheCONUS................................................. 134
6.3.1 CumulativeETa................................................................................. 1346.3.2 ETaAnomalies.................................................................................. 1356.3.3 CaseStudy:SeasonalETTimeSeries.............................................. 137
6.4 ApplicationsofVegETandSSEBfortheFamineEarlyWarning SystemNetwork............................................................................. 138
6.5 Conclusions................................................................................................... 141Acknowledgment................................................................................................... 142References.............................................................................................................. 142

124 Remote Sensing of Drought: Innovative Monitoring Approaches
6.1 INTRODUCTION
Evapotranspiration(ET)isanimportantcomponentofthehydrologicbudgetbecauseitreflectstheexchangeofmassandenergybetweenthesoil–water–vegetationsystemandtheatmosphere.PrevailingweatherconditionsinfluencepotentialorreferenceET through variables such as radiation, temperature, wind, and relativity humid-ity.Inadditiontotheseweathervariables,actualET(ETa)isalsoaffectedbylandcovertypeandcondition,aswellassoilmoisture.ThedependenceofETaonlandcoverandsoilmoisture,anditsdirectrelationshipwithcarbondioxideassimilationinplants,makes it an importantvariable formonitoringdrought, cropyield, andbiomass—acriticalcapabilityfordecisionmakersinterestedinfoodsecurity,grainmarkets,waterallocation,andcarbonsequestration(Bastiaanssenetal.,2005).
Because ET can be difficult to measure accurately, especially at large spatialscales, several different hydrologic modeling techniques have been developed toestimateETausingsatelliteremotesensing.Ingeneral,theETmodelingtechniquescanbegroupedintotwobroadclassesthatincludemodelsbasedonsurfaceenergybalance(e.g.,Bastiaanssenetal.,1998;Suetal.,2005;Allenetal.,2007;Andersonetal.,2007;Senayetal.,2007)andwaterbalance(e.g.,Allenetal.,1998,Senay,2008)principles.Whilewaterbalancemodelsfocusontrackingthepathwaysandmagnitudeofrainfallinthesoil–vegetationsystem,mostremotesensingenergybal-ancemodelsuselandsurfacetemperature(LST)asaprimaryconstraintinpartition-ingradiantenergyavailableatthesurfacebetweenheatandwaterfluxes.
This chapter describes two ET models representing each of these approaches:theVegetationET(VegET)waterbalancemodel(Senay,2008)andtheSimplifiedSurface Energy Balance (SSEB) approach (Senay et al., 2007, 2011a), comparingtheir utility for operational drought monitoring and agrohydrologic applications.BothmodelsusetheconceptofareferenceET(ETo)toestimatethepotentialET(ETp)expectedunderunlimitedwaterconditions,assuminganidealizedreferencecropwithstandardizedbulkandaerodynamicresistancefactorsforvaportransport.Themaindifferencebetweenthetwoapproachesisinthecalculationofacorrectionfactoraccountingforsoilmoistureimpactsonevaporation,estimatingETaasafrac-tionofETo.VegETusesavegetationwaterbudgetingapproachtotracksoilmoisturechanges,whereastheenergybalancemodelusesspatialvariationsinLST.
Bothmodelsweredesignedforglobaloperationalapplicationsandarethereforeintentionallysimplifiedintheirrepresentationofsurfacephenomenaandmodestintheirinputdatarequirements—basedonlyonreadilyavailableremotesensingdata.Thesimplifiedapproachesfacilitatereal-timeimplementationindata-limitedpartsoftheworld,providingtimelyinformationforoperationaldroughtandfoodsecurityanalyseswithminimalmanualinterventionandexpertguidance.
6.2 MATERIALS AND METHODS
Hereweprovide abrief introduction to theVegETandSSEBETmodeling algo-rithms.Thetwoapproacheseachhavetheirownmeritsandlimitations,andtheycanbeusedindependentlyorincombination.Thechoiceofmodeldependsontheavail-abilityofdataandtheobjectiveoftheproject.BothmethodsrequireanETodataset,

125Remote Sensing of Evapotranspiration for Operational Drought Monitoring
whichcanbegeneratedusingmeteorologicaldata(netradiation,temperature,windspeed,relativehumidity,andairpressure).Inaddition,theavailabilityofrainfallandlandsurfacephenology (LSP)data iscritical for theVegETwaterbalancemodel,whiletheSSEBenergybalanceapproachrequiresLSTinformationretrievedfromthermal infrared satellitedata.Thesedifferences indata inputsare importantanddefine the applications and constraints that apply to each modeling approach. Forexample,thepresenceofcloudcoveradverselyaffectstheSSEBmodelbecauseLSTcannotberetrievedundercloudyconditionsusingthermalimaging.Incontrast,theVegETmodeldoesnotusethermaldataandislessaffectedbycloudcover,whichcanbeasignificantadvantageduringthegrowingseasoninmanypartsoftheworld.Ontheotherhand,VegETconsidersonlyrain-fedwaterinputstothelandsurfacesys-tem,whereastheLSTinputstoSSEBprovidediagnosticinformationaboutmoistureinputsfromallsources,includingirrigationandshallowwatertables.Anotheradvan-tageoftheSSEBapproachisthatitdoesnotrequireprecipitationdataandthusislesspronetoerrorsassociatedwiththequalityoftheavailableprecipitationdatasets.
6.2.1 Data RequiRements
Tofacilitateglobalapplications,boththeSSEBandVegETmodelingsystemshavebeendesignedtousereadilyavailableglobalremotesensingandweatherdatasets.Inputdatarequirementsbyeachmodel,andrationalethereof,aredescribedinthefollowing.
6.2.1.1 Precipitation DataPrecipitationisakeydriverofthewaterbalanceVegETmodel.Acombinationofcoarse(25kmfor1996–2004)andfiner(5kmfor2005tocurrent)spatialresolutiondailytotalrainfalldatafromtheNationalOceanicandAtmosphericAdministration(NOAA) National Weather Service (NWS) (http://www.srh.noaa.gov/rfcshare/precip_about.php)isbeingusedbasedondataavailability.BothprecipitationdatasetsyieldcomparableseasonalETaestimatesfromVegET(datanotshown).SpatialresolutionofETaoutputfromVegETisnotsignificantlylimitedbytheinputprecipi-tationdatasetbutratherbythescaleoftheLSPdatausedinthemodel.Furthermore,rainfallisrelativelyhomogeneousatthesubwatershedscalewhenaggregatedovermonthlyorlongertimescales.
6.2.1.2 Land Surface Phenology DataAsdescribedinthefollowing,LSPparametersusedinVegETaredefinedusingatimeseriesof1kmNormalizedDifferenceVegetationIndex(NDVI)dataderivedfrom the NOAA Advanced Very High Resolution Radiometer (AVHRR) satelliteimageryfortheperiodof1989–2004(Eidenshink,1990).ThesedatasetshavebeennormalizedovermultipleAVHRRinstruments.
6.2.1.3 Soil DataSoilwaterholdingcapacity,usedinVegET,isderivedfromtheStateSoilGeographicDatabase (STATSGO) (http://www.ncgc.nrcs.usda.gov/products/datasets/statsgo/)fortheUnitedStates,whiledatafromtheFoodandAgricultureOrganization(FAO)DigitalSoilsMapoftheWorldareusedforglobalapplications.
126 Remote Sensing of Drought: Innovative Monitoring Approaches
6.2.1.4 Reference ETOverthecontinentalUnitedStates(CONUS),theETodatausedbybothVegETandSSEBareproducedatadailytimestepasdescribedbySenayetal.(2008)usingthestandardizedPenman-Monteithequation(Allenetal.,1998).Global,sixhourlyweatherdatasetsofnetradiation,wind,relativehumidity,andairtemperatureandpressurefromtheGlobalDataAssimilationSystem(GDAS)(Kanamitsu,1989)areusedtogenerateaglobaldailyEToat1°spatialresolution.
6.2.1.5 Thermal Remote Sensing DataTheSSEBenergybalancealgorithmismainlydrivenbyLSTderivedfromthermalbandobservationsacquiredbytheModerateResolutionImagingSpectroradiometer(MODIS). Day-time, 8 day average LST tiles at 1km resolution from the NASATerraplatform(MOD11A2),acquiredfromMarch2000topresent,havebeendown-loadedfromtheLPDAAC(LandProcessesDataActiveArchiveCenter)andrepro-jectedandmosaickedusingtheMODISreprojectiontool.AlthoughinstantaneousLSTdataretrievals(e.g.,fromtheMOD11_L2swathproduct)aretechnicallymoreappropriateforapplicationofSSEBalgorithms,the8daycompositeproductisusedheretoreducecomputationalanddatademandsforoperationalglobalapplications.Furthermore,useofthe8dayproductreducesdatagapscausedbycloudcontamina-tion.RamificationsofusingtheMODIS8dayLSTproductarediscussedfurtherinSection6.2.2.2.
6.2.2 moDel DescRiptions
6.2.2.1 Water Balance Model: VegETTheVegETapproachisbasedonthemostwidelyusedwaterbalancetechniqueforoperationalcropperformancemonitoring:theFoodandAgriculturalOrganization(FAO) algorithm for computing the crop Water Requirement Satisfaction Index(WRSI; FAO, 1986). The WRSI reflects the relative relationship (ratio/percent)betweenwatersupply(fromrainfallandexistingsoilmoisture)anddemand(croptranspirationdemandtomeetitsphysiologicalneeds)usingobserveddatafromthebeginningofthecropseason(planting)untilthecurrentdate.WRSIiscalculatedastheratio(orpercentage)betweentheseasonalETandtheseasonalwaterrequirementofthecrop.TheseasonaltotalwaterrequirementiscalculatedastheETpadjustedbyacropcoefficient(Kc),whichvariesbycroptypeandphenologicalstage.Kcgen-erallyvariesbetween0.3and1.2formostcerealcropsduringthegrowingseason(FAO,1998).
The Famine Early Warning System Network (FEWS NET) demonstrated aregionalimplementationoftheFAOWRSIoveramodelingdomaininsouthernAfrica(VerdinandKlaver,2002).SenayandVerdin(2003)furtherenhancedthegeospatialmodelby introducing theconceptofMaximumAllowableDepletion(MAD)andasoilwaterstressfactorfromirrigationengineeringforbetterestima-tionofETaasafunctionofsoilwatercontent.TheSenayandVerdin(2003)versionofthemodelhasbeenoperationalsince2000,withdailyand10dayoutputsforAfrica,CentralAmerica,andAfghanistanat0.1°(∼10km)resolution.Graphicsofmodeloutputarepostedoperationallyathttp://earlywarning.usgs.gov/fews/.

127Remote Sensing of Evapotranspiration for Operational Drought Monitoring
BuildingontheWRSIconcept,theVegETmodelingstrategy(Senay,2008)wasrecentlydevelopedforestimatingETainnonirrigatedcroplandandgrasslandenvi-ronments as anenhancement to theU.S.GeologicalSurvey (USGS)/FEWSNETcropwaterbalancemodel(SenayandVerdin,2003).VegETblendsconceptsfromirrigationengineeringwitharemotesensingdatastreamtoestimateETaquicklyatlowcomputationalanddatacostsforsitesanywhereintheworld.Figure6.1showsaschematicrepresentationoftheVegETmodelingframework.
Akeyinnovationin theVegETmodel is the inclusionof theLSPparameter,whichdescribestheseasonalprogressionofvegetationgrowthanddevelopment.The LSP allows the VegET model to be location (pixel)-specific, accommodat-inglocalizedvariationsinvegetationgrowthpatterns,ascomparedtotheregion-specific Kc function used in traditional agrohydrologic modeling. LSP can beobservedbyspacebornesensorsandisakeybiophysicalparameterthatlinksthewater and carbon cycles with anthropogenic activities, providing an importantapproachtochangedetectioninterrestrialecosystems(e.g.,Gowardetal.,1985;Reedetal.,1994;Tuckeretal.,2001;deBeursandHenebry,2005).IntegrationofLSPinformationintoaphenology-basedcropcoefficient(Kcp)isdescribedlaterinthissection.
VegETmonitorssoilwaterlevelsintherootzonethroughadaily(orlongertimestep)waterbalancealgorithmandestimatesETainrain-fedcroplandandgrasslandenvironments.Key inputdata toVegETareprecipitation,ETo, soilwaterholdingcapacity,andLSP.ETa(inunitsofmm/day)iscalculatedastheproductoftheETo(mm/day),asoilmoisturestresscoefficient(Ks),andaphenology-basedwater-usecoefficient(Kcp),asshowninEquation6.1(Senay,2008):
ET K Ka s cp= ∗ ∗ETo (6.1)
PPT ETο
NDVI(LSP) Kcmin
Kcmax Waterbalancemodel
Runo�
KsKcp
ETa = Kcp * Ks * ETo
FIGURE 6.1 SimplifiedconceptualdiagramoftheVegETmodel.Majorinputsareprecipi-tation(PPT),referenceET(ETo),andNDVI.Estimatedparametersareaphenology-basedcropcoefficient(Kcp)andasoil-waterstressfactor(Ks).ModeloutputsareETaandrunoff.

128 Remote Sensing of Drought: Innovative Monitoring Approaches
TheKsparameter isdeterminedfromavegetation–soil–waterbalancemodelandhasavaluebetween0(drysoil)and1(moistsoil).Thewaterbalancemodelworkswithadailysoilmoistureaccountingprocedureoverasoilbucketthatisdefinedbythewaterholdingcapacityofthesoilonagrid-cellbasis.TheLSPcoefficient(Kcp)iscomparabletotheKcwidelyusedbyagronomists(Allenetal.,1998)butincludesanLSPdependencederivedfromremotelysensedtimeseriesofNDVI(Senay,2008).Kcprepresentsboththespatialandtemporaldynamicsof thelandscapewater-usepatternsonagrid-cell (orpixel)basis.TheKcpparameter isscaledbetweenpub-lishedcropcoefficientminimum(Kcmin)andmaximum(Kcmax)valuesbasedoncur-rentandclimatologicalNDVIdata:
K
Kc KcNDVI NDVI
NDVI NDVIcpmax min
max mini o= −
−−*( ) (6.2)
whereKcmaxisthemaximum(mature)Kcvalueforaparticularvegetation/croptypeKcministheminimum(earlystage)KcvalueNDVImin and NDVImax are the climatological minimum and maximum NDVI
valuesinayear,respectivelyNDVIiistheclimatologicalNDVIvalueforagivenperiod“i”(averageweekly
maximumvalueinthiscase)NDVIoistheminimumreferenceNDVIvaluethatisassociatedwiththemini-
mumKcvalue
ThecalculationofNDVIodependson theNDVImax specifiedateachpixeland isdeterminedusingoneoftwofollowingcases:
CaseI:IfNDVImax>=0.40,then
NDVI 3o = 0. (6.3)
CaseII:IfNDVImax<0.40,then
NDVI 33 NDVI NDVI NDVIo max min min= ∗ − +0. ( ) (6.4)
Equations6.3and6.4wereformulated tohandlesparselyvegetatedsemiaridandarid regions differently from well-vegetated areas. Even a low maximum NDVIregionwillshowawater-usephenologyifitisrescaleddifferentlyinrelationtoitsownminimumratherthanthe“global”minimumofNDVI=0.3.OtherresearchershaveusedadifferentformulationtoestimateKcvaluesorcomparablecoefficientsfromNDVI(e.g.,Nagleretal.,2005;Groeneveldetal.,2007;Allenetal.,2011)forthesamepurposeofestimatingETa.
AmajorassumptioninthespecificationofKcpisthattherehavebeennomajorclimate or land cover changes over the remote sensing data record to affect thewater-use dynamics of a given individual modeling cell (or pixel) as represented

129Remote Sensing of Evapotranspiration for Operational Drought Monitoring
by theLSP.This limits theutilityofVegET(with thecurrentsetup) formonitor-inghighlymanagedlandscapessuchasirrigatedagricultureandurban/ruralfringeareas.However,withamodificationofthewaterbalancecomponentofthemodel,currentNDVIvaluesarestillcapableofestimatingETfromirrigatedlands,asisdemonstratedbyNagleretal.(2005).
For operational monitoring over the United States, the VegET model is runat 10km spatial resolution (chosen to reduce computational time for a regionalapplication) with operational products updated and posted daily at 7:00 pm(http://earlywarning.usgs.gov/usewem/swi.php). The operational products focus onthegrowingseasonperiod,definedasApril1–October31.
6.2.2.2 Energy Balance Model: SSEBSurfaceenergybalancemethodshavebeensuccessfullyappliedbyseveralresearch-ers (Bastiaanssenetal.,1998;Suetal.,2005;Allenetal.,2007;Andersonetal.,2007)toestimatecropwateruseinirrigatedareasandacrossthegenerallandscape.Theapproachtakeninthesemodelsrequiressolutionoftheenergybalanceequationatthelandsurface(Equation6.5),computingthelatentheatflux(ETaconvertedintounitsofenergy,W/m2,asaresidual):
λE R G Hn= − − (6.5)
whereλEisthelatentheatflux(energyconsumedbyET;W/m2)Rnisthenetradiationatthesurface(W/m2)Gisthegroundheatflux(energystoredinthesoilandvegetation;W/m2)Histhesensibleheatflux(energyusedtoheattheair;W/m2)
MostthermalenergybalancealgorithmsintendedforoperationalETmonitoringhavebeenexplicitlydesignedtominimizesensitivitytoerrorsintheabsolutecalibra-tionandatmosphericcorrectionoftheLSTdata.Allenetal.(2007)describeasur-faceenergybalancemethodthatemploysthehot(dry)andcold(wet)pixelapproachofBastiaanssenetal.(1998)intheSEBAL(SurfaceEnergyBalanceAlgorithmfortheLand)model,constrainingETaestimatesbetweenreasonableboundsasdefinedattheseend-memberpixels.Assuch,thesemethodsdonotrequireabsoluteaccuracyinLSTbutonlyrelativeaccuracyinvariabilityacrossthescene.Fornetradiation,SEBALrequiresmeteorologicaldataon incomingradiation,alongwith theasso-ciatedsurfacealbedoandemissivityrequired tocomputeoutgoingradiation.Thegroundheatfluxisestimatedusingremotesensingestimatesofsurfacetemperature,albedo,andNDVI,whilethesensibleheatfluxisestimatedasafunctionoftempera-turegradientabovethesurface,surfaceroughness,andwindspeed.
AlthoughthefullenergybalanceapproachemployedinSEBALhasbeenshowntogivegood results inmanypartsof theworld (Bastiaanssenet al.,2005),well-trained operators are required to perform the selection of hot/cold end-memberpixels,andinputdatarequirementscanbeprohibitive,especiallyoverlarge,data-sparseregions.Asanalternative,theSSEBapproachwasdevelopedatUSGSEarth
130 Remote Sensing of Drought: Innovative Monitoring Approaches
Resources Observation and Science (EROS) Center for operational application(Senayetal.,2007,2011a).
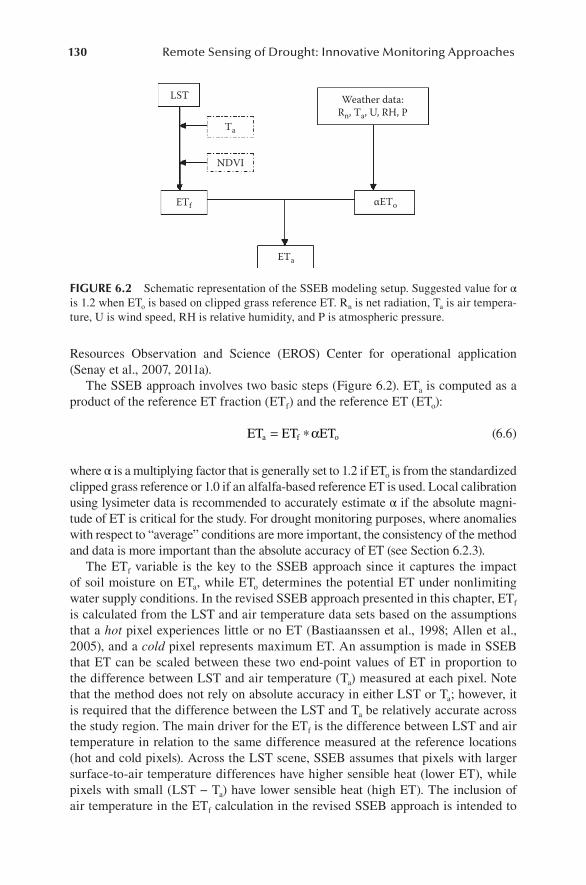
TheSSEBapproachinvolvestwobasicsteps(Figure6.2).ETaiscomputedasaproductofthereferenceETfraction(ETf)andthereferenceET(ETo):
ET ET ETa f o= ∗α (6.6)
whereαisamultiplyingfactorthatisgenerallysetto1.2ifEToisfromthestandardizedclippedgrassreferenceor1.0ifanalfalfa-basedreferenceETisused.Localcalibrationusinglysimeterdataisrecommendedtoaccuratelyestimateαiftheabsolutemagni-tudeofETiscriticalforthestudy.Fordroughtmonitoringpurposes,whereanomalieswithrespectto“average”conditionsaremoreimportant,theconsistencyofthemethodanddataismoreimportantthantheabsoluteaccuracyofET(see Section6.2.3).
TheETfvariable is thekeyto theSSEBapproachsince itcaptures the impactofsoilmoistureonETa,whileETodeterminesthepotentialETundernonlimitingwatersupplyconditions.IntherevisedSSEBapproachpresentedinthischapter,ETfiscalculatedfromtheLSTandairtemperaturedatasetsbasedontheassumptionsthatahotpixelexperienceslittleornoET(Bastiaanssenetal.,1998;Allenetal.,2005),andacoldpixelrepresentsmaximumET.AnassumptionismadeinSSEBthatETcanbescaledbetween these twoend-pointvaluesofETinproportion tothedifferencebetweenLSTandairtemperature(Ta)measuredateachpixel.NotethatthemethoddoesnotrelyonabsoluteaccuracyineitherLSTorTa;however,itisrequiredthatthedifferencebetweentheLSTandTaberelativelyaccurateacrossthestudyregion.ThemaindriverfortheETfisthedifferencebetweenLSTandairtemperatureinrelationtothesamedifferencemeasuredatthereferencelocations(hotandcoldpixels).AcrosstheLSTscene,SSEBassumesthatpixelswithlargersurface-to-airtemperaturedifferenceshavehighersensibleheat(lowerET),whilepixelswithsmall(LST−Ta)havelowersensibleheat(highET).TheinclusionofairtemperatureintheETfcalculationintherevisedSSEBapproachisintendedto
LST
Ta
NDVI
ETf
ETa
αETο
Weather data:Rn, Ta, U, RH, P
FIGURE 6.2 SchematicrepresentationoftheSSEBmodelingsetup.Suggestedvalueforαis1.2whenEToisbasedonclippedgrassreferenceET.Rnisnetradiation,Taisairtempera-ture,Uiswindspeed,RHisrelativehumidity,andPisatmosphericpressure.

131Remote Sensing of Evapotranspiration for Operational Drought Monitoring
facilitatecontinentalapplicationoftheSSEBapproach,reducingtheneedtoselectmultipleend-memberLSTpairsacrossthecontinentindifferentclimaticregions,whichisatypicalrequirementforhot-coldpixelapproaches.
ThehotpixelsareselectedusinganNDVIimageasaguidetoidentifytheloca-tions of dry and nonvegetated (or sparsely vegetated) areas that exhibit very lowNDVIvalues.Similarly,thecoldpixelsareselectedfromwell-watered,healthy,andfullyvegetatedareasthathaveveryhighNDVIvalues.TheETfraction(ETf,x) iscalculatedforeachpixel“x”as
ET
dT dTdT dT
f,xh x
h c
= −−
(6.7)
wheredThisthedifferencebetweensurfacetemperature(Ts)andairtemperature(Ta)
atthehotpixeldTcisthedifferencebetweenTsandTaatthecoldpixeldTxisthedifferencebetweenTsandTaatagivenpixel“x”
Themethodissensitivetotheselectionofhotandcoldpixels,andcautionshouldbetakeninselectingthesereferencepoints.Thecoldpixelcanbeawaterbodyorwell-watereddensevegetation,preferablywithanNDVIvaluegreaterthanorequalto0.7.Sincetheenergybalancepartitioningofawaterbodyisdifferentfromalandsurface,awaterbodymaybecolder(iffedfromsnowmelt)orwarmer(iffedfromageothermalsource)thanmostdensevegetation,butthiswillonlybringasystematicbiasthatcanbecorrectedbycheckingagainsttheLSTfromawell-wateredvegeta-tioninthesameareaandseason.ThemainadvantageofawaterbodyisthatitisgenerallyavailablemuchoftheyearexceptthewinterseasonofsomeregionswhenETislow.Thisprovidesanadvantageovertherelativelyshortseasonofdenseveg-etation.However,itisimportanttoremainconsistentinthechoiceofthecoldandhotpixelsduringthedifferentpartsoftheyear(i.e.,ifacoldpixelischosenfromawaterbody,itisadvisabletoselectthesamewaterbodyovertime).Thesameprincipleappliestothehotpixel.Inalargeimagescene,itisadvisabletoselectthehotpixelsfromnonirrigatedperpetuallybareareas,withanNDVIvalue<0.2.
ForthisstudyovertheCONUS,TsisobtainedfromtheMODIS8dayLSTprod-uct,whileTaisassignedfromthemonthlymaximumairtemperature(generallymea-suredataround1.5mabovegroundlevel)fromthePRISM(Parameter–ElevationRegressions on Independent Slopes Model; PRISM, 2011) data set, selecting themonthly interval closest to the8day time period corresponding to theLST dataset.Eight-dayEToiscomputedfromdailyGDASETooutput(Senayetal.,2008).Themodelisrunat8daytimeincrementsovertheperiodofrecord.Inthischapter,onlyseasonalproductsfromAprilthroughOctoberarediscussedbecauseoftheirrelevanceforseason-integrateddroughtmonitoring.Atemporallydynamicsetofhotandcoldpixelsselectedfromrepresentativelocations(coldgenerallyfromthesoutheastUnitedStates[wetterarea]andhotpixels[dryareas]inthewesternHighPlainsoftheUnitedStates)hasbeenusedontheentireCONUSdataset.Itshould

132 Remote Sensing of Drought: Innovative Monitoring Approaches
benotedthatalthoughthehotandcoldpixelsareconsistentinspace,theLSTvaluesgenerallyvaryfromseasontoseason,soweprepareauniquesetofhotandcoldpixelsforeachperiodfromthesameregionorlocationthatmeetstherequirements.WhatisuniqueinthisapproachistheuseofasinglesetofhotandcoldpixelstoscaleacrosstheCONUSforeach8dayperiod.
Anumberofsimplificationsregardingrepresentationofland–atmosphereexchangeareimplicitintheSSEBalgorithm,andthesewarrantsomediscussion.First,unlikeSEBALorMETRICandmostthermalETmodels,afullenergybalanceisnotcom-putedwithinSSEB.Rather,ETf isscaleddirectlyininverseproportiontoTs−Ta,whileotherenergybalancecomponentsarenotassessed.Thisscalingneglectstheeffectsofvariablesurfaceroughnessandgroundheatfluxacrossthelandscapeonthesurfaceenergybalance.Also,theuseofthe8dayLSTcompositescanintroduceerrorsintothemethodology,becausevariouspixelsinthescenemaybesampledondifferentdaysunderdifferentatmosphericandsurfacemoistureconditions.Finally,localairtemperaturecanbeverydifferentfromTainterpolatedbetweenstationdata(asinthePRISMdataset),andthiswilladduncertaintytotheETestimates.
ThisSSEBmethodisexperimentalandrequiresfurtherevaluationunderarangeofconditions;however,preliminaryassessmentsareencouraging—particularlyforlong-termseasonalETestimates.Gowdaetal.(2009)evaluatedtheperformanceoftheSSEBusinglysimeterdatainnorthwestTexasandfoundthatitexplained84%ofthelysimeterETvariation,withameanbiasof−0.6mm/day,usingpooleddatasetsfromirrigatedandrain-fedagriculturalsystemswithcornandsorghumfieldsovera2yearstudy(2006–2007).Recently,Senayetal.(2011b)evaluatedtheSSEBETovertheCONUSusinganHUC-8(HydrologicUnitCode)levelwaterbalanceapproach.Theannualdifferencesbetweenprecipitation(P)andrunoff(Q)at1,399HUC-8levelwatershedswerecompared toannualSSEBETestimateswithanr2of0.90andameanbiasof−67mmor−11%of thedifferencebetweenobservedPandQ.TheSSEBETshowsageneralunderestimation in the lowerET region(ET<600mm)comparedtohigherETzones.Moreimportantly,thehighr2(0.90)demonstrates the precision and reliability of the approach in diverse ecosystems,especiallywhenusedasananomalyproduct.
Becausethismethodisintendedforeasyimplementationforlarge-areamonitor-ingbynonexperts,asimplifiedapproachwithminimaldatarequirementsisdesired.Additionally,theETanomaliesusedfordroughtmonitoring(seethefollowing)areless sensitive to errors in the simplifiedmodeling approach than are the absolutemagnitudesofET.Inthiscontext,SSEBcanbeconsideredasanindexdescribingrelativechangesinEToverthesatelliteperiodofrecord.
6.2.2.3 Comparison of VegET and SSEBTable 6.1 summarizes differences between the VegET and SSEB modelingapproachesintermsofinputandoutputdatacharacteristics.OperationalVegEToutput is currently produced over the CONUS on a daily basis, while SSEB-based ETa for the CONUS is updated on an 8 day basis since the summer of2011(http://earlywarning.usgs.gov/usewem/eta_energy.php).HistoricalmonthlySSEB ET outputs are currently available from 2000 to 2009 for the CONUSandarebeingvalidatedusingfluxandwaterbalancemodeloutputs.Inaddition,

133Remote Sensing of Evapotranspiration for Operational Drought Monitoring
initialresultsforAfricaandriverbasinsincentralAsiaareshowingpromisingresults(UNEP,2010;Senayetal.,2007).Applicationsforbothapproachesarepresentedlaterinthischapter.
6.2.3 eta anomalies
Fordroughtmonitoring,indicatorsaretypicallyformulatedintermsofamonthlytoseasonalanomaly,representingdeviationsofcurrentconditionswithrespect to“normal” or “average” historical conditions for that time period. This is becauseanomalies (wetterordrier thanusual) are easier tounderstandandmeasure thanare absolute quantities (e.g., rainfall or ET in mm). Anomaly information is alsomorerelevantfordecisionmakersbecauseitprovidesahistoricalcontextforhowcurrentconditionscomparetoconditionsfrompreviousyears.Inaddition,impactsofmodelassumptions,formulationerrors,andbiasesininputdataarereducedinanomalyproducts.Themainreasonforthisisthatthestatisticalnatureofanomaly
TABLE 6.1Modeling and Data Characteristics of VegET and SSEB
VegET SSEB
Modelingapproach Waterbalance Energybalance
Targetmonitored/output ETa,soilmoisture,runoff ETa
Spatialresolution LimitedbyLSPdata Limitedbythermaldata
MODIS:250m (MODIS/AVHRR:1km)
AVHRR:1km Landsat:∼100m(localapplication)
Spatialextent Global(potentially) Global(potentially)
Frequencyofproduct Daily 8-day,dailyispossible
Delay 1day About2weeksforMODIS
Periodofrecord Limitedbyrainfalldata Limitedbythermaldata
1996–current:NexRad/StationBlend
AVHRR:1989–currentMODIS:2000–current
1979–current:GPCP(GlobalPrecipitationClimatologyProject)
Webaccess VegETmodeloutputisonlineathttp://earlywarning.usgs.gov/usewem/swi.php
ETaanomalyonlineAfrica:http://earlywarning.usgs.gov/fews/africa/index.php
CONUS:http://earlywarning.usgs.gov/usewem/eta_energy.php
Geographicprojection Latitude–longitude Latitude–longitude
GISenvironment Yes Yes
Descriptionofproduct Appropriateforrain-fedagricultureorgrasslandenvironments
Bestappliedtoirrigatedsystems
Challenge/limitationforoperationalimplementation
Nomajorlimitationisanticipated
Cloudcoverandlackofclimaticrecord

134 Remote Sensing of Drought: Innovative Monitoring Approaches
calculationcancelsmultiplicativeerrors (e.g.,due tomodel formulationand inputdatabiases)thatappearinboththenumeratoranddenominatorinEquation6.8.
Inthisstudy,seasonalETaanomalieswerecalculatedovertheCONUSforbothVegETandSSEBbasedonthemedianoftheseasonal(April1–October31)totalETfrom2000to2009(dataavailableyears)as
ET ano
ET _yearET _median
aa
a
_ = ∗100 (6.8)
whereETa_anoistheETaanomalyforagivenyearinpercentETa_yearistheseasonalETatotalforagivenyearETa_medianisthemedianseasonalETafrom2000to2009
Althoughanomaliescanbecalculatedatdifferenttimescales,thischapterfocusesonseasonal timescales tohighlight theutilityofanomalyproducts forassessingagriculturaldroughtimpacts,whicharegenerallyfeltataseasonaltimescale.AnexampleofaninternationaloperationalETaanomalyproductforAfricausingtheSSEBmodelispresentedlaterinthechapter.
6.3 VegET AND SSEB OUTPUT OVER THE CONUS
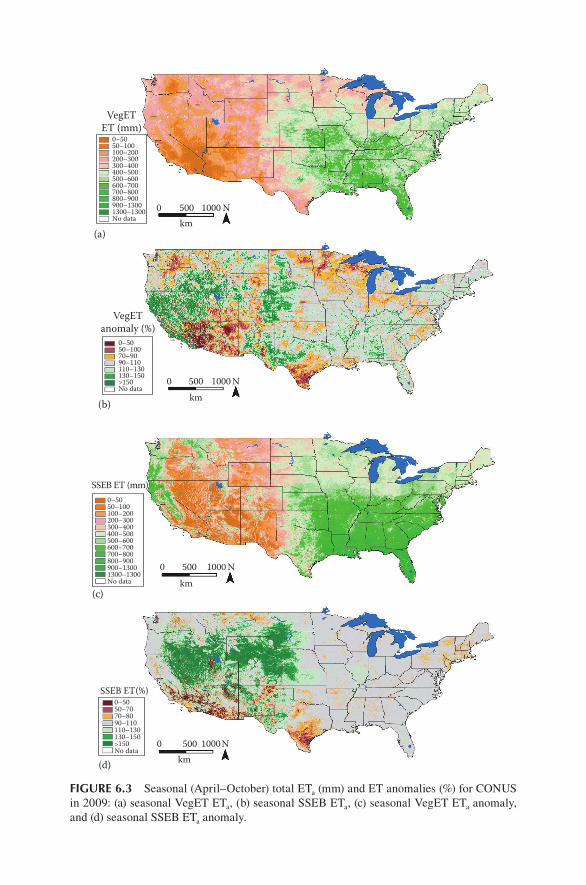
6.3.1 cumulative eta
SeasonalcumulativeETmapsfor2009overtheCONUSgeneratedwiththeVegETandSSEBmodelsarepresented inFigure6.3aandb, respectively.Generally, thetwomapsarecomparableboth inmagnitudeand spatialpatterns in thepredomi-nantlyrain-fedsystemoftheeasternUnitedStates.OutputfrombothmodelsinthisregionexhibitshighseasonalETinexcessof500mm,particularlyinthesoutheast.MorenotabledifferencesbetweenmodelsareobservedinthewesternUnitedStates,forreasonsthatmayvarybylocation.Forexample,themodelspredictsignificantlydifferentfluxesinirrigatedregionssuchastheCentralValleyofCalifornia,wherecropsareexpectedtohavehighETbecauseoftargetedwaterapplications.Theesti-matefromtheVegETwaterbalancemodelislowbecauseirrigationwaterinputsarenotaccountedforinthismodelingapproach.Incontrast,thecontributionofirriga-tion is reflected in theMODISLSTdata input into theSSEBmodel, resulting inhigher,morerepresentativeETvaluesovertheseareas.TherearealsodifferencesintheETresultsforsomeareasofthenorthwestwherevegetationwithhighETmaybebenefitingfromsnowmelt/soilmoisture/groundwaterstorageprocessesduringtheApril–Octobergrowingseason.Thismaybeanotherexampleofimpactsofnonrain-fall-relatedmoistureinputsthatarecapturedbytheSSEBmodelbutnotbytheVegETmodel,whichisdrivenbyrainfallaloneanddoesnotaccountforsnowmeltorrunoff.Significantdifferences in theVegETandSSEBETestimatesoverMinnesotaandWisconsinrequirefurtherinvestigation.Extensivelakes,wetlands,andnear-surfacegroundwatercontributionstotheevaporativefluxmaybecontributingtothehigher

135Remote Sensing of Evapotranspiration for Operational Drought Monitoring
ETfluxespredictedbySSEBinnorthernMinnesota,butingeneral,differencesinthisareamayreflectregionalsurfacepropertiesandland-atmospherecouplingsthatarenotproperlyaccountedforinthesimplifiedenergybalanceapproach.
6.3.2 eta anomalies
SeasonalETanomalymapsforbothVegETandSSEBmodelsarepresentedinFigure6.3canddfor2009,respectively.TheseveredroughtinsouthTexasandthesouth-westUnitedStates, inpartsofArizonaandCalifornia, isclearlydepictedinbothmaps, where below-average conditions (<50% normal ET) prevailed. These areasalsocomparewellwiththedroughtdepictionbytheU.S.DroughtMonitor(USDM)ofmoderatetoseveredroughtformuchofthegrowingseason(datanotshownbutavailable at http://drought.unl.edu/dm/archive.html). In contrast, above-averagemoistureconditionsareindicatedbybothmodelsformuchoftheHighPlainsregionspanningpartsofNorthDakotatowesternTexas.Similarabove-averagemoisture
0 500km
1000 N
0 500km
1000 N
VegETET (mm)
0–5050–100100–200200–300300–400400–500500–600600–700700–800800–900900–13001300–1300No data
(a)
(b)
VegETanomaly (%)
0–5050–7070–9090–110110–130130–150>150No data
FIGURE 6.3 (See color insert.)Seasonal(April–October)totalETa(mm)andETanoma-lies(%)forCONUSin2009:(a)seasonalVegETETa,(b)seasonalSSEBETa,(c)seasonalVegETETaanomaly,and(d)seasonalSSEBETaanomaly.
(continued)
0 500km
1000 N
0 500km
1000 N
VegETET (mm)
0–5050–100100–200200–300300–400400–500500–600600–700700–800800–900900–13001300–1300No data
(a)
(b)
VegETanomaly (%)
0–5050–10070–9090–110110–130130–150>150No data
SSEB ET (mm)0–5050–100100–200200–300300–400400–500500–600600–700700–800800–900900–13001300–1300No data
(c)
(d)
0 500km
1000 N
SSEB ET(%)
50–7070–80
0–50
90–110110–130130–150>150No data
0 500km
1000 N
FIGURE 6.3 Seasonal (April–October) total ETa (mm) and ET anomalies (%) for CONUS in 2009: (a) seasonal VegET ETa, (b) seasonal SSEB ETa, (c) seasonal VegET ETa anomaly, and (d) seasonal SSEB ETa anomaly.

136 Remote Sensing of Drought: Innovative Monitoring Approaches
conditionswerealsodetectedovermuchofthenorthernpartofthesemiaridwest-ernUnitedStatesinbothmodelresults.BothoftheseresultsareconsistentwiththeUSDM,whichassignedmostoftheseareasanondroughtdesignationovertheyear.
Althoughthereisageneralagreementbetweenthetwomaps,someregionsexhibitsignificantdiscrepancies,includingtheareasinMinnesotaandWisconsinthatwerehighlightedintheprevioussection.WhileSSEBindicatesnormalconditions,VegETsuggestsETisbelowaveragefromtheviewpointofrainfalldistributionduringthegrowingseason.ThisisinagreementwiththeUSDM,whichclassifiedtheregionasexperiencinghydrologicaldrought formuchof the2009growingseason.Thissuggeststhatthewaterbalanceandenergybalanceapproachesmayberespondingdifferently tovaryinghydrologicprocesses that affect the timing,magnitudeandseverityofagriculturalandhydrologicaldroughts.
Theobvioustexturaldifferenceinthespatialpatternsrepresentedinthetwomapsresultsfromdifferencesinspatialresolution.TheSSEBismodeledat1kmwhiletheVegETisproducedat10km,butthisshouldnotaffectresultsandconclusionsmadeataregionalscale.Theseresultsillustratethepotentialforbothapproachestogener-atevaluableETinformationforoperationaldroughtmonitoring,butmoreinvestiga-tionisrequiredtobetterunderstandtheETestimationdifferencesbetweenthetwomodelingapproachesanddeterminehowtheycanbestbeusedascomplementarydatasources.
SSEB ET (mm)0–5050–100100–200200–300300–400400–500500–600600–700700–800800–900900–13001300–1300No data
(c)
(d)
0 500
km
1000 N
SSEB ET(%)
50–7070–80
0–50
90–110110–130130–150>150No data
0 500km
1000 N
FIGURE 6.3 (continued)

137Remote Sensing of Evapotranspiration for Operational Drought Monitoring
6.3.3 case stuDy: seasonal et time seRies
Todemonstrate the relativeutilityof theETandanomalyproductsgeneratedby theSSEBandVegETmodels,acounty-basedanalysiswasconductedfortwoselectedcoun-tieswithcontrastingconditionsin2009.Onecountywaslocatedinadrought-affectedpartofsouthTexas(DuvalCounty)andanotherfromcentralNebraska(CusterCounty),whichhadabove-averagerainfalloverthegrowingseasonthatyear.
Figure6.4aandbshowmonthlyETtotalsandanomalies,respectively,fromthetwomodelsforthetwocounties.AcloserlookatFigure6.4ashowsthatbothmodels,asexpected,predicthigherETforCusterCountythanfordrought-strickenDuval
160
Monthly ET (mm)Custer County, NE and Duval County, Texas
ET anomaly (%)Custer County, NE and Duval County, Texas
140
120
Mon
thly
actu
al E
T (m
m)
Mon
thly
ET
anom
aly (
%)
100
80
60
Apr(a)
(b)
May Jun JulMonths, 2009
Months, 2009
Aug Sep Oct
40
20
0
200
150
100
50
0
VegET NE
VegET TXSSEB TX
SSEB NE
VegET NE
VegET TXSSEB TX
SSEB NE
Apr May Jun Jul Aug Sep Oct
FIGURE 6.4 Monthlycounty-averageET(mm)andthecorrespondinganomalies(%)fortwoselectedcountiesinthecentralUnitedStatesin2009usingVegETandSSEBmodels:(a)monthlytotalsforCusterCounty,Nebraska,andDuvalCounty,Texas,and(b)monthlyanomaliesforCusterandDuval.

138 Remote Sensing of Drought: Innovative Monitoring Approaches
County.BetteragreementbetweenmodeloutputswasobtainedinCusterCounty,withaseasonalmonthlyaverageof74mmfrombothmodels.Incontrast,themodelsgavesignificantlydifferentresultsforDuvalCounty,withVegETandSSEBestimat-ingseasonalmonthlyaveragesof30and63mm,respectively.
ThisillustratespotentialdifferencesbetweentheVegETandSSEBapproachestoETestimationanddroughtmonitoring.Accordingtoamapofirrigatedagriculturallandareafor theUnitedStates(Brownetal.,2009),agriculture inCusterCountyis generally under a predominantly rain-fed system, and rainfall moisture inputsare well represented in both modeling approaches. In comparison, Duval Countyappearstocontainahigherfractionofirrigatedlandareaintheirrigatedagricul-turallandmap.TheincreasedETduetoappliedirrigationwaterinDuvalCountywouldbecapturedbyLST-basedSSEBbutisnotaccountedforintheVegETmodel.ThelargestdifferencebetweentheVegETandSSEBETcurvesforDuvalCountyoccurinJuneandJuly,whichisgenerallyatimeofpeakirrigationformostcrops.BySeptember,whenirrigationisnotasreadilyusedandmostoftheETismetbyrainfall,theVegETandSSEBETresultswereinbetteragreement(within12%).ThisresultsuggeststhatacomparisonofSSEBandVegETmapsmaybeavaluabletoolforidentifyingirrigatedagriculturalareas.Furthermore,inprinciple,thedifferencebetweenthetwoapproachesmaybeusedtoestimatetheamountofirrigationthatisapplied(i.e.,theSSEBETwouldprovidethetotalETirrespectiveofthewatersourcewhiletheVegETETacanaccountfortheamountofETsuppliedbyrainfall).
AlthoughmonthlyETtotalsinabsolutetermsareimportantforagrohydrologicanalysis,wecannotinferfromtheplotsinFigure6.4awhetherthecountiesareinadroughtorhowseverethemoisturedeficitsmightbe.ThemonthlyETanomaliesforbothcountiespresentedinFigure6.4bareamorevaluabletoolforthisapplication.TheanomalieswerecalculatedbycomparingthemonthlyETin2009tothehistori-cal10yearmedianmonthlyETvalues(2000–2009)forthesamemonth.ThisplotshowsthatDuvalCountyhadbelow-averageETduring2009,reflectingtheobserveddrought,whiletheETforCusterCountywasaboveaverageformostoftheseasonbecause of more favorable weather conditions. Furthermore, the anomalies frombothmodelsareinbetteragreementthanarethemonthlyETtotals,whichfurtherillustratesthevalueofusingETanomalyinformationindroughtdetection.DespitethelargediscrepanciesobservedbetweentotalmonthlyETfromVegETandSSEB(30mmvs.63mm)forDuvalCounty,theseasonalmonthlyanomaliesare62%and65%forVegETandSSEB,respectively(Figure6.4b).
6.4 APPLICATIONS OF VegET AND SSEB FOR THE FAMINE EARLY WARNING SYSTEM NETWORK
Thelivelihoodofmostruralpopulationsinsub-SaharanAfricaisbasedontraditionalrain-fedagriculturethatisdependentonseasonalrainfall.KnowledgeofcropwaterusageandsoilmoisturestatusthatcanbeobtainedthroughremotelysensedETprod-uctsprovidesvaluableinformationformanagingwaterresourcesandanticipatingcropfailure (Tadesse et al., 2008). The FEWS NET (http://earlywarning.usgs.gov/fews/)

139Remote Sensing of Evapotranspiration for Operational Drought Monitoring
has developed various tools that use readily available satellite-derived and model-assimilatedweatherdatasetstomonitorhealthandproductivityofrain-fedagricul-turalareas.Basedoneaseofimplementationandminimalinputdatarequirements,theVegETandSSEBmodelsarebeingintegratedasoperationalmonitoringtoolswithintheFEWSNETsystem.
Asnotedearlier, theVegETmodelhasitsoriginsintheoriginalFAOWRSI(FAO, 1986). The operational FEWS crop water balance model uses the sameprinciplesofFAOmethodinthecalculationsoftheWRSIvaluesbasedonregion-specificcropcalendarsbutparameterizes thecalculationofETasafunctionofsoilmoisture.VegETfurther improves theFEWScropwaterbalancemodelbyintroducing a location-specific crop water-use coefficient that is derived fromremotelysenseddata.
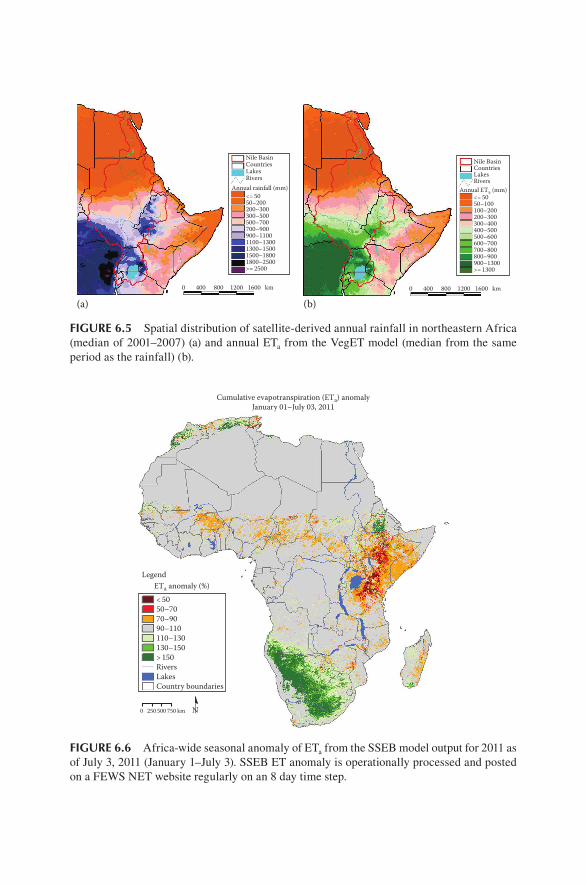
AlthoughtheAfricaoperationalcropwaterbalancemodelisstillrunningwithaprescribedcropcalendar,aplanisunderwaytointegratetheVegETparameteriza-tion,withamoreobjectivevegetationcalendarbasedonremotelysenseddatathatisspecifictoalocationinsteadofaregion.Inlightofthis,initialworkwasdonetoapplytheVegETmodeltoestimatetheNileBasinwaterbalancedynamics(Senayetal.,2009),highlightingthepotentialoftheapproachnotonlyindroughtmonitor-ingbutalsoforhydrologicstudies.Figure6.5aandbcompareVegETETaestimateswithmeanannualprecipitationover thebasin,derived fromsatellite-based rain-fall estimate (Xie and Arkin, 1997). As expected, high and low rainfall regionsinFigure6.5ashowcorrespondinghighand lowET, respectively, inFigure6.5bas the result of rainfall and vegetation cover. Note that VegET does not capturetheeffectsofintenseirrigationthatoccursalongtheNileRiver,particularlyattheDeltainEgyptwheretheNileRiveremptiesintotheMediterraneanSea(extremenorth).ThediagnosticLSTinputstoSSEBhandlethisbetter throughthe“total”ETestimationapproachinsteadoftherainfall-drivenwaterbalancemodels(datanotshown).
WiththeFEWSNETprincipleofrelianceonaconvergenceofevidence,USGS/FEWSNETjustlaunchedanoperationalimplementationoftheSSEBETmodelingapproachtocomplementtheexistingwaterbalanceproductsusingaMODISdatastream for the entire African continent. An operational ET anomaly product hasbeenproducedandstagedattheFEWSNETwebsite(http://earlywarning.usgs.gov/fews/africa/index.php)sinceJune2011.ThenewSSEBproductsconsistofmonthlyand cumulative ET anomalies at 1km resolution. A sample product is shown inFigure6.6,highlightingtheseveredrought(upto<50%ofnormal)ineastAfricaasaseasonalanomalybetweenJanuary1andJuly3,2011(mostrecentavailabledata).The product shows an above-average ET (>110% of normal) in parts of southernAfricaandnormalconditions(rangingbetween90%and100%ofnormal)inmuchofAfrica,includingtheirrigatedbasinoftheNileRiverDelta.Irrigatedareastendtoshownormalconditionsfromyeartoyearsinceirrigationapplicationisnotaffectedbytheyear-to-yearvariabilityofrainfallaslongasthewaterissourcedfromlargereservoirs,asisthecasefortheNileRiverDelta,whichisregulatedbytheAswanHighDam/LakeNasser.

140 Remote Sensing of Drought: Innovative Monitoring Approaches
Nile BasinCountriesLakesRivers
50–200200–300300–500500–700700–900900–11001100–13001300–15001500–18001800–2500
0 400
(a)
(b)
800 1200 1600 km
<= 50
>= 2500
Annual rainfall (mm)
Nile BasinCountriesLakesRivers
50–100100–200200–300300–400400–500500–600600–700700–800800–900900–1300
0 400 800 1200 1600 km
<= 50
>= 1300
Annual ETa (mm)
FIGURE 6.5 (See color insert.) Spatial distribution of satellite-derived annual rainfallinnortheasternAfrica (medianof2001–2007) (a)andannualETa from theVegETmodel(medianfromthesameperiodastherainfall)(b).
Nile BasinCountriesLakesRivers
50–200200–300300–500500–700700–900900–11001100–13001300–15001500–18001800–2500
0 400
(a)800 1200 1600 km
<= 50
>= 2500
Annual rainfall (mm)
(b)
Nile BasinCountriesLakesRivers
50–100100–200200–300300–400400–500500–600600–700700–800800–900900–1300
0 400 800 1200 1600 km
<= 50
>= 1300
Annual ETa (mm)
FIGURE 6.5 Spatial distribution of satellite-derived annual rainfall in northeastern Africa (median of 2001–2007) (a) and annual ETa from the VegET model (median from the same period as the rainfall) (b).
Legend
Cumulative evapotranspiration (ETa) anomalyJanuary 01–July 03, 2011
RiversLakesCountry boundaries
50–7070–9090–110110–130130–150
ETa anomaly (%)< 50
> 150
0 250 500 750 Nkm
FIGURE 6.6 Africa-wide seasonal anomaly of ETa from the SSEB model output for 2011 as of July 3, 2011 (January 1–July 3). SSEB ET anomaly is operationally processed and posted on a FEWS NET website regularly on an 8 day time step.

141Remote Sensing of Evapotranspiration for Operational Drought Monitoring
6.5 CONCLUSIONS
ThemainobjectiveofthischapterwastodemonstratetheuseofremotelysenseddatainsimplifiedenergyandwaterbalancemodelingapproachestoestimatingETfor drought monitoring and agrohydrologic applications. Both VegET and SSEBmodelswereabletocapturethegeneralspatialpatternsofseasonalETovermuchoftheCONUS.However,notabledifferenceswereobservedbetweentheirseasonalETtotals,particularlyoverlocationswherewatersourcesotherthanrainfall(e.g.,irriga-tion,snowmeltrunoff,andsubsurfaceirrigationfromhighwatertables)areavailabletovegetation.Theanomalymapsprovedtobemoreusefulindetectingyear-to-yearchangesthanseasonalETtotals,whicharepronetoerrorsassociatedwithdataandmodelassumptionsandsimplifications.
Althoughbothapproachescanprovidecomparableresultsfordroughtmonitor-ingusingtheanomalyproducts,eachmayhaveuniqueadvantagesinsomespecificapplicationsandlocations.Forexample,thewaterbalanceapproach(rainfallbased)
Cumulative evapotranspiration (ETa) anomalyJanuary 01–July 03, 2011
RiversLakes
Legend
Country boundaries
50–7070–909–110110–130130–150
ETa anomaly (%)< 50
>150
0 250 500 750 Nkm
FIGURE 6.6 (See color insert.) Africa-wide seasonal anomaly of ETa from the SSEBmodeloutputfor2011asofJuly3,2011(January1–July3).SSEBETanomalyisoperation-allyprocessedandpostedonaFEWSNETwebsiteregularlyonan8daytimestep.

142 Remote Sensing of Drought: Innovative Monitoring Approaches
provides more information on temporal soil moisture variability and runoff as aby-productoftheVegETmodel,whichisusefulforotherhydrologicapplications.Incomparison,theSSEBETmodelingismoreusefulforquantifyingETfromnon-rain-fed systems such as irrigation and groundwater-fed vegetation systems sinceSSEBETestimatesETregardlessof thewatersource.However,someof thedif-ferencesexhibitedbetweenVegETandSSEBrequirefurtherinvestigationtofullyunderstandtheprocessesinvolvedanddeterminesynergisticapplications.
Thisstudyhighlightsthatsimplifiedmodelingtechniquesandparameterizationthatusereadilyavailableglobalsatellitedataandmodel-assimilatedweatherdatasetscanbe implementedeffectively inanoperationalsetupfor timelyassessmentofdroughthazardsandmonitoringagrohydrologicconditionsindata-poorpartsoftheworld.Recently,FEWSNEThasimplementedanoperationalsetupoftheSSEBoverAfricaforagriculturalmonitoringinAfricausingtheMODISdatastreamaspartoftheconvergenceofevidenceprincipleadvocatedbyFEWSNET.BecauseoftheglobalnatureoftheinputdatasetstoboththeSSEBandVegETmodels,thereareopportunitiestoexpandtheseproductsindifferentpartsoftheworld.Fielddataarerequiredtovalidateandcalibratethesemodelsbeforeusingtheproductsinanabsolutesenseforwaterbalanceapplications.However,themodelscanproducereli-ableanomalyproductsthatcanbeusedfordroughtdetection.
ACKNOWLEDGMENT
Anyuseoftrade,firm,orproductnamesisfordescriptivepurposesonlyanddoesnotimplyendorsementbytheU.S.Government.
REFERENCES
Allen,R.G.,L.S.Pereira,T.A.Howell,andM.E.Jensen.2011.Evapotranspirationinformationreporting:1.Factorsgoverningmeasurementaccuracy.Agricultural Water Management98:899–920.
Allen,R.G.,L.Pereira,D.Raes,andM.Smith.1998.Crop Evapotranspiration.FoodandAgricultureOrganization(FAO)Publication56.Rome,Italy:FAOoftheUnitedNations.
Allen,R.G.,M.Tasumi,A.Morse,andR.Trezza.2005.ALandsat-basedenergybalanceandevapotranspirationmodelinWesternUSwaterrightsregulationandplanning.Irrigation and Drainage Systems19:251–268.
Allen,R.G.,M.Tasumi,A.Morse,R.Trezza,W.Kramber,I.Lorite,andC.W.Robison.2007.Satellite-basedenergybalanceformappingevapotranspirationwithinternalizedcalibration(METRIC)–Applications.Journal of Irrigation and Drainage Engineering133:395–406.
Anderson,M.C.,J.M.Norman,J.R.Mecikalski,J.A.Otkin,andW.P.Kustas.2007.Aclima-tologicalstudyofevapotranspirationandmoisturestressacrossthecontinentalUnitedStatesbasedonthermalremotesensing:1.Modelformulation.Journal of Geophysical Research112:D10117,doi:10.1029/2006JD007506.
Bastiaanssen,W.G.M.,M.Menenti,R.A.Feddes,andA.A.M.Holtslag.1998.Aremotesens-ing surface energy balance algorithm for land (SEBAL): 1. Formulation. Journal of Hydrology212(213):213–229.
Bastiaanssen,W.G.M.,E.J.M.Noordman,H.Pelgrum,G.Davids,B.P.Thoreson,andR.G.Allen.2005.SEBALmodelwithremotelysenseddatatoimprovewater-resourcesmanagementunderactualfieldconditions.Journal of Irrigation and Drainage Engineering131:85–93.

143Remote Sensing of Evapotranspiration for Operational Drought Monitoring
Brown,J.F.,S.Maxwell,andM.S.Pervez.2009.MappingirrigatedlandsacrosstheUnitedStatesusingMODISsatelliteimagery.InRemote Sensing of Global Croplands for Food Security. eds.P.S.Thenkabail, J.G.Lyon,H.Turral,andC.M.Biradar,pp.177–198.BocaRaton,Florida:Taylor&Francis.
deBeurs,K.M. andG.M.Henebry. 2005.A statistical framework for the analysis of longimagetimeseries.International Journal of Remote Sensing26(8):1551–1573.
Eidenshink, J.C. 1990. The 1990 conterminous US AVHRR data set. Photogrammetric Engineering and Remote Sensing58:809–913.
FAO.1986.Yield Response Function.FAOIrrigationandDrainagePaper3.Rome:FoodandAgriculturalOrganizationoftheUnitedNations.
FAO.1998.Crop Evapotranspiration: Guideline for Comparing Crop Water Requirements.FAOIrrigationandDrainagePaper56.Rome:FoodandAgriculturalOrganizationoftheUnitedNations.
Goward, S.N., C.J. Tucker, and D.G. Dye. 1985. North American vegetation patternsobservedwiththeNOAA-7advancedveryhighresolutionradiometer.Plant Ecology64(1):3–14.
Gowda,P.H.,G.B.Senay,T.A.Howell,andT.H.Marek.2009.Lysimetricevaluationofsim-plifiedsurfaceenergybalanceapproachintheTexasHighPlains.Applied Engineering in Agriculture25:665–669.
Groeneveld,D.P.,W.Baugh,J.Sanderson,andD.Cooper.2007.Annualgroundwaterevapo-transpirationmappedfromsinglesatellitescenes.Journal of Hydrology344:146–156.
Kanamitsu,M.1989.DescriptionoftheNMCglobaldataassimilationandforecastsystem.Weather and Forecasting4:335–342.
Nagler,P.,R.Scott,C.Westenburg,J.Cleverly,E.Glenn,andA.Huete.2005.Evapotrans-pirationonwesternU.S. riversestimatedusing theEnhancedVegetationIndexfromMODISanddatafromeddycovarianceandBowenratiofluxtowers.Remote Sensing of Environment97:337–351.
PRISM. 2011. PRISM Products Matrix. PRISM Climate Group, Oregon StateUniversity, Corvallis, Oregon. http://www.prism.oregonstate.edu/products/matrix.phtml?vartype=tmax&view=maps(accessedonDecember12,2011).
Reed,B.C.,J.F.Brown,D.VanderZee,T.R.Loveland,J.W.Merchant,andD.O.Ohlen.1994.Measuringphenologicalvariabilityfromsatelliteimagery.Journal of Vegetation Science5(5):703–714.
Senay,G.B.2008.Modelinglandscapeevapotranspirationbyintegratinglandsurfacephenol-ogyandawaterbalancealgorithm.Algorithms1:52–68.
Senay,G.B.,K.O.Asante,andG.A.Artan.2009.WaterbalancedynamicsintheNileBasin.Hydrological Processes23:3675–3681.
Senay,G.B.,M.E.Budde,andJ.P.Verdin.2011a.EnhancingtheSimplifiedSurfaceEnergyBalance(SSEB)approachforestimatinglandscapeET:ValidationwiththeMETRICmodel.Agricultural Water Management98:606–618.
Senay,G.B.,M.Budde,J.P.Verdin,andA.M.Melesse.2007.Acoupledremotesensingandsimplifiedsurfaceenergybalanceapproachtoestimateactualevapotranspirationfromirrigatedfields.Sensors7:979–1000.
Senay, G.B., S. Leake, P.L. Nagler, G.Artan, J. Dickinson, J.T. Cordova, and E.P. Glenn.2011b. Estimating basin scale evapotranspiration (ET) by water balance and remotesensingmethods.Hydrological Processes(inpress).DoI:10.1002/hyp.8379.
Senay, G.B. and J.Verdin. 2003. Characterization of yield reduction in Ethiopia usinga GIS-based crop water balance model. Canadian Journal of Remote Sensing29(6):687–692.
Senay, G.B., J.P. Verdin, R. Lietzow, and A.M. Melesse. 2008. Global daily referenceevapotranspiration modeling and evaluation. Journal of American Water Resources Association44:969–979.

144 Remote Sensing of Drought: Innovative Monitoring Approaches
Su,H.,M.F.McCabe,E.F.Wood,Z.Su,andJ.Prueger.2005.ModelingevapotranspirationduringSMACEX:Comparingtwoapproachesforlocalandregionalscaleprediction.Journal of Hydrometeorology6(6):910–922.
Tadesse,T.,M.Haile,G.Senay,B.D.Wardlow,andC.L.Knutson.2008.Theneedforintegra-tionofdroughtmonitoringtoolsforproactivefoodsecuritymanagementinsub-SaharanAfrica.Natural Resources Forum32(4):265–279.
Tucker,C.J.,D.A.Slayback, J.E.Pinzon,S.O.Los,R.B.Myneni, andM.G.Taylor. 2001.Higher northern latitude normalized difference vegetation index and growing seasontrendsfrom1982to1999.International Journal of Biometeorology45:184–190.
UNEP.2010.Africa Water Atlas.DivisionofEarlyWarningandAssessment(DEWA).UnitedNationsEnvironmentalProgramme(UNEP).Nairobi,Kenya.
Verdin,J.andR.Klaver.2002.Gridcellbasedcropwateraccountingfor thefamineearlywarningsystem.Hydrological Processes16:1617–1630.
Xie,P.andP.A.Arkin.1997.A17-yearmonthlyanalysisbasedongaugeobservations,satel-liteestimates,andnumericalmodeloutputs.Bulletin of the American Meteorological Society78(11):2539–2558.