Embed Size (px)
Citation preview

Remote Sensing analysis of summer time Evapotranspiration using SEBS algorithm
A case study in Regge and Dinkel, The Netherlands
Wondimagegn Sine Hailegiorgis March, 2006

Remote Sensing analysis of summer time Evapotranspiration using SEBS algorithm A case study in Regge and Dinkel, The Netherlands
by
Wondimagegn Sine Hailegiorgis Thesis submitted to the International Institute for Geo-information Science and Earth Observation in partial fulfilment of the requirements for the degree of Master of Science in Geo-information Science and Earth Observation in Water Resources and Environmental Management Programme Specialisation: Advanced use of Remote Sensing in Water Resource Management, Irrigation and Drainage. Thesis Assessment Board Chairman Prof. Dr. Ir. Z. Su Head-WRS Department, ITC, Enschede External Examiner Dr. L. Jia Wageningen University and Research-ALTERRA First Supervisor Dr. A. S. M. Gieske WRS Department, ITC, Enschede Second Supervisor Ir. A. M. van Lieshout WRS Department, ITC, Enschede
INTERNATIONAL INSTITUTE FOR GEO-INFORMATION SCIENCE AND EARTH OBSERVATION ENSCHEDE, THE NETHERLANDS

Disclaimer This document describes work undertaken as part of a programme of study at the International Institute for Geo-information Science and Earth Observation. All views and opinions expressed therein remain the sole responsibility of the author, and do not necessarily represent those of the institute.

Dedicated to My Dearest Father Abe and Mom Lemlem Symbol of strength and endurance

i
Abstract
The prevailing summer weather conditions in the study area intensify the evapotranspiration and likewise deplete the water availability in streams, groundwater and soil. The estimate of spatially distributed ET and drought analysis is found to be crucial for proper water resource management. In this respect remote sensing data has an advantage for parameterization of surface energy balance models and deriving spatially distributed ET values. This study has been carried out using summer time Landsat images, meteorological and groundwater data for attaining the desired objective. The physically based advanced surface energy balance algorithm (SEBS) (Su, 2002) was applied for assessing the spatial and temporal variation of AET. A field work was carried out in the study area for ground truth collection including vegetation cover, type and height information. The ILWIS script language has been used for developing the energy balance model. Apart from the remote sensing data, the hourly meteorological observations and the landuse map of the study area were combined as input for SEBS model. The atmospheric correction in the visible and NIR band is done using ATCOR model implemented in ERDAS imagine. The ‘mono-window’ algorithm developed by Qin et al. (2001) was applied to retrieve the land surface temperature from the thermal band. The MODIS level 2 product of water vapour was used to derive the atmospheric transmittance required for mono-window algorithm. It was found that indices which are a combination of rainfall and ET better explain the drought event in the study area than the most commonly used precipitation based index, like SPI. The AET estimate from SEBS reveals the spatio-temporal variability of ET for different landuse classes. Furthermore the two approaches: landuse based and empirical methods (2001) used for determination of zom for the present study have shown a difference of 20-100% in the output of AET depending on the landcover type and growth status of the vegetation. From the investigation of histogram comparison and output of AET estimate using the image dated 20 September 2003, the quality of SLC-off product for the quantification of energy fluxes looks unreliable. Even though the ground truth data of actual ET was not available for validation, the comparison made between reference ET and Kc approach strengthen the SEBS results for the present study. Key Words: Landsat 7 ETM+, Atmospheric correction, SEBS, and drought.

ii
Acknowledgements
My greatest thanks go to the Almighty God; I don’t have sufficient words to praise you. Your grace was enough for me.
First and foremost, my gratitude goes to the ITC fellowship for providing me with this great opportunity to pursue the M.Sc course.
I would like to thank my first supervisor Dr. Ambro S.M. Gieske, as a supervisor of this thesis for his guidance and encouragement. I also appreciate his continual advice and comments he made from the commencement of the research work and, his effort to furnish me with images and meteorological data to work with. This study really would not have been possible without his assistance. I am also very grateful to my second supervisor and program director Ir. Arno van Lieshout for his unselfish readiness in proof-reading and valuable comments to improve my research work. It is also my pleasure to thank all WREM staff, without the impartation of their knowledge; this work would not have been achieved. I thank the Water Board of Regge and Dinkel for providing me with meteorological and GIS data for the research work. I would like to acknowledge the Dinoshop subsurface data archive of the Netherlands letting me to use the ground water data. It is my belief that they will continue their cooperation for the next fellows. I also wish to express my appreciation to all my classmates Sebastian Luduena (Argentina), Lin Wenjing (China), Hong Quan (Vietnam), Peter Tipis (Kenya), Tenge Gislain (Rwanda), Joseph Tsagli (Ghana) and Abdulwhab Mohammedjemal (Ethiopia), for their friendship and support during the last one and half year. My sincerest thanks to my parents, Ato Sine Hailegiorgis, W/o Lemlem Aregay and my dearest brother Tilahun Sine who have given continuous moral support to complete this research work. I also wish to thank all ITC Ethiopian community for providing an environment of home feeling. Of course I will always remember the Christian fellowship for their prayers and love which made every thing much easier for me.

iii
Table of contents
Abstract................................................................................................................................................... i Acknowledgements................................................................................................................................ ii 1. Introduction ....................................................................................................................................1
1.1. General problem statement .....................................................................................................1 1.2. Research objective and Questions ..........................................................................................1
1.2.1. General objective................................................................................................................1 1.2.2. Specific objectives..............................................................................................................1 1.2.3. Research questions .............................................................................................................2
1.3. General methodology and data used.......................................................................................2 1.4. Organization of the Thesis......................................................................................................5
2. Literature Review...........................................................................................................................7 2.1. Concepts of evapotranspiration ..............................................................................................7 2.2. Methods of Estimating Evapotranspiration ............................................................................7
2.2.1. Direct Measurement Techniques........................................................................................7 2.2.2. Water balance and Hydrologic modelling..........................................................................8 2.2.3. Remote sensing techniques.................................................................................................9
2.3. Literature review on SEBS algoritm and drought analysis...................................................10 2.3.1. Surface energy balance system (SEBS) ...........................................................................10 2.3.2. Drought Analysis..............................................................................................................11
3. Description of the study area and Available data .....................................................................13 3.1. Location ................................................................................................................................13 3.2. Description of available data and field observations............................................................14
3.2.1. Field observations and collected data...............................................................................14 3.2.2. Available data...................................................................................................................14
3.3. Climate..................................................................................................................................15 3.3.1. Rainfall and Potential evapotranspiration ........................................................................15 3.3.2. Temperature and Relative Humidity ................................................................................16 3.3.3. Global radiation................................................................................................................18
3.4. Drainage and Topography ....................................................................................................18 3.5. Geology, Geomorphology and Soils....................................................................................19 3.6. Vegetation and Land use ......................................................................................................20
4. Preprocessing of the images ........................................................................................................22 4.1. Introduction to ETM+ Landsat images................................................................................22 4.2. Image acquisition ..................................................................................................................24 4.3. Importing and processing of the images ...............................................................................24 4.4. Radiometric quality assessment............................................................................................24 4.5. Atmospheric corrections.......................................................................................................30
4.5.1. Existing Atmospheric correction methods .......................................................................30 4.5.2. Atmospheric correction with ATCOR .............................................................................31 4.5.3. Atmospheric correction for Thermal bands......................................................................35 4.5.4. Comparison of ATCOR and Mono-Window algorithm derived surface temperatures ...39

iv
4.6. General Remark ....................................................................................................................40 5. SEBS algorithm ............................................................................................................................41
5.1. General Schematization ........................................................................................................41 5.2. Sequential order and equations used in SEBS algorithm .....................................................41
5.2.1. Surface reflectance (ro).....................................................................................................41 5.2.2. Normalized Difference Vegetation Index (NDVI)...........................................................42 5.2.3. Fractional vegetation cover (fc) ........................................................................................43 5.2.4. Leaf area index (LAI).......................................................................................................43 5.2.5. Land surface emissivity (εo) .............................................................................................43 5.2.6. Surface roughness for momentum transport (zom) ............................................................44 5.2.7. The roughness length for heat transport (zoh) ...................................................................45
5.3. Similarity theory ...................................................................................................................46 5.4. Ancillary datas for SEBS algorithm .....................................................................................47 5.5. Parametrization of the Land surface heat flux......................................................................48
5.5.1. Net Radiation, Rn..............................................................................................................48 5.5.2. The soil heat flux, Go........................................................................................................48 5.5.3. The sensible heat flux, H..................................................................................................49
5.6. Determination of evaporative fraction..................................................................................49 6. Drought analysis of summer 2003 ..............................................................................................51
6.1. Precipitation excess ..............................................................................................................51 6.2. Cumulative departure from the mean ...................................................................................53 6.3. Standard Precipitation Index (SPI) .......................................................................................54 6.4. Hydrological drought ............................................................................................................57 6.5. Temperature anomaly ...........................................................................................................61
7. ET Results and discussions..........................................................................................................64 7.1. Comparison of Penman and Makkink equations ..................................................................64 7.2. Comparison of SEBS results to reference ET.......................................................................68 7.3. Spatio-temporal analysis of SEBS derived actual ET ..........................................................69
7.3.1. AET distribution based on SEBS related to major landuse at different time...................74 7.4. Comparison between the SEBS result in different time .......................................................78
7.4.1. Comparison between August images ...............................................................................78 7.4.2. Comparison between May images....................................................................................79
7.5. Comparative analysis of zom values ......................................................................................80 7.6. Atmospheric effect on estimation of AET............................................................................81 7.7. Deriving single crop coefficient (Kc) for Maize...................................................................82 7.8. Limitations ............................................................................................................................84
7.8.1. Sensible heat flux determination ......................................................................................84 7.8.2. Landuse map.....................................................................................................................84 7.8.3. SLC-off images.................................................................................................................85
8. Conclusions and Recommendations ...........................................................................................87 8.1. Conclusions...........................................................................................................................87 8.2. Recommendations.................................................................................................................88
References .............................................................................................................................................89 Appendices ............................................................................................................................................92

v
Appendix A: ILWIS script for SEBS algorithm ................................................................................92 Appendix B: Twente Airport weather Station daily meteorological data (2000-2003).....................95 Appendix C: Surveyed trees during field work in Regge and Dinkel..............................................119 Appendix D: Calibration coefficients (gains and offsets) of Landsat 7 ETM used for ATCOR ....120 Appendix E: Some constants used in SEBS algorithm (Source: Su, 2002).....................................121 Appendix F: Landuse classes and their associated zom values .........................................................122 Appendix G: List of meteorological parameters during overpass time (Source: www.knmi.com).123 Appendix H: Iteration steps for the determination of Sensible Heat flux........................................126 Appendix I: Conventional methods of Reference ET estimation used ............................................128
List of Acronyms ................................................................................................................................129 List of Symbols ...................................................................................................................................130

vi
List of figures
Figure 1.1 The major phase of the research work....................................................................................3 Figure 1.2 Approaches of the two methods applied in estimating ET.....................................................4 Figure 2.1 The surface radiation balance ...............................................................................................10 Figure 3.1 Location of the water board area Regge and Dinkel. ...........................................................13 Figure 3.2 Annual rainfall of the study area from Twente weather station (1975-2004) ......................15 Figure 3.3 Mean Monthly rainfall and evapotranspiration of the study area from Twente weather station (1975-2005) ................................................................................................................................16 Figure 3.4 Mean monthly temperatures of the study area (1975-2005).................................................17 Figure 3.5 The mean monthly temperature and relative humidity of the study area. ............................17 Figure 3.6 Mean monthly solar radiation of the study area (1995-2004) ..............................................18 Figure 3.7 Drainage network, and topography of the catchment area. ..................................................19 Figure 3.8 Geologic cross-section of the area adopted from Ground water modeling-TNO report (Minnema and Snepvangers, 2004)........................................................................................................20 Figure 3.9 Land use map of the study area (source: Regge-Dinkel Water board).................................21 Figure 4.1 Effect of SLC on the scanned image a) is before the failure and b) is after the failure. ......22 Figure 4.2 Complete Landsat 7 scene showing affected vs. unaffected areas. The red colour is the boundary of the study area. ....................................................................................................................23 Figure 4.3 SLC-off mode before and after gap filled.............................................................................23 Figure 4.4 Histograms of DN values for the images scene before and after SLC-off in study area.....28 Figure 4.5. Surface temperature histograms of the images before and after SLC-off. ..........................29 Figure 4.6 A layer stack in ERDAS incorporating all the bands ...........................................................32 Figure 4.7 Iterative steps in the spectra module adopted from ATCOR_v_87 manual (Richter, 2004)33 Figure 4.8 Spectra module in ATCOR...................................................................................................34 Figure 4.9 Histogram of broad band albedo, including clouds of August 26, 2000 image. ..................34 Figure 4.10 Change in NDVI with atmospheric corrections..................................................................35 Figure 4.11 MOD05 full scene of Total water vapour content for 26, August 2000 in cm...................38 Figure 4.12 Relations between DN values and Temperatures ...............................................................39 Figure 4.13 Mono-Window vs. ATCOR surface temperature ...............................................................40 Figure 5.1 Flowchart of SEBS procedure ..............................................................................................42 Figure 5.2 Aerodynamic roughness height (zom) map of the study area ................................................45 Figure 6.1 Annual effective rainfall of the study area from the Twente Airport station (1975-2004) ..52 Figure 6.2 Graph of monthly precipitation excess. ...............................................................................52 Figure 6.3 Graph of the daily cumulative departure from the mean of precipitation excess (effective rainfall). ..................................................................................................................................................54 Figure 6.4 SPI of existing stations calculated based on the annual mean (1975-2004)........................56 Figure 6.5 SPI values of each station from the three summer months (July-September) ......................56 Figure 6.6 Ground water level trends of the selected observation wells in the study area....................60 Figure 6.7 Long-term mean departures of summer months of temperature for Twente station (1975-2005) ......................................................................................................................................................61 Figure 6.8 Trend of mean monthly summer time temperature from the Twente Airport station record (1975-2005)............................................................................................................................................62

vii
Figure 6.9 Trend of mean monthly summer time temperature from KNMI de Bilt station record (1975-2005) ......................................................................................................................................................62 Figure 7.1 Time series Daily value of ETo using Penman and Makkink (2000-2005) .........................65 Figure 7.2 Comparison between Penman and Makkink for the spring months (April –June)..............66 Figure 7.3 Comparison between Penman and Makkink for the summer months (July –September) ...66 Figure 7.4 Comparison between Penman vs. Makkink for the winter months (November-January) ...67 Figure 7.5 Comparison between Penman vs. Makkink for the entire period........................................67 Figure 7.6 Comparison of the reference ET with SEBS value at the station pixel...............................69 Figure 7.7 Histograms of the evaporative fractions ..............................................................................71 Figure 7.8 Spatio-temporal distribution of AET derived using SEBS algorithm. .................................72 Figure 7.9 Histogram of AET for different Landuse classes 26 August 2000......................................74 Figure 7.10 Histogram of AET for different Landuse classes 25 May 2001........................................75 Figure 7.11 Histogram of AET for different Landuse classes 16 August 2002....................................76 Figure 7.12 Histogram of ET for different Landuse classes 31 May 2003...........................................77 Figure 7.13 Histogram of the difference in ET between 16-August 2002 and 26-August 2000 ..........79 Figure 7.14 Histogram of the difference in ET between 31-May 2003 and 25-May 2001...................80 Figure 7.15 Crop coefficient of maize at different growing stage .......................................................83 Figure 7.16 Comparison of Kc values for maize calculated with the literatures for different growth stage........................................................................................................................................................84 Figure 7.17 Histogram of evaporative fraction for SLC-off image September 20, 2003 ......................85 Figure 7.18 Actual ET estimated using SEBS for 20 September 2003 of SLC-off images..................86

viii
List of tables
Table 3.1 Ground water data and their geographical locations .............................................................14 Table 3.2 List of temporal images of the study area ..............................................................................15 Table 4.1 Spectral characteristics of Landsat 7 ETM+..........................................................................22 Table 4.2 Radiometric comparison of Sept 9, 1999, August 26, 2000, scenes with the SLC-off images of Sept 20, 2003 and Sept 6, 2004. ........................................................................................................24 Table 4.3 The input parameters used for atmospheric corrections. .......................................................32 Table 4.4 Estimation of atmospheric transmittance for Landsat ETM+................................................37 Table 4.5 Water vapour values for the image days derived from the IR, NIR and Leckner equation in cm. ..........................................................................................................................................................38 Table 4.6 Atmospheric correction effects on reflectance and temperature of different cover types.....40 Table 5.1. Sensitivity analysis of kB-1 for full vegetation covers; based on August 2000 image. .......46 Table 6.1 Classification of SPI values (McKee et al., 1995). ................................................................55 Table 7.1 Summary of SEBS estimates at different scale and the point estimate of reference ET ......68 Table 7.2 Summary of the spatial average of AET for different land covers for the four image days..78 Table 7.3 Main parameters governing evapotranspiration during satellite overpass time....................78 Table 7.4 Comparison of AET results using the two roughness estimation approach applied. ...........81 Table 7.5 The difference AET found before and after atmospheric correction based on August 26, 2000 image .............................................................................................................................................81 Table 7.6 Summary of the Kc values at different growing stage for maize. ........................................82

REMOTE SENSING ANALYSIS OF SUMMER TIME EVAPOTRANSPIRATION USING SEBS ALGORITHM
1
1. Introduction
1.1. General problem statement
Due to the lack of basic understanding of the spatial and temporal variability of hydrological parameters, water resource management is becoming a major challenge in most countries. In this aspect the quantification of the components of the hydrologic cycle is vital. ET is one of the most important hydrologic component in several respects; the difference between precipitation and evapotranspiration over the long term is the water available for direct use (Dingman, 2002). Despite of its significance, ET is often treated as a lumped residual flux from hydrologic budget, or estimated indirectly from local weather station data. In areas with heterogeneous vegetation cover like grassland, forests and other kind of plant species may coexist naturally within 1km2. Each vegetation species will have its own physiological nature like rooting depth, leaf area index, and stomata resistance, which complicates the computation of ET over large areas. Reliable estimates of ET rate for different land cover types and plant communities are an essential prerequisite for any water budget study and modelling attempt.
The use of remote sensing data is the recent development to resolve the challenge of the spatial distribution. It’s capability of observing a number of physical characteristics of the earth’s surface has been found useful for the parameterization of models for regional ET estimation using this technique (Peters, 1995). In watershed level study of evapotranspiration, high resolution satellite image (ASTER/Landsat) is used successfully to best estimate the spatial variability, while for global level monitoring purpose the data like from NOAA AVHRR is best applicable.
The prevailing weather condition of summer time in the Netherlands intensifies evapotranspiration and likewise depletes the water availability in lakes, streams, ground water and within the soil. This makes the available water to be scarce and results in conflicts between the human, environmental and agricultural needs. Especially the summer 2003 was hot and dry.
Considering these all problems and challenges, this research is designed to analyze the spatial and temporal variation of ET and the drought event using consecutive summer time Landsat images and Hydro meteorological data.
1.2. Research objective and Questions
1.2.1. General objective
The overall objective of the study is to apply the techniques of SEBS (Surface Energy Balance System) for the assessment and evaluation of the spatial and temporal variation of actual evapotranspiration in Regge-Dinkel catchment.
1.2.2. Specific objectives
� Estimation of daily actual evapotranspiration using the recent advanced energy balance algorithm SEBS and summer time Landsat ETM+ imageries.

REMOTE SENSING ANALYSIS OF SUMMER TIME EVAPOTRANSPIRATION USING SEBS ALGORITHM
2
� Estimation of daily time series reference evapotranspiration from the meteorological data using Penman-Monteith and modified Makkink equations.
� Analysing summer 2003 drought event in the study area.
1.2.3. Research questions
� How is the spatial and temporal variation of daily AET in the study area? � Is there significant difference in the outcome of AET by using landuse based zom values and
empirically determined ones? � Can the SLC-off Landsat 7 ETM+ be used for determination of the fluxes?
� To what scale the actual ET can be compared with the point estimate of the reference ET in
the study area?
� Is there significant indication for the presence of drought in summer 2003?
� Which of the existing drought indices best describe the severity of the drought in the study area?
1.3. General methodology and data used
The study attempts to evaluate the spatial and temporal variation of evapotranspiration using the advanced surface energy balance algorithm for heterogeneous surfaces (SEBS). Use is made the hourly measured meteorological data as input for SEBS algorithm and landuse based roughness height estimation for modelling approach. This helps better to understand the ET variation in space and time as well as the water balance within the catchment. Analysis of the summer droughts 2003 in the area will be done integrating hydrological and meteorological data. The existing drought indices will be applied in order to describe the impact of the deficit of rainfall, on ground water and soil moisture. The methodology for the research work consists of three different stages as shown in Figure 1.1. The primary data was collected; including searching and downloading of the satellite images from the archives. Good quality, cloud free and summer time images were selected. Time series meteorological and hydrological data were collected to analyze the trend and the variability of rainfall, ET, temperature and ground water level. Literature study was also carried out to understand the application of remote sensing and surface energy balance for evapotranspiration estimation and drought analysis. In the second stage field work is carried in the study area for ground truth collection. During this stage the vegetation cover, type and height information was taken which is needed as input for SEBS algorithm. Also ground control points were collected using hand held GPS for proper georeferencing of the images and land cover classification purposes. The third and final stage was pre-processing and processing of the data collected; including georeferencing and assigning the local coordinate system for the available images, extracting meteorological information during the overpass time, Atmospheric corrections for the visible and thermal bands and developing SEBS model in Integrated Land and Water Information System (ILWIS) software. The time series meteorological data were used to derive the reference ET. The 30

REMOTE SENSING ANALYSIS OF SUMMER TIME EVAPOTRANSPIRATION USING SEBS ALGORITHM
3
years climatological data is used to define the average, annual and mean monthly climatic conditions of the study area. Finally the spatial and temporal variation of AET and the summer 2003 drought will be analysed. And at last a comparison will be made between the results obtained with remote sensing based SEBS model and reference ET (figure 1.2).
Figure 1.1 The major phase of the research work
Pre-field work
-Literature review -exploring the database
-Searching and downloading images
-Collecting hydrological and
Meteorological data
Field work
-Reconnaissance -GCPs
-Ground truth collection
Post-field work
-Pre-processing of images
-Atmospheric correction
-Land cover mapping
-SEBS in ILWIS
-Estimation of reference and actual ET. -summer 2003 drought analysis
-Results, comparison, discussion and Conclusion

REMOTE SENSING ANALYSIS OF SUMMER TIME EVAPOTRANSPIRATION USING SEBS ALGORITHM
4
Figure 1.2 Approaches of the two methods applied in estimating ET

REMOTE SENSING ANALYSIS OF SUMMER TIME EVAPOTRANSPIRATION USING SEBS ALGORITHM
5
1.4. Organization of the Thesis
The content of the thesis is outlined briefly in this section as follows: Chapter 1 includes general introduction, Problem statement and objective of the study. It raises a research question which the research tries to answer with the available data and the methodology applied. Chapter 2 contains literature review on physical background of land surface evapotranspiration, and various estimation methods of ET based on different approaches; mainly reviewed the application of surface energy balance system (SEBS) in estimation of evapotranspiration. As well as the various hydrological, meteorological and remote sensing indices those are used in drought analysis. Chapter 3 gives description of the study area based on topographic, climate and land use information. In addition the description of the dataset and the materials used also briefed in this section. Chapter 4 explains about the pre-processing of the images including preliminary assessment of the acquired images, radiometric and geometric calibration, and atmospheric corrections done. Chapter 5 discusses the Surface Energy Balance System (SEBS) algorithm; including the parameterization of land surface physical parameters applied in the process of modelling for evapotranspiration. Special interest will be given to the approaches of roughness length for momentum transfer zom. Chapter 6 addresses about the drought event 2003 based on the analysis of the 30 year meteorological and hydrological data. Chapter 7 illustrates and discuss the result of ET found using different approaches. It includes the output map of spatially distributed ET of the study area. Some of the limitations also outlined on this section based on the results and findings of the study. Conclusion and recommendations will be given in chapter 8. Further research possibilities towards the water management of the catchment listed shortly.


REMOTE SENSING ANALYSIS OF SUMMER TIME EVAPOTRANSPIRATION USING SEBS ALGORITHM
7
2. Literature Review
2.1. Concepts of evapotranspiration
Evapotranspiration is a collective term of all processes whereby water is lost from the soil surface by evaporation and from the plants by transpiration. Both evaporation and transpiration occur simultaneously and there is no easy way of separating between the two processes (Dingman, 2002). The actual evapotranspiration is an indicator of how much water the crops and trees need for healthy growth and productivity. Other than the availability of water at the evaporating surface, several other factors affect evapotranspiration process. These factors include weather parameters like solar radiation, air temperature, humidity and wind speed, type and density of vegetation cover, rooting depth and reflective land-surface characteristics. A quantitative understanding of evapotranspiration has a great importance in water balance study of river basin in such a way that:
1. In a longer period of time the difference between precipitation and evapotranspiration is the water available for use.
2. Most of the food supply is grown in irrigated lands and knowledge of actual ET helps on the use of efficient water without loss required for the plant growth.
2.2. Methods of Estimating Evapotranspiration
Direct measurement of evapotranspiration is more difficult and specific devices and accurate measurements of soil water balance in lysimeter are required. The methods are often expensive, demanding in terms of accuracy and can only be fully exploited by well trained research personnel (Allen et al., 1998). Owing to the difficulty of obtaining direct measurement of ET, it is commonly
estimated by indirect methods. Gieske (2003) listed some of the methods and models that have been currently applied for monitoring evapotranspiration on global, regional and local scales. He discussed the approaches these models used in estimating the actual and reference evapotranspiration, which they depend on the type of applications and available data. In general the methods can be grouped as:
-Direct measurement -Modelling and -Remote sensing
2.2.1. Direct Measurement Techniques
Lysimeter It is an artificially enclosed volume of soil for which the inflow and outflow of water can be measured and, commonly, changes in storage can be monitored by weighing. This technique is used to determine evaporation in a natural environment by accurately measuring the other water balance components; i.e. soil moisture storage and deep drainage. Lysimeter offer the only absolute way of

REMOTE SENSING ANALYSIS OF SUMMER TIME EVAPOTRANSPIRATION USING SEBS ALGORITHM
8
precisely measuring water loss from soil and crop canopy surfaces. Due to its precise measurement, it can be used for comparison of AET results obtained with satellite data. Bowen Ratio method This method rearranges the energy balance equation in order to cancel out the aerodynamic transport terms. The Bowen ratio is often written as (Dingman, 2002):
12
12
eeTT
−−
= γβ (2.1)
Where γ the Psychrometric constant, T2 and T1 are measured air temperatures at heights Z1 and Z2, e2 and e1 are the measured water vapour pressures at Z1 and Z2. The implementation of this technique requires data loggers with humidity and temperature sensors (Allen et al., 1998). Important advantage of the Bowen ratio method is the ability to measure actual evapotranspiration and the elimination of wind and turbulent transfer coefficients while the disadvantages are sophistication and fragility of sensors and data logging equipment and the numerical instability of equation 2.1 during periods of β near -1. The need of adequate upwind fetch also place limits on the method. Eddy correlation method In this approach , fluctuations of the vertical wind (w’) and the deviations (q’) from the mean of absolute humidity (q) are measured directly with fast response sensors (Brutsaert, 1982). The expression for evapotranspiration ET is accordingly given by:
w
qwET
ρ''= (2.2)
Where the over bar indicates means over 1 to 5 minute intervals. The advantages of the eddy correlation method are the ability of direct sampling of the turbulent boundary layer and the determination of actual evapotranspiration. The disadvantages are the complexity of the instrumentation and the need of adequate upwind fetch to establish an equilibrium transport within the boundary layer considered.
2.2.2. Water balance and Hydrologic modelling
Water balance The water balance method involves applying the water balance equation to the catchment area of interest over a time period �T and solving the equation for evapotranspiration, ET as: ET=P+Qin+Gin-Qout-Gout-�S (2.3) Where, P= precipitation Qin=inflow of surface water

REMOTE SENSING ANALYSIS OF SUMMER TIME EVAPOTRANSPIRATION USING SEBS ALGORITHM
9
Qout= outflow of surface water Gin=ground water inflow Gout= ground water outflow �S= change in the amount of water stored over the time period. The dimensions of these quantities are [L3] or if divided by drainage area, [L]. Even if this approach looks simple in concept, in practice it is difficult to measure exactly the true values of the components in equation (2.3). If reasonably accurate information on the balance components is available, the method can provide accurate estimation of evapotranspiration. Hydrological models Hydrological surface flow models such as SWAP, SLURP and SWAT simulate the transformation of precipitation into stream flow taking into account all the intermediate processes such as evapotranspiration, interception, infiltration, runoff and groundwater flow and including all the artificial effects of dams, reservoirs, diversions and irrigation schemes. They are therefore able to estimate evaporation and transpiration at many points and at many times (Kite and Droogers, 2000)
2.2.3. Remote sensing techniques
The spatial variability of ET is a challenge and can not be addressed with the above mentioned point based methods. Nowadays many researches have been done to derive spatially distributed evapotranspiration over large scales using surface energy balance and remote sensing data. This technique provides spatial information from the earth’s surface by measuring reflected and emitted electromagnetic radiation. The measurements of thermal infrared, infrared and visible bands of remote sensing data are inputs for the parameterization of the energy balance components in ET calculation. It has an advantage of measuring repeatedly the same area with large coverage and on pixel based discretization. The method involves in determination of land surface variables like Surface temperature, albedo, NDVI, and emissivity. The energy exchange which governs the evapotranspiration process at the vegetation surface (Fig. 2.1) can be expressed mathematically as:
HETGRn ++= λ (Wm-2) (2.4)
Where, Rn =is the net radiation H= the sensible heat G= the soil heat flux and �ET= the latent heat flux

REMOTE SENSING ANALYSIS OF SUMMER TIME EVAPOTRANSPIRATION USING SEBS ALGORITHM
10
Figure 2.1 The surface radiation balance An operational application of remote sensing for water consumption starts in 1980’s. Jackson et al.,(1981; 1988) derived Crop Water Stress Index (CWSI) using thermal infrared observations with the assumption that, as water becomes limiting, transpiration is reduced and the plant temperature increases. Methods using Satellite remote sensing data (VIS, NIR, and TIR bands) to derive local, regional and global estimation of turbulent fluxes are recent development. Among others SEBAL (Bastiaanssen et al., 1998), TSEB (Norman et al., 1995), S-SEBI (Roerink et al., 2000), SEBS (Su, 2002) are the most common ones.
2.3. Literature review on SEBS algoritm and drought analysis
2.3.1. Surface energy balance system (SEBS)
The surface energy balance system (SEBS) is developed for the estimation of atmospheric turbulent fluxes and evaporative fractions using satellite earth observation data, in combination with meteorological information at proper scales (Su, 2002). The land surface parameters (albedo, emissivity, temperature, fractional vegetation cover and leaf area index) for the system are extracted from the reflectance and radiance measurement of the satellite. The other input used includes air pressure, temperature, humidity, and wind speed at a reference height. These climatological data are accessed from the standard meteorological station at the reference height. The third inputs are the radiation components that can be either measured directly or derived through some parameterization. SEBS is an extension of SEBI concept with the improvement of estimation of thermal roughness length with a dynamic model which is based on the work of Massman (1999). The algorithm has an advantage of using both Bulk Atmospheric Similarity (BAS) of Brutsaert (1999) and the Monin-Obukhov atmospheric surface layer (ASL) similarity which it can be used for regional and local scale estimation of the turbulent fluxes respectively. For the determination of evaporative fraction SEBS used the energy balance at limiting cases (see the detail in chapter 5). Finally the daily evaporation is determined from the given total daily available energy by assuming the evaporative fraction is constant all over the day. The algorithm has been used since the past three years for the application of evaporation estimates in Taiyuan basin in China (Jin et al., 2005), Spain Barrax (Su and Jacobs, 2001), in estimation of sensible heat flux in Spain Tomelloso area (Jia et al., 2003), and for drought monitoring purposes in north west China (Su et al., 2003).
One of the difficulties in remote sensing application of energy balance is the estimation of roughness height for momentum transport. This parameter greatly influences the turbulent characteristics near surface where the heat fluxes originate. Some of the possible ways of determining
REMOTE SENSING ANALYSIS OF SUMMER TIME EVAPOTRANSPIRATION USING SEBS ALGORITHM
11
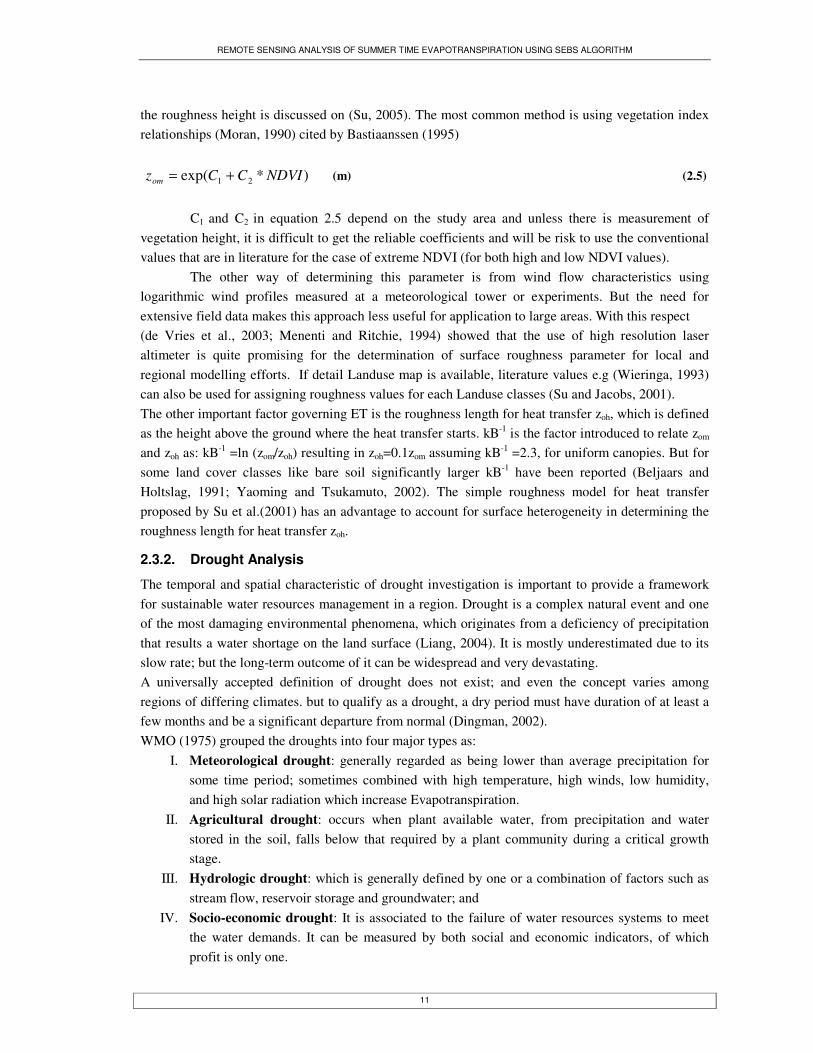
the roughness height is discussed on (Su, 2005). The most common method is using vegetation index relationships (Moran, 1990) cited by Bastiaanssen (1995)
)*exp( 21 NDVICCzom += (m) (2.5)
C1 and C2 in equation 2.5 depend on the study area and unless there is measurement of
vegetation height, it is difficult to get the reliable coefficients and will be risk to use the conventional values that are in literature for the case of extreme NDVI (for both high and low NDVI values).
The other way of determining this parameter is from wind flow characteristics using logarithmic wind profiles measured at a meteorological tower or experiments. But the need for extensive field data makes this approach less useful for application to large areas. With this respect (de Vries et al., 2003; Menenti and Ritchie, 1994) showed that the use of high resolution laser altimeter is quite promising for the determination of surface roughness parameter for local and regional modelling efforts. If detail Landuse map is available, literature values e.g (Wieringa, 1993) can also be used for assigning roughness values for each Landuse classes (Su and Jacobs, 2001). The other important factor governing ET is the roughness length for heat transfer zoh, which is defined as the height above the ground where the heat transfer starts. kB-1 is the factor introduced to relate zom and zoh as: kB-1 =ln (zom/zoh) resulting in zoh=0.1zom assuming kB-1 =2.3, for uniform canopies. But for some land cover classes like bare soil significantly larger kB-1 have been reported (Beljaars and Holtslag, 1991; Yaoming and Tsukamuto, 2002). The simple roughness model for heat transfer proposed by Su et al.(2001) has an advantage to account for surface heterogeneity in determining the roughness length for heat transfer zoh.
2.3.2. Drought Analysis
The temporal and spatial characteristic of drought investigation is important to provide a framework for sustainable water resources management in a region. Drought is a complex natural event and one of the most damaging environmental phenomena, which originates from a deficiency of precipitation that results a water shortage on the land surface (Liang, 2004). It is mostly underestimated due to its slow rate; but the long-term outcome of it can be widespread and very devastating. A universally accepted definition of drought does not exist; and even the concept varies among regions of differing climates. but to qualify as a drought, a dry period must have duration of at least a few months and be a significant departure from normal (Dingman, 2002). WMO (1975) grouped the droughts into four major types as:
I. Meteorological drought: generally regarded as being lower than average precipitation for some time period; sometimes combined with high temperature, high winds, low humidity, and high solar radiation which increase Evapotranspiration.
II. Agricultural drought: occurs when plant available water, from precipitation and water stored in the soil, falls below that required by a plant community during a critical growth stage.
III. Hydrologic drought: which is generally defined by one or a combination of factors such as stream flow, reservoir storage and groundwater; and
IV. Socio-economic drought: It is associated to the failure of water resources systems to meet the water demands. It can be measured by both social and economic indicators, of which profit is only one.

REMOTE SENSING ANALYSIS OF SUMMER TIME EVAPOTRANSPIRATION USING SEBS ALGORITHM
12
Precipitation is the primary factor controlling formation and persistence of drought along with other variables such as evapotranspiration; while water level and the vegetation condition are the main responsive parameters of drought. The soil moisture and vegetation responds to precipitation anomalies on a relatively short time steps and other water storages, such as groundwater, stream flow, and reservoir storage, only reflected in the long-term precipitation anomalies. Quantitative indices are used to identify presence of drought and along the years several indices have been developed and adopted to measure drought or wet spells intensity. The most common ones are Palmer Drought Severity Index (PDSI), Standard Precipitation Index (SPI) and hydrological indices like Standardized Water Level Index. The above meteorological and hydrological indices are most effective for long term drought. Satellite based indices like NDVI, Biomass, ET and Temperature Condition Index (TCI) have an advantage for short term at the onset of drought analysis. Recently (Su et al., 2003) has derived a scale invariant drought severity index using remote sensing. Basically this is the resultant of relative evaporation which is the output of SEBS algorithm.

REMOTE SENSING ANALYSIS OF SUMMER TIME EVAPOTRANSPIRATION USING SEBS ALGORITHM
13
3. Description of the study area and Available data
3.1. Location
The study area is located in the eastern part of the Netherlands, within the province of Overijssel, bordering Germany to the east (Fig 3.1). Geographically it lies between latitudes of 52o08’N to 52o31’N and longitudes from 6o23’to 7o04’E. It is a flat land, largely covered by grasslands with low ‘hills’ in the west and east. The study area has a size of approximately 1374 km2. Almelo, Hengelo and Enschede are the main cities found in the study area.
Figure 3.1 Location of the water board area Regge and Dinkel.
Vroomshoop
Almelo
Enschede
Haaksbergen
Losser
Oldenzaal
Hengelo
Denekamp

REMOTE SENSING ANALYSIS OF SUMMER TIME EVAPOTRANSPIRATION USING SEBS ALGORITHM
14
3.2. Description of available data and field observations
3.2.1. Field observations and collected data
Field measurements of trees height in different places were taken which results the height to be in the range of 8-45m. In addition, GPS track and ground truth data were collected to assist in georeferencing of the images and land cover mapping of the area. The collected data of surveyed trees are listed in appendix C.
3.2.2. Available data
Meteorological and hydrological data All the meteorological data available on daily basis from the Twente climatic station (52o16’N, 06o54’E elevation 34.5) accessed through the archive of Royal Netherlands Meteorological institute (KNMI). The available data are:
� Historical daily climate data (1951-2005) including global radiation, precipitation, relative humidity, hours of bright sunshine, average air temperature, minimum air temperature, maximum air temperature and wind speed. The data for these meteorological parameters are found in appendix B for the year since 2000-2003.
� Daily rainfall data for Hengelo, Almelo, Enschede and Vroomshoop (1979-2005) Note: there was missing data for the month of January in 1981 for all stations except Enschede. The data from Enschede is used to fill the gaps by linear regression. � The hourly meteorological data from 1998 onwards is also available from the Twente station;
these data are mainly used as ancillary for remote sensing based ET calculations. The groundwater level data which is mainly used for the drought analysis is accessed from Dino Loket website (http://dinolks01.nitg.tno.nl/dinoLks/DINOLoket.jsp) for the interest area. Table 3.1 shows the ground water data and their geographical location.
Table 3.1 Ground water data and their geographical locations
Available Images The primary Satellite data is accessed from different internet sources. Mainly the research was targeted to work on both ASTER and Landsat images. But due to the cloud problem and unable to get full coverage of ASTER images for the study area; sequential images of Landsat ETM+7 are acquired. A total of 8 images acquired from 1999-2005 (Table 3.2). From these 8 images four of the images from 2000-2003 have been used solely for the analysis.

REMOTE SENSING ANALYSIS OF SUMMER TIME EVAPOTRANSPIRATION USING SEBS ALGORITHM
15
Table 3.2 List of temporal images of the study area
3.3. Climate
The study area lies in the temperate zone of the Northern Hemisphere, and possesses a maritime climate. The summers are cool while winters are usually wet with occasional cold spells. The winds have strong influence on rainfall patterns in the country. (http://www.knmi.com).
3.3.1. Rainfall and Potential evapotranspiration
Taking into consideration the insignificant influence of the topography on the distribution of rainfall, the long term areal average is estimated from the Twente weather station with a 30 year average. The average annual precipitation depth is 755 mm yr-1, with the driest years as low as ~500mm in 1976 and the wettest reaches up to ~1100mm in the years 1993 and 1994 (Fig. 3.2). The mean monthly rainfall distribution shows, that, rain is quite common and is spread evenly all year round (Fig. 3.3).
0
200
400
600
800
1000
1200
1975
1976
1977
1978
1979
1980
1981
1982
1983
1984
1985
1986
1987
1988
1989
1990
1991
1992
1993
1994
1995
1996
1997
1998
1999
2000
2001
2002
2003
2004
Time (Years)
Rai
nfal
l (m
m y
ear-1
)
Figure 3.2 Annual rainfall of the study area from Twente weather station (1975-2004)

REMOTE SENSING ANALYSIS OF SUMMER TIME EVAPOTRANSPIRATION USING SEBS ALGORITHM
16
The mean potential evapotranspiration which is defined as the ability of the atmosphere to remove water from the surface assuming no lack of water supply is estimated using both Penman and Makkink methods. In annual cycle the monthly Penman evapotranspiration increases from 9mm in December to 100mm in June, whereas the Makkink result is about 8mm in December and reaches up to 90mm in July. As it is presented in Fig. 3.3 the seasonal variation of evapotranspiration is very large, due to the dependence on solar radiation and temperature. The seasonal cycle of precipitation and evapotranspiration indicates to a water surplus in winter period (between October and March) and deficit in summer (April to September).
0
10
20
30
40
50
60
70
80
90
100
Val
ue
(mm
mon
th-1
)
Time (month)
Rain 70.8 47.3 62.0 48.9 57.6 72.1 70.3 61.6 64.3 61.4 66.7 74.5
Eto_Penman 11.7 17.4 34.4 58.1 87.5 98.5 85.2 49.2 27.5 12.3 9.2 9.2
ETo_Makkink 9.2 16.3 32.4 55.1 82.9 86.2 91.6 79.7 48.9 27.6 12.0 7.5
Jan Feb Mar Apr May Jun Jul Aug Sep Oct Nov Dec
Figure 3.3 Mean Monthly rainfall and evapotranspiration of the study area from Twente weather station (1975-2005)
3.3.2. Temperature and Relative Humidity
The long-term average temperature for the Twente weather station showed that the mean monthly maximum and minimum temperature of the area is 5C and 13.4C respectively. July and August are the warmest months of the year, with mean maximum temperature of 22.1C and 22.4C respectively. The months of December, January and February are the coldest month in the study area with mean minimum temperature of 0.5C,-0.3C, -0.8C respectively (Fig 3.4).

REMOTE SENSING ANALYSIS OF SUMMER TIME EVAPOTRANSPIRATION USING SEBS ALGORITHM
17
Mean Monthly Temperature (1975-2005)
-5
0
5
10
15
20
25
Jan Feb Mar Apr May Jun Jul Aug Sep Oct Nov Dec
Months
Tem
pera
ture
(c)
Tmean Tmin Tmax
Figure 3.4 Mean monthly temperatures of the study area (1975-2005) The mean monthly values of relative humidity vary between 75% in the month of May to 90% in December (Fig.3.5).
Mean monthly variation of Temperature and Relative humidity(1975-2005)
0
10
20
30
40
50
60
70
80
90
100
Jan Feb Mar Apr May Jun Jul Aug Sep Oct Nov Dec
Rel
ativ
e hu
mid
ity (%
)
0
2
4
6
8
10
12
14
16
18
Tem
pera
ture
(C)
Relative humidity Temperature
Figure 3.5 The mean monthly temperature and relative humidity of the study area.

REMOTE SENSING ANALYSIS OF SUMMER TIME EVAPOTRANSPIRATION USING SEBS ALGORITHM
18
3.3.3. Global radiation
The global radiation (the incoming short wave radiation) is the main source of energy reaching the earth’s surface which is used by the plants for their photosynthetic activity. It varies within the year due to the position of the earth’s surface in respect to the sun. Figure 3.6 shows the mean monthly variation of solar radiation in the study area.
Mean monthly incoming solar radiation (1995-2004)
0
100
200
300
400
500
600
Jan Feb March April May June July August Sept Oct Nov Dec
Months
Rad
iatio
n (M
Jm-2
)
Figure 3.6 Mean monthly solar radiation of the study area (1995-2004)
3.4. Drainage and Topography
The predominant topography of the area is flat, low lying terrain, with elevation ranging from 5 to 65m above mean sea level. The south-eastern, western and some part to the north of the area are topographically high occupied by small elongated hill formed by “rampart moraine” (Fig 3.7). The drainage structure has a dendritic pattern. The streams and rivers in the lowland part have been straightened for drainage purposes which mainly used as a discharge of excess ground water. The general flow direction of the streams is towards North West to Regge, except in the east where a few tributaries are found east of Enschede-Oldenzaal ridge flows to the Dinkel valley.

REMOTE SENSING ANALYSIS OF SUMMER TIME EVAPOTRANSPIRATION USING SEBS ALGORITHM
19
Projection system: Dutch RD Figure 3.7 Drainage network, and topography of the catchment area. (DEM source: http://srtm.csi.cgiar.org/)
3.5. Geology, Geomorphology and Soils
The geomorphology of the present landscape is the result of Pleistocene deposits. The hills to the southeast and the western part are formed by ice push resulting in ground moraine deposits locally called the Drenthe formation, which is mainly composed of boulder clay. Figure 3.8 shows the geological cross section through the study area. The subsurface consists mainly of the Pleistocene fluvial sand ranging in thickness up to 60m. Beneath the sand, the deposit is the clayey marine of Tertiary age and act as impermeable base to the groundwater aquifer system. The only outcrops occurring near the surface are found in Losser area, where the Gildehaus Sandstone which is just below the surface. This is lower cretaceous sandstone of Mesozoic era. The soil type mainly consists of loamy sand (cover sand), medium and coarse sand with frequent gravel layers.

REMOTE SENSING ANALYSIS OF SUMMER TIME EVAPOTRANSPIRATION USING SEBS ALGORITHM
20
Figure 3.8 Geologic cross-section of the area adopted from Ground water modeling-TNO report (Minnema and Snepvangers, 2004)
3.6. Vegetation and Land use
The vegetation cover is characterized by heath lands, grasses, forests and crops, mainly, maize. The landuse map (Fig. 3.9) shows that the major part of the area is covered with grassland which contributes 48 %. The arable land which is mostly covered with maize accounts for 19% of the total area. The heaths are locally found in the swampy area and around Holten on the hills, have coverage of 1.1%. The forests cover a total of 14% of the study area; it is mainly grouped into two types: deciduous and coniferous; they have almost equal coverage. The dominant tree species found in the study area are Pine, Spruce, Oak, Beech, and Birch with small number of other kind of tree species. Apart from the agricultural crops, the water consumption of other vegetation types is not well known.

REMOTE SENSING ANALYSIS OF SUMMER TIME EVAPOTRANSPIRATION USING SEBS ALGORITHM
21
Figure 3.9 Land use map of the study area (source: Regge-Dinkel Water board)

REMOTE SENSING ANALYSIS OF SUMMER TIME EVAPOTRANSPIRATION USING SEBS ALGORITHM
22
4. Preprocessing of the images
4.1. Introduction to ETM+ Landsat images
The Enhanced Thematic Mapper Plus (ETM+) is a multispectral scanning radiometer that is carried on board of Landsat 7 satellite. The sensor has provided nearly continuous acquisitions since July 1999, with a 16-day repeat cycle. It has an advantage as compared to the previous sensors in respect to measurement precision and spatial resolution. The sensor provides 8 bands with three different resolutions, over a swath width of 183km.
Table 4.1 Spectral characteristics of Landsat 7 ETM+ An instrument malfunction occurred on the sensor in May 31, 2003 which caused a failure in Scan Line Corrector (SLC). With a non-functioning of SLC, the scanner traces the earth’s surface in a pattern similar to figure 4.1b. This cause individual lines to alternately overlap and leave gaps to the edge of the image and the impact diminishes towards the centre.
a. with SLC b. Without SLC Figure 4.1 Effect of SLC on the scanned image a) is before the failure and b) is after the failure. (Source: http://www.landsat.org).

REMOTE SENSING ANALYSIS OF SUMMER TIME EVAPOTRANSPIRATION USING SEBS ALGORITHM
23
The sensor is still capable of acquiring useful image data, particularly with the central portion of the scene. The middle of the scene (approximately 22 kilometres with L1G product) contains very little duplication or data loss. Figure 4.2 shows the full Landsat scene and the place in between of the two yellow lines is the area which is not affected much by the SLC-off problem.
Figure 4.2 Complete Landsat 7 scene showing affected vs. unaffected areas. The red colour is the boundary of the study area. The United States Geological Survey (USGS) processes the image to Level 1G gap-filled product, in which all the missing image pixels are replaced with histogram-matched data values from one or more Landsat 7 scenes with equivalent seasonality (Fig. 4.3).
Figure 4.3 SLC-off mode before and after gap filled. Three of the acquired images for the present study are in SLC-off mode, for which the present research will look into the usability of these products in determination of surface fluxes.

REMOTE SENSING ANALYSIS OF SUMMER TIME EVAPOTRANSPIRATION USING SEBS ALGORITHM
24
The left part in figure 4.3 illustrates the edge portion of the original SLC-off scene of Sept 06, 2004 image of the study area while the right part is the same location after the gap-fill, using histogram matching.
4.2. Image acquisition
The Landsat ETM+7 images dated September 09, 1999, May 25, 2001 and May 31, 2003 were acquired through ITC geo data warehouse whereas the images of August 26, 2000, August 16, 2002 and the SLC-off images dated September 20, 2003, September 6, 2004 and August 24, 2005 were purchased from USGS organization. The Submap which belongs to the study area is created from the full scene of the path and row 197/24 Landsat image for the proposed study.
4.3. Importing and processing of the images
Pre-processing such as geometric, radiometric and atmospheric corrections are a prerequisite for analysis of ET and land cover classification. All corrections were made to reduce the distortions created by the satellite and atmospheric conditions. The raw images acquired have all different file formats. However, they were read by ENVI and saved as ERDAS LAN format to be able to import in ILWIS. The raw remote sensing data were affected by geometric distortion and do not contain reference to the location of the data acquired. In order to match these data with the real world coordinate, the images are georeferenced using the information given in their metadata. And adjusted for the shift using the ground control points collected during field work. The September 09, 1999 and May 31, 2003 images have no coordinate information originally, and are georeferenced using an image-to-image registration technique. Finally the local coordinate system of the study area is assigned to each image using the coordinate transformation system.
4.4. Radiometric quality assessment
For Radiometric quality of the SLC-off images, histogram comparison of the raw DN values has been done to assess the effect of the malfunction of the SLC instrument. The table below lists the result of the histogram comparison of the ETM+ image before and after of the SLC failure.
min. max. mean s.d min. max. mean. s.d min. max. mean s.d min. max. mean s.d
165 91 73.38 5.44
57 86 66.35 6.2 61 82 65.29 17.02 53 81 57.60 15.02
2 42 67 52.44 5.49 40 72 52.28 7.08 42 67 48.82 13.34 36 68 45.26 13.67
3 32 68 43.37 7.79 29 80 43.44 10.6 33 74 43.32 14.28 26 75 36.96 14.01
4 57 155 105.45 22.84 39 122 79.88 19.52 48 134 79.53 28.03 35 116 68.30 25.33
5 33 106 68.69 16.40 37 122 74.91 17.85 31 111 63.45 23.66 32 118 63.89 23.30
6H 136 179 156.78 8.65 114 164 142.42 8.37 125 143 126 31.62 123 142 126.00 31.26
7 17 83 37.26 12.88 19 93 41.56 14.36 17 96 40.44 20.85 17 86 35.17 16.27
6-Sep-04Bands 9-Sep-99 26-Aug-00 20-Sep-03
Table 4.2 Radiometric comparison of Sept 9, 1999, August 26, 2000, scenes with the SLC-off images of Sept 20, 2003 and Sept 6, 2004.

REMOTE SENSING ANALYSIS OF SUMMER TIME EVAPOTRANSPIRATION USING SEBS ALGORITHM
25
The histogram result reveals that the DN values in the visible bands do not vary much. The slight differences found in band 4, band 5 and band 7 can be explained by the change in vegetation and soil moisture condition.
a. band 1 September 09, 1999
b. band 1 August 26, 2000
c. band 1 September 20, 2003
d. band 1 September 06, 2004
e. band 2 September 09, 1999
f. band 2 August 26, 2000

REMOTE SENSING ANALYSIS OF SUMMER TIME EVAPOTRANSPIRATION USING SEBS ALGORITHM
26
g. band 2 September 20, 2003
h. band 2 September 06, 2004
i. band 3 September 09, 1999
0 50 100 150 200 250DN value
0
50000
100000
150000
200000
250000
300000
Num
ber o
f pix
els
j. band 3 August 26, 2000
k. band 3 September 20, 2003
l. band 3 September 06, 2004

REMOTE SENSING ANALYSIS OF SUMMER TIME EVAPOTRANSPIRATION USING SEBS ALGORITHM
27
m. band 4 September 09, 1999
n. band 4 August 26, 2000
o. band 4 September 20, 2003
p. band 4 September 06, 2004
q. band 5 September 09, 1999
r. band 5 August 26, 2000

REMOTE SENSING ANALYSIS OF SUMMER TIME EVAPOTRANSPIRATION USING SEBS ALGORITHM
28
s. band 5 September 20, 2003
t. band 5 September 06, 2004
u. band 7 September 09, 1999
v. band 7 August 26, 2000
w. band 7 September 20, 2003
x. band 7 September 06, 2004
Figure 4.4 Histograms of DN values for the images scene before and after SLC-off in study area.

REMOTE SENSING ANALYSIS OF SUMMER TIME EVAPOTRANSPIRATION USING SEBS ALGORITHM
29
Even if the scenes are not under similar atmospheric conditions, it appears that the mean DN values of the thermal bands in all of the SLC-off images are with in a narrow range and smaller than the previous scene. These result in lowering of the surface temperature of most places as compared to the ambient air temperature during the pass time. The figure below presents the comparison of the surface temperature histogram derived from before and after SLC.
a. 09, September 1999
b. 26, August 2000
c. 20, September 2003
d. 06, September 2004
Figure 4.5. Surface temperature histograms of the images before and after SLC-off.
Tair=24.4C Tair=22.0C
Tair=24.0C Tair=24.1C

REMOTE SENSING ANALYSIS OF SUMMER TIME EVAPOTRANSPIRATION USING SEBS ALGORITHM
30
From the histogram curves above for the case of images with SLC, the difference between hot and cold pixels is above 20C whereas for those of SLC-off images of 20, September 2003 and 06, September 2004 only a difference of about 10C exhibited.
4.5. Atmospheric corrections
The accurate retrieval of surface reflectance and temperature is very important in deriving land surface biophysical parameters and in determination of fluxes. In mapping of the surface physical properties, the surface information is highly affected by atmospheric components and their magnitude. The atmospheric effects include scattering by aerosols and absorption by gases, such as water vapour, ozone, and oxygen. The method is an essential part to improve the analysis of the remote sensing data in many ways:
� Multi-temporal scenes recorded under different atmospheric conditions can better be compared after atmospheric correction. Changes observed will be due to changes on the earth’s surface and not due to different atmospheric conditions.
� For comparison of vegetation condition and surface brightness between and among years of selected time periods.
� For quantitative remote sensing applications like surface vegetation atmosphere transfer (SVAT) modelling.
4.5.1. Existing Atmospheric correction methods
The correction methods can be grouped according to the final product required by the application. Generally the methods are grouped into two: Relative and Absolute atmospheric methods. Relative atmospheric methods This method includes invariant object, histogram matching, and dark object. For detail of the discussion of these methods the reader can refer (Liang, 2001a). Absolute atmospheric correction methods These methods require a description of the components in the atmospheric profile. The output of these methods is an image that matches the reflectance of the ground pixels with a maximum estimated error of 10%, if atmospheric profiling is adequate enough (Parodi, 2005). Some typical examples of radiative transfer models used for absolute atmospheric correction are: LOWTRAN, MODTRAN, 6S and SMAC (Simplified Method for Atmospheric Correction) which all are described in Parodi (2005). These methods are producing some accurate results but they need the acquisition of atmospheric parameters like aerosol properties, ozone and water vapor content. Especially the first two methods require a large effort to make atmospheric correction calculations and run them. The simplified method for atmospheric corrections (SMAC) is better and faster technique but, there is no coefficient files for Landsat ETM+ imagery and it was even difficult to get the atmospheric correction data for each of the pass time of the available images. ATCOR is software developed for fast atmospheric correction which is the result of the radiative transfer model (RTM) of MODTRAN built up look up tables. The advantage of this model is not only its speed but also its ability to deal with cases when the atmospheric description is unknown for the image under process. For the present study ATCOR software is used to perform the atmospheric correction in the visible and NIR bands of Landsat images.

REMOTE SENSING ANALYSIS OF SUMMER TIME EVAPOTRANSPIRATION USING SEBS ALGORITHM
31
4.5.2. Atmospheric correction with ATCOR
ATCOR is a fast atmospheric correction algorithm for imagery of medium and high spatial resolution satellite sensors such as Landsat Thematic Mapper (TM), SPOT, ASTER, IKONOS or Quick Bird (Richter, 2004). It performs the atmospheric corrections for the image data by inverting the results of MODTRAN calculations that were previously compiled in a database. As mentioned in Richter (2004) the accuracy of this correction depends on the accuracy of the radiative transfer code and the calibration file of the sensor. The atmospheric correction functions stored in the look up tables of the database consist of the following parameters: Standard atmospheres (profile of pressure, air temperature, water vapour content, and ozone concentration). The atmosphere types contained in the model are:
1. Midlatitude summer 2. US standard atmosphere 1976 3. Tropical atmosphere 4. Fall (autumn) atmosphere 5. Midlatitude winter
Aerosol types: There are five aerosol types in the atmospheric correction functions of the database: rural, urban, desert, maritime and oceanic. They represent the aerosol condition of the atmosphere depending on the location of the area with respect to their proximity to the mentioned places. Aerosol concentrations: it is defined by the horizontal surface meteorological range, called visibility. It is used in the determination of aerosol optical depth in the module in which the aerosol optical depth decreases with increase of the visibility. Ground elevation: This is used to derive Rayleigh optical depth taking into account the elevation of the area. Solar Zenith angle: can be inserted from the header (metadata) of the image or can be calculated using the date and overpass time of the image. Once the geometric correction is done as described before, the images of ILWIS format were exported to ERDAS software to do the atmospheric correction. Using a layer stack (Main, image interpreter, utilities) in ERDAS, a file is created which incorporates all bands in a sequence of the visible and thermal bands (Fig. 4.6). The values of gains and offsets in the calibration file are used to change the image data to radiance values at the sensor. A new calibration file is created based on the gains and offsets information given in the header file that came with the images (Appendix D).

REMOTE SENSING ANALYSIS OF SUMMER TIME EVAPOTRANSPIRATION USING SEBS ALGORITHM
32
Figure 4.6 A layer stack in ERDAS incorporating all the bands The minimum set input parameters needed to perform the correction in ATCOR2 for all the images are listed in Table 4.3. Generally the following parameters served as standard for the entire image:
• Model for solar region: Rural, mid-latitude-summer • Model for thermal region: Mid-latitude-summer • Ground elevation: 0.1km. The hourly meteorological data for the acquisition date/ time is used to make a good estimate of the visibility.
Table 4.3 The input parameters used for atmospheric corrections. For the determination of appropriate atmosphere (aerosol and humidity) iterative steps is done in the spectra module as shown in figure 4.7 to get meaningful atmospheric corrections.

REMOTE SENSING ANALYSIS OF SUMMER TIME EVAPOTRANSPIRATION USING SEBS ALGORITHM
33
Figure 4.7 Iterative steps in the spectra module adopted from ATCOR_v_87 manual (Richter, 2004) After getting a good combination of visibility and aerosol model the final selected target is compared with the library spectra that come with the software as shown in figure 4.8 The selected targets for August 2000 were forest and grassland with library spectra of spruce and meadow respectively.

REMOTE SENSING ANALYSIS OF SUMMER TIME EVAPOTRANSPIRATION USING SEBS ALGORITHM
34
Figure 4.8 Spectra module in ATCOR Results The histogram in figure 4.9 compares the broad band albedo before and after atmospheric corrections.
0.0 0.1 0.2 0.3 0.4 0.5 0.6 0.7reflectance at TOA (-)
0
5000
10000
15000
20000
25000
30000
35000
40000
Num
ber o
f pix
els
a. Before atmospheric correction
0.0 0.1 0.2 0.3 0.4 0.5 0.6 0.7Surface reflectance (-)
0
5000
10000
15000
20000
25000
30000
35000
40000
Num
ber o
f pi
xels
b. After atmospheric correction
Figure 4.9 Histogram of broad band albedo, including clouds of August 26, 2000 image. From these figures, it can be clearly seen that the atmospheric correction produces significantly different values. The stretch of the histogram reveals the increase in contrast between different land surface types due to atmospheric corrections. The range of broad band albedo including cloud contaminated pixels was about 0.047 to 0.55 while after atmospheric correction minimum of 0 and maximum reaches to 0.65. The Lower values of albedo belong to the towns, water bodies and the forests, while the higher values are in the grasslands and the crop surfaces.

REMOTE SENSING ANALYSIS OF SUMMER TIME EVAPOTRANSPIRATION USING SEBS ALGORITHM
35
The change in NDVI after atmospheric corrections is presented in figure 4.10; there is always an increase in NDVI after atmospheric corrections due to the fact that the impact of water vapour (absorption) is greater for NIR channels.
00.10.20.30.40.50.60.70.80.9
1
1999 2000 2001 2002 2003 2004 2005
NDVI TOA NDVI_ATCOR
Figure 4.10 Change in NDVI with atmospheric corrections.
4.5.3. Atmospheric correction for Thermal bands
Estimation of actual surface temperature is important for determination of radiation budget and sensible heat flux in SEBS. A mono-window algorithm proposed by Qin et al.,(2001) is applied for the atmospheric correction in order to derive the surface temperature. The algorithm works based on thermal radiance equation using transmittance and mean atmospheric temperature as a parameter from the atmosphere and emissivity from the ground. The stored DN value should be converted first to actual measurement of the sensor in units of spectral radiance [Wm-2sr-1µm-1] using the gain and offset values listed in Landsat ETM+ metadata. The radiance temperature at the top of atmosphere is then computed through the inversion of Planck’s law as:
���
����
�+
=1ln 1
26
λLK
KT (4.1)
Where K1=666.09Wm-2sr-1µm-1 and K2 =1282.71K The Satellite only observes the radiation that passes through the atmosphere B6T(6), which is expressed as:
[ ] ↑+−+= 66666666 )1()()( IITBTB sαεετ (4.2)
Where, Τs=Land surface temperature [K] T6= brightness temperature of band 6 of Landsat 7 [Wm-2sr-1µm-1] τ6= atmospheric transmittance [-]

REMOTE SENSING ANALYSIS OF SUMMER TIME EVAPOTRANSPIRATION USING SEBS ALGORITHM
36
�6=ground emissivity in band 6 [-] B6Ts=ground radiance [Wm-2sr-1µm-1] I6
↑=upwelling atmospheric radiance [Wm-2sr-1µm-1] I6�=down welling atmospheric radiance [Wm-2sr-1µm-1]
It is known that the earth’s surface is not a perfect blackbody, but usually selective with an emissivity
less than one. Therefore in equation 4.2 the term (1-�6)α6I represents part of downwelling radiance
reflected back to the atmosphere and �6B6(Ts) correspond to the radiance emitted from the target. The upwelling radiance in equation 4.2 is computed as:
( ) )(1 666 aTBI τ−=↑ (4.3)
Where Ta is the effective mean atmospheric temperature and B6 (Ta) represents the effective mean atmospheric radiance. Simplifying the formulation of Franca and Cracknell (1994) the authors arrived in estimation of downwelling atmospheric radiance as:
)()1( 666αα τ aTBI −= (4.4)
Where, Ta
� is the downward effective mean atmospheric temperature. Substituting equation 4.3 and 4.4 into 4.2 the equation can be written as:
)()1()()1)(1()()( 66666666666 aas TBTBTBTB ττεττε α −+−−+= (4.5)
Even if the differences between Ta and αaT under clear sky condition is about 5C, the authors able to
arrive to the conclusion that by approximation of B6 (Tαa ) with B6 (Ta) the magnitude of
underestimation of surface temperature is quite small. With this approximation, the observed radiance at the satellite can be expressed as:
)()]1(1)[1()()( 666666666 as TBTBTB ετττε −+−+= (4.6)
As mentioned above, the algorithm is based on three parameters, ground emissivity, �, atmospheric transmittance � and mean atmospheric temperature Ta. The emissivity is calculated using Valor and Caselles (1996) formulation as described later in equation 5.5 and assigning 0.99 for the water bodies.
4.5.3.1. Determination of mean atmospheric temperature Ta
The method of Sobrino et al., (1991) used by the authors for the estimation of effective mean atmospheric temperature at the satellite pass, which relates the determination of Ta with water vapour distribution in the atmospheric profile. The method used the atmospheric simulation model LOWTRAN 7 output of several standard atmospheres in combination with local meteorological data for Ta estimation.

REMOTE SENSING ANALYSIS OF SUMMER TIME EVAPOTRANSPIRATION USING SEBS ALGORITHM
37
For the present study the simple linear relationship for standard atmosphere of mid-latitude summer is used as follows:
oa TT 92621.00110.16 += (4.7)
Where To is the near-surface air temperature with dimension K.
4.5.3.2. Determination of atmospheric transmittance
Having emissivity derived from (Valor and Caselles, 1996) and mean atmospheric temperature from equation 4.7, the only parameter unknown for the algorithm is the transmittance. Mono-window algorithm used a simple linear relationship to estimate the transmittance from the water vapour content as shown in table 4.4. The high temperature and low temperature profiles in table 4.4 are defined as 35C and 18C respectively. _____________________________________________________________________________ Atmospheric Temperature profile Water vapour content (gcm-2) Transmittance equation Higher temperature 0.4-1.6 �6=0.974290-0.08007w
1.6-3.0 �6=1.031412-0.11536w Low air temperature 0.4-1.6 �6=0.982007-0.09611w
1.6-3.0 �6=1.053710-0.14142w _____________________________________________________________________________ Table 4.4 Estimation of atmospheric transmittance for Landsat ETM+ For the air temperature, To which lays between of the two profiles the transmittance values of the two profiles were calculated and averaged. For this thesis, values of water vapour content for each day of the images were taken from MODIS precipitable water product (http://modis-atmos.gsfc.nasa.gov/MOD05_L2/atbd.html). Basically the product has two files with 1km spatial resolution and a 5x5 km resolution derived from NIR algorithm and infrared respectively. The infrared precipitable water vapour is generated as one component of MOD07 and added to MOD05 for the sake of convenience. We tried to compare the two MODIS product with the empirical methods of Leckner equation presented in (Iqbal, 1983) which is expressed as:
0
493.0T
PW sr⋅⋅
=φ
(4.8)
Where, rφ is the relative humidity in fraction, T0 is the air temperature in K and Ps is the partial
pressure of water vapour given as Ps=exp(26.23-5416/To). As shown in table 4.5 the two products have different values and show differences compared with the values calculated using the above equation 4.8.

REMOTE SENSING ANALYSIS OF SUMMER TIME EVAPOTRANSPIRATION USING SEBS ALGORITHM
38
Table 4.5 Water vapour values for the image days derived from the IR, NIR and Leckner equation in cm. Since most of the absorption by water vapour takes place in NIR, we use the NIR product of 1x1km pixel resolution. Furthermore the above electronic source pointed out that the NIR product was compared with water vapour data from DOE ARM microwave radiometer for extended period (about 1 year) and found in good agreement. They also got comparable values with the microwave radiometer data collected in a recent China field experiment, which strengthens the reliability of this product.
Figure 4.11 MOD05 full scene of Total water vapour content for 26, August 2000 in cm.
4.5.3.3. Surface Temperature Ts retrieval
In order to solve Ts from equation 4.6 the radiance at the ground should be derived first as follows:
6666666666 )]1()()[1()( τεεττ ÷−+−−= aas TBTBTBTB (4.9)
The surface temperature is then computed through the inversion of Planck’s law the same way as described in equation 4.1 except in this case the radiance value will be radiance at the ground calculated in equation 4.9.

REMOTE SENSING ANALYSIS OF SUMMER TIME EVAPOTRANSPIRATION USING SEBS ALGORITHM
39
4.5.4. Comparison of ATCOR and Mono-Window algorithm derived surface temperatures
The graph in figure 4.12 demonstrates the temperature difference gained with atmospheric correction applying both ATCOR and Mono-Window techniques. The surface temperatures derived using these techniques differ from 5-10C as compared to the black body temperature.
Figure 4.12 Relations between DN values and Temperatures
The graph in Figure 4.13 show the correlation between ATCOR and Mono-window derived surface temperature results R2 of 0.94. However good correlation doesn’t mean good accuracy, rather it explains the association and interrelation between the techniques that they follow the same trend. In ATCOR modules the scene emissivity is fixed as constant of 0.98. But what we should keep in mind is that the emissivity values in the spectral region of 10.5 to 12.5 µm are in the range of 0.95 to 0.99 (Valor and Caselles, 1996). And a 1% emissivity shift leads to error of 0.5C temperature. This means ATCOR derived temperature as shown in figure 4.12 overestimates and underestimates in the range of 0.5-3C depending on the emissivity of the objects.

REMOTE SENSING ANALYSIS OF SUMMER TIME EVAPOTRANSPIRATION USING SEBS ALGORITHM
40
Comparison between ATCOR Vs. Mono-Window algorithm derived surface temperatures
y = 0.9378x + 0.723R2 = 0.9889
0
10
20
30
40
50
60
0 10 20 30 40 50 60
T_ATCOR (C)
T_Q
in (C
)
Figure 4.13 Mono-Window vs. ATCOR surface temperature
4.6. General Remark
The table below shows the change in reflectance and temperature attained at the surface of different objects for the image scene of August 26, 2000. In general for lower ground reflectance objects like the water bodies, the values of the reflectance at the satellite level is higher than at the ground. This implies that the radiance reaching to the satellite comes mainly from the Rayleigh scattering. On the contrary for the higher reflectance objects there is an increase in reflectance value. The change in temperature after atmospheric correction is significant for lower emissive bodies like buildings.
Class Coordinates Rp Ro R4_TOA R4_ATCOR T_TOA (C) T_corrected(C)
Forest ( 233329.04, 497669.87) 0.094 0.101 0.2248 0.2375 18 19
Water ( 238695.23, 483872.42) 0.057 0.002 0.0000 0.0000 18 19
Heath ( 225764.37, 484383.84) 0.098 0.107 0.2075 0.2275 21 23
Built-up-area ( 250782.52, 476082.25) 0.118 0.102 0.1559 0.1675 26 33
Maize ( 261325.36, 476558.52) 0.149 0.246 0.4738 0.5725 21 24
Grass ( 249112.01, 484257.42) 0.161 0.265 0.5470 0.6375 20 22
Table 4.6 Atmospheric correction effects on reflectance and temperature of different cover types.

REMOTE SENSING ANALYSIS OF SUMMER TIME EVAPOTRANSPIRATION USING SEBS ALGORITHM
41
5. SEBS algorithm
5.1. General Schematization
SEBS (Su, 2002) uses a spectral satellite observations together with the meteorological data to solve the energy balance equation 2.4 for determination of pixel wise evapotranspiration. The conceptual scheme of the algorithm applied to this study is shown as flowchart in figure 5.1. SEBS requires the following sets of information as input from remote sensing data; the land surface albedo, emissivity, NDVI and temperature. These land surface parameters need to be determined first. Air pressure, temperature, humidity, and wind speed at the reference height are the second input provided by ground meteorological data. The air temperature and wind speed are scaled to the blending height (100m) assumed to apply for all pixels of the image. Thirdly downward solar radiation and long wave radiations are required input for the energy balance component. The downward solar radiation is taken from hourly meteorological data for each of the satellite pass time of the images; whereas the outgoing long wave radiation is derived from satellite data with some parameterization (Equation 5.21). The incoming longwave radiation hold areally constant derived from air temperature. The net radiation term is then calculated as the rest term of all incoming and outgoing shortwave and longwave radiations. The soil heat flux is calculated from an empirical relationship of vegetation cover and net radiation (Equation 5.22). The roughness height for momentum transfer is extracted from literature values based on the existing land use classification map. The model of Su et al., (2001) is used for the determination of roughness length for heat transfer. Finally the evaporative fraction is calculated on the basis of energy balance at limiting cases (section 5.6).
5.2. Sequential order and equations used in SEBS algorithm
5.2.1. Surface reflectance (ro)
The atmospheric correction results in reflectance of the visible bands and the surface temperature in the thermal band. The surface reflectance is an important physical parameter in determining the net radiation available on the earth’s surface. The Landsat ETM+ has narrow bands in the atmospheric window and we want to combine the narrow band reflectance into the broad band reflectance to obtain surface albedo. The formula by Liang (2001b) is used for the conversion as follows: Ro=0.356*R1+0.13*R3+0.373*R4+0.085*R5+0.072*R7-0.0018 (5.1)

REMOTE SENSING ANALYSIS OF SUMMER TIME EVAPOTRANSPIRATION USING SEBS ALGORITHM
42
Summer time Landsat images
Figure 5.1 Flowchart of SEBS procedure
5.2.2. Normalized Difference Vegetation Index (NDVI)
Vegetation indices such as NDVI are good indicators of photosynthetic activity on the vegetation surface. Due to the strong spectral absorption of chlorophyll in the visible region (0.475 to 0.65 µm) and the high reflectance of vegetation in the NIR part, the reflectance value in these bands is used to provide the information of the vegetation status. The information is computed from the reflectance in the red and NIR channels as:
rednir
rednirNDVIρρρρ
+−
= (5.2)

REMOTE SENSING ANALYSIS OF SUMMER TIME EVAPOTRANSPIRATION USING SEBS ALGORITHM
43
Where, ρnir and ρred are atmospherically corrected ground reflectance in the near infrared and red bands respectively.
5.2.3. Fractional vegetation cover (fc)
The fractional vegetation cover is used to separate non-vegetated, partially vegetated and densely vegetated land surfaces. This parameter is employed in SEBS model to derive surface temperature, LAI and ground heat flux. The formula by Choudhury et al. (1994) was applied to determine the parameter as:
p
c NDVINDVINDVINDVI
f ���
����
�
−−
−=minmax
max1 (5.3)
Where:
• The exponent, p, represents the ratio of the leaf angle distribution and taken as a constant 0.625.
• NDVI max is the NDVI value of the full vegetation cover. • NDVI min is the NDVI value of the bare soil. • NDVI is the NDVI value of the current pixel (NDVI map). The NDVI min and NDVI max are defined from the frequency of histogram, as the lower and upper 2-5% of each NDVI maps (Gutman and Ignatov, 1998).
5.2.4. Leaf area index (LAI)
It is defined as the one sided green leaf area per unit ground area of the canopies. Typical values of LAI for a variety of land covers are essential for proper model of satellite based energy balance modelling for a specific catchment. There have been many attempts to relate LAI to NDVI, SAVI, and fractional vegetation cover through time which normally can serve for specific biomes and environment. To mention some (Dusek et al., 1985; Peterson et al., 1987) quoted by Su (2000) and Choudhury et al., (1994). For this study the exponential relation ship formulated by Choudhury (1987) cited in French et al., (2003) is used. The expression is written as:
Λ−−
=)1log( cf
LAI (5.4)
Where: -fc is the fractional canopy cover derived in equation 5.4 and -Λ is the leaf angle distribution function taken to be 0.5. In SEBS, this parameter is used in the determination of the roughness height for heat transfer (zoh)
5.2.5. Land surface emissivity (εεεεo)
Empirical relation ships using the vegetation cover method of Valor and Caselles (1996) together with the land use map used to derive surface emissivity.
)1(4)1( cccscco ffdff −��+−+= εεεε (5.5)

REMOTE SENSING ANALYSIS OF SUMMER TIME EVAPOTRANSPIRATION USING SEBS ALGORITHM
44
Where: �c: is emissivity of full vegetation cover �s: is emissivity of bare soil fc: is the fractional vegetation cover ‹d�›: is the vegetation structure parameter. According to Valor and Caselles (1996) the �c, �s and ‹dε› are taken as 0.985, 0.96 and 0.015 respectively.
5.2.6. Surface roughness for momentum transport (zom)
The roughness height for momentum transfer is taken as reference height for momentum flux calculations. It approximates the height at which the fluid flow changes from being turbulent to be laminar. Even though remote sensing observation provide most of the vegetation information, the estimation of roughness height is still remains a challenge for regional modelling of turbulent transport. Because it was not possible to make comprehensive, spatially distributed vegetation heights measurement in the field, two approaches were made to estimate zom value for the present study.
1) Using the land use map, the vegetation type was tagged with nominal zom value (appendix F) in accord with literature values (Jacobs and van Boxel, 1988a; Su, 2005; Wieringa, 1993). Except for the months of May the empirical equation by Bastiaanssen (1995) used for the case of maize field. The existing land use map is aggregated primarily into 11 types. The derived zom map is shown in figure 5.2.
2) Using empirical relationships with NDVI (Su and Jacobs, 2001) as:
5.2
max
5.0005.0 ���
����
�+=
NDVINDVI
zom (5.6)
Finally an attempt was made to see the effects of the two approaches in the estimation of ET taking May 25, 2001 and August 26, 2000 as a case.
Using approximate empirical relationships (Brutsaert, 1982) vegetation height and displacement height were respectively estimated
136.0omz
h = (5.7)
hd32= (5.8)

REMOTE SENSING ANALYSIS OF SUMMER TIME EVAPOTRANSPIRATION USING SEBS ALGORITHM
45
5.2.7. The roughness length for heat transport (zoh)
The scalar roughness height for heat transfer, zoh, is calculated as:
)exp( 1−=kB
zz om
oh (5.9)
Where: kB-1 is a parameter normally called excess resistance for heat transfer which is used to compare zom and zoh. The physical based model of Su et al., (2001) used for the determination of kB-1 :
21*
*222
2/*
1 /).(/.
)1()(
4ss
t
omscc
nect
d fkBC
hzhuukfff
ehu
uC
kCkB −
−
− ++−
= (5.10)
Projection system: Dutch RD
Figure 5.2 Aerodynamic roughness height (zom) map of the study area

REMOTE SENSING ANALYSIS OF SUMMER TIME EVAPOTRANSPIRATION USING SEBS ALGORITHM
46
Where fc is the fractional vegetation cover of the canopy, and fs is its compliment. Cd is the drag coefficient of the foliage assumed to take as constant 0.2. Ct is the heat transfer coefficient of the leaf; for most canopies and environmental conditions, Ct is bounded as 0.005N ≤ Ct ≤ 0.075N (N is the number of sides of the leaf for heat exchange). For this study Ct value of 0.03 was arrived for a well known kB-1 value of 2.3. Table 5.1 presents the kB-1 value for homogeneous fully vegetated canopy with different Ct values. All the terms in equation 5.10 and their derived formulas are described in Su et al., (2001). The second term in equation 5.10 also has different form in (Su, 2002; Su, 2005); but for this study the equation 5.10 is used.
Table 5.1. Sensitivity analysis of kB-1 for full vegetation covers; based on August 2000 image.
5.3. Similarity theory
As defined by Brutsaert (1999) similarity refers to the principle that if all the variables which affect a specific physical phenomenon are properly scaled to get a universal relationship between them. The Monin-Obukhov similarity theory (MOS) is applied to derive the friction velocity, the sensible heat flux, and the stability length L as follows:
��
���
���
�+��
���
� −−���
����
� −=
Lz
Ldoz
zdz
ku
u ommm
om
o ψψln* (5.11)
��
���
���
�+��
���
� −−���
����
� −=−L
zLdoz
zdoz
CkuH oh
hhohp
ao ψψρ
θθ ln*
(5.12)
Where Z is the reference height above the surface, u* is the friction velocity, ρ is the density of air k=0.4 von Karman’s constant, do is the zero displacement height, zom is the roughness height for, momentum transfer, �o and �a are the potential temperature at the surface and the air, ψm and ψh are

REMOTE SENSING ANALYSIS OF SUMMER TIME EVAPOTRANSPIRATION USING SEBS ALGORITHM
47
the stability correction functions for momentum and sensible heat transfer respectively, L is the Obukhov length defined as
kgH
uCL vp θρ 3
*−= (5.13)
Where g is the acceleration due to gravity and �v is the potential virtual temperature near the surface. The formulation proposed for Monin-Obukhov profile functions by Brutsaert (1999) is used for the stability functions; details of the calculation can be found in the mentioned paper. And the script which contains the formulas is shown in appendix A. The stability length L also depends on H, which in turn depends on u* and determined in equation 5.12 as a function of θ and u*. Therefore equations 5.9 to 5.13 were solved iteratively (Appendix H).
5.4. Ancillary datas for SEBS algorithm
In addition to the remote sensing data, the following meteorological parameters were used for the model: 10 minutes averaged wind speed, as well as hourly average relative humidity, air temperature, air pressure and incoming solar radiation from the Twente Airport meteorological station. The other parameters which were not measured were calculated from the measured parameters as follows: Saturation Vapour pressure (es)
��
���
�+
=3.237
27.17exp611.0
TT
es (5.14)
Where: es the saturation vapour pressure (kPa) T is the air temperature (C) measured near the surface layer. Specific humidity
s
a
v
d
pe
RR
q *���
����
�= kg kg-1 (5.15)
Where: Rd and Rv are the gas constants for the dry air and water vapour air. Potential temperature
286.0
0���
����
�=
pp
Tθ (5.16)
Where: θ is the potential temperature [K] T is the near surface layer air temperature and surface temperature [K] p is in mbar for po=1013

REMOTE SENSING ANALYSIS OF SUMMER TIME EVAPOTRANSPIRATION USING SEBS ALGORITHM
48
Virtual potential temperature
θθ )61.01( qv += (K) (5.17)
All the above mentioned meteorological variables are listed in appendix G.
5.5. Parametrization of the Land surface heat flux
5.5.1. Net Radiation, Rn
The surface energy balance is commonly written as in equation 2.4 and the formula to calculate the net radiation is given by:
↑−↓+↓−= LLKRn .)1( εα (5.18)
Where: Rn is the net radiation, K↓ is incoming short wave radiation measured at the weather station, L↓ & L↑ are incoming and outgoing long wave radiation respectively, � is the surface reflectance (albedo) and ε is the surface emissivity.
4aa TL ⋅⋅↓= εσ (5.19)
Where: σ is the Stephan Boltzman constant = 5.67x10⁻⁸ Wm-2k-4 �a is the emissivity of air described in Campbell and Norman (1998) as:
26 )15.273(102.9 +⋅⋅= −aa Tε (5.20)
Ta is the air temperature at the reference height. The out going long wave radiation (Lout) is determined as a function of Surface temperature and emissivity as:
4ss TL σε↑= (5.21)
Where, �s and Ts are surface emissivity and temperature respectively.
5.5.2. The soil heat flux, Go
The equation for the soil heat flux is parameterized as:
( )( )[ ]csccn fRG Γ−Γ−+Γ= .1.0 (5.22)
Where Γ c=0.05 for full vegetation canopy by Monteith cited in Su et al., (2001) and sΓ =0.315 for
bare soil (Kustas and Daughtry, 1989).

REMOTE SENSING ANALYSIS OF SUMMER TIME EVAPOTRANSPIRATION USING SEBS ALGORITHM
49
5.5.3. The sensible heat flux, H
The actual sensible heat flux derived in equation 5.12 is constrained by the sensible heat flux at the wet limit Hwet, and the sensible heat flux at the dry limit Hdry in SEBS. The dry limit is given by:
ondry GRH −= (5.23)
The formula in equation 5.23 is equivalent to say that, the latent heat (evaporation) is zero due to the limitation of soil moisture. Under the wet limit, the evaporation takes place at the potential rate and limited only by the available energy at the earth’s surface. In this case the sensible heat flux reduces by:
0≈−−= wetonwet EGRH λ (5.24)
The equation similar to Penman-Monteith given in Su (2002) is combined with the above equation to come up with sensible heat flux at the wet limit.
( ) ���
����
� ∆+���
����
� −−−=
γγρ
1. as
ew
ponwet
eer
cGRH (5.25)
Where: e: is the actual vapour pressure measured es: The saturation vapour pressure derived in equation 5.14 γ : is the Psychrometric constant �: is the rate of change of saturation vapour pressure with temperature and rew : is the external resistance which is determined as:
��
����
����
�+���
����
� −−���
����
� −=w
ohh
wh
ohew L
zL
dzz
dzku
r ψψln1
*
(5.26)
The external resistance of the above equation is dependent on the Obukhov length at the wet limit, which is expressed as:
λρ
/).(61.0.. 3
*
onw GRkg
uL
−−= (5.27)
λ is the latent heat of vaporization =2.45MJ kg-1. The same procedure as the actual sensible heat flux determination will follow to determine the wet limit from equation 5.24 to 5.27 in iterative way.
5.6. Determination of evaporative fraction
From the equations 2.4, 5.23 and 5.24 (Su, 2002) arrives to the formula determining the relative evaporation

REMOTE SENSING ANALYSIS OF SUMMER TIME EVAPOTRANSPIRATION USING SEBS ALGORITHM
50
wetdry
twe
twe
wet
wetr HH
HH
EEE
EE
−−
−=−
−==Λ 11λ
λλλλ
(5.28)
The evaporative fraction is finally given by:
GRE
GRE
n
wetr
n −Λ
=−
=Λλλ
(5.29)
By assuming that the daily value of evaporative fraction is approximately equal to the instantaneous value, the daily evapotranspiration is determined as:
w
daya
RnxxET
λρ⋅Λ
= 71064.8 (5.30)
ρw is the density of water [kgm-3] Rnday is the daily net radiation in [Wm-2] The 24 hours net radiation is given by:
daydayoday LKrcRn +↓⋅−= ).1( 1 (5.31)
‘ro’ is the broad band surface albedo derived in equation 5.1 ‘Lday’ is the average daily net long wave radiation [Wm-2] C1 is the conversion factor of instantaneous albedo to the daily average (default =1.1) K↓day is the measured incoming radiation [Wm-2] Lday is usually estimated using the daily atmospheric transmittance as
τ110−=dayL (5.32)
Where τ is determined from sunshine fraction as
)/( Nnba ss ⋅+=τ (5.33)
Where, the default values as=0.25; bs=0.5 used

REMOTE SENSING ANALYSIS OF SUMMER TIME EVAPOTRANSPIRATION USING SEBS ALGORITHM
51
6. Drought analysis of summer 2003
Drought can be defined as the imbalance of water availability, with persistent lower precipitation than average and results in diminishing of the water resources. The precipitation and evapotranspiration are the main causative parameters while the water level and the vegetation condition are the responsive parameters for the drought. The time series of meteorological (Rainfall, ET, and temperature), hydrological (stream and ground water) can give reflection to the presence of drought or wetness. The drought analysis requires selection of an average time depending on the purpose of the analysis and the available data. Different kinds of indices exist to analyze the drought event. For this study an attempt is made to apply some of the drought indices for analysing the summer drought and specially focusing on year 2003.
6.1. Precipitation excess
The precipitation excess (effective rainfall) can be expressed with rainfall and potential evapotranspiration in the form of Pexcess=P-Eo (6.1) Where P represents the amount of rainfall for the desired time and Eo is Makkink derived evapotranspiration with the dimensions of [LT-1]. The data for rainfall is the 30 years record from Twente meteorological station (1975-2005), whereas the Makkink is calculated from the climatological data. The result represents mainly the recharge to the ground water or contribution to the stream flow depending on the aquifer property, soil type and intensity of rain. The long-term annual precipitation excess shows that the year 2003 was a drought year as compared to all years except 1976 which was severe drought in all over the Netherlands (Figure 6.1). On annual basis when assuming that the precipitation minus evapotranspiration equals zero, it is possible to determine the minimum amount of rainfall that is required to avoid the water scarcity or drought formation. The graph below shows that in 2003 there was depletion of 30mm depth of water. If expressed volume wise over the catchment it is about 4.12x10⁷ m3 of water which was needed to maintain steady soil moisture conditions.

REMOTE SENSING ANALYSIS OF SUMMER TIME EVAPOTRANSPIRATION USING SEBS ALGORITHM
52
Annual effective rainfall
-200
-100
0
100
200
300
400
500
600
700
800
1975
1976
1977
1978
1979
1980
1981
1982
1983
1984
1985
1986
1987
1988
1989
1990
1991
1992
1993
1994
1995
1996
1997
1998
1999
2000
2001
2002
2003
2004
Time (Years)
Eff
ectiv
e ra
infa
ll (m
mye
ar-1
)
Figure 6.1 Annual effective rainfall of the study area from the Twente Airport station (1975-2004) The graph in Figure 6.2 presents the monthly rainfall excess from 1995-2005 which shows that always in the summer time there is a deficit of water. The rise and fall varies from year to year depending on the differences in precipitation amount and seasonal variation of ET
Precipitation excess (1995-2005)
-100
-50
0
50
100
150
200
Jan-
95
Jul-9
5
Jan-
96
Jul-9
6
Jan-
97
Jul-9
7
Jan-
98
Jul-9
8
Jan-
99
Jul-9
9
Jan-
00
Jul-0
0
Jan-
01
Jul-0
1
Jan-
02
Jul-0
2
Jan-
03
Jul-0
3
Jan-
04
Jul-0
4
Jan-
05
Jul-0
5
Time (month)
prec
ipita
tion
exce
ss (m
m m
onth
-1)
Figure 6.2 Graph of monthly precipitation excess.

REMOTE SENSING ANALYSIS OF SUMMER TIME EVAPOTRANSPIRATION USING SEBS ALGORITHM
53
The peak rainfall excess is found in October 1998 with the highest rainfall record of 192 mm. The low values are mainly seen on spring and summer months in August 1995, May 2001 and August 2003 mainly due to high evapotranspiration at this time. Those months show a deficit of more than 70mm.
6.2. Cumulative departure from the mean
This method is commonly used in U.S by USGS Colorado Water resources for drought watch in streams and precipitation records. For this study the formulation is based on the daily amount of rainfall and evapotranspiration expressed as:
( )[ ]�=
−−=i
iioEPCDM
1
µ (6.2)
Where, P-E0 is precipitation excess in mmday-1 and µ is mean of daily precipitation excess given by:
( )
N
EPN
i�
=
−= 0µ (6.3)
The graph below shows the accumulation, since January 1, 1975, of the departures in daily available water (precipitation excess) from the mean value of each day. The zero line represents a condition that would result if every daily excess precipitation was equal to the mean value. The rise or fall reflects the contribution of each day on the cumulative total, depending on whether that day departures was above or below the mean daily precipitation excess. From the graph it can be seen clearly that the 1976 extreme drought contribute to the depth of the departure whereas the year 1993 (“THE WETTEST YEAR”) causes the rise. There is a break from the general trend in summer time of year 1993 and winter period of 1996. This is because of low ET and rainfall at these specific periods respectively. The steep drop in year 2003 is a clear indication of the presence of drought at this time.

REMOTE SENSING ANALYSIS OF SUMMER TIME EVAPOTRANSPIRATION USING SEBS ALGORITHM
54
Figure 6.3 Graph of the daily cumulative departure from the mean of precipitation excess (effective rainfall).
6.3. Standard Precipitation Index (SPI)
Precipitation is the main factor which controls the formation and persistence of drought together with evapotranspiration. Among other indices, SPI is the most commonly used drought index in U.S. Colorado Climate Center, the U.S. Western Regional Climate Center, and the U.S. National Drought Mitigation Center to monitor current states of drought in the United States. It has an advantage to quantify the precipitation deficit for multiple time steps (1, 3, 6 and 12 months). Literatures Gutman (1998) cited in Sonmez et al., (2005) recommend this index for its advantage in explaining the drought condition from one region to the other and in between different meteorological stations. For this study the index is used to analyze the impact of rainfall deficiency on drought summer 2003 using 3 month and 12 month steps. It is calculated using the following equation, written as:
( )σ
mi XXSPI
−= (6.4)
Where, Xi is the seasonal precipitation of the station in this case the three summer months and 12 months rainfall record, Xm is its long-term seasonal mean and � is the standard deviation. The drought categories defined by SPI values are listed in table 6.1.

REMOTE SENSING ANALYSIS OF SUMMER TIME EVAPOTRANSPIRATION USING SEBS ALGORITHM
55
__________________________________________________________________________ SPI Values_________________________________________________ Drought category__ ≥2.0 Extremely wet 1.5 to 1.99 Very wet 0 to -0.99 Mild drought -1.0 to -1.49 Moderately drought -1.5 to -1.99 Severe drought ≤ -2.0 Extremely dry __________________________________________________________________________ Table 6.1 Classification of SPI values (McKee et al., 1995). In order to relate the water demand with the required application, the analysis was made for three month summer time corresponds to the peak growing season (July-September). This is because it is believed that the shorter time better explains the situation of soil moisture deficit. The SPI also calculated on annual basis to look for the hydrologic condition of the area for each hydrological year. The graph (6.4 and 6.5) show how even the index varies locally within the stations. From SPI result in figure 6.5, only Almelo station can be categorized as moderately dry for the year 2003. But The SPI made based on annual basis better explains the situation in the year 2003 than the three months of figure 6.5. According to McKee et al., (1995) drought classification, the annual SPI shows that Almelo, Vroomshoop and Twente stations exhibit Moderately drought condition at this time. From the long term three month average (Figure 6.5) it can be observed that 1976, 1982, 1983 and 1991 experienced more dryness as compared to the year 2003. By the same way the wetness of specific hydrologic year can be described using this index. The year 1993 was the wettest year from the 30 year record. The two graphs above also give the behavior of the index that it is flexible with respect to the period chosen.

REMOTE SENSING ANALYSIS OF SUMMER TIME EVAPOTRANSPIRATION USING SEBS ALGORITHM
56
SPI values of 12 months for the existing rain gauge stations in the study area (1975-2004)
-2.50
-2.00
-1.50
-1.00
-0.50
0.00
0.50
1.00
1.50
2.00
2.50
3.00
1975
1976
1977
1978
1979
1980
1981
1982
1983
1984
1985
1986
1987
1988
1989
1990
1991
1992
1993
1994
1995
1996
1997
1998
1999
2000
2001
2002
2003
2004
Years
SP
I
SPI_Twente SPI_Vroomshoop SPI_Almelo SPI_Hengelo SPI_Enschede
Figure 6.4 SPI of existing stations calculated based on the annual mean (1975-2004)
SPI values of 3 summer months for the existing rain gauge stations (1975-2004)
-2.50
-2.00
-1.50
-1.00
-0.50
0.00
0.50
1.00
1.50
2.00
2.50
3.00
19751977
19791981
19831985
19871989
19911993
19951997
19992001
2003
Years
SP
I
SPI_Twente SPI_Vroomshoop SPI_Almelo SPI_Hengelo SPI_Enschede
Figure 6.5 SPI values of each station from the three summer months (July-September)

REMOTE SENSING ANALYSIS OF SUMMER TIME EVAPOTRANSPIRATION USING SEBS ALGORITHM
57
6.4. Hydrological drought
Hydrological drought refers to the effects of periods of precipitation shortfalls on surface and subsurface water supplies. The ground water level trend is analyzed for 6 piezometer wells to see the general response to the precipitation excess. (Refer chapter 3 section 3.2.1 for their geographic location). Detail of the magnitude of change in water table from the effects of the excess precipitation was not done. This is because other factors such as the distance to a local pumping wells, and aquifer and soil properties are not considered. Generally a seasonal fluctuation of ground water is seen in all of the studied wells in response to the precipitation and ET. In the hydrograph of B29C0075 the water level gets to rise after the year 1997. This is due to the reduction of abstraction of water from the pumping wells in Losser area but also reflects the response to the precipitation excess.
Hydrograph of well B28G0344 Almelo area (1995-2005)
1000
1050
1100
1150
1200
1250
1300
12/2
8/19
95
6/28
/199
6
12/2
8/19
96
6/28
/199
7
12/2
8/19
97
6/28
/199
8
12/2
8/19
98
6/28
/199
9
12/2
8/19
99
6/28
/200
0
12/2
8/20
00
6/28
/200
1
12/2
8/20
01
6/28
/200
2
12/2
8/20
02
6/28
/200
3
12/2
8/20
03
6/28
/200
4
12/2
8/20
04
Time (Days)
Hea
d (c
m N
.A.P
)
highest rainfall record October 1998
Fig.6.6a. Hydrograph of well B28G0344 Almelo

REMOTE SENSING ANALYSIS OF SUMMER TIME EVAPOTRANSPIRATION USING SEBS ALGORITHM
58
Hydrograph of well B28B0183 Vroomshoop area (1995-2005)
500
550
600
650
700
750
800
4/3/
1995
10/3
/199
5
4/3/
1996
10/3
/199
6
4/3/
1997
10/3
/199
7
4/3/
1998
10/3
/199
8
4/3/
1999
10/3
/199
9
4/3/
2000
10/3
/200
0
4/3/
2001
10/3
/200
1
4/3/
2002
10/3
/200
2
4/3/
2003
10/3
/200
3
4/3/
2004
10/3
/200
4
Time (days)
Hea
d (c
m N
.A.P
)
Fig. 6.6b. Hydrograph of Well B28B0183 Vroomshoop
Hydrograph of well B28D0265 Rijssen area (1995-2005)
600
650
700
750
800
850
900
950
1000
13/1
1/19
95
13/0
5/19
96
13/1
1/19
96
13/0
5/19
97
13/1
1/19
97
13/0
5/19
98
13/1
1/19
98
13/0
5/19
99
13/1
1/19
99
13/0
5/20
00
13/1
1/20
00
13/0
5/20
01
13/1
1/20
01
13/0
5/20
02
13/1
1/20
02
13/0
5/20
03
13/1
1/20
03
13/0
5/20
04
13/1
1/20
04
13/0
5/20
05
Time (days)
Hea
d (c
m N
.A.P
)
Fig. 6.6c. Hydrograph of Well B28D0265 Rijssen

REMOTE SENSING ANALYSIS OF SUMMER TIME EVAPOTRANSPIRATION USING SEBS ALGORITHM
59
Hydrograph of well B28H0428 Oldenzaal area (1995-2005)
3350
3400
3450
3500
3550
3600
3650
3700
Jun-
95
Dec
-95
Jun-
96
Dec
-96
Jun-
97
Dec
-97
Jun-
98
Dec
-98
Jun-
99
Dec
-99
Jun-
00
Dec
-00
Jun-
01
Dec
-01
Jun-
02
Dec
-02
Jun-
03
Dec
-03
Jun-
04
Dec
-04
Time (days)
Hea
d (c
m N
.A.P
)
Fig. 6.6d. Hydrograph of Well B28H0428 Oldenzaal
Hydrograph of Well B34F1402 Lonneker area (1995-2005)
4400
4450
4500
4550
4600
4650
4700
5/28
/199
5
11/2
8/19
95
5/28
/199
6
11/2
8/19
96
5/28
/199
7
11/2
8/19
97
5/28
/199
8
11/2
8/19
98
5/28
/199
9
11/2
8/19
99
5/28
/200
0
11/2
8/20
00
5/28
/200
1
11/2
8/20
01
5/28
/200
2
11/2
8/20
02
5/28
/200
3
11/2
8/20
03
5/28
/200
4
11/2
8/20
04
5/28
/200
5
Time (days)
Hea
d (c
m N
.A.P
)
Fig.6.6e. Hydrograph of Well B34F1402 Lonneker

REMOTE SENSING ANALYSIS OF SUMMER TIME EVAPOTRANSPIRATION USING SEBS ALGORITHM
60
Hydrograph of well B29C0075 Losser area (1995-2005)
3750
3800
3850
3900
3950
4000
4050
4100
4150
4200
1/15
/95
7/15
/95
1/15
/96
7/15
/96
1/15
/97
7/15
/97
1/15
/98
7/15
/98
1/15
/99
7/15
/99
1/15
/00
7/15
/00
1/15
/01
7/15
/01
1/15
/02
7/15
/02
1/15
/03
7/15
/03
1/15
/04
7/15
/04
1/15
/05
Time (days)
Hea
d (c
m N
.A.P
)
Fig.6.6f. Hydrograph of Well B29C0075 Losser Figure 6.6 Ground water level trends of the selected observation wells in the study area Comparison and correlation From the qualitative comparison between the precipitation excess (Figure 6.2) and the ground water level trend, the following observations are made: The ground water level response to the recent precipitation excess attenuated in about 2 weeks or less; the annual maximum depth to the water level occurred in late summer after the maximum ET rate for the area. This is mainly because the water levels in the studied wells are very shallow ranging in depth 0.5 to 2m that they are affected by the evapotranspiration during summer time due to their unconfined nature. As mentioned in Gehrels (1999) the excess or the deficit produce amplitude of around 1m in shallow wells of the Netherlands. This also reflected in the above piezometers. Even if the amplitude size differs, similar drop of the hydrographs observed in summer 2003 in all wells indicates the presence of drought at this time.

REMOTE SENSING ANALYSIS OF SUMMER TIME EVAPOTRANSPIRATION USING SEBS ALGORITHM
61
6.5. Temperature anomaly
In order to see deviation of mean temperature of summer months from the long-term mean temperature condition, temperature anomaly is developed the same way as SPI. Since temperature is one of the factors for the onset of drought formation this index can be used to quantify the drought. The anomaly expression stands as:
σ)( mi
anomaly
TTT
−= (6.5)
Where Ti is the seasonal mean temperature, Tm is the long-term seasonal mean and σ is standard deviation. The summer months in this case is considered from April to September.
Temperature anomaly of summer time (1975-2005)
-2.5
-2.0
-1.5
-1.0
-0.5
0.0
0.5
1.0
1.5
2.0
1975
1976
1977
1978
1979
1980
1981
1982
1983
1984
1985
1986
1987
1988
1989
1990
1991
1992
1993
1994
1995
1996
1997
1998
1999
2000
2001
2002
2003
2004
2005
Time(year)
ind
ex [
-]
Figure 6.7 Long-term mean departures of summer months of temperature for Twente station (1975-2005) The graph above shows the temperature condition of the study area for the last 30 years of summer time. The summer 2003 was relatively hot from the 30 year record followed by 1999 and 1992. The trend of mean temperature for the summer time also analysed as shown below in figure 6.8 & 6.9 for Twente and de Bilt meteorological stations respectively.

REMOTE SENSING ANALYSIS OF SUMMER TIME EVAPOTRANSPIRATION USING SEBS ALGORITHM
62
12.0
12.5
13.0
13.5
14.0
14.5
15.0
15.5
16.0
1975
1976
1977
1978
1979
1980
1981
1982
1983
1984
1985
1986
1987
1988
1989
1990
1991
1992
1993
1994
1995
1996
1997
1998
1999
2000
2001
2002
2003
2004
2005
Time (years)
Mea
n te
mpe
ratu
re (C
)
Figure 6.8 Trend of mean monthly summer time temperature from the Twente Airport station record (1975-2005)
11.5
12.0
12.5
13.0
13.5
14.0
14.5
15.0
15.5
16.0
197 5
1 97 6
197 7
1 97 8
1 979
198 0
1 98 1
1 982
198 3
1 98 4
1 985
198 6
1 98 7
1988
1 98 9
1 99 0
1991
1 99 2
1 993
1994
1 99 5
1 996
1997
1 99 8
1999
2000
2 00 1
2002
2003
2 004
2005
Time (years)
Mea
n Te
mpe
ratu
re (C
)
Figure 6.9 Trend of mean monthly summer time temperature from KNMI de Bilt station record (1975-2005) Both reflect the same general trend. The regression line shows that the weather is becoming warmer with annual increment of 0.0508C for Twente and 0.0456C for de Bilt station.

REMOTE SENSING ANALYSIS OF SUMMER TIME EVAPOTRANSPIRATION USING SEBS ALGORITHM
63
General Conclusions The SPI results show that the meteorological drought is better explained for the year 2003 with the time step of 12 months rather than that of three months of summer time. It is further shown that the year 1976, 1982, 1983 and 1991 experienced more dryness than the year 2003 with SPI of three months of summer time. Even though SPI has the advantages mentioned in section 6.3 and also most commonly used ones in many countries, the effective rainfall expressed in combination of rainfall and ET has found better to explain the summer 2003 drought event in the study area. The temperature index formulated for the present study also ascertain the relatively dryness of summer 2003 from the long term record. In addition similar drop of the hydrographs observed in late summer 2003 are indications of the deficit.

REMOTE SENSING ANALYSIS OF SUMMER TIME EVAPOTRANSPIRATION USING SEBS ALGORITHM
64
7. ET Results and discussions
This chapter is designed to analyse the findings and discuss the results of reference and AET of the study area. A comparison between the two conventional methods for reference ET estimation was made; the spatio-temporal variability of actual ET found using SEBS has also been analysed. The differences of ET estimation by using the two approaches of roughness height estimation and atmospheric effects are investigated. Even though there was no ground truth data for validation of the SEBS result, it is also attempted to compare and contrast with the two conventional approaches which are considered to be the upper limit of the remote sensing result. The reference ET method provides point estimates and is influenced by the surrounding microclimate. But the RS approach gives a spatial estimation with pixel size of 30m over a large area. Here on this study it is tried to compare the point estimates with three different spatial scales; the pixel where the weather station located (point-to-point), the spatial average of grass land and the spatial average of the whole catchment.
7.1. Comparison of Penman and Makkink equations
The reference daily evapotranspiration is computed based on Penman-Monteith formula (Allen et al., 1998) and modified Makkink equation (de Bruin and Lablans, 1998). Makkink’s equation requires only solar radiation and temperature data whereas the Penman-Monteith uses apart from the solar radiation and temperature the standard climatological records of humidity and wind speed. The equations and the meteorological parameters used are listed in appendix I. In figure 7.1 the time series daily ET value derived using these two approaches are depicted. The figure indicates that there is some outlier for the summer months in case of Penman estimation which is considered to be overestimation and also for the winter period mostly the Penman-Monteith results are systematically low compared to Makkink results of the same period. This result is similar to the previous findings in Hupselse Beek catchment (Weligepolage, 2005). Regardless of the minor differences explained above, the overall trend indicates that both approaches match reasonably well.

REMOTE SENSING ANALYSIS OF SUMMER TIME EVAPOTRANSPIRATION USING SEBS ALGORITHM
65
Figure 7.1 Time series Daily value of ETo using Penman and Makkink (2000-2005) For purpose of comparison, the Penman and Makkink result derived from meteorological daily data for the period 1995-2005 was aggregated into the daily average of ten years. In figure 7.2 to 7.5 the comparison made between the daily reference ET calculated using the two approaches are shown. The results are plotted for the periods April-June, July-September, November-January and the entire year. The regression line in figure 7.2 has a slope of 0.95 with a correlation coefficient of 0.97.

REMOTE SENSING ANALYSIS OF SUMMER TIME EVAPOTRANSPIRATION USING SEBS ALGORITHM
66
Scatter plot of Makkink versus Penman (April-June)
y = 0.9499x + 0.0068R2 = 0.9709
1.00
1.50
2.00
2.50
3.00
3.50
4.00
1.00 1.50 2.00 2.50 3.00 3.50 4.00
Penman (mmday-1)
Mak
kink
(mm
day-1
)
Figure 7.2 Comparison between Penman and Makkink for the spring months (April –June) For the summer months (July-September) the comparison shows a slope of 0.85 with the regression coefficient of 0.98.
Scatter plot of Makkink versus Penman (July-September)
y = 0.8526x + 0.2853R2 = 0.9805
1.00
1.50
2.00
2.50
3.00
3.50
4.00
1.00 1.50 2.00 2.50 3.00 3.50 4.00 4.50
Penman (mmday-1)
Mak
kink
(mm
day-1
)
Figure 7.3 Comparison between Penman and Makkink for the summer months (July –September)

REMOTE SENSING ANALYSIS OF SUMMER TIME EVAPOTRANSPIRATION USING SEBS ALGORITHM
67
In figure 7.4 a similar comparison is made for the winter months (November-January) in which a slope of 0.53 and a regression coefficient of 0.37 were attained.
Scatter plot of Makkink versus Penman (November-January)
y = 0.5356x + 0.1465R2 = 0.3658
0.00
0.10
0.20
0.30
0.40
0.50
0.60
0.70
0.00 0.10 0.20 0.30 0.40 0.50 0.60 0.70 0.80
Penman (mmday-1)
Mak
kink
(mm
day-1
)
Figure 7.4 Comparison between Penman vs. Makkink for the winter months (November-January) The comparison for the entire months (Fig. 7.5) illustrates that the correlation is better explained with R2=0.99 and the regression line slope of 0.94.
Scatter plot for the entire period
Y = 0.9419x + 0.0314R2 = 0.9913
0.00
0.50
1.00
1.50
2.00
2.50
3.00
3.50
4.00
0.00 0.50 1.00 1.50 2.00 2.50 3.00 3.50 4.00 4.50
Penman (mmday-1)
Mak
kink
(mm
day-1
)
Figure 7.5 Comparison between Penman vs. Makkink for the entire period

REMOTE SENSING ANALYSIS OF SUMMER TIME EVAPOTRANSPIRATION USING SEBS ALGORITHM
68
From the above result there is a fair agreement in all cases except during winter time. It is apparent that in the season with low net and global radiation i.e. in case of winter months the relationship between Makkink and Penman is low. Similar result was also found by de Bruin and Lablans (1998) for the five KNMI stations, namely de Bilt, Eelde, Den Helder, Vlissingen and Beek. The experiment carried out in Sinderhoeve (51o51’N, 5o45’E) centre of the Netherlands by Jacobs and van Boxel (1988b) was analysed in Jacobs and de Bruin (1998) and the result showed that the Makkink approach is better correlated with the actual evaporation measured with Bowen’s ratio energy budget technique. These considerations show that the Makkink formula is reliable for the ET estimation in the Netherlands as compared to the more complicated Penman-Monteith method.
7.2. Comparison of SEBS results to reference ET
The daily estimates of SEBS result are compared with the two conventional approaches for a common period. As mentioned above the comparison is targeted on three scales point-to-point, with the spatial average of grass land and also with spatial average of the whole catchment. The results are displayed in Table 7.1 which shows the spatial average of SEBS result is lower than the reference ET of the two approaches except slight increment in the months of August. The possible reason for this is the contribution of other vegetation species at this time; especially the maize is expected to be reaching a mature stage where evapotranspiration is to the maximum.
Table 7.1 Summary of SEBS estimates at different scale and the point estimate of reference ET As shown in figure 7.6 the comparison of SEBS estimate at the weather station pixel is satisfactory with the point estimate derived from the two approaches and systematically lowered for all of the image dates, as expected. The comparison made with the spatial average of the grass land with the point estimate also shows a good agreement. This comparison is done mainly starting from the definition point of view (Allen et al., 1998) reference ET is for a hypothetical grass with optimum water supply, extensive surface of green, completely shading the ground and albedo of about 0.23.

REMOTE SENSING ANALYSIS OF SUMMER TIME EVAPOTRANSPIRATION USING SEBS ALGORITHM
69
Comparison of SEBS ET with the reference ET estimates
0.00
0.50
1.00
1.50
2.00
2.50
3.00
3.50
4.00
4.50
5.00
Aug. 26 2000 May 25 2001 Aug. 16 2002 May 31 2003
image Days
ET
(mm
day-1
)
ET-Penman ET-Makkink ET-SEBS
Figure 7.6 Comparison of the reference ET with SEBS value at the station pixel.
7.3. Spatio-temporal analysis of SEBS derived actual ET
The spatial distribution of actual ET for the four days image is displayed in figure 7.8. In August 26, 2000 the ET ranges from a minimum of 0 mm day-1 in built up area to a maximum of ~5 mm day-1 for the forest and water bodies. The graph of evaporative fraction in figure 7.7a shows most of the pixels values ranges from 0.7-1.0. The lowest ranges (0-0.5) correspond to the built-up areas. The evaporative fraction value of 1 belongs to the forests. At this time the forests radiometric surface temperature was lower than the air temperature; which makes the actual sensible heat flux to be negative. In May 25, 2001 the ET rate ranges from 0 to 6 mm day-1. Similar to August 26, 2000 the water bodies have highest value but areas with low evaporative fraction are dominating. The graph in Figure 7.7b shows evaporative fraction of the study area for this date. The peak and near to zero values correspond to bare soils, built-up area and the maize fields. The figure also shows the evaporative fraction variation between the classes where clear spatial variation in AET is noticed in figure 7.8b. The forest evaporative fraction is lower at this time as compared to the grasslands. This is because forest has higher roughness values which cause more turbulence resulting in high sensible heat flux. The actual ET distribution of August 16, 2002 ranges from 1.7 to ~6 mmday-1. The highest value corresponds to the forest and water bodies whereas the lowest is found in built-up areas. The peak to 0.87 is typical of grassland and evaporative fraction of maize at this time ranges from 0.9 to 0.96. The highest value which is 1 belongs to the forest class.

REMOTE SENSING ANALYSIS OF SUMMER TIME EVAPOTRANSPIRATION USING SEBS ALGORITHM
70
In May 31, 2003 the value of ET ranges from minimum of zero to maximum of 6. The evaporative fraction graph and the ET result displayed in Figure 7.7d & 7.8d also shows the spatial variability of ET at this time. In reference to May 25, 2001 the distribution of AET was higher.
Evaporative fraction of August 26, 2000
0
50000
100000
150000
200000
250000
300000
350000
400000
4500000
0.03
0.06
0.09
0.12
0.15
0.18
0.21
0.24
0.27 0.3
0.33
0.36
0.39
0.42
0.45
0.48
0.51
0.54
0.57 0.6
0.63
0.66
0.69
0.72
0.75
0.78
0.81
0.84
0.87 0.9
0.93
0.96
0.99
Evaporative fraction (-)
No.
of p
ixel
s
Fig 7.7a. Histogram of evaporative fraction for August 26, 2000
Evporative fraction of May 25, 2001
0
50000
100000
150000
200000
250000
300000
350000
400000
450000
0.00
0.03
0.06
0.09
0.12
0.15
0.18
0.21
0.24
0.27
0.30
0.33
0.36
0.39
0.42
0.45
0.48
0.51
0.54
0.57
0.60
0.63
0.66
0.69
0.72
0.75
0.78
0.81
0.84
0.87
0.90
0.93
0.96
0.99
Evaporative fraction (-)
No.
of p
ixel
s
Fig 7.7b. Histogram of evaporative fraction for May 25, 2001

REMOTE SENSING ANALYSIS OF SUMMER TIME EVAPOTRANSPIRATION USING SEBS ALGORITHM
71
Evaporative fraction of August 16, 2002
0
50000
100000
150000
200000
250000
300000
350000
400000
450000
0.00
0.03
0.06
0.09
0.12
0.15
0.18
0.21
0.24
0.27
0.30
0.33
0.36
0.39
0.42
0.45
0.48
0.51
0.54
0.57
0.60
0.63
0.66
0.69
0.72
0.75
0.78
0.81
0.84
0.87
0.90
0.93
0.96
0.99
Evaporative fraction (-)
No.
of p
ixel
s
Fig 7.7c. Histogram of evaporative fraction for August 16, 2002
Evaporative fraction for may 31, 2003
0
50000
100000
150000
200000
250000
300000
350000
400000
450000
0.00
0.03
0.06
0.09
0.12
0.15
0.18
0.21
0.24
0.27
0.30
0.33
0.36
0.39
0.42
0.45
0.48
0.51
0.54
0.57
0.60
0.63
0.66
0.69
0.72
0.75
0.78
0.81
0.84
0.87
0.90
0.93
0.96
0.99
Evaporative fraction (-)
No.
of p
ixel
s
Fig 7.7d. Histogram of evaporative fraction for May 31, 2003 Figure 7.7 Histograms of the evaporative fractions

REMOTE SENSING ANALYSIS OF SUMMER TIME EVAPOTRANSPIRATION USING SEBS ALGORITHM
72
7.8a
7.8b
Projection System: Dutch RD Figure 7.8 Spatio-temporal distribution of AET derived using SEBS algorithm.

REMOTE SENSING ANALYSIS OF SUMMER TIME EVAPOTRANSPIRATION USING SEBS ALGORITHM
73
7.8c
7.8d
Projection System: Dutch RD Figure 7.8 Spatio-temporal distribution of actual ET derived using SEBS algorithm contd.

REMOTE SENSING ANALYSIS OF SUMMER TIME EVAPOTRANSPIRATION USING SEBS ALGORITHM
74
7.3.1. AET distribution based on SEBS related to major landuse at different time
0 1 2 3 4 5 6 70
1000
2000
3000
4000
5000
6000
7000
8000
9000
10000
11000
Num
ber
of p
ixel
s
a) Grass
0 1 2 3 4 5 6 70
1000
2000
3000
4000
5000
6000
7000
8000
9000
10000
11000
Num
ber
of p
ixel
s
b) Maize
0 1 2 3 4 5 6 70
1000
2000
3000
4000
5000
6000
7000
8000
9000
10000
11000
Num
ber o
f pix
els
c) Forest
0 1 2 3 4 5 6 70
1000
2000
3000
4000
5000
6000
7000
8000
9000
10000
11000
Num
ber
of p
ixel
s
d) Built-up area
Figure 7.9 Histogram of AET for different Landuse classes 26 August 2000.

REMOTE SENSING ANALYSIS OF SUMMER TIME EVAPOTRANSPIRATION USING SEBS ALGORITHM
75
0 1 2 3 4 5 6 70
1000
2000
3000
4000
5000
6000
7000
8000
9000
10000
11000
Num
ber
of p
ixel
s
a) Grass
0 1 2 3 4 5 6 70
1000
2000
3000
4000
5000
6000
7000
8000
9000
10000
11000
Num
ber
of p
ixel
s
b) Maize
0 1 2 3 4 5 6 70
1000
2000
3000
4000
5000
6000
7000
8000
9000
10000
11000
Num
ber
of p
ixel
s
c) Forest
0 1 2 3 4 5 6 70
1000
2000
3000
4000
5000
6000
7000
8000
9000
10000
11000
Num
ber
of p
ixel
s
d) Built-up area
Figure 7.10 Histogram of AET for different Landuse classes 25 May 2001.

REMOTE SENSING ANALYSIS OF SUMMER TIME EVAPOTRANSPIRATION USING SEBS ALGORITHM
76
0 1 2 3 4 5 60
1000
2000
3000
4000
5000
6000
7000
8000
9000
10000
11000
12000N
umbe
r of
pixe
ls
a) Grass
0 1 2 3 4 5 60
1000
2000
3000
4000
5000
6000
7000
8000
9000
10000
11000
Num
ber
of p
ixel
s
b) Maize
0 1 2 3 4 5 6 70
1000
2000
3000
4000
5000
6000
7000
8000
9000
10000
11000
Num
ber
of p
ixel
s
c) Forest
0 1 2 3 4 5 6 70
1000
2000
3000
4000
5000
6000
7000
8000
9000
10000
11000
Num
ber
of p
ixel
s
d) Built-up area
Figure 7.11 Histogram of AET for different Landuse classes 16 August 2002.

REMOTE SENSING ANALYSIS OF SUMMER TIME EVAPOTRANSPIRATION USING SEBS ALGORITHM
77
0 1 2 3 4 5 6value
0
1000
2000
3000
4000
5000
6000
7000
8000
9000
10000
11000
Num
ber o
f pix
els
a) Grass
0 1 2 3 4 5 60
1000
2000
3000
4000
5000
6000
7000
8000
9000
10000
11000
Num
ber
of p
ixel
s
b) Maize
0 1 2 3 4 5 6 70
1000
2000
3000
4000
5000
6000
7000
8000
9000
10000
11000
Num
ber o
f pix
els
c) Forest
0 1 2 3 4 5 6 70
1000
2000
3000
4000
5000
6000
7000
8000
9000
10000
11000
Num
ber
of p
ixel
s
d) Built-up area
Figure 7.12 Histogram of ET for different Landuse classes 31 May 2003.

REMOTE SENSING ANALYSIS OF SUMMER TIME EVAPOTRANSPIRATION USING SEBS ALGORITHM
78
Mean Meadian Stand. Dev. Mean Meadian Stand. Dev. Mean Meadian Stand. Dev. Mean Meadian Stand. Dev.
Grass Land 3.41 3.45 0.46 3.44 3.59 1..11 4.33 4.32 0.31 3.90 3.99 0.68
Maize 3.57 3.74 0.58 1.63 1.69 1.15 4.56 4.56 0.27 3.04 3.01 0.89
Forest 4.06 4.45 0.98 1.81 1.81 1.52 5.55 5.65 0.53 3.78 4.29 1.68
Water 3.88 3.92 0.48 5.10 5.26 1.09 4.76 4.73 0.46 4.81 4.76 0.43
Built-up-area 2.20 2.21 1.40 1.23 0.00 1.91 3.77 4.02 1.22 1.71 1.06 1.76
Heath 3.86 3.96 0.42 4.41 4.52 1.07 4.82 4.83 0.21 4.49 4.52 0.56
AET 8/16/2002 (mmday-1) AET 5/31/2003 (mmday-1)
Cover Type
AET 8/26/2000 (mmday-1) AET 5/25/2001(mmday-1)
Table 7.2 Summary of the spatial average of AET for different land covers for the four image days As shown in the histograms (7.9-7.12) and the figures in Table 7.2, the average AET over different landuse classes are significantly different from each other. The statistics in Table 7.2 shows that forests have highest AET record during August months. The evaporative fraction of water bodies was found lower than one. This attributes to the spatial average ET for water bodies in August months to be lower than the forest AET value. But during May when the net radiation is high the maximum evaporation is recorded on the water bodies. In all of the dates the minimum record is found in built up areas; the high standard deviation value for this class is a clear reflection of the shortcoming of aggregation of different cover types together.
7.4. Comparison between the SEBS result in different time
Having proper calibrated and atmospherically corrected images, it is possible to compare between years of specific months; In this case the general hypothesis is the differences of ET rate of the same months of different years arise from the climatic and soil moisture condition. In this section it is attempted to assess the differences of actual ET between the same months. Those variables which determine the magnitude of actual ET rate in SEBS are explained below.
Table 7.3 Main parameters governing evapotranspiration during satellite overpass time.
7.4.1. Comparison between August images
The histogram below shows the difference in ET between 16-August 2002 and 26-August 2000. The difference predominantly ranges from 0.5 to 1 mmday-1 except in built-up area go to 2-3 mmday-1. For

REMOTE SENSING ANALYSIS OF SUMMER TIME EVAPOTRANSPIRATION USING SEBS ALGORITHM
79
the evaluation of the differences of ET, the most important parameters are discussed in accord to the order of their importance; In comparison with August 2000 the daily net radiation for 16-August 2002 was higher, which contribute to high rates of evapotranspiration. The wind speed during the overpass time of 26-August 2000 is two times higher than 16-August 2002. This attributed to the higher value of frictional velocity determined in equation 5.11, which results higher estimation of actual sensible heat flux. The slight negative value of the histogram mainly comes from the overestimation of ET in Haaksbergen area due to thin cloud which we are not able to mask with the simple cloud detection method. The positive skewness of the histogram implies that highest evaporation was taken place during August 16, 2002.
-6 -5 -4 -3 -2 -1 0 1 2 3 4 5 6 70
2000
4000
6000
8000
10000
12000
14000
16000
Num
ber o
f pix
els
mmday-1
Statistics Mean Median S.d. Predominant value 1.10 0.95 0.77 0.78
Figure 7.13 Histogram of the difference in ET between 16-August 2002 and 26-August 2000
7.4.2. Comparison between May images
The histogram curve below shows the difference in ET between 31-May 2003 and 25-May 2001. The positive difference observed on mainly the maize field and the forests. During 25-May 2001 the temperature gradient was in general high; the higher temperature variation contributes to the increase in sensible heat flux for these classes whereby the evaporation at this time reduced. The negative value presented in the histogram is mainly the contribution of higher evaporation of water bodies during May 2001. This is mainly explained by the relative higher value of daily net radiation in May 2001 as presented in Table 7.3. And also higher ET values for grass land are observed in some places during May 25 2001 as compared to the May 2003.

REMOTE SENSING ANALYSIS OF SUMMER TIME EVAPOTRANSPIRATION USING SEBS ALGORITHM
80
-6 -5 -4 -3 -2 -1 0 1 2 3 4 5 6 70
2000
4000
6000
8000
10000
12000
14000
16000
Num
ber o
f pix
els
mmday-1
Statistics Mean Median S.d. Predominant value 0.84 0.54 1.38 0
Figure 7.14 Histogram of the difference in ET between 31-May 2003 and 25-May 2001
7.5. Comparative analysis of zom values
In most remote sensing studies the aerodynamic parameters are considered to be less significant in computation of ET. But in the cases of forests and built up areas literatures e.g. (Wieringa, 1993) reported higher values compared to the NDVI derived. In the same way the roughness estimation of very green but short vegetation like grass land and maize are overestimated. In this study the effect of zom value in the estimation of ET is analysed keeping all the remaining parameters unchanged. This investigation will show the relative importance of the roughness parameter on AET estimation. The simplified equation below used to expresses the change in percentage for the literature values and empirical relationship estimation.
( )%100*
ref
refnew
ET
ETETX
−= (7.1)
Where X= the percentage change in ET, ETnew is the newly computed value using the landuse map and ETref is the empirical relationship of NDVI (Su and Jacobs, 2001).

REMOTE SENSING ANALYSIS OF SUMMER TIME EVAPOTRANSPIRATION USING SEBS ALGORITHM
81
The table below shows the output of actual ET using the two approaches. The date of May 25, 2001 is selected for the analysis due to the high temperature variation observed which can explain well the effect of roughness estimation for the case of forest and August 26, 2000 for the maize field.
Table 7.4 Comparison of AET results using the two roughness estimation approach applied. From the table we can see that the outputs of the two approaches are significantly different each other. (The reader can refer the detail of two approaches in section 5.2.6). Considering forests, the roughness estimation based on Wieringa (1993) results more than 50% reduction in AET estimation. For maize the literature values (Jacobs and van Boxel, 1988a) has result ~ 50% increment whereas for the grass the percentage difference between the two is more than 100%. The difference of the outcome will be higher for the short vegetation if one makes the analysis using the relationship zom=exp (-5.2+5.3 NDVI) found in Bastiaanssen (1995).
7.6. Atmospheric effect on estimation of AET
The table below presents the effect of atmosphere in temperature and the consequence in estimation of AET in SEBS. A constant emissivity of 0.98 is assigned to all pixels to see only the effect of atmospheric correction. From the Table 7.5, at places where the increment in temperature is high for example built up area for this case, the difference in the output of AET is high even reaches up to 100%.
Class Coordinate T-TOA (C) T-surface (C) AET-before (mmday-1) AET-after (mmday-1)
Heath ( 232511.57, 488426.86) 21.4 23.8 4.52 3.67
Forest ( 226278.01, 482092.40) 16.1 17.2 5.12 4.84
Maize ( 243689.02, 467475.94) 16.4 17.5 4.56 4.24
Built up area ( 250847.76, 475605.55) 26.5 30.1 2.73 0.00
Water ( 254109.77, 466452.90) 17.6 19.0 4.29 4.49
Grass ( 250122.17, 486668.15) 20.5 22.7 4.12 2.99
Table 7.5 The difference AET found before and after atmospheric correction based on August 26, 2000 image

REMOTE SENSING ANALYSIS OF SUMMER TIME EVAPOTRANSPIRATION USING SEBS ALGORITHM
82
7.7. Deriving single crop coefficient (Kc) for Maize
The crop coefficient is the traditional concept that relates the water need of a particular crop to those of a reference crop e.g. (grass land and alfalfa). The single crop coefficient derived based on average AET of grass (Weligepolage, 2005) is used which is expressed as:
grassAETAverage
maizeAETK c = (7.2)
This method can help us to validate even the SEBS result by comparing the Kc value derived using
the above relation with the tabulated Kc values. The table 7.5 below presents the summary of the statistics for Kc of Maize found using equation 7.2.
Table 7.6 Summary of the Kc values at different growing stage for maize. The Kc map below shows that there is spatial similarity for August images but the variation of Kc value on a particular day is revealed for the case of May especially on 25 May 2001. The possible reason for this can be the differences in crop growing stage of Maize and also the crop stress due to shortage of water.

REMOTE SENSING ANALYSIS OF SUMMER TIME EVAPOTRANSPIRATION USING SEBS ALGORITHM
83
a. 26-August 2000 b. 25-May 2001
c. 16-August 2002
d. 31-May 2003
Figure 7.15 Crop coefficient of maize at different growing stage In order to verify the result found in the above calculation, an attempt was also made to compare the values with the tabulated Kc values for Dutch condition found in the paper by Jacobs and de Bruin (1998). The graph in Figure 7.16 shows the comparison between the calculated and the tabulated Kc values. The comparisons are in fair agreement except for the case of 25 May 2001. The above method which is normally called crop factor works only for unstressed crops (Allen et al., 1998). From the comparison made the Kc value for maize in May 31, 2003 indicates the crop is under optimal condition which fulfils for the values in the literature. The lower value found in the case of May 25, 2001 can be explained as follows:
• The maize field at this time may be sown late which then the result 0.47 found in the above table is comparable with the tabulated value of 0.5 in Jacobs and de Bruin (1998) or

REMOTE SENSING ANALYSIS OF SUMMER TIME EVAPOTRANSPIRATION USING SEBS ALGORITHM
84
• The maize faces a shortage of water at the early stage which also seen in forest area at this time.
comparison of single crop coefficient for Maize
0
0.2
0.4
0.6
0.8
1
1.2
1.4
Aug. 26 2000 May 25 2001 Aug. 16 2002 May 31 2003
Image days
Kc
valu
e (-
)
Kc-calculated Kc-tabulated
Figure 7.16 Comparison of Kc values for maize calculated with the literatures for different growth stage
7.8. Limitations
7.8.1. Sensible heat flux determination
The actual sensible heat flux determined in equation 5.12 is bounded in the range set of sensible heat flux at the wet limit Hwet (eqn. 5.25) and the Hdry (eqn. 5.23). The dry limit is the sensible heat flux that we can have from the available energy when we assume a completely dry area. In some places of built up areas this study has found normally a high temperature difference. The combination of this temperature difference with high roughness values makes the sensible heat flux to be much higher than Hdry derived from energy balance terms. It is also observed that the sensible heat flux at the wet limit for water bodies in all over the images and the short vegetation like grass land during August becomes higher than the actual sensible heat flux estimation. Usually the sensible heat flux in the water bodies has very low values, even to below zero. Coming to the wet limit, for objects with low roughness value like the water bodies and short vegetation the external resistance for the wet limit rew
is high which makes the second term in equation 5.25 to be low.
7.8.2. Landuse map
The zom map derived from the existing landuse had originally 10 m pixel size and resample to the pixel size of the Landsat images. Here on this case it is worth mentioning the limitation having a road in the roughness classification. Having lower roughness value for the road while being unable to get the actual surface temperature of roads in the 60m resolution of the thermal band, makes the evaporative fraction estimation of the roads to be higher and therefore ET is overestimated. This can

REMOTE SENSING ANALYSIS OF SUMMER TIME EVAPOTRANSPIRATION USING SEBS ALGORITHM
85
be distinctly seen in the spatial mean AET value of the built up area with the associated high standard deviation of all the cases. Besides using a constant roughness value for the images is also a large simplification, because the roughness increase and subsequently decrease throughout the growing season in accordance with the leaf development.
7.8.3. SLC-off images
Due to the limitation of getting good quality of images for the desired time, this research also applied the SLC-off images for the estimation of ET. It is basically arise from the hypothesis that the SLC-off image has the same radiometric quality as the previous scenes. The map displayed in figure 7.18 is the evapotranspiration of the study area for September 20, 2003 using Landsat 7 ETM+ SLC-off image. As can be seen from the map the quantification is unrealistic due to the figures found in built-up areas. This is because of the lower surface temperature value derived from the thermal band using the existing calibration coefficient of Landsat 7 ETM+. The evaporative fraction (Figure 7.17) also shows that most of the area is dominated by evaporative fraction of 1.0 as a result of lower estimation of temperature with this product. The evaporative fraction value ranging from 0.8-0.84 mostly belongs to water bodies.
Evaporative fraction of September 20, 2003
0
100000
200000
300000
400000
500000
600000
700000
800000
0
0.03
0.06
0.09
0.12
0.15
0.18
0.21
0.24
0.27 0.
3
0.33
0.36
0.39
0.42
0.45
0.48
0.51
0.54
0.57 0.
6
0.63
0.66
0.69
0.72
0.75
0.78
0.81
0.84
0.87 0.
9
0.93
0.96
0.99
Evaporative fraction (-)
No.
of
pixe
ls
Figure 7.17 Histogram of evaporative fraction for SLC-off image September 20, 2003

REMOTE SENSING ANALYSIS OF SUMMER TIME EVAPOTRANSPIRATION USING SEBS ALGORITHM
86
Projection system: Dutch RD Figure 7.18 Actual ET estimated using SEBS for 20 September 2003 of SLC-off images. As evidenced from the monthly effective rainfall depicted in figure 6.2, during August and September 2003 a total of 76mm deficit incurred where a rise in temperature is expected due to the resulting water stress.
AET (mmday-1)

REMOTE SENSING ANALYSIS OF SUMMER TIME EVAPOTRANSPIRATION USING SEBS ALGORITHM
87
8. Conclusions and Recommendations
8.1. Conclusions
The main objective of this study is to use SEBS technique for assessment and evaluation of daily actual evapotranspiration and to analyse the summer 2003 drought event. For this purpose four days of summer time Landsat ETM+ images, meteorological data, ground water record and data collected during field work were used. For watershed level, the spatial resolution of Landsat ETM+ and ASTER data is suitable for the spatial distribution of AET estimation. The low temporal frequency, the high cost and difficulties of getting good quality of images makes it difficult to use these data for drought analysis and evapotranspiration monitoring at growing stages. For the four images available, the output map of the SEBS result confirms the advantage of using these products for deriving the spatially distributed actual evapotranspiration on catchment level. By using the landuse based roughness height estimation together with properly calibrated and atmospherically corrected image this study has made improvements in the procedures to obtain AET. The input parameters conventionally used for roughness estimation (using NDVI) induce erroneous values of ET ranging from 20-100% depending on the landcover type and growing status of the vegetation and the empirical relationship used. The other factor in estimation of sensible heat flux is the accuracy of surface temperature. The MODIS product of water vapor and the emissivity map used in Mono-Window algorithm improved the estimation. From the investigation it can be concluded that surface temperature and aerodynamic resistance are extremely influential factors in the partition of available energy into the latent heat flux and sensible heat flux in SEBS model. These effects were especially observed for higher surface temperature and roughness bodies like buildings where almost in all cases the SEBS model produces zero value of ET. Even though there was no ground based AET for validation of the result, the comparison made with reference ET and Kc approach strengthen the validity of SEBS result for the present study. The comparisons made between point to point AET and with spatial average of grass land were satisfactory. The spatial average AET estimate is found slightly higher during 26, August 2000 and 16, August 2002 than the point estimate of reference ET. But the comparison made in 25, May 2001 shows significantly lower results. From the preliminary investigation of histogram result and the AET estimation using SLC-off product of 20, September 2003, the use of this product for quantification purpose looks risky due to unreliable temperature figures found in the thermal bands; but it may be hard to draw conclusion on the quality in general, unless further investigation on this product in different area or other period is tested. The two ground methods used to make daily time series estimate, Penman-Monteith and Makkink equations show very high correlation with linear relationship of R2=0.99 for the entire year. Although the correlation is high, there are times where the two approaches differ. As explained in de Bruin and

REMOTE SENSING ANALYSIS OF SUMMER TIME EVAPOTRANSPIRATION USING SEBS ALGORITHM
88
Lablans (1998) the Penman-Monteith method suffers from the so called ‘Bouchet’ effect during dry conditions, when there is a shortage of water the second term in Penman-Monteith which expresses the vapor deficit will be large, leading to overestimation of reference ET. The simplicity of the formula and the input required makes the Makkink approach to be suitable and commonly used for practical applications in Netherlands. Drought analysis is done using the 30 years meteorological data. And the ground water data since 1995. The analysis reveals that extreme drought in the study area is rare. The only year from the 30 year record which can be classified as extreme dry was 1976. All the methods applied for the analysis reflect to some extent to the drought condition in year 2003. The SPI results show that the meteorological drought for the year 2003 is better explained with the time step of 12 months than that of three months. For short time step analysis the monthly effective rainfall is found to give impression of the deficit occur during summer time as a consequence of high evapotranspiration. The seasonal fluctuation of the ground water level in the study area is observed which can give the message that the combinations of rainfall and evapotranspiration have direct effect for the water level in the study area. The summer temperature anomaly analysed in Twente and de Bilt KNMI weather stations give an indication to the rise of temperature ~0.05C annually since 1975. The peak of mean summer temperature in year 2003 is clear indication of the presence of hot and dry time in the study area. In general for Dutch conditions the indices which are a combination of rainfall and evapotranspiration for e.g. effective rainfall, cumulative departure from the mean of the precipitation excess best describes the severity of the drought.
8.2. Recommendations
� As anticipated, the result of using the landuse based values of roughness estimation, improved the determination of actual evapotranspiration. This will open the research possibility of using airborne laser altimeter data for roughness estimation to improve the model performance.
� To achieve a more accurate estimation of sensible heat flux and ET, field experiments using scintillometer and eddy correlation are recommended for the future.
� Being low cost, free of charge and their temporal coverage the coarse resolution images like MODIS and NOAA will provide paramount importance in estimation and monitoring of the evapotranspiration and drought at different stage in the study area. Especially for the drought event of year 2003 the satellite-based indicators can be best to quantify the spatial and temporal variation of the drought.
� The availability of continuous record of hydrological and meteorological data makes it possible in the near future to carry out a complete water balance and modelling in the study area whereby it can offer the possibility of validation of the remote sensing result.

REMOTE SENSING ANALYSIS OF SUMMER TIME EVAPOTRANSPIRATION USING SEBS ALGORITHM
89
References
Allen, R.G., Pereira, L.S., Raes, D. and Smith, M., 1998. Crop evapotranspiration : guidelines for computing crop water requirements. FAO irrigation and drainage paper, 56. FAO, 300 pp.
Bastiaanssen, W.G.M., 1995. Regionalization of surface flux densities and moisture indicators in composite terrain: a remote sensing approach under clear skies in Mediterranean climates. PhD Thesis, Wageningen Agricultural University, Wageningen, 273 pp.
Bastiaanssen, W.G.M., Menenti, M., Feddes, R.A. and Holtslag, A.A.M., 1998. A remote sensing surface energy balance algorithm for land (SEBAL). 1. Formulation. Journal of Hydrology, 212-213: 198-212.
Beljaars, A.C.M. and Holtslag, A.A.M., 1991. Flux Parameterization over land surfaces for atmospheric models. Journal of applied meteorology, 30: 814-829.
Brutsaert, W., 1982. Evaporation into the atmosphere : theory, history, and applications. Reidel Publishing, New York, 299 pp.
Brutsaert, W., 1999. Aspects of bulk atmospheric boundary layer similarity under free convective conditions. Reviews of Geophysics, 37(4): 439-451.
Campbell, G.S. and Norman, J.M., 1998. Introduction to environmental biophysics. Springer, New York, 286 pp.
Choudhury, B.J., Ahmed, N.U., Idso, S.B., Reginato, R.J. and Daughtry, C.S.T., 1994. Relations between evaporation coefficients and vegetation indices studied by model simulations. Remote Sensing of Environment, 50(1): 1-17.
De Bruin, H.A.R. and Lablans, W.N., 1998. Reference crop evapotranspiration determined with a modified Makkink equation. Hydrological Processes, 12(7): 1053-1062.
De Vries, A.C., Kustas, W.P., Ritchie, J.C., Klaassen, W., Menenti, M., Rango, A. and Prueger, J.H., 2003. Effective aerodynamic roughness estimated from airborne laser altimeter measurements of surface features. International Journal of Remote Sensing, 24(7): 1545 - 1558.
Dingman, 2002. Physical hydrology. Prentice Hall, 646 pp. Dusek, D.A., Jackson, R.D. and Musick, J.T., 1985. Winter wheat vegetation indices calculated from
combinations of seven spectral bands. Remote Sensing of Environment, 18(3): 255-267. Franca, G.B. and Cracknell, A.P., 1994. Retrieval of land and sea surface temperature using NOAA-
11 AVHRR data in north-eastern Brazil. International Journal of Remote Sensing, 15: 1695-1712.
French, A.N., Schmugge, T.J., Kustas, W.P., Brubaker, K.L. and Prueger, J., 2003. Surface energy fluxes over El Reno, Oklahoma, using high-resolution remotely sensed data. Water Resources Research, 39( 6): 1164-1175.
Gehrels, J.C., 1999. Ground water level fluctuations: separation of natural from antropogenic influences and determination of ground water in the Valuwe area. PhD Thesis, Vrije University, Amesterdam, 271 pp.
Gieske, A.S.M., 2003. Operational solutions of actual evapotranspiration. In: I.Simmers (Editor), Understanding water in a dry environment : hydrological processes in arid and semi arid zones, Rotterdam, pp. 65-114.
Gutman, G. and Ignatov, A., 1998. The derivation of the green vegetation fraction from NOAA/AVHRR data for use in numerical weather prediction models. International Journal of Remote Sensing, 19(8): 1533-1543.
Iqbal, M., 1983. introduction to solar radiation. Academic Press, Toronto, 390 pp. Jackson , R.D., Idso, S.B., Reginato, R.J. and Pinter, P.J., 1981. Canopy temperature as a crop water
stress indicator. Water Resources Research, 17(4): 1133-1138. Jackson , R.D., Kustas, W.P. and Choudhury, B.J., 1988. A reexamination of the crop water stress
index. Irrigation Science, 9: 309-317. Jacobs, A.F.G. and deBruin, H.A.R., 1998. Makkink's equation for evapotranspiration applied to
unstressed maize. Hydrological Processes, 12(7): 1063-1066.

REMOTE SENSING ANALYSIS OF SUMMER TIME EVAPOTRANSPIRATION USING SEBS ALGORITHM
90
Jacobs, A.F.G. and van Boxel, J.H., 1988a. Changes of the displacement height and roughness length of maize during a growing season. Agricultural and Forest Meteorology, 42(1): 53-62.
Jacobs, A.F.G. and van Boxel, J.H., 1988b. Computational parameter estimation for a Maize crop. Boundary-Layer Meteorology, 42: 265-279.
Jia, L., Su, Z., Hurk, B.V.d., Menenti, M., Moene, A., Bruin, H.A.R.D., Yrisarry, J.J.B., Ibanez, M. and Cuesta, A., 2003. Estimation of Sensible heat flux Using the surface energy Balance system (SEBS) and ATSR measurements. Physics and Chemistry of the earth, 28: 75-88.
Jin, X., Wan, L. and Su, Z., 2005. Research on evaporation of Taiyuan basin area by using remote sensing. Hydrology and Earth System Sciences Discussions, 2: 209-227.
Kite, G.W. and Droogers, P., 2000. Comparing evapotranspiration estimates from satellites, hydrological models and field data. Journal of Hydrology, 229(1-2): 3-18.
Kustas, W.P. and Daughtry, S.T., 1989. Estimation of the soil heat flux - net radiation ratio from spectral data. In: Agricultural and Forest Meteorology, 49(1990), pp. 205-223.
Liang, 2004. Quantitative remote sensing of land surfaces. Wiley Praxis series in Remote Sensing. Wiley & Sons, 534 pp.
Liang, S., 2001a. Atmospheric Correction of Landsat ETM+ Land Surface Imagery--Part 1: Methods. IEEE Transactions on Geoscience and Remote Sensing, 39(11): 2490-2498.
Liang, S., 2001b. Narrowband to broadband conversions of land surface albedo I: Algorithms. Remote Sensing of Environment, 76(2): 213-238.
Massman, W.J., 1999. A model study of kBH-1 for vegetated surfaces using 'localized near-field'
Lagrangian theory. Journal of hydrology, 223: 27-43. McKee, T.B., Doesken, N.J. and Klieist, J., 1995. Drought monitoring with multiple time scales., the
ninth conference on Applied climatology, pp. 233-236. Menenti, M. and Ritchie, J.C., 1994. Estimation of effective aerodynamic roughness of Wulnut Gulch
watershed with laser altimeter measurements. Water Resources Research, 30: 1329-1337. Minnema, B. and Snepvangers, J.J.J.C., 2004. Waterschap Regge en Dinkel Grondwatermodel en IR-
database ter ondersteuning van waterbeheer in Twente, Nederlands Instituut voor Toegepaste Geowetenschappen, Utrecht.
Norman, J.M., Kustas, W.P. and Humes, K.S., 1995. Source approach for estimating soil and vegetation energy fluxes in observations of directional radiomatric surface temperatures. Agricultural and Forest Meteorology, 77(3-4): 263-293.
Parodi, G., 2005. Introduction to atmospheric correction of Visible and thermal imagery: Basic text, Enschede, 58 pp.
Peters, S.W.M., 1995. Energy-and Water balance Modelling of A semi-arid area using remote sensing. PhD Thesis, Vrije Universiteit, Amsterdam, 256 pp.
Peterson, D.L., Spanner, M.A., Running, S.W. and Teuber, K.B., 1987. Relationship of thematic mapper simulator data to leaf area index of temperate coniferous forests. Remote Sensing of Environment, 22(3): 323-341.
Qin, Z., Karnieli, A. and Berliner, P., 2001. A mono-window algorithm for retrieving land surface temperature from Landsat TM data and its application to the Israel-Egypt border. International Journal of Remote sensing, 22(18): 3719-3746.
Richter, R., 2004. ATCOR for Imagine 8.7 user manual. Geosystems GmbH, Wessling, Germany, 200 pp.
Roerink, G.J., Su, Z. and Menenti, M., 2000. S-SEBI: A simple remote sensing Algorithm to estimate the Surface Energy Balance. Phys. Chem. Earth (B), 25(2): 147-157.
Sobrino, J., Coll, C. and Caselles, V., 1991. Atmospheric correction for land surface temperature using NOAA-11 AVHRR channels 4 and 5. Remote Sensing of Environment, 38(1): 19-34.
Sοnmez, F.K., Komuscu, A.U., Erkan, A. and Turgu, E., 2005. An Analysis of Spatial and temporal Dimension of Drought Vulnerability in Turkey Using the Standard Precipitation Index. Natural Hazards, 35: 243-264.
Su, Z., 2000. Remote sensing of land use and vegetation for mesoscale hydrological studies. International Journal of Remote sensing, 21(2): 213-233.

REMOTE SENSING ANALYSIS OF SUMMER TIME EVAPOTRANSPIRATION USING SEBS ALGORITHM
91
Su, Z., 2002. The Surface energy balance system (SEBS) for estimation of turbulent heat flux. Hydrology and Earth System Sciences, 6(1): 85-89.
Su, Z., 2005. Hydrological Applications of Remote Sensing: Surface fluxes and Other Derived Variables-Surface Energy Balance (Latent and Sensible heating, Net Radiation). In: M. Anderson (Editor), Ensyclopedia of Hydrological Sciences. John Wiley &Sons, Ltd., New Jersey.
Su, Z. and Jacobs, C., 2001. ENVISAT : actual evaporation. BCRS Report 2001 : USP-2 Report 2001. Publication of the National Remote sensing board (BCRS), Delft, 57 pp.
Su, Z., Schmugge, T., Kustas, W.P. and Massman, W.J., 2001.Evaluation of two models for estimation of the roughness height for heat transfer between the land surface and the atmosphere. In: Journal of applied meteorology, 40(2001)11, pp. 1933-1951.
Su, Z., Yacob, A., Wen, J., Roerink, G., He, Y., Gao, B., Boogaard, H. and van Diepen, C., 2003. Assessing relative soil moisture with remote sensing data: theory, experimental validation, and application to drought monitoring over the North China Plain. Physics and Chemistry of the Earth, Parts A/B/C, 28(1-3): 89-101.
Valor, E. and Caselles, V., 1996. Mapping land surface emissivity from NDVI: Application to European, African, and South American areas. Remote Sensing of Environment, 57(3): 167-184.
Weligepolage, K., 2005. Estimation of Spatial and Temporal Distribution of Evapotranspiration by Satellite Remote sensing, A case study in Hupselse Beek, The Netherlands. M.sc Thesis, ITC, Enschede, 114 pp.
Wieringa, J., 1993. Representative roughness parameters for homogeneous terrain. In: Boundary Layer Meteorology, 63(1993), pp. 323-363.
WMO, 1975. Drought and agriculture : report of the CAgM working group on the assessment of drought. WMO technical note
(WMO no. 138). World Meteorological Organization (WMO), Geneva, 127 pp. Yaoming, M. and Tsukamuto, O., 2002. Combining Satellite Remote Sensing with field observations
for land surface heat fluxes over inhomogeneous landscape. China Meteorological press, Beijing, 172 pp.

REMOTE SENSING ANALYSIS OF SUMMER TIME EVAPOTRANSPIRATION USING SEBS ALGORITHM
92
Appendices
Appendix A: ILWIS script for SEBS algorithm
//Calculation of latitude, longitude and solar zenith angle// map.mpr =B1/B1 Latitude.mpr := iff(b1>0,crdy(transform(mapcrd(b1),latlon)),0) Longitude.mpr := iff(b1>0,crdx(transform(mapcrd(b1),latlon)),0) Etmap:=map*et(da(DOY)) LAT.mpr{dom=VALUE.dom;vr=0.000:24.000:0.0001}:=OT+4*(Longitude)/60+Etmap/60
W.mpr{dom=VALUE.dom;vr=-4:4:0.0001}:=15*(LAT-12)*pi/180 decmap:=map*dec(da(DOY)) CSZ.mpr:=sin(Latitude*pi/180)*sin(decmap)+cos(Latitude*pi/180)*cos(decmap)*cos(W) //Conversion of narrow band to broad band (Liang, 2001) reflectance and biophysical parameters // Ro.mpr = 0.356*R1+0.13*R3+0.373*R4+0.085*R5+0.072*R7-0.0018 NDVI.mpr{dom=VALUE.dom;vr=-1.0000:1.0000:0.0001} = iff((R4 LE 0.1) and (R3=0),0,(R4-R3)/(R4+R3)) fc.mpr = 1-((NDVImax-NDVI)/(NDVImax-NDVImin))^0.625 LAI.mpr = ln(1-fc)/-0.5 // Surface Temperature calculations Mono-window algorithm// Rad6H.mpr{dom=VALUE.dom;vr=0.000:255.000:0.001} := ((12.65-3.2)/(255-1))*(b6H-1)+(3.2) Trad_6H.mpr{dom=VALUE.dom;vr=250.000:350.000:0.001} :=1282.71/ln((666.09/Rad6H)+1) Ta.mpr{dom=VALUE.dom;vr=250.0000:350.0000:0.0001} = 16.0110+0.92621*Tair*map b6ta.mpr{dom=VALUE.dom;vr=0.00:255.00:0.01} = 666.09/(exp(1282.71/Ta)-1) b6ts.mpr{dom=VALUE.dom;vr=0.000:250.000:0.001} = (rad6H-(1-�*(1+�*(1-emissivity))*b6ta))/(emissivity*�) T_surface=1282.71/ln((666.09/b6ts)+1) //Surface energy balance components// emm_air.mpr = 9.2e-6*(Tair+273.15)^2*map L_inc.mpr = 5.67e-8*emm_air*(Tair+273.15)^4 emissivity.mpr = 0.98*fc+0.96*(1-fc)+4*0.002*fc*(1-fc) L_out.mpr = emissivity*5.67e-8*T_surface^4 Kexo.mpr = 1367*E0(pi,DOY)*CSZ tau=828/kexo Knet.mpr = (1-Ro)*Kexo*tau Lnet.mpr = L_inc*emissivity-L_out Rn.mpr = Knet+Lnet Ws.mpr = Acos(-tan(Latitude*pi/180)*tan(decmap)) Kexoday.mpr:=24/pi*1367*0.0036*E0(pi,DOY)*sin(Latitude*pi/180)*sin(decmap)*(Ws-tan(Ws)) Kinc_day.mpr := 11.5741*((0.25+0.5*n/N)*Kexoday) Tau_day.mpr = Kinc_day/(11.5741*Kexoday)

REMOTE SENSING ANALYSIS OF SUMMER TIME EVAPOTRANSPIRATION USING SEBS ALGORITHM
93
Rnet_day.mpr = (1-1.1*Ro)*Kinc_day-110*Tau_day Go.mpr := Rn*(0.05+(1-fc)*(0.315-0.05)) Hdry.mpr := Rn-Go //Deriving the canopy height and displacement height from (Brutsaert, 1982)// hc.mpr = Zom/0.136 d.mpr :=2/3*hc //Similarity theory// Thetha_surf.mpr = T_surface*(101325/ps)^0.286 Thetha_v.mpr := (1+0.61*q)*Thetha_surf Uref.mpr = U10*((ln(100-d)-ln(zom))/(ln(10-d)-ln(zom)))*map t_c.mpr{dom=VALUE.dom;vr=0.000:10.000:0.001} = ln((100-d)/zoh)/ln((z-d)/zoh)*map t_pbla.mpr{dom=VALUE.dom;vr=250.000:350.000:0.001} = T_surface*(1-t_c)+T_air*t_c tetha_air=T_pbla*(101325/P)^0.286 delta_t.mpr{dom=VALUE.dom;vr=-20.000:40.000.0000:0.0001} = thetha_surf-Tetha_air //Computation of actual and wet limit sensible heat flux// //Iteration-1 setting initial condition to be neutral stability// Ustar_1.mpr := 0.41*Uref/ln((100-d)/zom) v.mpr:= 1.327e-05*(101325/P)*(Tair/273.15)^1.81*map Restar.mpr := 0.009*Ustar_1/v Ctstar.mpr := 0.71^-0.66*Restar^-0.5 Ustar_Uh.mpr := 0.32-(0.264*exp(-15.1*0.2*LAI)) nec.mpr:= 0.1*LAI/Ustar_Uh^2 deno.mpr = exp(-nec/2) term1.mpr = iff(deno=1,0,0.41*0.2*fc^2/(4*0.03*ustar_uh*(1-deno))) term2.mpr = iff(Zom=0,0,fc^2*fs^2*0.41*ustar_uh*(zom/hc)/ctstar) fs.mpr:= 1-fc term3.mpr:= (2.46*Restar^0.25-ln(7.4))*fs^2 kB.mpr :=term1+term2+term3 zoh.mpr := iff(Zom/exp(kB) LE 0.00001, 0.00001,Zom/exp(KB)) rah_1.mpr := ln((100-d)/Zoh) H_1.mpr:=Iff((delta_t)<0,0.01,(delta_t)*1013*ρair*ustar_1*0.41/rah_1) L.mpr:= -ρair *1013*Ustar_1^3*Thetha_V/(H_1*9.81*0.41) Lw.mpr:= -Ustar_1^3*ρair /((Rn-Go)/2450000*0.61*0.41*9.81) rew_1.mpr = ln((100-d)/zoh)/(0.41*Ustar_1) Hwet_1.mpr:= ((Rn-Go)-(1013*ρair /rew_1)*es-ea/0.067)/(1+�/γ) y_1.mpr := -(100-d)/L y_2.mpr = -zom/L x_1.mpr:= (y_1/0.33)^(1/3) x_2.mpr:= (y_2/0.33)^(1/3) phi_o.mpr = (-ln(0.33)+3^(1/2)*0.41*0.33^(1/3)*pi/6)*map phi_m1.mpr:=ln(0.33+y_1)-3*0.41*y_1^(1/3)+0.142*ln((1+x_1)^2/(1-x_1+x_1^2))+0.492*atan((2*x_1-1)/3^0.5)+phi_o

REMOTE SENSING ANALYSIS OF SUMMER TIME EVAPOTRANSPIRATION USING SEBS ALGORITHM
94
phi_m2.mpr :=ln(0.33+y_2)-3*0.41*y_2^(1/3)+0.142*ln((1+x_2)^2/(1-x_2+x_2^2))+0.492*atan((2*x_2-1)/3^0.5)+phi_o phi_h1.mpr := ((1-0.057)/0.78)*ln((0.33+y_1^0.78)/0.33) phi_h2.mpr:= ((1-0.057)/0.78)*ln((0.33+y_2^0.78)/0.33) Iteration-2 Ustar_2.mpr := Uref*0.41/(ln((100-d)/zom)-phi_m1+phi_m2) Restar.mpr := 0.009*Ustar_2/v Ctstar.mpr := 0.71^-0.66*Restar^-0.5 term2.mpr = iff(zom=0,0, fc^2*fs^2*0.41*ustar_uh*(zom/hc)/ctstar) term3.mpr:= (2.46*Restar^0.25-ln(7.4))*fs^2 kB.mpr :=term1+term2+term3 zoh.mpr := iff(Zom/exp(kB) LE 0.000001, 0.000001,Zom/exp(kB-1)) rah_2.mpr :=ln((100-d)/Zoh)-phi_h1+phi_h2 H_2.mpr :=iff((delta_t)<0,0.01,(delta_t)*1013*ρair *ustar_2*0.41/rah_2) L.mpr := -1013*ρair*Ustar_2^3*Thetha_V/(H_2*9.81*0.41) Lw.mpr := -Ustar_2^3*ρair/((Rn-Go)*0.41*9.81*0.61/2450000) yw1.mpr:= -(100-d)/Lw yw2.mpr = -zom/Lw xw1.mpr := (yw1/0.33)^(1/3) xw2.mpr := (yw2/0.33)^(1/3) phi_hw1.mpr := ((1-0.057)/0.78)*ln((0.33+yw1^0.78)/0.33) phi_hw2.mpr := ((1-0.057)/0.78)*ln((0.33+yw2^0.78)/0.33) rew_2.mpr =( ln((100-d)/zoh)-phi_hw1+phi_hw2)/(0.41*Ustar_2) Hwet_2.mpr := ((Rn-Go)- ρair*1013/rew_2*es-ea/0.067)/ (1+�/γ) y_1.mpr := -(100-d)/L y_2.mpr= -zom/L x_1.mpr:= (y_1/0.33)^(1/3) x_2.mpr := (y_2/0.33)^(1/3) phi_m1.mpr:=ln(0.33+y_1)-3*0.41*y_1^(1/3)+0.142*ln((1+x_1)^2/(1-x_1+x_1^2))+0.492*atan((2*x_1-1)/3^0.5)+phi_o phi_m2.mpr:=ln(0.33+y_2)-3*0.41*y_2^(1/3)+0.142*ln((1+x_2)^2/(1-x_2+x_2^2))+0.492*atan((2*x_2-1)/3^0.5)+phi_o phi_h1.mpr := ((1-0.057)/0.78)*ln((0.33+y_1^0.78)/0.33) phi_h2.mpr:= ((1-0.057)/0.78)*ln((0.33+y_2^0.78)/0.33) Determination of turbulent heat flux and actual evaporation Hwet.mpr = iff(Hweti<0,0,Hweti) Hi.mpr := iff(Hi-1>Hwet,Hi-1,Hwet) H.mpr := iff(Hi<Hdry,Hi,Hdry) LEwet.mpr = Rn-Go-Hwet EFr.mpr:= 1-((H-Hwet)/(Hdry-Hwet)) EF.mpr = EFr*LEwet/(Rn-Go) ETdaily.mpr := EF*Rnet_day/28.672

REMOTE SENSING ANALYSIS OF SUMMER TIME EVAPOTRANSPIRATION USING SEBS ALGORITHM
95
Appendix B: Twente Airport weather Station daily meteorological data (2000-2003)
YYYY U10 (m/s) Tmean(C) Tmin(C) Tmax(C) RF(mmday-1) RH(%) Rs( MJm-2) Penman (mmday-1) Makkinik(mmday-1)
1-Jan-00 2.8 4.9 2.7 7.4 1.9 96 1.70 0.17 0.212-Jan-00 3.8 5.9 2.5 8.1 0.0 98 1.91 0.11 0.243-Jan-00 6.3 7.5 6.6 8.6 3.5 93 1.63 0.38 0.224-Jan-00 4.5 6.3 4.4 8.7 12.0 94 1.65 0.29 0.215-Jan-00 3.9 4.2 1.4 6.4 0.0 87 4.26 0.14 0.516-Jan-00 5.0 7.0 4.0 9.4 2.7 87 2.69 0.45 0.357-Jan-00 4.6 6.5 5.2 7.7 0.0 88 1.90 0.47 0.258-Jan-00 5.0 5.8 2.7 6.9 0.7 89 1.82 0.43 0.239-Jan-00 1.3 0.9 -3.9 5.4 0.0 98 2.78 0.01 0.30
10-Jan-00 1.7 -1.0 -3.6 0.4 0.0 99 1.76 0.10 0.1711-Jan-00 4.6 0.7 -0.8 3.3 0.0 93 3.96 0.09 0.4112-Jan-00 5.5 1.1 -0.5 3.4 0.0 81 4.34 0.44 0.4613-Jan-00 3.5 1.5 -0.6 2.5 0.0 79 2.27 0.50 0.2514-Jan-00 1.7 2.3 1.2 3.4 0.0 90 1.86 0.25 0.2115-Jan-00 2.4 2.4 0.7 4.4 0.0 85 3.62 0.21 0.4016-Jan-00 3.4 4.9 1.5 6.6 0.6 96 1.91 0.21 0.2317-Jan-00 6.0 6.6 5.7 7.3 0.0 93 1.94 0.38 0.2518-Jan-00 6.9 6.0 3.6 7.9 1.0 79 1.97 0.97 0.2519-Jan-00 3.3 3.1 -1.1 5.0 0.2 85 2.00 0.44 0.2320-Jan-00 5.1 4.5 1.2 5.5 0.9 91 2.04 0.38 0.2521-Jan-00 5.1 4.7 3.1 6.3 0.5 84 2.65 0.60 0.3222-Jan-00 4.4 3.8 2.6 6.1 3.0 92 2.48 0.33 0.3023-Jan-00 3.0 -1.7 -9.7 2.7 0.9 84 3.85 0.27 0.3724-Jan-00 1.3 -4.7 -11.3 -1.0 0.0 78 3.88 0.18 0.3225-Jan-00 2.7 -0.4 -4.4 3.2 0.0 76 4.21 0.42 0.4226-Jan-00 4.0 1.9 0.6 3.6 0.7 92 2.26 0.32 0.2527-Jan-00 5.3 1.7 0.4 3.0 0.1 85 2.30 0.55 0.2528-Jan-00 6.6 2.0 -1.2 4.4 0.3 83 2.34 0.66 0.2629-Jan-00 9.5 7.8 4.0 10.0 28.6 90 2.38 0.64 0.3330-Jan-00 7.2 7.9 5.9 10.2 3.9 80 3.30 1.06 0.4531-Jan-00 7.6 9.6 8.3 11.0 3.1 85 3.16 0.92 0.451-Feb-00 6.3 8.7 7.3 10.2 1.1 80 3.02 1.05 0.422-Feb-00 5.4 6.7 4.3 8.6 4.8 87 4.61 0.57 0.603-Feb-00 4.6 6.3 3.1 9.0 0.3 82 5.06 0.68 0.654-Feb-00 6.4 6.8 3.2 8.5 5.4 92 2.66 0.48 0.355-Feb-00 5.2 8.4 6.4 10.9 0.0 75 6.23 1.08 0.856-Feb-00 5.0 7.8 6.0 9.1 0.5 78 3.15 1.01 0.427-Feb-00 7.2 7.6 6.1 8.9 5.0 85 4.78 0.81 0.648-Feb-00 7.8 8.2 5.2 11.1 7.2 79 2.87 1.23 0.399-Feb-00 7.5 5.5 2.0 7.5 1.3 76 3.50 1.13 0.44
10-Feb-00 6.8 6.0 3.0 8.8 7.7 80 4.40 0.99 0.5611-Feb-00 4.3 4.0 0.4 8.2 0.0 81 8.49 0.68 1.0112-Feb-00 6.2 4.0 1.9 7.6 4.9 83 4.82 0.80 0.5813-Feb-00 5.5 4.7 2.3 7.8 0.0 81 6.36 0.83 0.7814-Feb-00 3.9 3.7 -1.4 6.9 3.4 86 8.14 0.52 0.9615-Feb-00 4.4 6.5 4.0 9.5 0.2 82 4.70 0.84 0.6116-Feb-00 5.7 2.4 0.1 5.7 9.1 87 6.39 0.60 0.7317-Feb-00 3.5 1.5 0.2 4.2 7.6 94 4.34 0.36 0.4818-Feb-00 4.3 3.3 0.6 6.2 5.1 94 3.45 0.41 0.4119-Feb-00 4.8 4.0 2.2 5.2 4.4 92 3.87 0.48 0.4720-Feb-00 2.7 1.2 -5.4 7.4 0.0 80 8.59 0.65 0.9221-Feb-00 2.4 0.9 -5.8 5.7 0.2 87 7.15 0.49 0.7622-Feb-00 3.2 2.8 -3.0 7.6 0.0 91 4.90 0.49 0.5623-Feb-00 2.1 4.0 -4.2 9.0 0.0 84 9.67 0.64 1.1524-Feb-00 5.0 7.1 3.2 9.6 8.7 82 4.46 0.94 0.5925-Feb-00 3.5 3.5 0.2 9.0 14.9 83 8.54 0.80 1.0026-Feb-00 3.1 3.9 0.1 8.8 0.0 77 10.20 0.94 1.2127-Feb-00 5.1 7.0 -0.5 11.7 0.0 67 10.46 1.55 1.3828-Feb-00 6.6 9.2 4.5 12.7 2.7 79 4.13 1.31 0.5829-Feb-00 7.0 6.5 4.0 9.1 6.4 83 5.62 1.04 0.73

REMOTE SENSING ANALYSIS OF SUMMER TIME EVAPOTRANSPIRATION USING SEBS ALGORITHM
96
Appendix B contd.
1-Mar-00 5.3 5.1 1.8 7.8 2.1 85 8.54 0.87 1.072-Mar-00 6.6 3.8 0.5 6.7 6.2 85 6.42 0.84 0.763-Mar-00 7.3 6.3 2.0 9.0 18.4 83 5.74 1.03 0.754-Mar-00 5.5 0.8 -1.5 4.1 2.0 88 9.34 0.68 0.995-Mar-00 3.8 2.0 -1.3 5.4 0.6 87 6.30 0.68 0.706-Mar-00 6.8 5.9 2.6 8.0 0.0 79 6.21 1.18 0.797-Mar-00 7.4 9.1 7.1 13.1 3.6 88 5.66 1.04 0.798-Mar-00 7.2 10.8 9.0 13.0 10.0 93 4.79 0.78 0.709-Mar-00 8.2 9.9 3.9 13.0 12.1 85 4.86 1.15 0.70
10-Mar-00 3.5 6.1 1.0 8.9 1.6 79 8.70 1.09 1.1111-Mar-00 6.4 8.1 5.6 10.4 3.2 86 5.82 1.04 0.7912-Mar-00 2.4 7.2 4.8 9.6 1.4 84 5.40 0.89 0.7113-Mar-00 4.0 8.2 4.6 12.1 0.1 87 7.04 1.00 0.9614-Mar-00 5.5 7.3 2.7 9.8 5.9 88 5.46 0.88 0.7315-Mar-00 6.1 4.8 1.3 7.5 2.8 79 8.42 1.21 1.0316-Mar-00 5.0 7.3 6.2 8.2 0.2 90 5.41 0.82 0.7217-Mar-00 4.8 7.8 6.6 9.5 0.0 88 5.49 0.93 0.7418-Mar-00 3.4 5.5 1.8 7.2 1.1 91 5.79 0.73 0.7219-Mar-00 2.5 4.5 -0.9 9.2 0.0 85 11.18 1.06 1.3520-Mar-00 1.0 4.7 -1.5 9.3 0.0 88 7.21 0.83 0.8821-Mar-00 0.6 6.0 -0.6 9.3 0.0 83 5.80 0.81 0.7422-Mar-00 1.1 6.1 -2.6 15.9 0.0 80 16.00 1.55 2.0523-Mar-00 2.0 6.8 -2.1 14.3 0.0 80 13.72 1.47 1.8024-Mar-00 2.6 8.8 6.8 11.1 7.2 90 6.04 0.93 0.8425-Mar-00 3.0 9.0 6.5 13.2 6.2 89 6.86 1.04 0.9626-Mar-00 2.8 6.4 1.7 11.1 2.3 83 11.54 1.31 1.5027-Mar-00 4.0 5.7 2.2 10.7 5.7 87 9.42 1.11 1.2028-Mar-00 4.6 3.5 2.7 4.3 0.5 90 6.36 0.77 0.7529-Mar-00 5.9 5.5 3.9 7.3 0.1 88 6.44 0.94 0.8130-Mar-00 4.2 6.2 4.9 7.6 0.0 87 6.52 0.99 0.8431-Mar-00 1.3 5.8 3.8 8.4 0.0 85 7.39 1.00 0.94
1-Apr-00 1.8 6.4 2.3 10.5 4.2 87 9.62 1.15 1.252-Apr-00 2.6 8.5 1.1 14.0 0.0 81 8.65 1.35 1.203-Apr-00 3.3 11.9 5.8 19.3 0.1 66 15.17 2.65 2.324-Apr-00 4.4 11.0 4.6 16.9 6.0 75 11.06 2.04 1.655-Apr-00 5.4 3.7 -2.0 7.0 0.0 68 9.51 1.60 1.136-Apr-00 2.5 3.9 -4.1 11.3 0.0 74 16.40 1.72 1.947-Apr-00 2.4 5.3 -2.4 13.3 0.0 73 18.43 1.99 2.288-Apr-00 1.3 5.9 -3.0 11.8 0.0 71 12.85 1.57 1.639-Apr-00 4.8 7.8 3.6 13.7 0.0 67 20.58 2.68 2.78
10-Apr-00 3.9 4.7 -1.1 10.2 0.0 62 21.38 2.41 2.6211-Apr-00 1.8 6.3 -3.1 13.1 0.0 72 16.98 1.97 2.2112-Apr-00 4.1 6.6 3.4 11.0 1.4 75 11.59 1.76 1.5313-Apr-00 4.7 5.3 3.0 8.1 10.1 86 9.88 1.22 1.2514-Apr-00 3.0 5.5 0.2 10.9 4.4 87 12.73 1.39 1.6215-Apr-00 4.0 8.7 1.8 14.6 4.2 80 11.15 1.72 1.5616-Apr-00 4.9 9.0 5.6 13.1 0.3 64 15.17 2.64 2.1417-Apr-00 5.1 11.1 7.3 15.9 0.8 70 13.89 2.60 2.0718-Apr-00 3.6 11.0 7.4 15.3 0.0 69 13.53 2.42 2.0119-Apr-00 2.3 12.8 6.1 18.8 0.0 68 14.14 2.48 2.2020-Apr-00 3.0 14.2 8.8 20.1 0.0 61 20.42 3.50 3.2721-Apr-00 2.5 14.1 7.4 19.2 0.0 64 16.67 2.92 2.6722-Apr-00 2.6 15.2 9.8 22.3 0.7 70 11.21 2.52 1.8423-Apr-00 1.4 13.5 10.4 16.8 10.0 94 8.97 1.43 1.4224-Apr-00 2.5 10.9 7.1 15.5 0.0 81 11.56 1.84 1.7125-Apr-00 2.8 13.9 6.5 20.2 0.0 65 22.29 3.50 3.5526-Apr-00 3.3 15.9 8.8 24.7 0.0 68 22.29 3.94 3.7227-Apr-00 3.0 17.4 7.9 23.2 0.0 72 13.72 2.82 2.3628-Apr-00 1.6 18.6 11.1 24.1 0.0 70 15.89 2.99 2.8029-Apr-00 2.2 12.9 11.8 15.3 5.1 94 8.70 1.37 1.3530-Apr-00 1.0 12.8 11.3 14.4 0.0 93 8.76 1.43 1.35

REMOTE SENSING ANALYSIS OF SUMMER TIME EVAPOTRANSPIRATION USING SEBS ALGORITHM
97
Appendix B contd.
1-May-00 2.6 12.6 9.3 16.1 0.0 92 9.00 1.42 1.382-May-00 3.0 11.1 9.0 13.3 0.8 95 8.88 1.24 1.313-May-00 2.4 12.4 9.8 16.9 1.2 95 10.02 1.45 1.534-May-00 2.9 14.7 10.5 21.6 0.0 82 16.74 2.71 2.715-May-00 2.7 17.8 8.6 24.4 0.0 57 25.73 4.61 4.456-May-00 3.3 19.1 11.3 25.9 0.0 56 25.52 5.05 4.537-May-00 2.8 18.3 13.0 26.2 6.7 67 20.91 4.12 3.668-May-00 1.7 18.0 12.0 23.6 0.0 74 17.71 3.18 3.089-May-00 1.2 19.0 9.6 25.9 0.0 71 23.57 3.98 4.18
10-May-00 2.1 19.9 11.3 27.0 0.0 63 22.77 4.35 4.1011-May-00 3.4 17.9 9.7 25.2 0.0 62 26.08 4.80 4.5212-May-00 3.9 16.8 11.1 23.1 0.0 60 25.47 4.75 4.3113-May-00 3.3 16.8 9.0 23.7 0.0 49 26.36 5.09 4.4614-May-00 1.2 18.8 10.5 27.6 0.0 56 27.26 4.73 4.8015-May-00 1.0 20.2 10.2 29.2 0.0 55 26.82 4.77 4.8616-May-00 2.5 21.2 11.7 29.3 10.1 62 22.13 4.68 4.0917-May-00 4.0 14.5 9.7 17.9 5.0 76 14.50 2.67 2.3418-May-00 4.1 11.3 5.9 15.9 1.5 72 15.73 2.67 2.3619-May-00 3.5 9.9 7.4 14.3 6.8 87 13.07 1.84 1.8920-May-00 2.7 9.9 2.7 15.8 0.6 81 16.85 2.32 2.4321-May-00 1.4 9.2 1.1 14.1 4.1 92 11.01 1.55 1.5622-May-00 1.7 11.3 5.4 16.4 4.8 88 12.24 1.85 1.8323-May-00 3.0 14.0 4.0 18.7 1.1 79 15.66 2.55 2.5024-May-00 2.6 14.3 11.7 18.3 10.7 88 12.53 2.07 2.0125-May-00 5.2 13.4 8.9 16.2 4.3 80 16.57 2.61 2.6126-May-00 3.0 14.2 8.0 18.3 0.0 66 16.42 3.10 2.6327-May-00 6.0 12.5 7.7 17.6 5.3 68 19.29 3.47 2.9828-May-00 7.0 10.5 8.1 15.5 4.1 77 11.69 2.36 1.7229-May-00 4.3 9.5 6.1 14.2 3.3 84 16.98 2.21 2.4230-May-00 1.5 9.7 4.3 16.1 1.7 84 15.41 2.18 2.2031-May-00 1.2 12.1 5.6 18.5 0.0 72 21.75 3.18 3.31
1-Jun-00 3.1 15.9 6.6 20.7 0.2 77 12.02 2.45 2.002-Jun-00 2.9 16.9 10.0 23.1 0.0 81 23.29 3.71 3.963-Jun-00 2.4 17.3 9.8 23.0 9.5 87 18.63 3.02 3.194-Jun-00 2.9 17.4 9.8 22.4 0.9 83 17.03 2.94 2.925-Jun-00 2.7 13.3 11.2 16.3 7.7 93 12.34 1.83 1.936-Jun-00 3.3 12.1 8.3 15.9 1.8 92 14.01 1.91 2.137-Jun-00 3.4 12.1 4.8 17.8 2.6 89 18.57 2.42 2.828-Jun-00 2.2 14.7 2.7 21.0 0.0 68 29.35 4.35 4.759-Jun-00 2.9 22.3 12.9 29.9 1.1 63 27.94 5.69 5.26
10-Jun-00 2.2 18.7 14.1 22.3 0.0 82 15.33 2.87 2.7011-Jun-00 2.3 16.1 9.9 21.6 0.0 71 22.41 3.79 3.7412-Jun-00 3.6 16.3 10.2 21.7 0.0 76 22.85 3.77 3.8213-Jun-00 3.0 17.6 12.7 24.2 0.0 83 21.62 3.60 3.7214-Jun-00 3.0 17.5 14.2 21.3 0.6 86 11.23 2.22 1.9315-Jun-00 3.8 14.8 7.3 19.9 1.2 76 19.15 3.19 3.1016-Jun-00 2.5 10.9 3.1 17.6 0.0 72 21.87 3.15 3.2117-Jun-00 0.8 12.8 1.6 20.9 0.0 66 28.75 4.09 4.4318-Jun-00 1.8 19.9 8.6 28.5 0.0 61 27.30 5.09 4.9119-Jun-00 2.7 24.6 12.2 32.6 0.0 55 29.39 6.40 5.7220-Jun-00 2.3 25.7 15.6 33.4 0.0 58 29.39 6.39 5.8221-Jun-00 4.0 22.5 15.8 27.4 1.2 65 18.96 4.63 3.5822-Jun-00 3.5 17.3 14.3 21.5 0.4 72 14.37 3.19 2.4723-Jun-00 4.5 15.8 12.2 19.8 2.0 77 15.62 3.00 2.5924-Jun-00 3.8 13.1 10.5 17.2 7.1 85 13.94 2.25 2.1825-Jun-00 3.8 12.3 9.9 16.4 0.9 81 12.06 2.18 1.8426-Jun-00 4.0 11.9 4.9 16.7 0.0 72 16.83 2.83 2.5427-Jun-00 3.1 12.2 4.7 18.0 0.0 68 20.76 3.31 3.1628-Jun-00 3.3 12.1 4.3 17.2 0.0 69 15.14 2.75 2.3029-Jun-00 3.0 12.3 6.5 17.6 0.0 71 16.36 2.84 2.5030-Jun-00 1.8 13.1 6.8 19.3 0.0 70 18.40 3.04 2.87

REMOTE SENSING ANALYSIS OF SUMMER TIME EVAPOTRANSPIRATION USING SEBS ALGORITHM
98
Appendix B contd.
1-Jul-00 0.8 12.4 4.0 16.2 6.4 90 11.15 1.81 1.712-Jul-00 1.3 18.6 11.0 24.6 0.2 79 16.70 3.08 2.943-Jul-00 1.7 19.1 11.6 24.9 2.7 82 16.05 3.00 2.864-Jul-00 2.0 17.7 9.8 24.5 11.5 83 15.40 2.82 2.675-Jul-00 2.6 16.1 14.6 19.0 2.2 92 10.66 1.86 1.786-Jul-00 2.6 16.1 11.8 21.6 0.3 77 22.90 3.72 3.827-Jul-00 4.2 13.2 6.1 18.5 0.0 76 13.67 2.56 2.148-Jul-00 2.8 12.5 5.9 17.7 0.1 84 14.45 2.25 2.229-Jul-00 4.1 13.3 12.2 14.0 1.8 93 10.15 1.54 1.60
10-Jul-00 5.4 14.9 11.9 17.8 12.8 83 16.80 2.70 2.7611-Jul-00 4.6 13.7 11.4 18.2 1.6 86 13.32 2.21 2.1212-Jul-00 3.9 12.2 6.2 17.9 0.4 77 18.72 2.87 2.8613-Jul-00 2.9 13.4 7.7 16.0 4.1 93 10.03 1.56 1.5814-Jul-00 2.9 13.2 10.4 15.8 6.8 90 13.00 1.95 2.0415-Jul-00 3.0 12.7 10.1 16.7 9.2 88 13.95 2.09 2.1616-Jul-00 2.6 14.2 11.4 18.4 0.8 85 13.50 2.26 2.1717-Jul-00 2.5 13.5 11.8 16.0 0.2 88 10.09 1.75 1.5918-Jul-00 3.1 13.0 9.2 16.3 0.4 81 11.63 2.08 1.8119-Jul-00 3.8 14.8 10.2 17.3 0.4 84 11.39 2.07 1.8520-Jul-00 3.3 16.5 12.0 21.7 0.0 74 19.74 3.51 3.3221-Jul-00 3.6 15.9 12.4 21.2 0.0 70 23.55 4.03 3.9122-Jul-00 2.1 15.8 13.1 22.0 6.5 89 12.99 2.22 2.1523-Jul-00 2.0 16.1 12.4 22.0 0.0 87 16.98 2.74 2.8424-Jul-00 3.1 18.1 12.9 25.1 3.1 83 15.17 2.87 2.6525-Jul-00 2.3 17.5 13.8 21.6 1.7 91 11.66 2.06 2.0226-Jul-00 2.2 16.4 13.8 20.2 0.0 89 10.27 1.89 1.7327-Jul-00 1.4 17.6 14.0 22.8 8.2 82 12.11 2.33 2.0928-Jul-00 1.9 15.1 13.0 19.2 10.7 95 10.16 1.66 1.6629-Jul-00 0.7 14.8 10.5 19.9 0.1 96 10.30 1.74 1.6730-Jul-00 1.8 15.8 9.8 21.0 0.0 90 13.96 2.23 2.3131-Jul-00 1.0 17.1 10.7 22.8 0.0 81 17.40 2.89 2.961-Aug-00 2.5 20.9 14.4 27.8 18.3 72 17.67 3.70 3.242-Aug-00 3.4 18.1 15.3 22.2 2.6 81 17.02 3.06 2.973-Aug-00 3.1 17.6 12.1 23.0 0.0 73 18.55 3.44 3.204-Aug-00 1.3 15.8 9.8 23.4 0.0 85 15.54 2.55 2.585-Aug-00 1.3 15.8 9.3 21.7 0.0 82 19.22 2.96 3.186-Aug-00 2.1 17.2 9.4 24.1 0.0 82 16.59 2.82 2.837-Aug-00 1.7 16.6 10.7 22.1 0.0 83 15.60 2.59 2.638-Aug-00 2.4 15.9 9.4 23.1 0.0 86 13.38 2.28 2.229-Aug-00 1.0 16.4 8.1 23.3 0.0 80 16.08 2.64 2.70
10-Aug-00 3.2 18.6 17.1 21.2 0.8 85 9.03 2.00 1.5911-Aug-00 1.5 17.8 10.2 22.9 0.0 83 11.89 2.19 2.0612-Aug-00 1.3 17.1 10.5 23.9 0.0 81 22.24 3.42 3.8013-Aug-00 1.5 20.5 10.0 27.8 0.0 71 20.88 3.73 3.8014-Aug-00 1.8 22.2 15.4 28.2 0.0 72 14.15 3.08 2.6515-Aug-00 3.1 19.2 11.4 24.2 0.0 81 12.20 2.47 2.1716-Aug-00 2.8 17.9 11.8 23.9 1.8 78 14.10 2.72 2.4517-Aug-00 3.7 18.1 10.0 23.9 8.1 78 18.09 3.16 3.1618-Aug-00 2.0 17.2 11.0 22.4 1.1 73 15.50 2.78 2.6519-Aug-00 2.1 18.6 14.8 23.0 6.5 84 11.48 2.19 2.0220-Aug-00 1.9 18.3 14.6 23.1 11.5 81 16.52 2.80 2.8921-Aug-00 1.7 14.9 12.0 19.6 1.2 83 11.44 1.96 1.8622-Aug-00 1.4 14.1 8.6 21.4 0.0 86 11.66 1.88 1.8623-Aug-00 2.3 14.4 6.9 20.8 0.0 75 21.23 3.03 3.4124-Aug-00 2.2 15.2 6.5 23.2 0.0 71 20.57 3.19 3.3625-Aug-00 1.3 16.4 10.9 22.0 0.0 80 11.49 2.03 1.9326-Aug-00 3.6 18.9 11.6 25.3 0.0 65 19.73 3.89 3.4927-Aug-00 2.0 16.5 14.4 18.7 21.3 95 7.51 1.30 1.2728-Aug-00 2.6 15.0 8.8 21.2 0.0 86 11.46 1.88 1.8729-Aug-00 2.0 13.3 7.5 19.7 7.9 91 13.26 1.80 2.0830-Aug-00 1.3 13.1 5.6 20.2 0.0 85 16.62 2.21 2.5931-Aug-00 1.4 13.4 6.3 20.4 0.0 85 17.46 2.30 2.75

REMOTE SENSING ANALYSIS OF SUMMER TIME EVAPOTRANSPIRATION USING SEBS ALGORITHM
99
Appendix B contd.
1-Sep-00 3.0 14.2 9.3 20.0 2.0 89 8.57 1.48 1.382-Sep-00 2.9 13.7 11.5 17.2 9.5 93 9.04 1.34 1.443-Sep-00 3.6 13.6 10.6 16.4 2.1 90 8.66 1.38 1.374-Sep-00 2.0 13.1 7.6 17.0 1.0 87 9.81 1.49 1.535-Sep-00 2.5 14.6 9.6 18.8 0.0 83 10.38 1.74 1.686-Sep-00 4.7 13.9 10.0 16.4 7.8 90 7.57 1.29 1.217-Sep-00 4.5 15.1 12.4 18.9 6.3 84 9.35 1.80 1.538-Sep-00 4.5 16.7 13.4 18.9 0.6 92 6.60 1.24 1.129-Sep-00 2.3 17.4 14.1 19.6 0.0 96 6.52 1.11 1.12
10-Sep-00 1.2 17.2 12.6 23.0 0.0 91 10.05 1.60 1.7211-Sep-00 2.4 17.1 11.0 22.6 0.0 91 12.22 1.78 2.0812-Sep-00 3.1 19.1 13.9 25.0 0.0 84 8.55 1.86 1.5213-Sep-00 3.4 15.4 11.3 19.7 0.0 89 9.19 1.49 1.5114-Sep-00 1.3 15.7 11.3 20.5 0.0 86 9.56 1.51 1.5815-Sep-00 2.6 17.1 12.8 21.3 1.8 89 7.99 1.43 1.3716-Sep-00 2.4 14.1 7.7 18.7 16.3 89 9.91 1.41 1.5917-Sep-00 1.9 13.7 7.2 17.0 5.0 96 5.89 0.91 0.9418-Sep-00 2.3 15.3 12.7 19.7 0.0 88 8.84 1.42 1.4619-Sep-00 4.7 15.6 11.5 21.0 0.0 81 15.83 2.33 2.6320-Sep-00 3.0 11.8 9.9 13.8 5.5 88 6.22 1.08 0.9421-Sep-00 1.7 10.3 9.2 11.7 19.5 97 5.58 0.76 0.8122-Sep-00 2.2 13.6 8.1 19.7 0.0 88 12.10 1.51 1.9123-Sep-00 2.9 13.5 9.3 18.7 0.0 82 15.07 1.85 2.3724-Sep-00 4.3 13.7 8.6 19.7 0.0 71 14.97 2.43 2.3725-Sep-00 2.2 14.3 10.4 19.3 4.1 88 12.22 1.50 1.9626-Sep-00 2.1 15.5 12.4 21.1 7.7 90 6.54 1.14 1.0827-Sep-00 3.0 16.1 14.3 18.9 0.0 86 8.59 1.42 1.4428-Sep-00 3.5 16.3 14.3 19.4 3.2 88 5.24 1.19 0.8829-Sep-00 2.2 17.6 11.3 24.0 0.0 81 10.61 1.72 1.8430-Sep-00 1.8 15.9 10.4 22.5 0.0 91 7.33 1.13 1.22
1-Oct-00 2.6 14.2 12.0 15.7 5.8 98 4.81 0.69 0.772-Oct-00 3.2 13.3 10.8 17.7 0.0 88 8.71 1.20 1.373-Oct-00 3.0 12.9 8.5 17.4 0.2 87 7.92 1.13 1.234-Oct-00 2.8 12.5 9.8 14.3 0.3 92 5.32 0.81 0.825-Oct-00 2.9 12.6 8.9 16.5 1.3 90 6.13 0.92 0.956-Oct-00 2.8 8.2 3.8 13.7 1.4 92 7.28 0.76 0.997-Oct-00 2.0 7.4 2.7 12.6 0.0 89 8.90 0.81 1.198-Oct-00 3.2 8.5 4.3 10.8 4.0 92 5.24 0.66 0.729-Oct-00 3.0 10.2 6.2 14.0 1.8 83 9.88 1.08 1.44
10-Oct-00 6.2 9.0 7.2 11.6 4.1 84 6.31 1.11 0.8911-Oct-00 5.6 10.0 7.3 13.6 9.1 81 7.18 1.28 1.0512-Oct-00 3.9 11.8 8.5 15.5 0.0 76 8.98 1.43 1.3713-Oct-00 2.7 11.8 7.3 15.4 0.0 84 5.52 0.94 0.8414-Oct-00 1.6 7.7 3.8 13.1 0.0 97 5.96 0.52 0.8015-Oct-00 2.9 10.4 5.8 13.5 0.0 99 3.81 0.43 0.5616-Oct-00 5.0 13.6 10.5 18.1 0.3 87 6.06 1.09 0.9617-Oct-00 3.5 10.0 3.4 14.7 1.1 91 5.73 0.68 0.8218-Oct-00 3.0 10.0 2.8 14.0 0.0 81 6.49 0.90 0.9319-Oct-00 2.4 9.5 2.8 14.3 2.8 95 4.54 0.50 0.6420-Oct-00 2.6 9.3 1.0 14.5 0.0 96 4.87 0.47 0.6921-Oct-00 2.9 14.3 10.5 17.9 0.0 85 4.44 0.92 0.7122-Oct-00 2.3 14.9 10.2 19.8 0.0 83 9.33 0.96 1.5123-Oct-00 4.1 14.6 10.9 19.3 2.2 83 6.85 1.16 1.1124-Oct-00 6.0 12.0 11.1 13.6 0.0 85 3.75 1.05 0.5725-Oct-00 6.6 12.0 10.7 13.8 1.0 83 3.18 1.19 0.4826-Oct-00 4.7 9.9 7.1 13.6 1.7 81 6.11 1.01 0.8827-Oct-00 5.2 10.0 7.6 11.6 7.9 95 3.06 0.46 0.4428-Oct-00 5.1 12.6 11.6 14.2 2.6 91 3.00 0.71 0.4629-Oct-00 7.9 10.2 7.4 13.3 2.6 78 6.25 1.37 0.9130-Oct-00 9.7 10.5 7.9 13.5 12.0 81 2.89 1.38 0.4331-Oct-00 7.3 9.1 7.6 10.8 0.9 83 2.95 1.04 0.42

REMOTE SENSING ANALYSIS OF SUMMER TIME EVAPOTRANSPIRATION USING SEBS ALGORITHM
100
Appendix B contd.
1-Nov-00 6.1 7.8 5.6 10.5 4.3 87 3.35 0.74 0.462-Nov-00 5.4 8.6 5.1 12.4 3.0 82 4.87 0.90 0.683-Nov-00 4.1 8.2 5.4 11.4 0.0 83 4.62 0.73 0.644-Nov-00 4.1 6.8 4.4 9.9 0.2 89 5.59 0.45 0.745-Nov-00 4.3 6.6 4.2 10.2 0.0 84 6.47 0.58 0.856-Nov-00 5.8 7.5 5.8 8.8 0.6 77 2.85 1.07 0.397-Nov-00 4.2 8.4 5.6 11.5 1.1 84 3.49 0.71 0.498-Nov-00 5.5 8.4 7.4 9.4 7.2 90 2.45 0.58 0.349-Nov-00 6.2 8.3 6.6 9.5 0.8 86 2.41 0.76 0.33
10-Nov-00 5.5 7.1 5.3 9.3 0.8 85 2.69 0.73 0.3611-Nov-00 6.1 8.0 5.3 10.3 0.4 78 2.79 1.06 0.3812-Nov-00 5.6 8.9 7.5 10.8 8.3 81 2.28 0.98 0.3213-Nov-00 3.1 8.4 6.7 10.6 0.2 92 3.36 0.33 0.4714-Nov-00 2.6 6.6 1.9 9.4 0.0 91 3.48 0.27 0.4615-Nov-00 4.0 6.7 4.9 9.1 2.1 88 3.12 0.46 0.4116-Nov-00 5.1 7.7 5.5 9.6 0.6 82 3.15 0.74 0.4317-Nov-00 3.5 5.7 3.5 7.7 0.6 92 3.47 0.25 0.4418-Nov-00 5.7 6.1 3.5 8.5 2.8 88 2.47 0.54 0.3219-Nov-00 6.0 8.1 7.2 8.9 2.0 88 2.03 0.63 0.2820-Nov-00 4.1 6.3 4.4 8.3 3.3 87 2.03 0.53 0.2621-Nov-00 3.7 5.9 3.1 8.8 0.9 82 3.73 0.48 0.4822-Nov-00 5.6 8.3 5.9 11.0 1.4 83 2.09 0.82 0.2923-Nov-00 3.3 7.7 5.0 10.5 1.4 91 1.90 0.39 0.2624-Nov-00 4.2 7.2 4.7 9.6 0.2 88 2.10 0.49 0.2825-Nov-00 4.0 6.1 3.6 8.6 0.0 80 2.77 0.62 0.3626-Nov-00 5.0 6.9 4.8 9.5 5.5 89 2.92 0.41 0.3927-Nov-00 4.1 6.4 4.5 8.5 0.0 88 4.03 0.25 0.5228-Nov-00 4.7 11.0 6.4 13.9 4.7 92 1.78 0.44 0.2629-Nov-00 3.8 12.1 9.5 15.1 0.0 81 3.89 0.59 0.5930-Nov-00 2.9 9.9 5.5 12.2 0.0 90 3.60 0.15 0.521-Dec-00 4.0 11.9 8.5 14.7 0.3 83 2.09 0.73 0.322-Dec-00 3.3 10.8 8.2 13.1 0.0 91 3.05 0.23 0.453-Dec-00 3.8 8.4 4.9 11.1 1.3 92 2.18 0.30 0.304-Dec-00 4.4 7.8 4.7 10.5 0.1 82 2.62 0.60 0.355-Dec-00 3.8 10.2 7.7 12.6 0.1 78 3.78 0.56 0.556-Dec-00 3.4 10.9 9.3 12.3 4.7 86 1.63 0.57 0.247-Dec-00 3.4 9.7 7.9 10.6 1.6 91 1.90 0.34 0.278-Dec-00 6.0 12.4 10.3 14.9 0.6 74 2.53 1.33 0.399-Dec-00 6.1 10.1 8.7 11.3 0.0 80 2.48 0.91 0.36
10-Dec-00 6.5 9.4 7.9 11.0 6.0 85 1.58 0.80 0.2211-Dec-00 6.5 11.4 9.1 12.9 7.3 84 2.32 0.80 0.3512-Dec-00 6.5 12.8 11.9 13.7 4.3 92 1.56 0.53 0.2413-Dec-00 9.6 10.5 8.0 13.1 2.1 76 1.99 1.51 0.2914-Dec-00 6.1 7.4 5.7 9.5 1.8 85 1.95 0.66 0.2615-Dec-00 6.5 5.1 3.5 7.0 5.6 90 1.82 0.42 0.2316-Dec-00 5.7 3.4 1.6 5.0 6.3 93 2.49 0.19 0.2917-Dec-00 3.3 2.7 0.5 5.2 0.0 92 3.72 0.00 0.4318-Dec-00 1.8 2.0 -3.1 4.5 0.1 90 1.53 0.21 0.1719-Dec-00 3.3 -0.3 -4.2 1.8 0.0 97 3.01 0.00 0.3020-Dec-00 5.4 0.2 -1.0 2.4 0.0 82 4.05 0.31 0.4221-Dec-00 4.1 -1.0 -3.7 1.8 0.0 69 3.84 0.48 0.3822-Dec-00 1.8 -3.3 -7.6 2.1 0.0 76 4.09 0.05 0.3723-Dec-00 1.3 -2.9 -8.5 1.5 0.0 88 4.16 0.00 0.3824-Dec-00 2.9 0.1 -0.8 1.0 5.1 97 1.98 0.07 0.2125-Dec-00 5.0 -2.1 -6.0 0.1 4.0 94 2.48 0.10 0.2426-Dec-00 4.1 -2.8 -5.7 -1.9 0.0 90 1.65 0.22 0.1527-Dec-00 2.8 -1.1 -1.9 -0.5 0.6 95 1.75 0.12 0.1828-Dec-00 4.3 0.0 -1.0 1.5 2.3 93 1.70 0.21 0.1829-Dec-00 5.8 0.0 -1.4 1.5 0.1 89 3.29 0.20 0.3430-Dec-00 4.5 0.9 -1.0 1.8 1.1 95 1.59 0.18 0.1731-Dec-00 2.7 -0.9 -3.6 0.8 0.0 97 2.63 0.00 0.26

REMOTE SENSING ANALYSIS OF SUMMER TIME EVAPOTRANSPIRATION USING SEBS ALGORITHM
101
Appendix B contd.
1-Jan-01 5.2 3.2 0.0 6.1 5.5 87.00 1.61 0.47 0.192-Jan-01 5.1 8.7 5.4 11.4 0.4 82.00 2.46 0.69 0.353-Jan-01 5.2 6.6 4.1 9.8 3.8 86.00 2.68 0.49 0.354-Jan-01 5.1 7.3 5.3 8.7 3.9 87.00 1.65 0.56 0.225-Jan-01 5.8 7.7 6.5 10.3 15.7 88.00 1.66 0.60 0.236-Jan-01 4.2 5.9 3.9 7.3 4.7 93.00 2.22 0.24 0.297-Jan-01 5.0 5.0 3.0 6.6 0.5 91.00 2.00 0.35 0.258-Jan-01 4.3 3.8 1.5 5.1 0.7 94.00 2.58 0.16 0.319-Jan-01 3.0 2.9 -3.3 6.3 0.0 95.00 2.43 0.12 0.28
10-Jan-01 3.1 0.7 -3.7 2.8 0.0 96.00 1.76 0.16 0.1911-Jan-01 3.5 -0.6 -6.9 3.2 0.0 84.00 4.78 0.14 0.4812-Jan-01 1.6 -0.3 -6.7 4.6 0.0 94.00 2.93 0.07 0.3013-Jan-01 2.8 -2.0 -4.5 1.1 0.0 95.00 4.62 0.00 0.4314-Jan-01 3.1 -2.7 -5.3 -0.6 0.0 96.00 1.86 0.14 0.1715-Jan-01 3.9 -2.4 -4.4 0.8 0.0 85.00 5.20 0.16 0.4816-Jan-01 2.0 -4.4 -8.9 0.5 0.0 86.00 5.24 0.02 0.4417-Jan-01 1.3 -7.0 -10.3 -2.2 0.0 89.00 5.05 0.00 0.3818-Jan-01 1.6 -1.9 -9.7 2.0 0.0 91.00 2.25 0.18 0.2119-Jan-01 1.0 0.9 -0.8 2.2 0.3 95.00 2.00 0.17 0.21
20-Jan-01 1.3 -0.2 -0.8 0.6 1.1 100.00 2.04 0.13 0.2121-Jan-01 2.7 -1.2 -2.6 0.2 2.2 97.00 2.98 0.10 0.2922-Jan-01 3.3 1.8 -1.2 5.2 2.6 99.00 2.11 0.14 0.2323-Jan-01 4.4 7.2 4.5 10.0 1.8 90.00 2.78 0.44 0.3724-Jan-01 5.7 8.5 4.1 12.8 4.5 86.00 2.88 0.71 0.4025-Jan-01 3.6 5.5 3.2 8.0 2.9 93.00 2.22 0.34 0.2826-Jan-01 4.0 4.6 2.6 7.5 0.6 90.00 2.93 0.40 0.3627-Jan-01 4.3 3.2 2.4 3.9 8.0 93.00 2.30 0.32 0.2728-Jan-01 3.4 3.5 -0.8 5.4 1.3 96.00 2.34 0.24 0.2829-Jan-01 0.9 1.3 -2.2 5.0 0.0 91.00 3.24 0.20 0.3530-Jan-01 1.6 2.2 -0.8 6.5 0.0 93.00 4.17 0.19 0.4731-Jan-01 1.4 -0.3 -5.1 4.5 0.0 96.00 4.74 0.11 0.481-Feb-01 2.0 -0.7 -4.5 2.4 0.7 98.00 2.97 0.17 0.302-Feb-01 2.0 -0.9 -2.6 0.4 4.9 98.00 2.56 0.19 0.253-Feb-01 3.5 -1.8 -2.8 -0.5 4.8 97.00 2.61 0.19 0.254-Feb-01 2.9 -0.4 -3.1 7.2 19.2 98.00 2.66 0.21 0.275-Feb-01 6.4 8.1 6.0 10.3 3.5 91.00 2.71 0.58 0.376-Feb-01 6.4 10.5 8.3 12.4 5.1 87.00 2.76 0.84 0.417-Feb-01 4.7 10.0 8.8 11.7 2.3 84.00 5.40 0.80 0.788-Feb-01 5.4 9.8 3.5 13.0 4.6 79.00 5.22 1.01 0.759-Feb-01 2.3 1.6 -4.1 5.8 2.0 89.00 5.78 0.33 0.63
10-Feb-01 2.2 1.6 -5.3 7.0 0.2 80.00 8.09 0.44 0.8811-Feb-01 7.1 9.2 5.0 11.6 0.4 83.00 3.03 1.02 0.4212-Feb-01 5.4 10.0 6.0 13.0 3.1 86.00 3.09 0.86 0.4413-Feb-01 3.7 5.4 0.8 9.4 0.0 88.00 6.61 0.53 0.8214-Feb-01 1.8 3.6 -1.9 8.7 0.0 91.00 6.61 0.38 0.7715-Feb-01 0.9 3.6 -3.4 13.9 0.0 80.00 9.21 0.51 1.0816-Feb-01 2.4 2.9 -2.8 8.7 6.4 92.00 7.39 0.40 0.8417-Feb-01 3.6 3.4 -0.8 5.0 0.0 90.00 3.39 0.47 0.3918-Feb-01 3.0 4.7 1.2 7.2 0.0 86.00 4.42 0.59 0.5319-Feb-01 4.1 4.8 2.5 6.7 1.0 89.00 4.08 0.57 0.5020-Feb-01 4.6 5.1 2.3 7.5 0.0 87.00 4.65 0.67 0.5721-Feb-01 5.4 5.9 2.9 8.4 1.0 87.00 4.30 0.73 0.5522-Feb-01 6.2 4.3 2.3 7.7 1.6 84.00 6.38 0.85 0.7723-Feb-01 3.3 1.2 -1.9 4.9 2.0 84.00 9.45 0.63 1.0324-Feb-01 2.8 -2.4 -5.9 0.5 1.8 78.00 10.77 0.59 1.0125-Feb-01 4.4 0.0 -3.0 3.5 0.8 88.00 7.67 0.55 0.7926-Feb-01 3.2 1.0 -1.2 5.6 0.4 88.00 5.66 0.57 0.6127-Feb-01 3.2 1.4 -2.2 4.5 0.0 69.00 10.46 0.97 1.1528-Feb-01 1.8 2.6 -1.6 5.8 0.0 72.00 6.85 0.79 0.79

REMOTE SENSING ANALYSIS OF SUMMER TIME EVAPOTRANSPIRATION USING SEBS ALGORITHM
102
Appendix B contd.
1-Mar-01 1.4 1.1 0.2 2.9 5.0 96.00 4.20 0.42 0.462-Mar-01 2.3 0.3 -2.3 3.4 0.4 91.00 5.38 0.49 0.573-Mar-01 3.7 -1.2 -2.8 0.1 0.0 84.00 4.34 0.58 0.434-Mar-01 3.9 1.0 -0.5 2.6 0.0 85.00 4.77 0.65 0.525-Mar-01 1.9 0.7 -2.5 5.0 0.0 82.00 7.81 0.69 0.836-Mar-01 3.8 2.1 -2.4 7.9 0.0 71.00 12.77 1.23 1.427-Mar-01 2.9 5.6 -0.4 10.7 1.8 86.00 5.75 0.80 0.738-Mar-01 3.3 8.5 4.5 11.0 1.6 90.00 5.18 0.77 0.729-Mar-01 4.6 9.4 7.4 11.3 2.9 89.00 5.17 0.88 0.74
10-Mar-01 4.4 10.0 8.4 12.2 5.0 93.00 5.25 0.76 0.7611-Mar-01 4.5 11.5 9.6 14.2 4.3 89.00 5.44 1.00 0.8212-Mar-01 5.2 8.9 3.3 13.6 0.2 75.00 10.44 1.64 1.4713-Mar-01 5.8 5.3 3.4 8.0 2.1 87.00 7.85 0.93 0.9914-Mar-01 5.7 5.1 0.6 8.1 0.4 84.00 6.52 0.97 0.8115-Mar-01 1.5 4.3 -2.7 9.8 0.0 89.00 7.67 0.79 0.9316-Mar-01 2.8 6.3 3.7 9.4 0.6 84.00 5.65 0.93 0.7317-Mar-01 4.5 3.2 2.0 4.7 0.9 89.00 5.41 0.72 0.6318-Mar-01 2.7 3.9 1.9 6.0 15.8 98.00 5.49 0.54 0.6619-Mar-01 5.9 1.0 -3.0 3.5 3.1 86.00 5.79 0.74 0.6220-Mar-01 2.4 1.3 -4.5 6.1 0.0 75.00 9.26 1.02 1.0021-Mar-01 3.9 0.0 -1.3 1.6 6.8 87.00 5.95 0.68 0.6222-Mar-01 2.5 2.1 -0.2 3.9 0.0 96.00 5.80 0.57 0.6523-Mar-01 4.0 5.3 2.3 8.7 15.1 96.00 5.88 0.63 0.7424-Mar-01 3.3 3.5 1.8 4.6 0.0 95.00 5.96 0.62 0.7125-Mar-01 5.8 1.6 1.0 2.2 0.0 87.00 6.04 0.77 0.6726-Mar-01 3.4 0.9 -1.0 2.6 0.1 84.00 6.25 0.80 0.6727-Mar-01 5.1 1.4 -2.1 5.4 0.0 73.00 17.37 1.52 1.8928-Mar-01 4.8 5.6 0.0 12.3 1.0 80.00 10.55 1.44 1.3429-Mar-01 3.4 6.5 5.0 8.8 9.7 94.00 6.62 0.80 0.8730-Mar-01 2.4 5.7 -0.8 10.9 0.4 92.00 8.37 0.93 1.0631-Mar-01 4.9 9.8 2.6 13.2 0.0 75.00 10.43 1.76 1.49
1-Apr-01 3.3 11.2 4.8 16.2 0.2 85.00 8.58 1.39 1.272-Apr-01 2.6 14.3 4.9 21.9 0.0 65.00 18.03 2.88 2.903-Apr-01 5.0 12.5 9.0 15.7 0.0 67.00 13.11 2.60 2.024-Apr-01 5.8 9.2 5.0 15.5 5.7 79.00 10.25 1.83 1.455-Apr-01 6.3 7.7 4.6 12.3 3.1 77.00 12.44 1.88 1.686-Apr-01 5.4 10.5 6.3 13.8 6.8 88.00 8.11 1.28 1.197-Apr-01 4.4 9.1 3.8 13.5 2.8 78.00 13.99 1.90 1.988-Apr-01 2.9 6.4 0.5 12.4 0.2 83.00 10.57 1.37 1.379-Apr-01 2.8 7.5 0.5 10.7 0.0 81.00 10.69 1.41 1.43
10-Apr-01 3.0 8.8 2.8 11.9 4.6 90.00 8.17 1.13 1.1411-Apr-01 3.5 7.7 4.2 11.5 0.0 82.00 11.21 1.52 1.5112-Apr-01 4.3 3.8 -0.3 8.4 1.2 78.00 17.13 1.69 2.0213-Apr-01 3.9 2.2 -3.5 7.3 0.0 63.00 15.05 1.85 1.6814-Apr-01 3.5 0.7 -5.5 6.2 6.1 77.00 13.83 1.35 1.4615-Apr-01 4.5 6.1 1.0 9.9 5.6 93.00 9.21 0.99 1.1916-Apr-01 3.3 5.5 4.1 7.4 1.3 86.00 7.74 1.10 0.9817-Apr-01 3.9 5.7 3.1 8.6 0.1 76.00 9.85 1.54 1.2518-Apr-01 5.1 4.0 0.6 8.4 10.1 86.00 11.68 1.26 1.4119-Apr-01 4.2 3.3 0.2 8.0 4.9 88.00 13.69 1.28 1.6120-Apr-01 2.3 3.7 -1.1 8.5 0.4 83.00 12.53 1.38 1.4921-Apr-01 3.8 5.5 -2.0 11.2 0.0 75.00 17.18 1.98 2.1722-Apr-01 1.7 5.8 -3.5 12.6 0.0 68.00 17.00 2.06 2.1723-Apr-01 2.2 7.7 -0.5 13.7 0.0 67.00 18.62 2.39 2.5224-Apr-01 3.1 11.0 1.4 16.5 7.6 66.00 14.12 2.45 2.1025-Apr-01 3.1 10.1 8.5 13.5 2.6 89.00 10.39 1.49 1.5126-Apr-01 4.8 9.4 7.7 13.1 5.8 84.00 12.32 1.77 1.7527-Apr-01 3.1 9.5 7.1 12.8 3.1 85.00 10.21 1.56 1.4528-Apr-01 4.5 10.2 4.9 14.1 3.0 83.00 12.86 1.85 1.8729-Apr-01 3.8 12.5 8.3 17.4 2.3 74.00 16.58 2.71 2.5630-Apr-01 2.7 14.9 10.3 20.9 0.4 79.00 18.09 2.88 2.95

REMOTE SENSING ANALYSIS OF SUMMER TIME EVAPOTRANSPIRATION USING SEBS ALGORITHM
103
Appendix B contd.
1-May-01 6.0 11.8 7.1 17.0 0.0 80.00 15.07 2.37 2.272-May-01 4.5 13.8 6.3 20.2 0.0 64.00 23.29 3.88 3.693-May-01 2.8 14.5 6.5 23.4 7.1 75.00 21.14 3.38 3.434-May-01 3.5 8.2 4.7 11.0 0.7 87.00 8.94 1.34 1.235-May-01 5.5 7.4 3.3 12.4 0.0 73.00 23.76 2.75 3.176-May-01 4.5 9.9 3.3 15.0 0.0 71.00 16.67 2.59 2.397-May-01 4.3 10.3 4.9 16.5 0.0 69.00 22.06 3.18 3.198-May-01 3.0 10.8 3.2 17.1 0.0 79.00 16.32 2.36 2.399-May-01 3.5 16.4 7.6 22.8 0.0 69.00 26.20 4.22 4.40
10-May-01 3.9 17.9 8.8 24.6 0.0 58.00 26.54 4.99 4.6011-May-01 3.1 17.8 8.0 24.8 0.0 59.00 26.87 4.82 4.6512-May-01 3.7 17.9 11.5 23.5 0.0 54.00 27.21 5.18 4.7113-May-01 2.0 17.0 6.9 24.8 0.0 62.00 24.53 4.23 4.1814-May-01 1.7 17.4 9.7 24.5 3.7 76.00 13.84 2.70 2.3915-May-01 4.0 14.6 9.4 19.7 0.0 74.00 20.58 3.37 3.3416-May-01 5.8 14.8 11.4 19.2 7.3 77.00 16.09 2.98 2.6317-May-01 6.0 13.6 10.4 19.0 0.6 68.00 18.09 3.60 2.8718-May-01 5.2 11.2 8.7 15.7 1.9 82.00 14.31 2.23 2.1319-May-01 3.5 11.4 4.4 17.1 0.0 78.00 19.03 2.72 2.8420-May-01 2.0 11.2 3.5 17.8 0.0 76.00 21.65 2.99 3.2121-May-01 4.0 11.4 5.4 16.0 0.0 73.00 22.33 3.13 3.3322-May-01 3.1 12.8 3.0 19.7 0.0 69.00 26.55 3.83 4.1023-May-01 3.0 15.7 7.7 22.5 0.0 62.00 28.24 4.65 4.6724-May-01 4.0 15.8 7.0 22.7 0.0 70.00 26.96 4.34 4.4725-May-01 2.4 14.0 3.5 22.3 0.0 63.00 28.05 4.35 4.4626-May-01 2.3 16.3 5.8 25.0 0.0 61.00 20.36 3.92 3.4127-May-01 3.7 15.8 7.8 18.7 0.4 82.00 11.42 2.18 1.8928-May-01 4.7 17.2 14.9 20.7 1.2 87.00 12.46 2.31 2.1329-May-01 5.7 16.9 10.5 21.2 0.0 67.00 25.60 4.52 4.3530-May-01 2.3 15.8 5.9 22.3 0.0 67.00 20.82 3.64 3.4631-May-01 3.8 13.2 8.8 18.0 8.4 82.00 18.85 2.79 2.95
1-Jun-01 4.0 12.6 7.9 18.2 3.5 80.00 15.45 2.54 2.382-Jun-01 5.0 11.0 6.6 15.6 10.0 91.00 12.64 1.68 1.883-Jun-01 6.1 9.2 5.7 12.4 4.0 78.00 16.34 2.33 2.304-Jun-01 3.7 11.2 7.3 15.0 0.0 79.00 11.06 2.03 1.645-Jun-01 2.4 13.8 6.4 19.5 0.0 75.00 15.80 2.74 2.516-Jun-01 2.5 14.7 9.3 20.7 2.3 82.00 13.77 2.45 2.247-Jun-01 5.3 13.1 10.1 17.0 1.7 71.00 14.01 2.94 2.198-Jun-01 3.3 12.0 3.0 17.1 0.1 72.00 22.28 3.25 3.399-Jun-01 1.1 9.4 0.9 15.6 0.0 73.00 18.60 2.60 2.64
10-Jun-01 1.9 11.7 1.8 17.9 0.0 69.00 19.04 2.95 2.8711-Jun-01 3.0 12.6 6.6 17.7 0.1 69.00 21.76 3.41 3.3512-Jun-01 3.2 14.0 10.3 17.4 0.0 69.00 11.41 2.60 1.8213-Jun-01 1.6 14.6 10.2 19.7 0.0 73.00 13.71 2.57 2.2214-Jun-01 2.5 15.1 7.8 21.2 0.0 64.00 26.61 4.33 4.3515-Jun-01 3.8 17.6 11.0 24.6 0.4 68.00 14.56 3.54 2.5216-Jun-01 3.2 16.9 11.5 22.7 1.2 77.00 21.86 3.74 3.7317-Jun-01 2.6 15.2 12.6 21.3 5.9 88.00 13.54 2.32 2.2318-Jun-01 4.5 13.5 11.3 18.3 6.0 85.00 12.92 2.22 2.0319-Jun-01 2.1 12.8 6.0 18.8 0.0 71.00 18.55 3.02 2.8620-Jun-01 2.7 15.8 4.9 22.3 0.0 68.00 22.72 3.88 3.7721-Jun-01 3.8 15.4 11.2 20.3 0.0 71.00 17.09 3.35 2.8222-Jun-01 4.3 12.8 6.8 16.9 3.0 82.00 13.13 2.22 2.0423-Jun-01 2.0 13.7 6.7 19.3 0.0 81.00 19.16 2.93 3.0324-Jun-01 1.6 17.1 8.2 24.6 0.0 74.00 22.90 3.88 3.9025-Jun-01 3.2 17.4 9.5 23.8 0.0 68.00 28.93 4.86 4.9526-Jun-01 3.1 19.8 10.8 27.2 0.0 64.00 28.07 5.32 5.0527-Jun-01 3.1 20.3 15.3 27.4 9.5 77.00 13.71 3.21 2.4928-Jun-01 3.4 19.4 15.2 24.4 0.0 73.00 17.02 3.65 3.0429-Jun-01 3.1 19.5 13.9 23.9 0.0 74.00 19.49 3.79 3.4830-Jun-01 2.2 18.1 11.4 22.9 12.3 85.00 14.70 2.67 2.56

REMOTE SENSING ANALYSIS OF SUMMER TIME EVAPOTRANSPIRATION USING SEBS ALGORITHM
104
Appendix B contd. 1-Jul-01 3.5 16.8 10.1 22.9 0.0 78.00 23.99 3.89 4.062-Jul-01 1.7 16.5 8.0 22.0 0.0 82.00 16.11 2.77 2.703-Jul-01 3.2 18.6 10.7 24.4 0.0 74.00 22.26 4.02 3.914-Jul-01 4.5 21.3 13.6 26.8 0.0 62.00 29.22 5.86 5.405-Jul-01 3.5 24.2 17.5 29.7 0.0 60.00 29.16 6.30 5.656-Jul-01 3.0 24.6 18.2 29.5 0.0 57.00 22.54 5.42 4.407-Jul-01 4.7 21.7 17.1 26.9 0.0 70.00 16.16 4.17 3.028-Jul-01 4.0 17.0 16.2 18.9 3.7 94.00 10.20 1.72 1.749-Jul-01 3.3 16.6 11.1 22.1 1.9 89.00 13.23 2.27 2.24
10-Jul-01 3.9 18.2 11.9 25.3 4.8 80.00 15.83 3.16 2.7711-Jul-01 7.0 16.3 11.9 19.7 4.3 74.00 19.64 3.63 3.3112-Jul-01 4.9 14.9 11.4 20.6 10.5 79.00 14.33 2.79 2.3413-Jul-01 3.9 15.7 11.5 21.0 0.0 77.00 15.50 2.97 2.5814-Jul-01 2.3 15.3 12.1 18.5 3.1 88.00 11.84 2.05 1.9515-Jul-01 2.7 14.7 9.0 20.3 0.0 83.00 18.00 2.82 2.9216-Jul-01 1.8 14.2 7.1 20.5 0.0 79.00 16.74 2.73 2.6817-Jul-01 2.4 15.8 5.6 21.4 0.0 75.00 16.48 2.92 2.7418-Jul-01 3.8 16.1 13.1 22.2 16.6 82.00 15.83 2.87 2.6619-Jul-01 3.4 15.4 11.8 18.5 6.8 90.00 13.60 2.14 2.2520-Jul-01 3.4 14.6 10.3 19.8 3.0 89.00 11.97 1.99 1.9421-Jul-01 3.9 16.0 8.1 20.0 0.0 82.00 13.10 2.39 2.1822-Jul-01 2.2 19.9 13.4 25.5 0.0 80.00 16.74 3.19 3.0223-Jul-01 2.5 18.5 12.9 23.5 0.0 90.00 12.21 2.21 2.1424-Jul-01 2.0 19.5 13.0 26.3 0.0 82.00 20.45 3.60 3.6625-Jul-01 1.8 19.2 10.5 25.8 0.0 73.00 25.93 4.38 4.6126-Jul-01 1.9 20.2 11.1 26.7 0.0 69.00 23.70 4.30 4.2927-Jul-01 2.4 23.0 14.2 29.7 0.0 69.00 22.06 4.54 4.1928-Jul-01 3.0 21.2 13.9 26.6 3.5 81.00 23.08 4.07 4.2529-Jul-01 1.5 19.5 12.5 26.2 0.0 80.00 22.02 3.78 3.9330-Jul-01 3.3 21.6 14.9 27.3 0.0 76.00 21.72 4.18 4.0331-Jul-01 3.5 19.8 11.6 26.3 0.0 80.00 13.22 2.84 2.371-Aug-01 2.3 16.7 9.5 22.5 0.0 76.00 17.40 3.04 2.942-Aug-01 3.8 20.9 11.5 28.5 5.2 68.00 18.41 4.19 3.383-Aug-01 4.0 18.4 11.5 23.9 0.0 85.00 13.36 2.51 2.354-Aug-01 3.3 16.5 11.3 20.6 7.8 84.00 13.10 2.33 2.215-Aug-01 4.1 15.6 10.1 20.6 3.4 83.00 15.73 2.59 2.606-Aug-01 4.0 17.3 10.5 22.4 0.9 84.00 12.75 2.38 2.197-Aug-01 4.3 18.0 15.7 22.4 25.5 87.00 11.24 2.21 1.968-Aug-01 5.8 16.2 13.7 20.6 19.7 85.00 15.95 2.62 2.689-Aug-01 2.9 15.1 13.0 18.8 5.0 90.00 10.74 1.80 1.76
10-Aug-01 3.7 13.9 10.2 18.2 2.3 87.00 13.99 2.11 2.2211-Aug-01 3.2 15.4 8.1 20.3 0.0 78.00 17.53 2.82 2.8812-Aug-01 4.5 16.2 14.8 18.2 12.9 82.00 9.13 2.07 1.5313-Aug-01 3.9 17.9 15.6 19.3 0.1 90.00 8.55 1.68 1.4914-Aug-01 2.2 22.1 16.7 28.3 0.0 78.00 22.58 4.12 4.2315-Aug-01 1.8 24.1 16.5 32.6 0.0 75.00 19.88 4.08 3.8516-Aug-01 3.4 19.0 11.6 24.4 5.4 86.00 12.20 2.30 2.1617-Aug-01 2.3 17.5 10.7 24.2 0.0 77.00 21.23 3.43 3.6518-Aug-01 3.0 20.0 15.8 26.9 2.9 77.00 12.66 2.89 2.2919-Aug-01 4.0 20.8 17.3 25.1 0.2 73.00 16.64 3.61 3.0520-Aug-01 2.3 17.8 12.5 23.4 0.2 83.00 11.81 2.23 2.0521-Aug-01 2.0 18.4 10.1 24.8 0.0 81.00 19.40 3.12 3.3922-Aug-01 2.2 21.7 16.6 27.6 0.0 72.00 13.83 3.08 2.5723-Aug-01 1.6 22.1 17.6 28.0 0.0 75.00 15.44 3.09 2.8924-Aug-01 1.1 22.3 14.8 29.9 0.0 80.00 17.01 3.15 3.2025-Aug-01 1.1 23.4 15.3 31.1 0.0 76.00 20.26 3.73 3.8726-Aug-01 2.9 23.7 16.5 31.2 2.4 73.00 15.32 3.59 2.9427-Aug-01 3.8 16.6 8.6 21.2 10.2 80.00 16.39 2.63 2.7728-Aug-01 2.6 13.1 6.6 19.6 0.0 82.00 15.78 2.25 2.4629-Aug-01 2.1 14.1 5.5 20.5 0.0 79.00 18.60 2.59 2.9730-Aug-01 2.2 16.4 11.4 21.2 1.4 78.00 12.67 2.26 2.1431-Aug-01 2.6 15.8 10.7 21.1 0.0 87.00 12.25 1.95 2.04

REMOTE SENSING ANALYSIS OF SUMMER TIME EVAPOTRANSPIRATION USING SEBS ALGORITHM
105
Appendix B contd. 1-Sep-01 2.7 14.9 8.9 20.9 0.0 87.00 12.12 1.88 1.972-Sep-01 3.8 14.6 9.1 17.1 1.5 94.00 7.28 1.15 1.183-Sep-01 3.6 15.4 12.8 17.2 4.5 96.00 7.20 1.11 1.194-Sep-01 3.9 13.4 11.5 18.1 9.0 90.00 10.34 1.55 1.635-Sep-01 3.5 13.2 8.3 17.9 4.8 88.00 9.67 1.51 1.516-Sep-01 2.6 13.1 9.0 17.6 0.2 91.00 9.29 1.37 1.457-Sep-01 4.3 13.5 11.2 16.4 5.3 93.00 6.75 1.11 1.078-Sep-01 6.6 12.2 8.2 16.1 10.7 84.00 13.62 1.90 2.099-Sep-01 6.3 12.1 8.6 15.5 3.4 80.00 11.88 1.98 1.82
10-Sep-01 6.8 12.6 10.5 15.9 0.4 82.00 8.48 1.79 1.3111-Sep-01 5.2 12.3 10.3 13.9 0.5 84.00 6.57 1.43 1.0112-Sep-01 4.0 14.4 11.5 17.1 0.4 82.00 9.80 1.77 1.5813-Sep-01 4.0 13.0 9.0 17.7 6.6 85.00 9.81 1.60 1.5414-Sep-01 2.4 11.9 9.2 15.9 6.0 91.00 8.69 1.22 1.3215-Sep-01 4.5 12.0 8.9 16.4 4.2 88.00 9.93 1.42 1.5116-Sep-01 2.8 10.8 8.4 16.1 3.8 90.00 9.68 1.27 1.4317-Sep-01 2.3 10.0 7.0 13.9 5.6 94.00 6.33 0.89 0.9118-Sep-01 2.0 10.0 5.9 15.7 0.0 92.00 11.20 1.25 1.6219-Sep-01 5.0 12.0 10.2 14.9 3.3 81.00 6.51 1.53 0.9920-Sep-01 2.6 11.5 10.1 12.7 0.2 95.00 5.74 0.84 0.8621-Sep-01 3.6 12.1 8.2 16.7 8.3 90.00 10.41 1.30 1.5922-Sep-01 4.2 11.5 8.3 14.4 4.4 93.00 5.69 0.88 0.8523-Sep-01 2.5 11.8 11.3 13.0 4.9 95.00 5.50 0.82 0.8324-Sep-01 3.1 11.8 6.1 17.7 0.0 86.00 11.28 1.43 1.7125-Sep-01 1.3 10.9 5.6 17.2 0.2 92.00 8.66 1.05 1.2826-Sep-01 1.8 11.0 4.2 17.4 0.1 90.00 8.74 1.08 1.2927-Sep-01 3.6 14.5 11.6 17.9 5.9 92.00 6.33 1.03 1.0228-Sep-01 2.9 15.4 11.1 20.7 0.0 87.00 9.31 1.42 1.5329-Sep-01 2.5 15.3 10.6 20.2 1.1 86.00 10.17 1.44 1.6730-Sep-01 3.6 15.9 11.8 18.8 1.3 85.00 8.83 1.44 1.47
1-Oct-01 6.2 16.1 14.4 18.6 7.8 87.00 4.98 1.36 0.842-Oct-01 5.2 16.4 14.7 21.6 16.1 90.00 5.00 1.20 0.843-Oct-01 4.2 14.8 13.1 18.7 0.7 84.00 7.76 1.47 1.264-Oct-01 4.6 14.0 11.9 18.0 0.3 84.00 8.85 1.48 1.415-Oct-01 2.3 13.1 10.4 18.6 0.0 84.00 9.08 1.26 1.426-Oct-01 3.2 15.3 10.1 20.1 2.2 85.00 7.76 1.29 1.287-Oct-01 4.2 15.3 13.4 17.9 0.0 82.00 6.39 1.43 1.058-Oct-01 6.2 14.7 12.6 16.8 0.0 73.00 6.29 2.05 1.029-Oct-01 6.6 14.1 12.2 16.0 0.0 76.00 5.75 1.86 0.92
10-Oct-01 5.6 13.8 11.6 16.9 0.0 79.00 7.34 1.64 1.1611-Oct-01 4.4 14.6 13.0 16.1 0.0 84.00 4.15 1.20 0.6712-Oct-01 2.5 14.2 9.3 20.1 0.0 82.00 11.34 1.33 1.8113-Oct-01 1.9 16.3 10.6 22.9 0.0 83.00 8.98 1.24 1.5114-Oct-01 2.2 16.9 10.6 22.9 0.3 85.00 8.36 1.19 1.4215-Oct-01 2.6 17.2 13.4 22.1 0.0 83.00 7.28 1.26 1.2516-Oct-01 1.9 12.5 5.5 17.8 0.0 86.00 8.14 0.87 1.2517-Oct-01 2.7 12.8 5.9 18.6 0.0 91.00 8.97 0.83 1.3918-Oct-01 2.3 14.3 10.4 20.1 0.2 89.00 8.08 0.92 1.3019-Oct-01 2.0 15.5 12.2 20.1 1.1 89.00 6.13 0.85 1.0120-Oct-01 3.2 15.3 11.2 21.5 0.0 73.00 9.14 1.60 1.5121-Oct-01 3.0 13.1 9.6 14.8 0.0 85.00 3.48 0.86 0.5522-Oct-01 3.4 12.2 7.2 13.7 0.1 88.00 3.55 0.74 0.5423-Oct-01 2.0 10.8 4.7 12.9 9.7 97.00 3.36 0.43 0.4924-Oct-01 2.8 12.6 11.5 14.2 7.6 93.00 4.74 0.58 0.7325-Oct-01 2.7 12.4 10.7 14.7 1.3 94.00 3.36 0.54 0.5126-Oct-01 4.1 12.9 10.9 15.3 0.0 86.00 5.84 0.88 0.9127-Oct-01 4.3 12.7 10.7 15.6 1.3 89.00 4.80 0.77 0.7428-Oct-01 3.3 10.9 6.8 15.5 0.0 91.00 5.02 0.59 0.7429-Oct-01 5.4 10.9 7.1 13.4 0.2 90.00 3.12 0.69 0.4630-Oct-01 6.9 15.3 12.1 18.2 0.0 74.00 7.08 1.83 1.1631-Oct-01 7.2 11.5 6.8 15.6 2.7 80.00 5.04 1.30 0.76

REMOTE SENSING ANALYSIS OF SUMMER TIME EVAPOTRANSPIRATION USING SEBS ALGORITHM
106
Appendix B contd. 1-Nov-01 3.7 8.0 4.1 12.7 0.0 85.00 7.05 0.62 0.952-Nov-01 2.4 9.5 4.6 13.3 0.0 87.00 5.24 0.50 0.743-Nov-01 2.6 10.5 9.3 12.5 0.0 86.00 2.90 0.65 0.424-Nov-01 3.6 9.3 7.5 10.3 0.1 89.00 2.69 0.58 0.385-Nov-01 3.3 7.5 3.6 11.2 0.1 79.00 5.80 0.68 0.786-Nov-01 5.7 8.7 7.1 12.0 4.3 88.00 3.11 0.71 0.437-Nov-01 3.6 8.0 6.2 9.5 4.2 93.00 2.64 0.41 0.368-Nov-01 3.9 4.6 0.1 9.1 9.7 95.00 3.04 0.29 0.389-Nov-01 2.7 0.8 -5.0 6.3 0.1 90.00 5.59 0.21 0.59
10-Nov-01 3.4 1.2 -4.8 5.8 0.0 78.00 6.50 0.43 0.7011-Nov-01 3.8 4.0 1.8 5.8 0.0 86.00 2.51 0.51 0.3012-Nov-01 3.3 7.7 5.6 9.9 5.4 99.00 2.32 0.21 0.3113-Nov-01 2.3 4.0 1.7 6.9 0.9 93.00 3.51 0.22 0.4214-Nov-01 2.6 1.9 -4.3 6.8 0.0 87.00 6.18 0.16 0.6815-Nov-01 2.0 -0.1 -5.9 4.7 0.0 90.00 5.28 0.09 0.5416-Nov-01 1.4 6.8 3.1 11.8 0.6 94.00 3.94 0.14 0.5117-Nov-01 0.8 6.8 5.7 9.1 1.7 99.00 2.55 0.16 0.3318-Nov-01 1.0 6.1 2.2 8.6 0.0 99.00 2.09 0.19 0.2719-Nov-01 1.4 6.0 3.1 8.1 0.0 100.00 2.06 0.17 0.2620-Nov-01 2.5 7.3 5.8 9.2 0.0 93.00 2.35 0.29 0.3121-Nov-01 6.7 8.2 7.1 9.5 2.7 87.00 2.15 0.70 0.2922-Nov-01 6.3 6.0 1.6 9.8 7.6 87.00 2.12 0.61 0.2723-Nov-01 3.1 3.2 -1.0 5.7 0.3 88.00 2.86 0.29 0.3324-Nov-01 3.1 5.2 3.9 7.5 2.3 98.00 1.90 0.17 0.2425-Nov-01 3.2 9.7 7.5 11.1 4.0 99.00 1.88 0.17 0.2726-Nov-01 1.8 5.6 0.7 10.2 0.5 93.00 2.29 0.20 0.2927-Nov-01 3.1 2.9 -2.0 7.1 2.1 94.00 3.97 0.04 0.4628-Nov-01 3.7 5.3 3.2 8.0 0.4 89.00 2.99 0.30 0.3729-Nov-01 4.8 7.3 5.1 9.3 13.5 94.00 1.78 0.32 0.2430-Nov-01 2.5 10.7 9.3 12.3 8.7 99.00 1.75 0.17 0.261-Dec-01 4.0 11.8 6.9 12.7 7.4 97.00 1.73 0.23 0.262-Dec-01 1.9 6.4 2.4 7.9 0.0 98.00 1.71 0.15 0.223-Dec-01 1.3 8.8 7.9 9.8 1.5 98.00 1.69 0.16 0.244-Dec-01 4.8 8.5 7.1 9.7 4.0 90.00 1.68 0.47 0.235-Dec-01 5.1 7.4 4.8 10.4 4.4 91.00 2.09 0.39 0.286-Dec-01 3.8 5.6 -1.5 9.3 0.8 90.00 2.73 0.23 0.347-Dec-01 1.2 0.3 -3.4 5.7 0.0 97.00 4.23 0.00 0.448-Dec-01 2.4 1.7 -1.2 5.6 0.0 91.00 4.29 0.00 0.479-Dec-01 2.1 -0.4 -2.8 1.5 0.0 90.00 4.26 0.00 0.43
10-Dec-01 0.9 0.6 -3.3 4.0 0.0 92.00 2.67 0.00 0.2811-Dec-01 1.7 4.2 2.8 5.8 0.0 100.00 1.58 0.09 0.1912-Dec-01 2.8 2.1 1.2 3.0 0.0 100.00 1.57 0.07 0.1713-Dec-01 3.8 0.8 -5.2 3.9 0.0 80.00 2.53 0.38 0.2714-Dec-01 2.4 -5.2 -8.7 -3.0 0.0 76.00 3.08 0.18 0.2515-Dec-01 2.1 -1.1 -6.3 1.1 0.1 88.00 1.55 0.22 0.1516-Dec-01 2.4 -1.2 -4.3 1.0 0.0 92.00 1.64 0.17 0.1617-Dec-01 1.7 0.7 -2.4 1.9 0.7 98.00 1.63 0.08 0.1718-Dec-01 1.8 2.4 0.8 4.3 0.2 99.00 1.54 0.09 0.1719-Dec-01 5.0 4.0 1.8 5.4 5.3 94.00 1.53 0.25 0.1820-Dec-01 3.3 -0.1 -4.0 2.1 0.0 84.00 3.65 0.11 0.3721-Dec-01 6.5 3.3 0.8 6.1 15.3 93.00 1.53 0.31 0.1822-Dec-01 4.0 -0.3 -4.8 1.5 0.7 92.00 2.58 0.11 0.2623-Dec-01 3.3 -4.8 -9.4 -1.8 0.0 82.00 4.15 0.08 0.3524-Dec-01 7.9 1.8 -3.2 6.5 7.4 92.00 1.54 0.35 0.1725-Dec-01 5.7 4.3 0.9 6.9 10.8 90.00 2.38 0.31 0.2926-Dec-01 4.9 1.0 0.0 3.2 0.4 93.00 2.23 0.18 0.2427-Dec-01 6.0 1.6 -0.5 5.1 10.3 96.00 1.56 0.19 0.1728-Dec-01 8.8 5.4 2.6 7.3 6.4 86.00 1.75 0.66 0.2229-Dec-01 2.5 1.0 -3.1 3.1 4.6 95.00 1.76 0.13 0.1930-Dec-01 3.1 -1.6 -6.5 0.8 2.1 95.00 2.15 0.09 0.2131-Dec-01 2.4 -2.5 -8.6 1.4 0.0 92.00 3.73 0.00 0.34

REMOTE SENSING ANALYSIS OF SUMMER TIME EVAPOTRANSPIRATION USING SEBS ALGORITHM
107
Appendix B contd. 1-Jan-02 4.7 -0.6 -2.0 0.8 0.0 95.00 4.21 0.00 0.422-Jan-02 3.4 -0.2 -1.6 0.9 0.0 94.00 2.49 0.09 0.253-Jan-02 4.0 -3.1 -6.2 0.8 0.0 73.00 4.34 0.37 0.394-Jan-02 2.8 -5.3 -8.8 -1.0 0.0 59.00 4.38 0.40 0.355-Jan-02 2.3 -3.1 -11.2 0.2 0.0 65.00 4.42 0.20 0.406-Jan-02 2.1 0.5 -1.2 2.0 0.5 93.00 1.68 0.19 0.177-Jan-02 0.8 1.9 0.9 2.8 0.3 100.00 1.70 0.11 0.198-Jan-02 1.6 1.7 -0.6 2.8 0.0 95.00 1.72 0.16 0.199-Jan-02 0.7 -1.6 -5.0 3.2 0.0 94.00 4.66 0.00 0.44
10-Jan-02 1.7 -2.1 -6.3 1.7 0.0 95.00 3.56 0.00 0.3311-Jan-02 3.4 1.3 -1.8 2.9 0.6 92.00 1.78 0.25 0.1912-Jan-02 3.3 3.0 1.5 3.9 0.5 96.00 1.81 0.19 0.2113-Jan-02 2.1 4.4 1.8 8.5 0.0 78.00 4.84 0.19 0.5814-Jan-02 2.6 1.4 -2.8 3.2 0.0 86.00 2.49 0.28 0.2715-Jan-02 3.8 2.7 1.1 5.8 1.3 84.00 1.96 0.52 0.2216-Jan-02 2.9 2.2 0.7 4.1 2.1 98.00 2.14 0.13 0.2417-Jan-02 5.3 3.7 1.9 4.9 0.0 89.00 2.18 0.42 0.2618-Jan-02 4.3 4.3 2.4 5.6 2.2 92.00 2.41 0.30 0.2919-Jan-02 5.8 6.1 3.6 8.7 1.9 88.00 3.05 0.50 0.39
20-Jan-02 6.9 7.2 3.7 10.6 8.2 92.00 2.04 0.47 0.2721-Jan-02 6.0 10.5 8.2 12.0 1.0 90.00 2.07 0.60 0.3022-Jan-02 6.3 7.5 5.8 8.9 1.1 83.00 2.44 0.82 0.3323-Jan-02 6.3 7.4 5.5 9.5 2.1 82.00 3.21 0.83 0.4324-Jan-02 8.5 8.3 4.4 10.9 8.2 84.00 2.18 0.93 0.3025-Jan-02 4.6 4.2 0.6 7.2 2.0 85.00 4.17 0.47 0.5026-Jan-02 9.4 9.9 7.2 10.9 19.2 87.00 2.62 0.83 0.3827-Jan-02 6.0 9.3 7.9 12.1 11.7 87.00 3.44 0.71 0.4928-Jan-02 10.5 11.3 9.9 12.7 1.8 79.00 3.65 1.47 0.5529-Jan-02 7.5 9.8 8.3 12.0 0.0 80.00 3.29 1.19 0.4730-Jan-02 5.2 11.1 9.4 12.8 0.0 82.00 3.25 0.95 0.4831-Jan-02 6.8 8.2 6.1 11.6 2.2 77.00 4.00 1.21 0.551-Feb-02 7.2 10.5 7.4 12.3 0.0 80.00 3.47 1.15 0.512-Feb-02 5.9 12.4 10.2 15.9 0.0 58.00 6.46 2.25 0.993-Feb-02 4.2 11.6 7.8 14.9 0.0 54.00 5.59 1.86 0.844-Feb-02 8.4 8.9 6.4 13.3 4.7 73.00 3.46 1.70 0.485-Feb-02 6.3 10.0 7.6 12.9 18.5 91.00 2.71 0.64 0.396-Feb-02 5.3 7.0 5.9 8.7 2.1 87.00 3.42 0.67 0.457-Feb-02 5.6 6.4 4.7 7.6 1.3 85.00 4.50 0.70 0.588-Feb-02 6.0 9.5 5.2 11.8 1.2 90.00 4.07 0.62 0.589-Feb-02 7.5 10.5 6.5 12.7 2.1 83.00 2.98 1.08 0.44
10-Feb-02 6.5 7.3 5.4 9.0 7.8 85.00 3.57 0.83 0.4811-Feb-02 8.9 10.7 8.4 11.9 17.8 91.00 3.03 0.72 0.4512-Feb-02 8.1 11.2 8.4 13.0 0.8 78.00 5.13 1.43 0.7713-Feb-02 3.0 6.5 1.6 9.5 0.3 88.00 5.35 0.52 0.6914-Feb-02 4.9 1.5 -2.2 4.8 0.0 73.00 8.98 0.85 0.9715-Feb-02 3.4 0.2 -4.0 5.6 0.0 72.00 9.08 0.76 0.9316-Feb-02 3.1 1.5 -4.8 8.6 0.0 67.00 9.32 0.93 1.0117-Feb-02 2.0 0.4 -5.6 6.6 0.0 81.00 8.07 0.52 0.8418-Feb-02 4.7 4.1 -0.7 8.4 0.7 85.00 4.90 0.70 0.5919-Feb-02 6.9 4.8 2.5 8.0 6.8 85.00 6.40 0.82 0.7920-Feb-02 6.6 6.6 1.5 10.1 19.5 82.00 7.02 0.98 0.9321-Feb-02 5.3 2.7 0.1 5.7 0.0 58.00 9.70 1.50 1.1122-Feb-02 8.8 5.5 1.2 9.4 11.6 83.00 3.93 1.00 0.5023-Feb-02 8.1 2.9 0.3 5.9 6.8 82.00 6.73 0.91 0.7824-Feb-02 5.2 2.7 0.6 6.3 1.6 82.00 8.08 0.84 0.9325-Feb-02 3.7 5.3 1.6 9.9 7.0 95.00 3.92 0.47 0.4926-Feb-02 10.3 10.1 7.2 12.8 9.7 79.00 5.90 1.59 0.8627-Feb-02 7.9 5.9 4.0 9.9 1.1 76.00 8.35 1.44 1.0828-Feb-02 6.9 5.1 2.8 7.2 1.9 82.00 7.59 1.01 0.95

REMOTE SENSING ANALYSIS OF SUMMER TIME EVAPOTRANSPIRATION USING SEBS ALGORITHM
108
Appendix B contd. 1-Mar-02 3.7 3.1 -3.8 7.6 5.7 84.00 7.81 0.75 0.912-Mar-02 3.1 0.7 -6.3 6.9 0.3 82.00 10.50 0.77 1.113-Mar-02 4.0 4.2 -1.2 8.4 0.0 82.00 9.55 0.91 1.154-Mar-02 3.0 7.3 5.4 9.4 0.0 87.00 4.50 0.77 0.605-Mar-02 2.4 7.0 4.8 9.0 0.0 81.00 5.12 0.88 0.686-Mar-02 7.0 7.1 4.6 10.1 0.9 87.00 4.56 0.92 0.617-Mar-02 8.3 8.4 3.6 11.4 5.9 74.00 8.72 1.69 1.208-Mar-02 3.9 7.3 0.9 12.2 0.0 75.00 13.01 1.42 1.739-Mar-02 7.1 8.1 4.2 12.1 2.2 75.00 9.00 1.65 1.23
10-Mar-02 6.2 6.8 2.4 10.9 0.4 66.00 13.52 1.95 1.7711-Mar-02 4.3 8.0 0.7 14.3 0.0 64.00 12.75 1.97 1.7412-Mar-02 1.3 7.3 1.2 11.4 3.3 86.00 5.02 0.77 0.6713-Mar-02 3.6 4.2 -2.5 7.6 2.0 92.00 5.10 0.61 0.6114-Mar-02 5.0 2.6 -2.7 5.5 0.0 82.00 9.21 0.94 1.0515-Mar-02 5.5 2.8 0.2 5.5 1.6 86.00 6.09 0.81 0.7016-Mar-02 3.0 9.2 3.0 15.5 0.0 78.00 13.11 1.58 1.8517-Mar-02 3.1 10.4 5.8 17.9 1.0 82.00 9.09 1.44 1.3318-Mar-02 5.2 10.9 8.4 14.4 3.5 81.00 8.23 1.53 1.2219-Mar-02 6.8 8.8 6.9 12.5 2.7 79.00 8.35 1.61 1.1720-Mar-02 4.4 9.0 7.1 11.5 5.1 87.00 6.55 1.07 0.9221-Mar-02 4.9 9.7 7.1 14.8 1.5 85.00 8.36 1.34 1.1922-Mar-02 3.8 5.9 2.4 9.6 2.0 80.00 9.64 1.26 1.2223-Mar-02 3.4 4.8 -1.2 10.1 0.1 77.00 14.94 1.47 1.8224-Mar-02 2.3 2.6 -2.7 7.3 0.0 75.00 13.48 1.27 1.5225-Mar-02 1.9 1.6 -5.2 8.0 0.0 71.00 17.04 1.43 1.8526-Mar-02 1.8 2.4 -4.9 8.9 0.0 67.00 17.02 1.54 1.9127-Mar-02 3.0 3.5 -3.2 9.2 0.0 63.00 17.61 1.83 2.0528-Mar-02 2.6 5.8 -3.5 14.1 0.0 59.00 17.84 2.18 2.2529-Mar-02 3.1 8.5 1.6 17.7 0.0 56.00 17.81 2.76 2.4530-Mar-02 1.5 7.8 -1.9 15.4 0.0 69.00 9.92 1.50 1.3431-Mar-02 3.0 11.2 5.0 17.8 0.1 62.00 13.30 2.43 1.98
1-Apr-02 1.8 11.4 4.0 17.9 0.0 71.00 14.12 2.02 2.112-Apr-02 3.5 14.1 7.2 20.7 0.0 49.00 19.23 3.66 3.073-Apr-02 6.2 13.7 9.3 19.4 0.0 44.00 19.32 4.66 3.064-Apr-02 5.0 10.2 4.8 16.4 0.0 47.00 18.73 3.64 2.725-Apr-02 5.6 7.3 2.4 13.0 0.0 48.00 19.91 3.32 2.656-Apr-02 4.3 4.2 -1.9 10.3 0.0 57.00 20.13 2.45 2.427-Apr-02 2.1 5.8 -4.0 12.6 0.0 62.00 20.35 2.23 2.588-Apr-02 3.2 6.7 -3.1 12.8 0.0 52.00 20.43 2.65 2.669-Apr-02 2.3 5.9 -2.5 12.5 0.0 56.00 13.00 2.01 1.65
10-Apr-02 4.9 6.3 1.6 10.9 0.0 55.00 17.51 2.69 2.2611-Apr-02 3.9 7.8 2.5 12.5 0.0 63.00 14.16 2.30 1.9212-Apr-02 4.2 7.5 0.0 14.4 0.0 78.00 15.34 1.95 2.0713-Apr-02 3.7 7.0 3.5 10.3 0.0 80.00 9.33 1.44 1.2414-Apr-02 2.5 6.8 2.4 10.6 0.7 83.00 10.18 1.37 1.3415-Apr-02 3.3 6.9 5.6 7.9 11.9 97.00 7.67 0.85 1.0116-Apr-02 2.3 7.3 6.3 8.3 0.6 96.00 7.74 0.95 1.0317-Apr-02 2.2 8.4 6.2 12.3 1.9 87.00 8.76 1.29 1.2118-Apr-02 2.6 9.1 3.1 14.6 5.7 87.00 10.57 1.46 1.4819-Apr-02 1.9 7.7 1.9 14.0 0.0 82.00 15.92 1.89 2.1420-Apr-02 1.0 6.8 -1.1 13.1 0.0 87.00 9.96 1.31 1.3021-Apr-02 1.1 9.8 -0.2 17.9 0.0 74.00 22.04 2.68 3.1322-Apr-02 2.3 12.7 1.1 19.6 0.0 70.00 14.05 2.39 2.1623-Apr-02 3.9 13.5 10.0 18.0 0.0 73.00 15.49 2.73 2.4324-Apr-02 2.4 13.1 6.7 19.6 0.0 80.00 12.96 2.14 2.0225-Apr-02 2.9 12.1 3.7 20.1 0.0 81.00 17.42 2.49 2.6526-Apr-02 4.7 8.5 6.3 13.6 10.5 90.00 9.79 1.33 1.3627-Apr-02 5.0 6.9 4.4 11.6 10.6 87.00 14.12 1.60 1.8728-Apr-02 5.8 9.3 6.9 12.3 5.2 88.00 9.60 1.41 1.3729-Apr-02 7.3 9.0 6.0 13.1 9.7 77.00 16.24 2.33 2.2930-Apr-02 5.3 10.7 6.5 14.0 0.3 75.00 9.40 2.03 1.39

REMOTE SENSING ANALYSIS OF SUMMER TIME EVAPOTRANSPIRATION USING SEBS ALGORITHM
109
Appendix B contd. 1-May-02 4.9 11.1 5.3 15.5 4.0 77.00 17.35 2.51 2.592-May-02 2.8 10.8 6.1 15.4 1.5 83.00 12.18 1.87 1.803-May-02 3.5 8.7 6.1 10.9 0.0 86.00 9.06 1.40 1.264-May-02 4.4 8.1 6.1 9.9 8.1 92.00 9.48 1.19 1.295-May-02 3.1 8.9 5.9 12.9 15.7 95.00 9.18 1.18 1.286-May-02 1.6 9.3 1.2 13.8 0.3 88.00 12.50 1.68 1.767-May-02 2.0 11.8 4.6 18.0 0.0 82.00 18.59 2.56 2.808-May-02 4.0 12.9 10.1 15.9 0.0 90.00 13.57 1.89 2.119-May-02 3.3 17.3 10.5 24.0 0.0 80.00 18.45 3.20 3.17
10-May-02 2.5 15.1 10.9 18.7 0.3 91.00 12.25 1.94 2.0111-May-02 2.8 13.9 11.5 16.2 0.2 89.00 9.52 1.65 1.5212-May-02 2.0 12.1 9.8 15.0 0.0 90.00 9.38 1.53 1.4313-May-02 2.6 16.6 9.5 22.0 0.0 73.00 21.13 3.55 3.5714-May-02 6.1 13.4 9.9 17.9 2.6 78.00 14.98 2.69 2.3615-May-02 3.8 13.4 8.4 19.6 0.0 75.00 18.30 3.04 2.8716-May-02 2.0 16.2 6.2 23.7 0.0 74.00 26.82 4.13 4.4817-May-02 3.2 15.4 6.8 22.2 0.0 72.00 26.75 4.11 4.4118-May-02 2.7 14.3 9.7 21.3 3.3 87.00 12.95 2.17 2.0819-May-02 2.6 13.9 9.5 17.8 0.0 82.00 14.57 2.38 2.3120-May-02 2.2 16.7 6.9 23.3 0.0 70.00 19.51 3.47 3.3021-May-02 4.0 19.3 7.8 24.8 0.0 60.00 26.64 5.03 4.7622-May-02 3.3 17.4 13.6 22.4 1.5 76.00 14.16 2.96 2.4423-May-02 2.4 15.2 12.0 19.1 0.0 81.00 14.41 2.53 2.3724-May-02 4.2 13.6 7.3 19.1 3.0 81.00 15.26 2.53 2.4225-May-02 4.1 12.0 8.4 16.7 1.3 78.00 15.91 2.59 2.4226-May-02 3.0 12.6 8.7 18.1 1.1 79.00 17.37 2.73 2.6927-May-02 2.9 14.5 8.5 20.0 0.0 70.00 22.63 3.68 3.6628-May-02 2.1 14.9 9.8 19.8 2.1 76.00 14.87 2.68 2.4329-May-02 4.5 13.1 9.4 17.6 0.7 74.00 16.53 2.94 2.5830-May-02 3.2 13.4 8.0 19.0 0.0 74.00 19.41 3.15 3.0431-May-02 4.1 12.9 3.6 19.8 0.0 71.00 22.71 3.53 3.51
1-Jun-02 2.0 12.0 1.3 18.9 0.0 71.00 27.65 3.78 4.182-Jun-02 3.9 16.9 7.3 23.0 0.0 58.00 27.92 5.02 4.743-Jun-02 3.3 18.4 12.2 26.3 0.4 65.00 18.39 4.14 3.234-Jun-02 2.5 19.0 12.5 24.7 0.0 71.00 23.55 4.29 4.195-Jun-02 4.0 20.2 14.7 24.9 3.1 71.00 12.31 3.32 2.246-Jun-02 1.9 16.9 14.0 21.0 10.1 86.00 13.57 2.45 2.327-Jun-02 3.0 16.4 14.0 19.2 2.9 86.00 10.50 2.06 1.778-Jun-02 1.7 16.3 12.3 20.7 0.0 76.00 14.24 2.70 2.409-Jun-02 2.2 18.0 13.2 23.3 1.9 70.00 19.43 3.70 3.39
10-Jun-02 3.9 13.5 8.6 18.6 11.6 86.00 15.31 2.36 2.4211-Jun-02 3.5 13.3 9.4 18.2 1.4 85.00 19.48 2.79 3.0612-Jun-02 3.5 14.8 9.9 19.9 11.9 87.00 13.49 2.25 2.1913-Jun-02 3.9 13.5 11.4 16.1 1.2 87.00 11.22 1.92 1.7714-Jun-02 2.8 17.8 13.3 22.6 4.1 83.00 13.72 2.64 2.3815-Jun-02 4.6 18.3 14.8 21.2 6.7 77.00 18.31 3.49 3.2016-Jun-02 2.8 17.7 13.1 23.0 1.0 83.00 14.99 2.80 2.5917-Jun-02 2.0 24.1 14.1 31.3 0.0 69.00 28.12 5.58 5.4318-Jun-02 4.2 24.8 15.0 33.9 0.0 71.00 21.04 5.21 4.1119-Jun-02 1.3 18.6 10.9 24.4 0.0 72.00 18.34 3.40 3.2220-Jun-02 3.7 16.8 14.7 19.4 4.9 88.00 10.84 2.05 1.8421-Jun-02 2.1 16.1 8.4 21.0 0.0 80.00 16.46 2.84 2.7522-Jun-02 3.5 18.1 8.6 23.6 4.5 75.00 13.96 2.99 2.4323-Jun-02 3.8 16.0 9.7 21.8 0.3 76.00 19.16 3.39 3.1924-Jun-02 2.8 14.9 7.4 20.7 0.0 75.00 23.74 3.69 3.8525-Jun-02 2.5 15.4 6.7 22.4 0.0 76.00 18.31 3.17 3.0026-Jun-02 2.3 16.1 7.9 22.8 0.0 76.00 22.04 3.64 3.6827-Jun-02 4.6 15.1 10.1 20.0 0.0 71.00 20.78 3.70 3.4028-Jun-02 5.6 12.5 9.3 16.1 10.7 86.00 17.23 2.37 2.6529-Jun-02 3.5 13.7 9.5 18.6 0.0 74.00 17.00 3.00 2.6930-Jun-02 4.8 15.4 11.5 18.3 0.0 76.00 13.87 2.80 2.29

REMOTE SENSING ANALYSIS OF SUMMER TIME EVAPOTRANSPIRATION USING SEBS ALGORITHM
110
Appendix B contd. 1-Jul-02 5.3 13.4 12.2 15.2 5.7 91.00 10.34 1.64 1.632-Jul-02 5.8 14.2 11.9 18.2 0.1 80.00 14.45 2.68 2.333-Jul-02 4.5 14.0 11.9 16.9 7.5 94.00 11.13 1.63 1.794-Jul-02 5.3 14.7 9.8 19.6 4.1 83.00 20.17 3.01 3.275-Jul-02 2.9 16.6 10.6 21.7 0.0 75.00 14.38 2.89 2.436-Jul-02 3.0 15.9 12.3 21.4 0.1 86.00 12.71 2.31 2.127-Jul-02 2.6 15.7 10.9 19.8 0.0 84.00 11.25 2.14 1.868-Jul-02 3.2 19.6 13.6 25.5 0.0 73.00 27.54 4.86 4.949-Jul-02 2.3 21.8 14.6 27.7 0.0 73.00 18.11 3.82 3.38
10-Jul-02 2.7 14.3 11.6 18.1 14.1 92.00 10.56 1.74 1.7011-Jul-02 3.3 14.2 7.7 21.3 0.9 83.00 23.08 3.33 3.6912-Jul-02 1.9 16.7 6.0 22.9 0.0 72.00 21.80 3.65 3.6813-Jul-02 2.4 17.4 14.7 20.6 8.4 91.00 12.07 2.12 2.0714-Jul-02 2.7 18.6 15.2 23.1 0.0 90.00 12.04 2.22 2.1115-Jul-02 3.4 20.3 14.9 25.8 0.0 73.00 21.60 4.24 3.9116-Jul-02 3.5 18.7 11.8 24.0 0.0 77.00 10.96 2.65 1.9317-Jul-02 4.3 17.1 13.8 20.6 0.0 83.00 10.13 2.24 1.7318-Jul-02 5.5 15.5 12.7 19.6 0.0 75.00 15.83 3.16 2.6119-Jul-02 2.6 14.9 13.4 17.0 0.0 83.00 9.85 1.96 1.6020-Jul-02 1.5 16.7 12.8 21.7 4.3 78.00 17.67 3.04 2.9921-Jul-02 4.3 15.2 13.3 18.9 8.0 89.00 16.62 2.45 2.7322-Jul-02 4.6 15.3 12.1 20.5 0.0 79.00 14.79 2.81 2.4323-Jul-02 4.5 16.9 14.6 20.0 4.1 85.00 10.47 2.16 1.7824-Jul-02 4.5 16.6 13.8 20.2 0.4 80.00 16.21 2.94 2.7425-Jul-02 2.7 15.7 11.8 20.2 0.0 80.00 12.29 2.37 2.0426-Jul-02 3.5 17.5 12.0 24.5 1.5 87.00 16.82 2.82 2.8927-Jul-02 1.6 20.5 10.6 27.2 0.0 78.00 21.87 3.88 3.9828-Jul-02 1.7 22.8 15.1 29.8 0.0 71.00 26.68 5.00 5.0529-Jul-02 1.5 24.1 16.0 31.3 0.0 68.00 26.73 5.18 5.1730-Jul-02 1.8 23.4 17.2 33.1 1.0 78.00 19.85 4.15 3.8031-Jul-02 1.5 21.2 17.5 29.2 0.6 86.00 14.90 2.93 2.751-Aug-02 3.4 17.9 14.9 20.7 8.5 96.00 9.44 1.57 1.642-Aug-02 1.9 19.1 13.4 25.3 0.0 74.00 23.93 4.10 4.253-Aug-02 1.7 15.7 11.2 19.1 2.0 93.00 10.61 1.76 1.764-Aug-02 1.7 17.8 12.0 23.9 0.0 81.00 18.92 3.17 3.285-Aug-02 2.0 16.5 11.7 21.7 1.5 90.00 13.92 2.26 2.356-Aug-02 2.0 16.3 10.5 22.1 3.8 90.00 11.49 1.97 1.937-Aug-02 0.9 17.7 10.5 23.9 0.0 88.00 12.67 2.23 2.198-Aug-02 1.8 18.6 15.0 23.1 0.0 88.00 13.12 2.34 2.319-Aug-02 1.5 18.5 12.9 25.6 1.4 84.00 15.14 2.71 2.67
10-Aug-02 1.6 16.4 13.9 17.7 8.1 98.00 8.74 1.46 1.4811-Aug-02 3.0 18.6 14.5 23.9 10.7 92.00 10.76 1.93 1.9012-Aug-02 3.9 17.4 12.9 22.2 0.0 85.00 13.96 2.46 2.4013-Aug-02 3.1 17.8 11.6 23.8 0.0 82.00 17.96 3.01 3.1114-Aug-02 1.7 18.2 10.8 25.6 0.0 86.00 14.94 2.57 2.6015-Aug-02 1.5 20.5 13.9 27.5 0.0 80.00 18.87 3.36 3.4416-Aug-02 1.9 21.1 13.7 27.7 0.0 73.00 23.40 4.13 4.3117-Aug-02 2.4 21.8 12.2 28.7 0.0 73.00 22.88 4.19 4.2618-Aug-02 3.2 23.4 17.6 29.4 0.0 71.00 22.04 4.53 4.2219-Aug-02 2.1 22.0 16.8 27.0 0.0 80.00 11.58 2.54 2.1720-Aug-02 1.8 21.5 15.1 29.3 11.4 79.00 16.17 3.16 3.0021-Aug-02 2.6 17.8 16.8 19.7 11.9 98.00 8.18 1.33 1.4222-Aug-02 2.5 16.9 14.1 19.9 0.2 92.00 8.27 1.50 1.4023-Aug-02 1.6 17.0 12.6 21.4 0.0 90.00 10.24 1.77 1.7424-Aug-02 1.9 17.0 13.4 20.6 1.8 96.00 8.27 1.39 1.4125-Aug-02 1.9 17.5 13.7 21.9 0.0 89.00 10.98 1.89 1.8926-Aug-02 3.0 19.0 12.5 24.2 0.0 85.00 17.31 2.79 3.0727-Aug-02 3.0 21.6 16.2 27.3 0.0 86.00 16.24 2.91 3.0228-Aug-02 3.4 20.3 14.6 25.3 0.0 85.00 14.73 2.63 2.6729-Aug-02 1.1 17.4 12.9 22.8 0.0 89.00 9.97 1.74 1.7130-Aug-02 2.4 17.5 10.6 24.3 0.0 86.00 17.23 2.62 2.9631-Aug-02 3.7 16.5 9.3 20.7 0.9 84.00 9.19 1.81 1.55

REMOTE SENSING ANALYSIS OF SUMMER TIME EVAPOTRANSPIRATION USING SEBS ALGORITHM
111
Appendix B contd.
1-Sep-02 1.7 13.9 7.5 20.7 0.0 80.00 12.84 2.02 2.032-Sep-02 3.1 16.0 9.2 22.3 0.0 76.00 19.85 3.00 3.293-Sep-02 3.5 15.9 10.7 22.6 2.4 74.00 18.08 3.02 3.014-Sep-02 1.7 16.3 10.4 22.8 0.0 82.00 15.37 2.35 2.585-Sep-02 1.5 16.1 11.2 22.8 0.0 83.00 13.13 2.09 2.206-Sep-02 3.9 16.7 12.4 21.1 0.0 83.00 10.66 2.02 1.817-Sep-02 3.6 17.6 12.6 22.3 0.0 75.00 11.08 2.43 1.918-Sep-02 2.3 18.8 12.5 25.2 0.0 73.00 16.69 2.91 2.959-Sep-02 3.0 19.0 12.6 27.5 9.9 81.00 13.99 2.62 2.48
10-Sep-02 1.9 14.1 13.2 15.3 12.3 96.00 6.52 1.03 1.0411-Sep-02 1.7 14.9 11.7 17.8 0.7 96.00 6.57 1.05 1.0712-Sep-02 3.3 15.6 8.9 21.4 0.0 83.00 17.57 2.37 2.8913-Sep-02 2.0 14.9 7.3 21.6 0.0 84.00 17.10 2.21 2.7714-Sep-02 2.6 15.0 10.2 20.6 0.0 91.00 7.95 1.30 1.2915-Sep-02 2.1 12.9 6.6 19.3 0.0 84.00 12.87 1.73 1.9916-Sep-02 1.7 12.0 5.0 19.2 0.0 89.00 8.11 1.21 1.2317-Sep-02 2.0 13.8 7.3 19.1 0.0 89.00 6.93 1.17 1.1018-Sep-02 1.0 13.3 7.2 16.6 0.0 91.00 6.01 1.00 0.9419-Sep-02 1.0 13.6 11.5 16.7 0.0 91.00 5.81 1.00 0.9220-Sep-02 1.6 13.7 11.3 17.3 0.0 86.00 5.96 1.13 0.9421-Sep-02 2.0 12.8 10.2 15.7 0.0 90.00 6.22 1.03 0.9622-Sep-02 2.9 11.5 6.6 16.0 1.9 90.00 11.49 1.30 1.7323-Sep-02 5.6 10.9 5.7 15.6 0.0 80.00 13.53 1.79 2.0024-Sep-02 3.2 8.8 3.4 15.4 0.0 79.00 15.51 1.68 2.1525-Sep-02 2.4 11.7 7.0 16.6 6.3 93.00 6.52 0.92 0.9826-Sep-02 2.4 11.4 8.3 15.0 2.5 93.00 5.79 0.86 0.8727-Sep-02 1.8 11.6 7.4 16.0 0.0 84.00 12.04 1.36 1.8028-Sep-02 1.4 12.2 7.6 16.8 0.0 89.00 5.93 0.93 0.9029-Sep-02 1.0 11.7 5.8 18.9 0.0 85.00 11.28 1.27 1.6930-Sep-02 1.7 10.8 4.1 19.3 0.0 84.00 12.99 1.41 1.90
1-Oct-02 1.2 10.8 3.6 19.8 0.0 85.00 10.55 1.21 1.552-Oct-02 1.1 11.6 4.5 17.5 0.0 92.00 5.96 0.83 0.893-Oct-02 2.5 14.3 9.0 18.2 8.6 96.00 4.73 0.74 0.764-Oct-02 2.9 11.5 5.7 17.1 0.0 90.00 9.13 1.04 1.365-Oct-02 4.3 11.6 7.8 14.1 5.8 97.00 4.58 0.59 0.696-Oct-02 4.0 9.0 0.9 13.2 0.5 89.00 7.85 0.87 1.107-Oct-02 2.4 6.7 0.3 12.9 0.1 95.00 5.32 0.59 0.708-Oct-02 2.8 4.8 -2.6 10.1 0.0 82.00 12.40 0.94 1.529-Oct-02 5.3 8.7 3.7 13.5 0.0 80.00 11.85 1.34 1.65
10-Oct-02 5.2 7.2 4.2 11.6 0.0 77.00 11.82 1.37 1.5711-Oct-02 5.1 5.6 1.9 10.2 0.0 71.00 11.54 1.44 1.4612-Oct-02 3.8 4.8 0.9 7.5 0.0 79.00 5.88 0.90 0.7213-Oct-02 3.0 5.6 4.5 7.2 0.0 89.00 4.01 0.62 0.5114-Oct-02 3.5 7.7 5.3 11.2 9.4 97.00 4.26 0.46 0.5815-Oct-02 2.4 7.5 3.3 12.8 0.0 97.00 4.26 0.47 0.5716-Oct-02 5.3 12.3 10.5 14.8 2.1 86.00 6.09 1.07 0.9417-Oct-02 5.0 9.2 5.2 12.5 0.2 87.00 7.78 0.87 1.1018-Oct-02 4.0 6.1 3.0 9.9 3.9 93.00 5.66 0.53 0.7319-Oct-02 3.3 5.0 0.0 10.7 0.0 90.00 8.23 0.59 1.0220-Oct-02 2.1 6.6 3.0 10.8 1.3 87.00 6.52 0.61 0.8521-Oct-02 3.0 9.1 5.3 13.4 6.6 97.00 3.48 0.43 0.4922-Oct-02 4.0 13.6 11.5 16.6 1.8 91.00 5.06 0.76 0.8123-Oct-02 6.0 9.7 5.1 13.8 3.5 86.00 4.56 0.92 0.6624-Oct-02 4.4 7.5 4.9 11.5 0.0 80.00 8.76 0.94 1.1825-Oct-02 5.6 11.5 8.5 14.0 9.5 89.00 3.36 0.80 0.5126-Oct-02 7.6 10.2 7.7 13.4 2.9 81.00 7.30 1.24 1.0627-Oct-02 10.8 10.9 8.1 16.5 14.0 85.00 4.61 1.31 0.6928-Oct-02 6.1 8.5 6.1 12.4 0.3 80.00 7.28 1.09 1.0029-Oct-02 2.6 7.6 5.9 9.8 2.3 86.00 3.30 0.61 0.4430-Oct-02 1.4 6.4 0.9 11.7 0.0 90.00 6.31 0.36 0.8231-Oct-02 1.5 4.4 -0.8 11.5 0.0 91.00 7.47 0.30 0.90

REMOTE SENSING ANALYSIS OF SUMMER TIME EVAPOTRANSPIRATION USING SEBS ALGORITHM
112
Appendix B contd.
1-Nov-02 2.4 7.2 -2.3 12.0 3.5 97.00 2.84 0.32 0.382-Nov-02 3.8 10.9 8.1 15.1 3.6 95.00 3.79 0.43 0.563-Nov-02 3.6 8.5 4.3 13.0 10.4 97.00 2.85 0.33 0.394-Nov-02 2.0 7.3 5.0 9.1 1.0 99.00 2.69 0.26 0.365-Nov-02 1.5 4.3 1.3 5.3 0.0 95.00 2.90 0.27 0.356-Nov-02 3.2 6.6 2.5 10.8 0.0 85.00 5.23 0.50 0.687-Nov-02 3.0 6.4 2.7 9.0 13.5 92.00 2.54 0.40 0.338-Nov-02 5.5 5.6 2.5 9.1 12.7 91.00 3.39 0.46 0.439-Nov-02 4.5 6.2 -0.5 10.2 1.3 86.00 5.05 0.49 0.65
10-Nov-02 2.3 3.8 -2.9 7.7 3.7 93.00 3.51 0.24 0.4211-Nov-02 3.6 8.7 5.7 11.4 1.9 93.00 4.30 0.30 0.6012-Nov-02 5.3 10.0 7.9 11.9 2.1 84.00 2.97 0.82 0.4313-Nov-02 4.1 9.5 7.4 11.6 0.9 88.00 2.83 0.57 0.4114-Nov-02 3.5 10.0 7.2 12.8 0.0 78.00 3.50 0.81 0.5115-Nov-02 1.7 6.5 1.8 12.3 0.0 91.00 2.33 0.34 0.3116-Nov-02 2.5 7.3 3.8 8.9 7.4 99.00 2.16 0.19 0.2917-Nov-02 3.3 8.5 6.8 10.2 4.5 96.00 2.51 0.25 0.3518-Nov-02 2.2 7.9 6.6 9.6 0.0 95.00 2.13 0.27 0.2919-Nov-02 2.3 4.5 -1.1 8.5 0.0 92.00 3.33 0.19 0.4120-Nov-02 3.4 3.2 0.3 6.6 0.0 91.00 4.54 0.15 0.5321-Nov-02 3.6 7.5 3.8 10.7 0.0 86.00 2.63 0.50 0.3622-Nov-02 2.4 8.2 4.6 10.3 0.0 87.00 1.96 0.44 0.2723-Nov-02 2.6 7.3 4.4 11.3 0.1 84.00 4.87 0.24 0.6524-Nov-02 2.0 6.6 1.3 10.7 0.6 91.00 4.34 0.05 0.5725-Nov-02 2.6 5.8 3.8 8.8 4.5 96.00 1.88 0.22 0.2426-Nov-02 2.9 7.2 1.9 10.3 0.8 94.00 2.37 0.22 0.3127-Nov-02 2.7 5.7 1.3 8.9 0.0 90.00 4.78 0.02 0.6028-Nov-02 2.0 7.7 5.0 11.0 0.7 90.00 3.20 0.16 0.4329-Nov-02 1.5 7.8 4.2 10.8 0.2 94.00 2.52 0.13 0.3430-Nov-02 1.3 6.1 3.0 7.8 0.0 99.00 1.75 0.14 0.221-Dec-02 3.4 7.2 6.1 8.8 5.4 87.00 3.91 0.21 0.522-Dec-02 4.2 6.7 4.9 7.8 0.1 91.00 2.02 0.34 0.273-Dec-02 1.9 6.6 2.3 9.6 0.0 90.00 2.78 0.14 0.364-Dec-02 1.5 4.2 -0.7 8.1 0.0 93.00 2.95 0.03 0.365-Dec-02 3.6 4.5 2.5 5.9 0.0 88.00 1.66 0.39 0.206-Dec-02 4.8 0.9 -0.2 2.5 0.0 85.00 1.64 0.47 0.177-Dec-02 4.8 -1.3 -3.7 0.7 1.2 82.00 1.63 0.47 0.168-Dec-02 4.9 -3.6 -6.2 -0.7 0.0 67.00 4.16 0.54 0.379-Dec-02 5.0 -7.1 -8.9 -4.6 0.0 75.00 4.26 0.31 0.32
10-Dec-02 4.5 -7.7 -10.1 -4.8 0.0 74.00 4.32 0.27 0.3111-Dec-02 4.1 -7.1 -10.0 -3.8 0.0 69.00 4.20 0.34 0.3112-Dec-02 2.5 -5.0 -7.9 -1.3 0.0 66.00 2.98 0.36 0.2513-Dec-02 1.8 -4.9 -7.9 -2.6 0.0 80.00 2.53 0.15 0.2114-Dec-02 2.8 -1.5 -2.7 0.3 0.0 84.00 1.55 0.33 0.1515-Dec-02 5.0 0.5 -1.0 1.8 2.0 88.00 1.83 0.34 0.1916-Dec-02 3.8 2.4 0.0 5.7 5.5 97.00 1.54 0.14 0.1717-Dec-02 2.5 -0.1 -1.7 0.9 0.0 99.00 1.54 0.08 0.1618-Dec-02 1.0 -1.6 -7.6 1.3 0.2 97.00 2.03 0.03 0.1919-Dec-02 1.8 -0.3 -3.0 1.1 0.0 100.00 1.53 0.07 0.1520-Dec-02 1.4 -1.9 -7.5 1.0 0.0 95.00 2.94 0.00 0.2821-Dec-02 1.3 -0.3 -1.7 1.0 0.0 100.00 1.53 0.07 0.1622-Dec-02 4.2 1.5 -1.4 3.7 18.1 99.00 1.53 0.09 0.1723-Dec-02 3.5 1.8 0.4 3.2 0.0 97.00 1.54 0.13 0.1724-Dec-02 3.0 7.4 2.6 10.9 4.5 96.00 2.16 0.11 0.2925-Dec-02 2.1 9.8 9.0 11.1 0.1 94.00 1.73 0.21 0.2526-Dec-02 3.7 8.8 7.7 10.1 7.0 92.00 1.55 0.35 0.2227-Dec-02 3.4 10.4 8.3 11.3 4.5 93.00 1.56 0.32 0.2328-Dec-02 4.2 9.1 7.1 10.6 0.9 93.00 2.00 0.28 0.2829-Dec-02 3.5 6.9 6.0 7.9 4.2 93.00 1.57 0.29 0.2130-Dec-02 4.0 3.5 0.7 6.1 14.0 96.00 1.58 0.18 0.1931-Dec-02 4.8 -1.7 -5.0 0.9 0.0 73.00 4.02 0.44 0.39

REMOTE SENSING ANALYSIS OF SUMMER TIME EVAPOTRANSPIRATION USING SEBS ALGORITHM
113
Appendix B contd.
1-Jan-03 3.8 2.6 -3.7 10.2 8.5 91.00 1.61 0.34 0.182-Jan-03 4.3 8.6 5.8 10.1 18.7 96.00 1.62 0.23 0.233-Jan-03 3.3 2.8 0.0 5.9 0.6 93.00 1.63 0.24 0.194-Jan-03 4.6 -2.5 -5.4 0.0 0.0 80.00 1.98 0.45 0.185-Jan-03 3.0 -4.3 -9.4 -1.0 1.1 90.00 1.76 0.20 0.156-Jan-03 4.1 -2.6 -5.9 -0.9 0.0 83.00 3.50 0.23 0.327-Jan-03 2.4 -6.3 -10.1 -4.8 0.0 84.00 3.57 0.08 0.288-Jan-03 2.9 -6.9 -10.4 -4.9 0.0 74.00 3.23 0.26 0.249-Jan-03 2.5 -10.7 -14.7 -6.2 0.0 72.00 4.69 0.15 0.29
10-Jan-03 1.7 -6.1 -14.6 -2.6 0.0 77.00 3.13 0.15 0.2511-Jan-03 1.1 -3.8 -8.5 2.5 0.0 80.00 4.74 0.00 0.4112-Jan-03 4.5 -0.5 -3.7 1.5 0.0 83.00 2.82 0.38 0.2813-Jan-03 5.7 4.8 0.5 7.6 5.0 96.00 1.83 0.23 0.2214-Jan-03 6.1 6.8 6.0 7.6 0.3 92.00 1.86 0.42 0.2415-Jan-03 7.0 5.2 4.1 6.6 1.1 82.00 2.11 0.81 0.2616-Jan-03 5.2 5.1 3.0 7.7 0.0 89.00 3.83 0.34 0.4717-Jan-03 5.5 3.0 0.9 5.1 0.0 85.00 3.22 0.48 0.3718-Jan-03 4.5 3.6 1.6 4.8 0.1 90.00 1.97 0.39 0.2319-Jan-03 4.7 4.5 0.7 7.6 0.2 82.00 2.45 0.64 0.30
20-Jan-03 5.9 7.7 5.8 9.3 1.1 82.00 2.12 0.85 0.2921-Jan-03 3.7 7.4 5.7 9.5 0.5 85.00 2.36 0.58 0.3222-Jan-03 4.5 7.0 6.0 9.3 2.8 87.00 2.95 0.54 0.3923-Jan-03 4.6 5.3 1.1 6.9 1.0 91.00 2.14 0.39 0.2724-Jan-03 2.5 2.3 -1.2 6.0 0.0 82.00 5.88 0.22 0.6525-Jan-03 4.9 3.1 0.1 5.4 2.4 89.00 4.26 0.33 0.4926-Jan-03 4.3 4.2 1.9 7.5 1.6 97.00 2.35 0.22 0.2827-Jan-03 5.0 9.0 7.4 10.0 0.6 96.00 2.30 0.32 0.3228-Jan-03 7.5 5.1 2.0 9.1 8.4 85.00 2.43 0.77 0.3029-Jan-03 4.2 2.8 1.3 4.6 2.3 90.00 2.67 0.39 0.3130-Jan-03 5.0 -0.8 -5.6 2.5 2.9 88.00 3.98 0.35 0.4031-Jan-03 2.2 -6.5 -12.2 -1.9 0.0 80.00 6.07 0.21 0.471-Feb-03 4.4 -3.8 -12.4 -1.0 0.8 81.00 4.98 0.35 0.442-Feb-03 6.0 1.5 -1.8 3.8 7.7 95.00 2.82 0.27 0.313-Feb-03 4.8 1.5 -0.7 4.3 9.5 92.00 5.38 0.28 0.604-Feb-03 5.0 0.6 -0.8 2.2 7.7 95.00 4.95 0.21 0.535-Feb-03 4.1 1.6 0.2 3.1 1.0 90.00 4.88 0.34 0.546-Feb-03 2.1 0.0 -1.7 2.3 0.0 79.00 5.25 0.41 0.547-Feb-03 3.7 2.7 0.8 4.8 0.2 93.00 2.81 0.36 0.328-Feb-03 2.7 5.4 4.4 6.3 0.0 100.00 2.87 0.23 0.369-Feb-03 2.0 4.4 -3.7 8.1 0.0 91.00 3.27 0.38 0.40
10-Feb-03 1.3 -0.4 -4.7 5.1 0.0 87.00 8.39 0.24 0.8511-Feb-03 1.6 -1.6 -6.4 4.3 0.0 85.00 8.49 0.29 0.8112-Feb-03 2.5 -3.6 -8.7 -2.2 0.0 88.00 3.09 0.32 0.2713-Feb-03 3.3 -3.4 -8.2 0.7 0.0 72.00 8.12 0.57 0.7214-Feb-03 3.0 -2.6 -8.1 3.9 0.0 56.00 8.91 0.90 0.8215-Feb-03 3.7 -1.1 -2.8 0.2 0.0 80.00 3.27 0.58 0.3216-Feb-03 3.7 -2.3 -5.6 0.7 0.0 62.00 8.45 0.84 0.7817-Feb-03 3.1 -3.7 -8.5 1.6 0.0 69.00 9.29 0.66 0.8118-Feb-03 3.5 -4.2 -9.0 0.8 0.0 74.00 9.74 0.60 0.8319-Feb-03 4.0 -2.1 -5.9 3.3 0.0 78.00 9.70 0.66 0.9120-Feb-03 3.3 -0.9 -4.8 5.0 0.0 80.00 9.52 0.64 0.9521-Feb-03 2.2 -0.1 -4.3 6.2 0.0 77.00 10.21 0.65 1.0422-Feb-03 2.8 1.3 -3.2 7.9 0.0 74.00 10.54 0.84 1.1423-Feb-03 2.1 3.2 -3.5 11.6 0.0 69.00 10.66 0.97 1.2324-Feb-03 2.0 4.2 -3.8 11.9 0.0 70.00 10.69 0.96 1.2825-Feb-03 2.7 3.3 -1.9 10.6 0.0 60.00 11.12 1.29 1.2926-Feb-03 1.4 3.2 -4.6 12.5 0.0 58.00 11.32 1.05 1.3227-Feb-03 1.3 6.7 -1.9 15.5 0.0 65.00 9.08 1.05 1.1928-Feb-03 2.5 9.4 0.1 13.5 0.0 70.00 7.92 1.17 1.12

REMOTE SENSING ANALYSIS OF SUMMER TIME EVAPOTRANSPIRATION USING SEBS ALGORITHM
114
Appendix B contd.
1-Mar-03 3.3 8.5 6.0 12.5 0.7 79.00 8.90 1.15 1.232-Mar-03 2.7 7.6 5.2 11.5 4.2 92.00 5.04 0.65 0.683-Mar-03 2.2 3.6 -3.5 7.3 0.0 88.00 4.34 0.59 0.514-Mar-03 2.9 5.9 -3.1 9.5 0.0 78.00 9.98 0.98 1.275-Mar-03 3.0 10.5 7.5 14.7 0.0 78.00 8.62 1.30 1.266-Mar-03 3.5 7.2 2.3 9.9 0.8 85.00 4.56 0.84 0.617-Mar-03 3.8 6.2 0.8 10.4 0.2 80.00 6.49 1.03 0.838-Mar-03 7.5 7.5 5.2 10.6 2.4 78.00 5.00 1.41 0.679-Mar-03 6.1 9.2 7.4 12.5 0.5 78.00 6.99 1.51 0.98
10-Mar-03 5.1 10.5 7.6 13.6 0.0 72.00 7.49 1.76 1.0911-Mar-03 5.0 9.2 7.8 10.4 9.4 91.00 4.94 0.80 0.7012-Mar-03 4.9 6.7 1.5 8.6 0.1 86.00 5.32 0.87 0.6913-Mar-03 2.4 3.5 -2.7 10.0 0.0 76.00 12.23 1.16 1.4214-Mar-03 3.6 3.6 -5.4 10.2 0.0 66.00 14.69 1.56 1.7115-Mar-03 3.0 3.3 -3.1 10.0 0.0 76.00 14.91 1.31 1.7216-Mar-03 1.0 3.3 -4.1 12.2 0.0 73.00 15.24 1.25 1.7517-Mar-03 2.5 2.1 -3.6 7.1 0.0 85.00 7.25 0.79 0.8018-Mar-03 1.9 4.7 -4.3 13.3 0.0 74.00 15.58 1.47 1.8919-Mar-03 2.4 2.1 -4.1 6.8 0.0 87.00 5.57 0.71 0.6220-Mar-03 1.8 2.3 -2.7 7.2 0.0 79.00 10.39 1.01 1.1621-Mar-03 3.5 4.7 -2.0 10.4 0.0 66.00 13.28 1.67 1.6222-Mar-03 3.1 5.2 -1.9 12.8 0.0 41.00 16.60 2.51 2.0623-Mar-03 1.9 6.9 -2.0 16.7 0.0 43.00 16.71 2.36 2.1924-Mar-03 3.3 11.1 -1.8 20.3 0.0 48.00 15.39 3.00 2.2725-Mar-03 1.6 9.4 1.2 16.8 0.0 72.00 12.81 1.68 1.8126-Mar-03 2.4 9.6 -0.1 16.9 0.0 66.00 17.39 2.20 2.4727-Mar-03 1.6 10.3 1.6 17.8 0.0 69.00 13.40 1.85 1.9428-Mar-03 3.2 11.6 2.2 18.5 0.0 60.00 15.96 2.62 2.4029-Mar-03 2.3 11.3 3.8 18.0 0.2 72.00 7.00 1.59 1.0530-Mar-03 2.8 6.7 1.2 14.1 0.0 83.00 13.91 1.54 1.8231-Mar-03 2.0 6.2 -1.0 13.1 0.0 72.00 15.52 1.75 1.99
1-Apr-03 5.6 7.9 -2.2 14.4 8.3 71.00 11.09 1.96 1.512-Apr-03 5.5 5.4 2.8 10.3 8.6 86.00 11.75 1.29 1.483-Apr-03 4.5 4.0 -1.3 7.4 0.0 72.00 10.00 1.46 1.194-Apr-03 3.3 4.8 -4.8 9.4 0.0 81.00 11.62 1.29 1.425-Apr-03 5.8 5.8 0.9 10.7 0.0 73.00 12.44 1.82 1.576-Apr-03 4.0 2.7 -3.5 9.2 0.0 62.00 19.01 2.10 2.167-Apr-03 3.3 1.3 -4.7 7.5 0.0 46.00 19.65 2.27 2.128-Apr-03 2.2 0.1 -7.9 6.2 0.0 54.00 14.57 1.62 1.509-Apr-03 3.0 1.0 -7.2 7.8 0.0 61.00 15.45 1.75 1.66
10-Apr-03 2.0 1.7 -2.3 7.0 0.1 83.00 11.09 1.15 1.2311-Apr-03 3.0 3.4 -3.9 9.4 0.0 79.00 11.80 1.37 1.3912-Apr-03 1.7 5.3 -4.2 13.6 0.0 57.00 21.45 2.41 2.6813-Apr-03 2.8 10.1 -1.1 17.5 0.0 48.00 21.07 3.23 3.0314-Apr-03 5.3 13.8 7.2 19.9 0.0 38.00 21.43 4.91 3.3915-Apr-03 4.6 17.0 9.5 24.7 0.0 41.00 21.63 5.32 3.6816-Apr-03 4.2 16.8 11.0 23.3 0.0 37.00 22.15 5.28 3.7417-Apr-03 4.2 14.9 8.1 21.4 0.0 38.00 22.36 4.88 3.6218-Apr-03 5.1 10.6 5.0 16.6 0.0 51.00 21.93 3.86 3.1919-Apr-03 4.7 7.5 4.2 13.3 0.6 71.00 11.62 2.11 1.5520-Apr-03 2.9 9.9 4.8 16.0 0.0 64.00 19.12 2.83 2.7521-Apr-03 2.6 14.6 4.7 23.0 0.0 60.00 22.04 3.70 3.5722-Apr-03 2.7 10.9 5.9 15.7 1.2 75.00 13.07 2.11 1.9323-Apr-03 2.1 11.1 2.2 20.3 0.0 65.00 18.62 2.89 2.7624-Apr-03 1.8 13.8 1.7 22.4 0.1 52.00 21.93 3.56 3.4825-Apr-03 2.5 17.9 10.9 24.2 0.0 52.00 10.39 3.16 1.8026-Apr-03 3.1 13.3 9.0 19.6 22.3 91.00 8.44 1.45 1.3327-Apr-03 6.0 11.9 8.7 15.2 2.5 80.00 14.97 2.31 2.2828-Apr-03 4.4 15.4 9.5 21.7 0.2 74.00 11.66 2.68 1.9329-Apr-03 5.0 13.6 5.5 17.8 1.7 74.00 16.58 2.76 2.6330-Apr-03 3.3 12.0 6.1 16.0 7.8 87.00 9.22 1.55 1.41

REMOTE SENSING ANALYSIS OF SUMMER TIME EVAPOTRANSPIRATION USING SEBS ALGORITHM
115
Appendix B contd.
1-May-03 5.7 11.1 8.3 17.2 4.1 81.00 15.60 2.38 2.322-May-03 3.6 13.6 8.2 20.7 3.6 73.00 14.65 2.79 2.323-May-03 6.8 11.4 7.5 15.6 2.3 72.00 15.46 2.79 2.314-May-03 3.1 16.9 9.2 23.9 0.0 50.00 25.58 4.86 4.355-May-03 2.4 16.7 13.0 22.5 0.0 68.00 14.76 3.07 2.506-May-03 2.3 11.0 3.9 15.8 2.1 84.00 9.96 1.64 1.477-May-03 1.1 10.4 0.4 17.9 0.0 72.00 24.25 3.12 3.528-May-03 2.8 14.0 4.8 21.9 0.2 69.00 21.46 3.49 3.429-May-03 1.6 10.9 5.9 15.4 0.0 78.00 10.70 1.82 1.58
10-May-03 2.3 11.6 3.9 18.3 0.0 72.00 19.86 2.92 2.9811-May-03 2.7 14.7 4.0 20.4 2.1 65.00 22.77 3.64 3.6912-May-03 4.1 12.5 9.3 16.7 0.2 72.00 13.32 2.62 2.0513-May-03 4.6 9.8 5.0 14.6 5.2 75.00 19.43 2.69 2.7914-May-03 4.5 8.6 5.4 13.8 5.0 83.00 18.58 2.25 2.5715-May-03 2.4 8.5 3.0 13.8 12.1 80.00 17.34 2.24 2.3916-May-03 1.8 10.9 1.0 17.0 0.0 67.00 19.54 2.86 2.8817-May-03 2.8 13.6 9.6 16.7 0.0 71.00 12.51 2.48 1.9818-May-03 3.9 14.4 11.2 18.5 13.4 78.00 12.57 2.47 2.0319-May-03 3.5 12.4 9.5 16.1 14.4 90.00 10.49 1.65 1.6120-May-03 5.8 10.9 8.0 15.0 11.4 82.00 16.58 2.35 2.4521-May-03 4.0 12.2 9.6 16.4 3.6 83.00 13.52 2.19 2.0622-May-03 3.9 13.3 10.6 16.4 1.2 91.00 10.03 1.61 1.5723-May-03 4.3 12.8 11.5 15.6 3.5 92.00 10.86 1.61 1.6924-May-03 1.8 14.0 10.1 17.4 10.4 94.00 10.11 1.65 1.6225-May-03 3.6 13.7 7.4 18.0 1.1 83.00 17.90 2.65 2.8426-May-03 1.6 13.8 4.8 20.4 0.0 76.00 20.96 3.19 3.3227-May-03 2.0 15.8 6.5 22.3 0.0 66.00 21.43 3.67 3.5528-May-03 2.8 17.0 12.1 22.4 0.0 65.00 17.28 3.59 2.9429-May-03 2.8 19.2 11.3 25.2 0.0 63.00 25.20 4.75 4.4830-May-03 2.2 21.5 13.9 28.1 0.0 63.00 23.05 4.71 4.2831-May-03 2.9 19.7 12.1 26.1 0.0 69.00 23.92 4.54 4.30
1-Jun-03 2.2 21.5 12.2 27.7 0.0 64.00 27.44 5.18 5.092-Jun-03 3.0 21.6 16.6 30.0 6.8 75.00 21.19 4.46 3.943-Jun-03 1.7 20.7 15.3 25.7 0.2 78.00 17.57 3.42 3.214-Jun-03 2.6 21.7 14.0 29.5 9.9 76.00 21.70 4.33 4.045-Jun-03 2.0 17.1 9.1 21.4 0.1 82.00 17.24 2.93 2.946-Jun-03 2.3 17.6 7.2 24.3 0.0 68.00 27.34 4.58 4.717-Jun-03 2.0 20.8 11.6 28.0 0.0 70.00 25.13 4.70 4.608-Jun-03 3.7 19.2 13.1 29.3 4.0 79.00 18.57 3.81 3.319-Jun-03 4.1 15.3 9.9 20.9 0.0 72.00 23.97 3.97 3.93
10-Jun-03 2.8 19.7 12.6 25.4 1.3 72.00 14.28 3.26 2.5711-Jun-03 4.2 18.4 11.5 23.0 0.0 68.00 25.90 4.66 4.5312-Jun-03 2.1 17.9 10.1 25.1 7.2 76.00 21.58 3.80 3.7413-Jun-03 1.4 16.7 10.3 22.9 0.0 72.00 20.15 3.49 3.4014-Jun-03 2.8 15.6 9.1 20.7 0.0 69.00 16.84 3.23 2.7815-Jun-03 2.0 16.3 7.2 22.4 0.0 70.00 28.71 4.50 4.8116-Jun-03 1.6 16.5 7.6 22.4 0.0 73.00 24.77 3.99 4.1717-Jun-03 2.0 18.8 10.2 25.6 9.4 69.00 20.20 3.87 3.5718-Jun-03 3.8 19.0 14.6 24.5 3.2 75.00 17.71 3.67 3.1419-Jun-03 5.7 18.3 16.0 22.0 4.2 81.00 12.50 2.83 2.1920-Jun-03 5.5 14.8 9.9 19.5 0.0 68.00 21.26 3.90 3.4521-Jun-03 3.3 14.3 8.1 20.4 0.0 71.00 18.97 3.36 3.0422-Jun-03 2.0 17.4 7.9 23.0 0.0 72.00 16.46 3.14 2.8323-Jun-03 5.1 19.8 13.3 27.4 0.0 72.00 18.12 4.22 3.2724-Jun-03 4.0 16.5 10.4 21.0 0.0 72.00 18.74 3.52 3.1625-Jun-03 2.5 14.5 7.1 20.4 0.0 76.00 20.60 3.29 3.3226-Jun-03 3.3 16.5 8.9 22.8 0.0 69.00 28.91 4.69 4.8727-Jun-03 3.3 20.4 13.6 26.0 0.0 58.00 26.39 5.39 4.8028-Jun-03 2.0 17.7 11.9 22.5 0.0 80.00 11.21 2.35 1.9429-Jun-03 1.8 16.6 8.4 23.1 0.0 74.00 21.36 3.63 3.6130-Jun-03 2.4 17.1 10.0 21.9 3.5 82.00 14.29 2.64 2.45

REMOTE SENSING ANALYSIS OF SUMMER TIME EVAPOTRANSPIRATION USING SEBS ALGORITHM
116
Appendix B contd.
1-Jul-03 4.2 16.4 13.3 21.4 9.0 83.00 17.78 3.04 3.012-Jul-03 5.1 15.1 12.6 18.0 5.5 89.00 11.98 2.00 1.973-Jul-03 4.8 14.6 11.5 17.7 10.8 93.00 12.57 1.82 2.044-Jul-03 4.9 14.6 13.4 17.6 0.1 89.00 10.70 1.87 1.735-Jul-03 4.5 15.3 13.2 19.4 0.2 83.00 11.71 2.33 1.926-Jul-03 2.2 14.3 9.2 17.2 0.1 88.00 10.25 1.80 1.647-Jul-03 1.4 16.4 10.0 21.9 0.0 80.00 15.95 2.78 2.688-Jul-03 1.8 17.5 8.2 23.4 0.0 75.00 18.16 3.25 3.129-Jul-03 2.8 17.4 9.5 22.4 0.0 76.00 19.94 3.47 3.42
10-Jul-03 1.1 17.1 7.3 24.4 0.0 73.00 27.00 4.32 4.6011-Jul-03 4.0 19.3 10.5 26.4 0.0 69.00 19.64 4.18 3.5012-Jul-03 2.6 15.9 9.6 22.2 0.0 75.00 20.39 3.46 3.3913-Jul-03 1.9 16.8 7.3 23.2 0.0 72.00 26.36 4.21 4.4614-Jul-03 3.8 20.2 12.3 26.6 0.0 59.00 28.49 5.65 5.1615-Jul-03 4.3 23.6 15.3 29.7 0.0 50.00 28.39 6.73 5.4516-Jul-03 4.1 25.1 18.3 33.4 10.3 56.00 24.51 6.57 4.8217-Jul-03 4.6 18.8 15.8 22.1 7.7 83.00 16.48 3.04 2.9118-Jul-03 3.8 19.7 14.1 24.4 0.1 77.00 18.40 3.59 3.3019-Jul-03 2.0 23.3 13.6 30.1 0.0 61.00 26.80 5.34 5.1120-Jul-03 2.5 24.1 15.7 32.4 1.5 61.00 22.77 5.25 4.4121-Jul-03 1.3 20.3 14.4 27.5 1.0 75.00 20.14 3.77 3.6622-Jul-03 2.9 19.4 13.5 25.0 0.3 78.00 20.83 3.76 3.7223-Jul-03 2.1 19.3 11.5 26.1 0.0 74.00 21.13 3.86 3.7624-Jul-03 2.1 18.4 14.2 23.9 4.8 85.00 14.66 2.68 2.5725-Jul-03 3.1 18.9 12.6 24.4 0.4 75.00 19.78 3.68 3.5026-Jul-03 3.5 19.0 16.2 23.9 3.4 77.00 15.29 3.22 2.7227-Jul-03 4.5 19.3 13.2 23.9 6.3 84.00 14.83 2.81 2.6528-Jul-03 2.0 16.7 10.3 23.4 0.0 82.00 17.60 2.96 2.9729-Jul-03 2.3 19.2 8.8 25.6 0.0 66.00 23.34 4.22 4.1430-Jul-03 2.3 18.4 13.1 22.4 0.3 78.00 10.11 2.28 1.7731-Jul-03 1.2 19.4 14.0 26.0 0.0 79.00 20.11 3.53 3.591-Aug-03 1.4 20.7 11.8 27.8 0.0 75.00 23.14 4.10 4.232-Aug-03 2.1 21.7 13.8 28.4 0.0 76.00 22.46 4.17 4.173-Aug-03 2.2 21.4 14.6 28.0 0.0 74.00 24.70 4.50 4.564-Aug-03 2.7 21.6 13.1 29.0 0.0 65.00 25.46 4.97 4.725-Aug-03 2.6 22.3 12.8 30.1 0.0 65.00 24.04 4.87 4.516-Aug-03 2.8 24.0 16.5 31.3 0.0 55.00 21.73 5.24 4.197-Aug-03 1.8 26.3 17.2 35.5 0.0 54.00 22.48 5.27 4.498-Aug-03 1.8 26.5 15.9 36.0 0.0 52.00 23.04 5.39 4.619-Aug-03 2.2 22.3 15.0 29.4 0.0 78.00 23.24 4.29 4.36
10-Aug-03 1.5 22.0 16.3 30.5 0.0 74.00 20.81 4.02 3.8911-Aug-03 1.2 24.5 14.2 34.3 0.0 63.00 20.48 4.30 3.9812-Aug-03 2.3 26.4 15.7 35.7 0.0 63.00 20.85 4.99 4.1713-Aug-03 4.0 21.2 13.1 28.0 0.0 72.00 18.13 3.93 3.3414-Aug-03 3.8 18.0 12.4 23.3 0.0 69.00 19.19 3.71 3.3415-Aug-03 3.3 16.7 8.0 24.0 0.0 68.00 22.24 3.85 3.7616-Aug-03 2.0 15.9 6.6 23.4 0.0 67.00 20.23 3.36 3.3617-Aug-03 2.6 18.2 10.4 23.5 0.2 68.00 12.77 2.83 2.2318-Aug-03 2.7 19.3 14.9 22.6 0.2 81.00 8.72 2.06 1.5619-Aug-03 3.8 17.2 6.9 23.1 0.8 78.00 13.70 2.61 2.3420-Aug-03 1.9 16.1 7.6 22.8 0.0 71.00 14.23 2.61 2.3821-Aug-03 2.7 16.4 6.7 24.4 0.0 73.00 14.75 2.81 2.4822-Aug-03 4.4 17.1 12.6 20.5 0.4 86.00 8.58 1.81 1.4723-Aug-03 3.3 18.3 9.4 24.0 3.1 83.00 15.28 2.61 2.6724-Aug-03 1.8 16.5 7.9 20.6 0.0 79.00 7.96 1.71 1.3425-Aug-03 1.8 18.6 14.5 24.7 0.0 70.00 15.47 2.95 2.7226-Aug-03 2.9 17.2 11.1 23.2 0.0 76.00 14.10 2.67 2.4127-Aug-03 3.1 16.1 12.8 19.4 0.0 70.00 9.26 2.34 1.5528-Aug-03 1.6 16.1 12.0 21.2 0.2 70.00 9.62 2.07 1.6129-Aug-03 3.3 12.8 10.2 14.5 16.6 95.00 7.44 1.10 1.1630-Aug-03 3.2 13.7 7.8 20.6 1.9 81.00 17.97 2.55 2.8531-Aug-03 3.9 13.1 8.0 19.2 0.3 79.00 14.29 2.29 2.23

REMOTE SENSING ANALYSIS OF SUMMER TIME EVAPOTRANSPIRATION USING SEBS ALGORITHM
117
Appendix B contd.
1-Sep-03 3.3 12.7 8.6 18.0 6.1 79.00 15.15 2.26 2.342-Sep-03 1.3 12.2 4.1 19.3 0.0 75.00 17.85 2.34 2.713-Sep-03 1.1 12.3 3.1 20.2 0.0 82.00 15.26 2.03 2.324-Sep-03 1.3 14.1 5.3 21.8 0.0 78.00 18.02 2.46 2.875-Sep-03 2.9 17.6 11.0 24.3 0.0 64.00 17.41 3.32 3.006-Sep-03 2.1 16.4 13.3 21.0 1.5 83.00 7.93 1.63 1.337-Sep-03 1.5 15.1 10.8 18.8 0.9 92.00 8.24 1.33 1.358-Sep-03 1.5 13.4 12.2 14.3 14.2 98.00 6.68 1.01 1.059-Sep-03 2.4 14.0 7.8 20.1 1.2 87.00 11.61 1.70 1.86
10-Sep-03 2.5 11.3 7.0 14.2 16.8 96.00 7.56 0.99 1.1311-Sep-03 3.3 13.0 7.7 18.2 1.4 90.00 11.34 1.50 1.7712-Sep-03 1.4 12.3 6.7 19.5 0.3 94.00 9.04 1.24 1.3813-Sep-03 1.5 12.0 4.4 19.7 0.0 83.00 16.97 2.01 2.5614-Sep-03 1.1 12.8 4.8 20.8 0.0 80.00 17.50 2.11 2.6915-Sep-03 0.9 14.6 6.9 22.6 0.0 83.00 14.46 1.93 2.3316-Sep-03 1.3 14.9 8.0 22.9 0.0 80.00 14.28 2.00 2.3217-Sep-03 1.3 16.0 8.1 24.7 0.0 78.00 15.88 2.25 2.6418-Sep-03 3.0 19.5 10.1 26.5 0.0 63.00 16.50 3.22 2.9519-Sep-03 2.6 17.6 12.3 24.5 0.0 82.00 15.12 2.31 2.6120-Sep-03 2.0 19.5 12.0 27.7 0.0 72.00 15.26 2.67 2.7321-Sep-03 2.6 19.2 14.2 23.9 0.0 71.00 14.48 2.58 2.5722-Sep-03 5.2 21.0 11.1 26.9 1.9 60.00 14.95 3.83 2.7623-Sep-03 3.2 9.4 4.5 14.7 10.8 91.00 9.24 1.06 1.3124-Sep-03 1.3 8.8 2.6 15.8 0.0 82.00 13.77 1.40 1.9025-Sep-03 1.9 10.5 2.1 17.8 0.0 74.00 14.97 1.73 2.1726-Sep-03 2.9 12.9 6.6 18.8 0.0 70.00 11.59 1.95 1.8027-Sep-03 1.6 11.8 4.5 17.9 0.0 80.00 12.14 1.45 1.8328-Sep-03 2.2 10.6 4.1 14.7 2.6 90.00 5.11 0.84 0.7529-Sep-03 2.0 10.2 3.7 14.7 1.7 91.00 8.06 0.94 1.1730-Sep-03 2.2 9.9 2.1 16.8 0.0 84.00 12.20 1.30 1.75
1-Oct-03 2.5 11.5 5.7 16.4 0.1 84.00 9.28 1.21 1.392-Oct-03 1.6 12.6 8.2 17.6 0.0 90.00 10.48 1.15 1.623-Oct-03 1.9 13.2 10.2 16.0 1.9 92.00 4.92 0.82 0.774-Oct-03 3.0 9.8 6.9 14.0 1.9 92.00 9.13 0.91 1.315-Oct-03 3.0 8.0 2.3 14.2 0.0 83.00 11.46 1.16 1.566-Oct-03 6.1 8.1 5.4 10.2 5.4 89.00 5.14 0.84 0.717-Oct-03 5.9 8.1 5.3 10.9 14.6 91.00 6.92 0.79 0.958-Oct-03 5.0 9.7 7.6 12.3 10.9 91.00 4.63 0.78 0.669-Oct-03 4.0 11.7 7.9 13.3 1.0 87.00 4.81 0.93 0.73
10-Oct-03 5.3 12.6 8.8 17.0 1.4 85.00 7.01 1.24 1.0811-Oct-03 3.1 9.9 2.3 13.6 0.0 84.00 4.23 0.88 0.6112-Oct-03 1.6 7.0 0.4 13.9 0.0 83.00 10.36 0.86 1.3613-Oct-03 2.8 7.4 -0.1 13.5 0.0 81.00 8.42 0.95 1.1214-Oct-03 3.6 6.8 3.1 11.6 0.0 76.00 11.27 1.15 1.4715-Oct-03 3.0 6.2 1.2 12.3 0.0 79.00 11.00 0.99 1.4016-Oct-03 3.0 5.5 0.0 11.0 0.0 81.00 10.81 0.86 1.3517-Oct-03 3.2 5.2 0.9 11.2 0.0 77.00 10.47 0.98 1.3018-Oct-03 2.6 4.8 -1.7 12.3 0.0 75.00 10.43 0.94 1.2819-Oct-03 1.8 3.5 -2.9 11.9 0.0 83.00 9.89 0.66 1.1720-Oct-03 2.6 5.0 -2.5 8.9 0.0 93.00 4.11 0.45 0.5121-Oct-03 2.3 4.7 -0.7 9.4 0.6 91.00 5.36 0.48 0.6622-Oct-03 3.3 3.8 1.0 7.4 0.0 88.00 4.65 0.55 0.5523-Oct-03 3.7 0.6 -6.1 6.3 0.0 82.00 8.46 0.60 0.8924-Oct-03 2.9 -0.6 -8.5 2.5 1.1 96.00 3.29 0.27 0.3325-Oct-03 4.5 4.7 1.3 8.1 2.5 95.00 3.82 0.38 0.4726-Oct-03 3.5 5.0 -0.9 8.1 4.1 91.00 3.49 0.46 0.4327-Oct-03 1.0 0.3 -4.7 7.1 0.0 87.00 8.60 0.29 0.8928-Oct-03 1.2 0.2 -4.6 8.3 0.0 92.00 6.85 0.29 0.7129-Oct-03 3.1 4.3 -2.6 9.3 0.0 82.00 8.11 0.55 0.9930-Oct-03 2.8 6.7 4.6 9.3 0.0 88.00 3.72 0.53 0.4931-Oct-03 3.3 7.7 3.5 11.6 3.3 91.00 2.89 0.51 0.40

REMOTE SENSING ANALYSIS OF SUMMER TIME EVAPOTRANSPIRATION USING SEBS ALGORITHM
118
Appendix B contd.
1-Nov-03 3.5 9.0 7.9 10.0 1.5 97.00 2.84 0.34 0.402-Nov-03 6.0 9.5 6.0 11.7 5.0 87.00 4.07 0.74 0.583-Nov-03 6.3 10.6 8.1 12.9 8.3 85.00 4.05 0.91 0.604-Nov-03 2.9 7.7 1.1 12.9 0.0 88.00 7.31 0.39 0.985-Nov-03 2.3 7.5 -0.9 13.9 0.0 88.00 6.43 0.37 0.866-Nov-03 2.3 8.0 1.5 13.9 0.0 76.00 7.09 0.57 0.967-Nov-03 4.7 5.0 2.2 7.5 0.0 84.00 6.96 0.49 0.858-Nov-03 4.7 6.6 4.4 9.3 0.0 80.00 5.94 0.72 0.779-Nov-03 3.2 7.1 2.5 12.3 0.0 82.00 6.62 0.50 0.87
10-Nov-03 2.7 5.6 2.2 10.2 0.0 88.00 5.25 0.32 0.6611-Nov-03 2.6 2.1 -0.7 4.0 0.0 91.00 2.36 0.32 0.2612-Nov-03 2.0 3.3 -0.8 6.0 0.0 87.00 4.09 0.26 0.4813-Nov-03 2.3 8.7 5.8 12.9 0.1 90.00 4.65 0.29 0.6414-Nov-03 3.6 6.9 3.9 9.1 1.6 91.00 2.55 0.40 0.3415-Nov-03 5.3 8.3 5.4 9.8 0.0 86.00 2.29 0.68 0.3116-Nov-03 1.7 5.8 3.7 7.3 5.6 97.00 2.16 0.22 0.2817-Nov-03 5.1 7.7 6.1 9.2 1.2 93.00 2.21 0.40 0.3018-Nov-03 5.3 10.9 7.9 12.6 1.1 97.00 2.09 0.28 0.3119-Nov-03 6.0 12.4 11.4 13.3 0.3 91.00 2.06 0.61 0.3220-Nov-03 4.0 10.1 8.2 11.9 0.1 93.00 2.03 0.40 0.2921-Nov-03 3.5 9.2 6.7 11.0 0.0 87.00 2.15 0.54 0.3022-Nov-03 3.1 11.8 8.6 14.0 2.0 85.00 2.47 0.58 0.3823-Nov-03 3.4 13.4 11.8 16.3 0.9 77.00 2.01 1.04 0.3224-Nov-03 1.8 9.0 6.9 12.3 1.8 95.00 1.90 0.26 0.2725-Nov-03 2.0 7.0 5.9 8.9 0.0 94.00 2.48 0.19 0.3326-Nov-03 3.8 8.9 6.5 11.2 2.0 79.00 3.55 0.62 0.5027-Nov-03 1.5 6.5 4.6 8.2 0.0 97.00 1.82 0.18 0.2428-Nov-03 1.5 3.6 -0.9 9.0 0.0 95.00 4.46 0.00 0.5329-Nov-03 2.8 3.8 2.0 6.2 0.0 94.00 4.15 0.00 0.4930-Nov-03 2.9 6.7 4.9 8.1 0.5 91.00 1.75 0.33 0.231-Dec-03 3.8 8.6 6.4 11.8 1.1 82.00 2.81 0.59 0.392-Dec-03 2.3 4.7 0.0 7.0 0.0 91.00 2.05 0.22 0.253-Dec-03 2.4 2.8 -1.1 5.4 0.0 100.00 1.69 0.09 0.194-Dec-03 4.2 4.3 3.3 5.4 0.0 98.00 1.68 0.14 0.205-Dec-03 2.2 4.0 3.0 4.8 0.0 98.00 1.66 0.13 0.206-Dec-03 4.1 3.2 -2.9 8.8 1.2 76.00 3.42 0.57 0.397-Dec-03 2.2 -2.7 -6.4 1.7 0.0 78.00 4.39 0.08 0.408-Dec-03 1.4 -3.5 -8.2 2.8 0.0 81.00 4.36 0.00 0.389-Dec-03 1.5 -2.4 -9.1 5.8 0.0 75.00 4.32 0.06 0.40
10-Dec-03 1.6 -2.0 -6.9 4.9 0.0 81.00 4.32 0.00 0.4111-Dec-03 5.8 1.9 -2.0 5.9 5.0 91.00 1.58 0.35 0.1812-Dec-03 2.7 2.7 -4.7 6.9 0.7 97.00 2.54 0.02 0.2913-Dec-03 7.1 11.0 6.9 12.0 33.5 97.00 1.56 0.23 0.2314-Dec-03 6.9 6.5 2.5 10.6 5.9 86.00 2.77 0.56 0.3615-Dec-03 5.3 1.9 0.7 4.3 2.2 88.00 2.38 0.34 0.2616-Dec-03 3.5 4.6 1.9 6.6 0.0 87.00 2.65 0.25 0.3217-Dec-03 3.6 3.6 0.4 6.6 0.0 84.00 2.89 0.30 0.3418-Dec-03 2.0 2.7 -3.0 8.5 0.0 79.00 4.09 0.06 0.4719-Dec-03 3.1 3.3 0.8 5.3 0.0 91.00 1.53 0.27 0.1820-Dec-03 5.4 7.5 4.8 10.2 4.4 92.00 1.53 0.39 0.2121-Dec-03 8.2 4.9 1.6 8.3 6.4 84.00 1.53 0.76 0.1922-Dec-03 3.6 0.1 -4.5 2.9 0.5 85.00 3.56 0.13 0.3723-Dec-03 4.1 0.3 -2.9 1.6 4.4 98.00 1.54 0.10 0.1624-Dec-03 5.0 3.2 1.6 4.9 0.4 95.00 1.76 0.19 0.2025-Dec-03 5.3 7.1 4.8 8.3 0.0 92.00 1.54 0.37 0.2026-Dec-03 6.0 7.2 6.0 8.5 0.0 85.00 2.36 0.59 0.3127-Dec-03 6.2 6.8 5.1 8.8 4.8 82.00 2.90 0.65 0.3828-Dec-03 5.2 5.7 2.7 9.5 18.4 91.00 1.56 0.40 0.2029-Dec-03 4.3 2.8 -0.6 5.6 0.5 88.00 2.36 0.30 0.2730-Dec-03 1.0 2.0 0.2 4.1 0.0 93.00 2.31 0.04 0.2631-Dec-03 2.2 0.2 -5.0 2.1 0.0 96.00 1.59 0.13 0.16

REMOTE SENSING ANALYSIS OF SUMMER TIME EVAPOTRANSPIRATION USING SEBS ALGORITHM
119
Appendix C: Surveyed trees during field work in Regge and Dinkel
Number date X Y1 9/22/2005 52.37283 6.51892 birch 20.1 26.0 27.0 11.402 9/22/2005 52.37278 6.51877 oak 28.6 20.0 36.0 12.013 9/22/2005 birch 27.2 28.0 46.0 16.064 9/22/2005 52.31368 6.41276 pine 18.6 37.0 33.0 15.625 9/22/2005 52.23591 6.49297 European beech 19.0 51.5 100.0 25.496 9/22/2005 pine 24.4 50.0 58.0 30.687 9/23/2005 52.32996 7.02922 pine 17.9 52.0 29.0 24.518 9/23/2005 52.32973 7.02958 white birch 14.8 50.0 23.0 19.249 9/23/2005 52.32999 7.02931 white birch 9.8 55.0 15.5 15.60
10 9/23/2005 52.32908 7.03071 oak 10.0 56.0 16.0 16.4311 9/23/2005 52.32911 7.03073 oak 14.6 58.0 62.8 24.9612 9/23/2005 52.32978 7.02992 birch 9.7 55.0 50.5 15.4513 9/23/2005 52.32943 7.03027 oak 10.0 36.0 16.0 8.8714 9/23/2005 52.32903 7.03066 oak 14.8 58.0 62.8 25.2815 9/27/2005 52.23229 6.94039 beech 23.1 50.0 74.5 29.1316 9/27/2005 52.23162 6.93956 pine 19.9 57.0 51.0 32.2417 9/27/2005 52.23237 6.94179 beech 16.4 56.0 38.0 25.8418 9/27/2005 52.23212 6.94249 white birch 10.0 58.0 14.5 17.6019 9/27/2005 52.23222 6.94063 pine 13.1 59.0 38.5 23.4020 9/27/2005 52.24277 6.94534 white birch 8.5 49.0 15.0 11.3821 9/27/2005 52.24276 6.94630 pine 10.4 47.0 24.0 12.7022 9/27/2005 52.24232 6.93774 pine 18.6 54.0 33.5 27.2023 9/27/2005 52.24203 6.93923 oak 18.3 57.0 37.0 29.7824 9/27/2005 52.26117 6.95806 oak 33.6 52.0 58.0 44.6125 9/27/2005 52.26128 6.95863 pine 18.0 50.0 44.0 23.0526 9/27/2005 52.26179 6.95951 pine 9.0 43.0 15.6 9.9927 9/27/2005 52.26240 6.95999 beech 15.9 15.9 51.0 6.1328 9/27/2005 52.26306 6.95982 pine 16.5 16.5 59.0 6.4929 9/27/2005 52.26241 6.95920 pine 16.8 16.8 52.0 6.6730 9/27/2005 52.26810 6.91629 pine 19.4 48.0 34.5 23.1531 9/27/2005 52.26887 6.91645 whit birch 25.7 46.0 40.5 28.2132 9/27/2005 52.26998 6.91600 pine 23.8 44.0 39.6 24.5833 9/27/2005 52.27094 6.91446 oak 29.5 49.0 83.7 35.5434 9/27/2005 52.27164 6.91361 pine 15.4 42.0 17.3 15.4735 9/27/2005 52.27264 6.91083 white birch 15.4 54.0 34.6 22.7336 9/27/2005 52.27356 6.90886 beech 29.4 44.0 60.0 29.9937 9/27/2005 52.27276 6.91034 oak 13.9 55.0 32.0 21.4538 9/27/2005 52.27160 6.90958 pine 17.1 56.0 24.2 26.9539 9/27/2005 52.27119 6.91090 oak 21.0 50.0 60.4 26.6340 9/27/2005 52.27118 6.91105 beech 17.3 56.0 32.6 27.1741 9/27/2005 52.26496 6.91459 populier boom 15.1 55.0 56.0 23.1742 9/27/2005 52.30743 6.88507 pine 19.8 45.0 37.5 21.4043 9/27/2005 52.30732 6.88769 red birch 30.0 40.0 280.0 26.7744 9/28/2005 52.45289 6.65869 oak 17.9 33.0 13.22
height (m)treeCoordinate
b (m) angle(degree) diameter(cm)

REMOTE SENSING ANALYSIS OF SUMMER TIME EVAPOTRANSPIRATION USING SEBS ALGORITHM
120
Appendix D: Calibration coefficients (gains and offsets) of Landsat 7 ETM used for ATCOR
bands Co C1(mWcm-2sr-1mm-1)1 -0.6200 0.0778742 -0.6400 0.0798823 -0.5000 0.0621654 -0.5100 0.0969295 -0.1002 0.012622
6H 0.3200 0.0037217 -0.0350 0.004390
a. for Aug. 2000, May 2001 and Aug. 2002
bands Co C1 (mWcm-2sr-1mm-1)1 -0.6200 0.1180712 -0.6400 0.1209843 -0.5000 0.0942524 -0.5100 0.0969295 -0.1002 0.019122
6H 0.3200 0.0037217 -0.0350 0.006650
b. for May 31, 2003

REMOTE SENSING ANALYSIS OF SUMMER TIME EVAPOTRANSPIRATION USING SEBS ALGORITHM
121
Appendix E: Some constants used in SEBS algorithm (Source: Su, 2002)

REMOTE SENSING ANALYSIS OF SUMMER TIME EVAPOTRANSPIRATION USING SEBS ALGORITHM
122
Appendix F: Landuse classes and their associated zom values
__________________________________________________________________________________ Land use classes zom (m) Source
1 Grass 0.0300 Wieringa, 1993 2 Maize 0.1200 Jacobs and van Boxel, 1988 3 Potatoes 0.0639 Su, 2005 4 Beets 0.0639 Su, 2005 5 Cereals 0.1200 Aggregating with Maize 6 Other Crops 0.0639 Su, 2005 7 Green houses 0.4066 Su, 2005 8 Orchards 0.6065 Su, 2005 9 Bulbs 0.0639 Su, 2005 10 Forest 2.3000 Wieringa, 1993 11 Heath 0.0280 Wieringa, 1993 12 Other open spaces in natural areas 0.0280 Aggregating with heath 13 Bare soil 0.0012 Su, 2005 14 Water 0.0002 Brutsaert, 1982 15 Built up area in Urban 1.1052 Su, 2005 16 Built up area in Rural 0.5488 Su, 2005 17 Main roads and railways 0.0035 Su, 2005

REMOTE SENSING ANALYSIS OF SUMMER TIME EVAPOTRANSPIRATION USING SEBS ALGORITHM
123
Appendix G: List of meteorological parameters during overpass time (Source: www.knmi.com)
OT T U RH K↓↓↓↓ ea dew T P � es ρρρρ(hr) (C) (ms-1) (%) (wm-2) (kPa) (C) (kPa) (kPaC-1) (kPa) (kg m-3)
9-Sep-99 252 10.33 24.4 3 57 725 1.735 15.3 102.25 0.18 3.05 1.18 0.0105626-Aug-00 239 10.30 22.0 5 55 828 1.435 12.5 101.46 0.16 2.64 1.19 0.0088125-May-01 145 10.25 18.1 3 44 1085 0.900 5.5 102.22 0.13 2.08 1.20 0.0054816-Aug-02 228 10.26 26.1 2 58 902 1.960 17.1 101.97 0.20 3.38 1.17 0.0119731-May-03 151 10.27 23.4 4 62 986 1.770 15.6 101.31 0.17 2.88 1.19 0.0108820-Sep-03 263 10.25 24.0 3 60 653 1.765 15.6 102.12 0.18 2.97 1.18 0.01076
6-Sep-04 250 10.27 24.1 5 56 801 1.665 14.7 102.69 0.18 3.00 1.18 0.0100924-Aug-05 236 10.26 18.8 5 58 898 1.255 10.3 101.35 0.14 2.17 1.20 0.00771
DOY qImages
G-1 Hourly meteorological data Airport Twente 26, august 2000
0
1
2
3
4
5
6
7
1 4 7 10 13 16 19 22 25 28 31 34 37 40 43 46 49 52 55 58 61 64 67 70
Time (hours)
Win
dspe
ed (m
s-1)
Windspeed (ms-1)
0
5
10
15
20
25
30
0 10 20 30 40 50 60 70
Time (hours)
Air
tem
pera
ture
(C)
Air temperature overpss time
Air temperature (C)
0
20
40
60
80
100
120
0 10 20 30 40 50 60 70 80
Time (hours)
Rel
ativ
e hu
mid
ity (%
)
Relative humidity overpass time
Relative humidity (%)
0
100
200
300
400
500
600
700
800
900
1000
0 10 20 30 40 50 60 70 80
Time (hours)
Kin
c (W
m-2
)
radiation overpass time Incoming solar radiation (Wm-2)

REMOTE SENSING ANALYSIS OF SUMMER TIME EVAPOTRANSPIRATION USING SEBS ALGORITHM
124
G-2 Hourly meteorological data Airport Twente 25, May 2001
0
1
2
3
4
5
6
7
1 3 5 7 9 11 13 15 17 19 21 23 25 27 29 31 33 35 37 39 41 43 45 47 49 51 53 55 57 59 61 63 65 67 69 71
Time (hrs)
win
dsp
eed
(ms-1
)
Windspeed (ms-1)
0
5
10
15
20
25
30
0 10 20 30 40 50 60 70 80
Time (hours)
Tem
pera
ture
(C
)
Temperature overpass time Air temperature (C)
0
20
40
60
80
100
120
0 10 20 30 40 50 60 70 80
Time (hours)
Rel
ativ
e hu
mid
ity (%
)
relative humidity overpass time Relative humidity (%)
0
200
400
600
800
1000
1200
1400
0 10 20 30 40 50 60 70 80
time (hours)K
inc
(Wm
-2)
radiation over pass time Incoming solar radiation (Wm-2)
G-3 Hourly meteorological data Airport Twente 16, August 2002
0
1
2
3
4
5
6
7
1 4 7 10 13 16 19 22 25 28 31 34 37 40 43 46 49 52 55 58 61 64 67 70
Time (hours)
Win
dspe
ed (m
s-1)
Windspeed (ms-1)
0
5
10
15
20
25
30
0 10 20 30 40 50 60 70 80
Time (hours)
Air
tem
pera
ture
(C)
Temperature over pass time
Air temperature (C)
0
20
40
60
80
100
120
0 10 20 30 40 50 60 70 80
Time (hours)
Rel
ativ
e hu
mid
ity (
%)
Relative humidity overpass time
Relative humidity (%)
0
200
400
600
800
1000
1200
0 10 20 30 40 50 60 70 80
Time (hours)
Kin
c (w
m-2
)
radiation overpass time
Incoming solar radiation (Wm-2)

REMOTE SENSING ANALYSIS OF SUMMER TIME EVAPOTRANSPIRATION USING SEBS ALGORITHM
125
G-4 Hourly meteorological data Airport Twente 31, May 2003
0
1
2
3
4
5
6
7
1 7 13 19 25 31 37 43 49 55 61 67
Time (hours)
win
dspe
ed (m
s-1)
Windspeed (ms-1)
0
5
10
15
20
25
30
0 10 20 30 40 50 60 70 80
Time (hours)
Air
tem
pera
ture
(C)
air temperature overpass time
Air temperature (C)
0
20
40
60
80
100
0 10 20 30 40 50 60 70 80
Time (hours)
rela
tive
hu
mid
ity
(%)
Relative humidity overpass time
Relative humidity (%)
0
200
400
600
800
1000
1200
0 10 20 30 40 50 60 70 80
Time (hrs)
Kin
c (W
m-2)
radiation overpass time
Incoming solar radiation (Wm-2)

REMOTE SENSING ANALYSIS OF SUMMER TIME EVAPOTRANSPIRATION USING SEBS ALGORITHM
126
Appendix H: Iteration steps for the determination of Sensible Heat flux
The actual Sensible heat flux (H)
u* nec Re* Ct* term1 term2 term3 kB-1 zoh rah H L y_1 x_1 Y_2 X_2 ΨΨΨΨm_1 �m_2_2_2_2 ΨΨΨΨh_1 �h_20.266 2.949 154.150 0.102 1.681 0.063 0.326 2.069 0.047 5.147 133.391 -12.939 0.630 1.241 0.029 0.445 0.809 0.076 1.374 0.2120.350 2.949 202.336 0.089 1.681 0.072 0.355 2.108 0.046 3.985 226.117 -17.262 0.473 1.127 0.022 0.404 0.690 0.058 1.196 0.1720.335 2.949 193.954 0.091 1.681 0.070 0.351 2.102 0.046 4.162 207.542 -16.565 0.492 1.143 0.023 0.410 0.707 0.061 1.220 0.1770.337 2.949 195.094 0.091 1.681 0.070 0.351 2.102 0.046 4.137 210.054 -16.658 0.490 1.141 0.023 0.409 0.704 0.060 1.217 0.1770.337 2.949 194.939 0.091 1.681 0.070 0.351 2.102 0.046 4.140 209.710 -16.645 0.490 1.141 0.023 0.409 0.705 0.060 1.217 0.1770.337 2.949 194.960 0.091 1.681 0.070 0.351 2.102 0.046 4.140 209.756 -16.647 0.490 1.141 0.023 0.409 0.705 0.060 1.217 0.1770.337 2.949 194.957 0.091 1.681 0.070 0.351 2.102 0.046 4.140 209.750 -16.647 0.490 1.141 0.023 0.409 0.705 0.060 1.217 0.1770.337 2.949 194.958 0.091 1.681 0.070 0.351 2.102 0.046 4.140 209.751 -16.647 0.490 1.141 0.023 0.409 0.705 0.060 1.217 0.1770.337 2.949 194.958 0.091 1.681 0.070 0.351 2.102 0.046 4.140 209.751 -16.647 0.490 1.141 0.023 0.409 0.705 0.060 1.217 0.1770.337 2.949 194.958 0.091 1.681 0.070 0.351 2.102 0.046 4.140 209.751 -16.647 0.490 1.141 0.023 0.409 0.705 0.060 1.217 0.1770.337 2.949 194.958 0.091 1.681 0.070 0.351 2.102 0.046 4.140 209.751 -16.647 0.490 1.141 0.023 0.409 0.705 0.060 1.217 0.1770.337 2.949 194.958 0.091 1.681 0.070 0.351 2.102 0.046 4.140 209.751 -16.647 0.490 1.141 0.023 0.409 0.705 0.060 1.217 0.1770.337 2.949 194.958 0.091 1.681 0.070 0.351 2.102 0.046 4.140 209.751 -16.647 0.490 1.141 0.023 0.409 0.705 0.060 1.217 0.177
The wet limit Sensible heat flux (Hwet)
u* nec Re* Ct* term1 term2 term3 KB-1 Zoh rew Hwet Lwet yw1 yw2 xw1 xw2 phw1 phw20.266 2.949 154.150 0.102 1.681 0.063 0.326 2.069 0.047 47.120 15.500 -37.142 0.220 0.010 0.873 0.313 0.794 0.0980.350 2.949 202.336 0.089 1.681 0.072 0.355 2.108 0.046 40.743 -5.464 -83.996 0.097 0.004 0.665 0.238 0.483 0.0530.335 2.949 193.954 0.091 1.681 0.070 0.351 2.102 0.046 33.166 -40.855 -73.983 0.110 0.005 0.694 0.249 0.524 0.0580.337 2.949 195.094 0.091 1.681 0.070 0.351 2.102 0.046 34.296 -34.585 -75.296 0.108 0.005 0.690 0.247 0.518 0.0570.337 2.949 194.939 0.091 1.681 0.070 0.351 2.102 0.046 34.138 -35.435 -75.117 0.109 0.005 0.690 0.247 0.519 0.0570.337 2.949 194.960 0.091 1.681 0.070 0.351 2.102 0.046 34.160 -35.320 -75.141 0.109 0.005 0.690 0.247 0.519 0.0570.337 2.949 194.957 0.091 1.681 0.070 0.351 2.102 0.046 34.157 -35.335 -75.138 0.109 0.005 0.690 0.247 0.519 0.0570.337 2.949 194.958 0.091 1.681 0.070 0.351 2.102 0.046 34.157 -35.333 -75.138 0.109 0.005 0.690 0.247 0.519 0.0570.337 2.949 194.958 0.091 1.681 0.070 0.351 2.102 0.046 34.157 -35.333 -75.138 0.109 0.005 0.690 0.247 0.519 0.0570.337 2.949 194.958 0.091 1.681 0.070 0.351 2.102 0.046 34.157 -35.333 -75.138 0.109 0.005 0.690 0.247 0.519 0.0570.337 2.949 194.958 0.091 1.681 0.070 0.351 2.102 0.046 34.157 -35.333 -75.138 0.109 0.005 0.690 0.247 0.519 0.0570.337 2.949 194.958 0.091 1.681 0.070 0.351 2.102 0.046 34.157 -35.333 -75.138 0.109 0.005 0.690 0.247 0.519 0.0570.337 2.949 194.958 0.091 1.681 0.070 0.351 2.102 0.046 34.157 -35.333 -75.138 0.109 0.005 0.690 0.247 0.519 0.057
Data used for iteration Image: 16, August 2002 Coordinate: (238760.15, 494827.54)

REMOTE SENSING ANALYSIS OF SUMMER TIME EVAPOTRANSPIRATION USING SEBS ALGORITHM
127
Nomenclature Term1: kB-1 for the full canopy-only model of Choudhury and Monteith (1988). Term2: kB-1 for the interaction between vegetation and bare soil surface. Term3: kB-1 for bare soil surface Brutsaert (1982).

REMOTE SENSING ANALYSIS OF SUMMER TIME EVAPOTRANSPIRATION USING SEBS ALGORITHM
128
Appendix I: Conventional methods of Reference ET estimation used
1) FAO Penman-Monteith Equation
)34.01(
)(15.273
900)(408.0
2
2
0 u
eeuT
GRET
ason
++∆
−+
+−∆=
γ
γ
Where, ETO =Reference evapotranspiration (mm day-1) Rn=Net radiation (MJm-2day-1) Go=Soil heat flux density (MJ m-2day-1) T= air temperature (C) u2= Wind speed at 2m height (m s-1) es= Saturation vapour pressure (kPa) ea= Actual vapour pressure (kPa) es-ea vapour pressure deficit (kPa) �=Slope of vapour pressure curve (kPaC-1) γ=Psychrometric constant (kPaC-1)
2) Modified Makkink equation
↓+∆
∆= KETv
o )(65.0
γλ
K↓=Incoming solar radiation (MJm-2day-1) λv=Latent heat of vaporization (MJKg-1)
�= Slope of vapour pressure curve (kPaC-1)

REMOTE SENSING ANALYSIS OF SUMMER TIME EVAPOTRANSPIRATION USING SEBS ALGORITHM
129
List of Acronyms
ASTER Advanced Space borne Thermal Emission and Reflection Radiometer BCRS Dutch Remote Sensing Board BAS Bulk Atmospheric Similarity CDM Cumulative departure from the mean CWSI Crop Water Stress Index DN Digital Number DOE ARM U.S. Department of Energy Atmospheric Radiation Measurement Program Dutch RD Dutch topographic map projection, Rijksdriehoeksmeting ETM+ Enhanced Thematic Mapper FAO Food and Agriculture Organization of the United Nations GCP Ground Control Points IR Infra-Red LAI Leaf Area Index LANDSAT LAND remote sensing SATellite LIDAR Laser Imaging Detection and Ranging MODIS Moderate Resolution Imaging Spectroradiometer MOS Monin-Obukhov Similarity NAP New Amsterdam Peil (level) NDVI Normalized Difference Vegetation Index NIR Near-Infrared NOAA National Oceanic and Atmospheric Administration PAN Panchromatic PBL Planetary Boundary Layer RTM Radiative Transfer Model SEBAL Surface Energy Balance Algorithm for Land S-SEBI Simplified Surface Energy Balance Index SEBS Surface Energy Balance System SPI Standard Precipitation Index SVAT Soil Vegetation Atmosphere Transfer TCI Temperature Condition Index TIR Thermal-Infrared TOA Top of Atmosphere TSEB Two Source Energy Balance USGS United states Geological Survey UTM Universal Transverse Mercator VIS Visible

REMOTE SENSING ANALYSIS OF SUMMER TIME EVAPOTRANSPIRATION USING SEBS ALGORITHM
130
List of Symbols
Symbol Interpretation Unit AET, ETa Actual evapotranspiration mmday-1
Cp Specific heat capacity of the air Jkg-1K-1
d Zero-plane displacement m ETo Reference evapotranspiration mmday-1
fc Fractional vegetation cover - Go Soil heat flux Wm-2
g Acceleration due to gravity ms-2
H Sensible heat flux Wm-2
Hdry Sensible heat flux at the dry limit Wm-2
Hwet Sensible heat flux at the wet limit Wm-2 hc Canopy height m K↓ Incoming short wave radiation Wm-2 K↑ Out going short wave radiation Wm-2 k von Karman’s constant - kB-1 Excess resistance to heat transfer - Kc Crop Coefficient - L Monin-Obukhov length m L↓ Incoming longwave radiation Wm-2 L↑ Outgoing longwave radiation Wm-2
OT Satellite overpass time hr. q Specific humidity of the air - rah Aerodynamic resistance to heat transport sm-1
ro Surface reflectance (albedo) - Rn Net radiation Wm-2 u Horizontal wind speed ms-1
u* Frictional velocity ms-1
Zom Roughness length for momentum transport m Zoh Roughness length for heat transport m γ Psychrometric constant PaK-1 Λ Evaporative fraction - σ Stefan Boltzman’s constant Wm-2K-4
ψm Stability correction for momentum transport - ψh Stability correction for heat transport - εo Land surface emissivity - ρ Density of air kgm-3
θo Potential temperature of the surface K θa Potential temperature of the air K θv Virtual potential temperature K � Transmissivity -