Embed Size (px)
Citation preview

AN ABSTRACT OF THE THESIS OF
Robyn 0 Faber for the degree of Master of Science in Materials Science andEngineering presented on November 20 1998 Title Dwell Time Low Cycle Fatigue inTi-6242Si
Abstract approved
Michael E Kassner
Dwell time low cycle fatigue (DLCF) low cycle fatigue (LCF) and creep tests were
performed at ambient temperature on Ti-6A1-25n-4Zr-2Mo-01Si (Ti-6242Si) Test
specimens were solution annealed at various temperatures below the beta transus to
control the volume fraction of primary alpha The influence of the changes in primary
alpha phase on low cycle dwell time fatigue life were determined and compared to the
conventional low cycle fatigue properties of the alloy A dwell period significantly
decreased the number of cycles to failure but by a decreasing factor with decreasing
stress The increased primary alpha phase present associated with lower solution anneal
temperatures significantly increased susceptibility to low cycle dwell time fatigue It is
believed that dwell fatigue sensitivity may be associated with cyclic ambient temperature
time-dependent plasticity (creep)
Redacted for Privacy
Dwell Time Low Cycle Fatigue in Ti-6242Si
by
Robyn 0 Faber
A THESIS submitted to
Oregon State University
in partial fulfillment of the requirements for the
degree of Master of Science
Completed November 20 1998 Commencement June 1999
Master of Science thesis of Robyn 0 Faber presented on November 20 1998
APPROVED
Major Professor representing Materials Science
Coordinator of Materials Science Program
Dean of Gradua chool
I understand that my thesis will become part of the permanent collection of OregonState University libraries My signature below authorizes release of my thesis to anyreader upon request
Robyn 0 Faber Author
Redacted for Privacy
Redacted for Privacy
Redacted for Privacy
Redacted for Privacy
ACKNOWLEDGEMENT
I would like to acknowledge and thank OREMET WAH CHANG and the Oregon
Joint Schools of Engineering for their financial assistance and overall support I would
also like to acknowledge the assistance of Yoji Kasaka and Bryan Bristow at OREMET
WAH CHANG and the insight of Dr M E Kassner at Oregon State University
Finally I would like to acknowledge the assistance of Dr Karol Schrems at the Albany
Research Center with the metallography and Dr Xiao Li with the creep testing
TABLE OF CONTENTS
P
INTRODUCTION 1
REVIEW OF LI 1 ERATURE 6
EXPERIMENTAL PROCEDURE 10
RESULTS 19
DISCUSSION 34
CONCLUSIONS 37
REFERENCES 38
APPENDIX 41
LIST OF FIGURES
Figure Page
1 Alpha (primary a and transformed (3) + Beta Microstructure consisting of approximately 97 a and 3 13 3
2 Widmanstatten Microstructure 4
3 Flow Chart for TMP Ingot to Billet Conversion 11
4 The Instron 8521 with Sample Loaded for a DLCF Test 16
5 DLCF and LCF Testing Profiles 17
6 Ti-6242Si Dwell amp Low Cycle Fatigue Data 20
7 DLCF and LCF Results for IMI 685 as Reported by WJ Evans [13] 21
8 RT950209 Set B Sample T2TOP1 TD -53deg C Axial Section 22
9 RT950209 Set B Sample T2TOP4 To -41deg C Transverse Section 23
10 RT950522 Set A Sample 2 To -28deg C Transverse Section 24
11 RT950483 Set A Sample 1 To -28deg C Transverse Section 25
12 RT950209 Set B Sample T2TOP6R To -14deg C Transverse Section 26
13 RT950209 Set B Sample T2TOP22 To 3deg C Transverse Section 27
14 RT950209 Set B Sample T2TOP180H Unknown Solution Anneal Temperature Estimated To 8deg C Transverse Section 28
15 Ti-6242Si Creep Data (Ambient temperature Constant Engineering Stress Tests) 30
16 DCF LCF Creep Testing Sample Dimensions Specifications 42
17 DCF Sampling Preparation and Testing Outline 43
LIST OF FIGURES (continued)
Figure
18 Plot of Set A and Metcut Research Inc Dwell Cycle Fatigue Data
19 Ti-6242Si Heat RT950209 Solution Anneal Temperatures vs UTS
P
44
45
LIST OF TABLES
Table Fagg
1 Ingot Compositions (wt ) 12
2 Heat Treatment Table for OREMET-WAH CHANG Ti-6242Si Test Specimens 14
3 Summary of Average Primary Alpha and Hardness for Each Solution Anneal Temperature 29
4 Ambient Temperature Creep Data for Ti-6242Si 31
5 Tensile Properties of Ti-6242Si as a Function of Solution Anneal Temperature 33
6 Set A Specimen List and Data 46
7 Set B Specimen List and Data 47
Dwell Time Low Cycle Fatigue in Ti-6242Si
INTRODUCTION
Dwell sensitivity refers to the reduction in fatigue life as a result of adding a holding
time or dwell period at peak load to a low cycle fatigue (LCF) test This dwell time low
cycle fatigue (DLCF) test better simulates actual service conditions of aircraft turbine
engine components typically made from titanium alloys Ti-6A1-2Sn-4Zr-2Mo-01Si
(Ti-6242Si) a near alpha alpha-beta alloy is one such alloy used in aerospace and
aeronautical high temperature applications One specific use for Ti-6242Si is for aircraft
turbine engine compressor disks
Ti-6242Si consists of primarily a hexagonal close packed (hcp) crystallographically
structured alpha phase plus three percent or less body centered cubic (bcc) beta phase at
room temperature The transformation temperature above which the one hundred
percent beta phase is thermodynamically stable is referred to as the beta transus (T(3)
The added aluminum acts as an alpha phase stabilizer the molybdenum as a beta phase
stabilizer and the zirconium and tin as solid solution strengthening agents as well as
transformation rate retardants The added silicon maximizes creep resistance through
dispersion strengthening and the resulting stabilization of the surface engineering
properties during elevated temperatures under stress [1 2]
2
An alpha-beta (a [3) alloy is one where a mixture of alpha and beta phases exists at
equilibrium usually room temperature [2] The near-a designation refers to an a+fi
composition containing less than three percent beta [3] and therefore is near the
aa+13 phase boundary [2] Two forms of alpha phase are typically present primary
alpha and transformed beta The primary alpha is that which remains in the alpha phase
throughout heat treatment Transformed beta is alpha phase which changes to beta
during heat treatment above the beta transus then returns to alpha upon cooling [3]
This alpha may emerge as acicular or lamellar serrated platelike or Widmanstatten in
appearance [3] Widmanstatten microstructure is described as coarse colonies of aligned
alpha platelets [2] Heat treatments are a means of adjusting the microstructure to
control the properties of alpha-beta alloys [2]
The microstructures most common for Ti-6242Si are a (primary a and transformed
13) + 13 and acicular a (Widmanstatten or basketweave) plus 13 The former is a
microstructure of equiaxed alpha phase (primary a) in a transformed beta matrix (Figl)
and is produced through heat treatment below the beta transus and slow cooling This
microstructure is referred to as a + 13 has good high temperature fatigue properties and
is a stable microstructure [4] Furnace cooling produces this coarse aligned alpha
structure which some have suggested is particularly sensitive to dwell cycle fatigue [5 6]
Heat treatment above the beta transus results in a Widmanstatten aligned acicular alpha
microstructure upon cooling (Fig 2) and is known to have good high temperature creep
properties [4] As the cooling rate from above the beta transus is increased the
transformed beta becomes finer and a basketweave microstructure is produced [7]
3
Figure 1 Alpha (primary a and transformed f3)+ Beta Microstructure
consisting of approximately 97 a and 3 13
(The above micrograph is of a Ti-6242Si specimen tested during this study)
4
2011m
Figure 2 Widmanstatten Microstructure
(The above micrograph is of a Ti-6242Si specimen tested during this study)
5
Basketweave microstructure is reported to be the least susceptible to dwell cycle fatigue
by simple virtue of a more tortuous crack propagation path but processing to attain it
is unreasonable in an industrial situation [6] The cooling rate from above the beta
transus therefore significantly affects the alloys mechanical properties by altering the
microstructure [1]
The objective of the present work was to confirm the existence of a dwell debit in
near-alpha Ti-6242Si produced by alphabeta processing and investigate the
effectiveness of solution anneal temperature changes in reducing this debit Solution
annealing allows for accurate and consistent temperature control in an industrial situation
as it is accomplished after thermomechanical processing the titanium in its largest form
Studying factors affecting dwell cycle fatigue life may also aid in the determination of the
fundamental mechanism of dwell fatigue
6
REVIEW OF LITERATURE
Dwell sensitivity can result in over an order of magnitude fewer cycles to failure and
was first reported by J Waisman et al in 1973 [8] Work has been continued by Evans
and coworkers Eylon and Hall [9] and Woodfield et al [5] Most studies have focused
on the titanium alloy IMI 685 or Ti-6-4 but the most recent works cite results of tests
using a number of titanium alloys including Ti-6242Si or exclusively Ti-6242Si
The mechanism leading to dwell sensitivity is still unresolved In 1979 Evans and
Gostelow [10] suggested that ambient temperature dwell sensitivity is due to time-
dependent plastic strain accumulation and that facet formation during creep
deformation is linked to the extensive facet formation present in dwell cycle fatigue
specimens [10]
Titanium alloys have the intrinsic property to creep at ambient temperature [11]
In 1984 Chu et at found that a dwell period leads to stress relaxation which has the
same effect as prior creep [11] Chus group also reported that multiple (fifty or more)
fatigue cycles between hold times actually results in a longer life when compared to low
cycle fatigue results The given explanation that prior creep increases the resistance of
the material through the delaying of fatigue damage (hardening) is contradictory to Evans
and Gostelow but Chu et al also reported that only one cycle between hold times did
HP Chu BA MacDonald and OP Arora Titanium Science and Technology Vol 4 Eds G Lutjering U Zwicker and W Bunk Proceedings of the 5th International Conference on Titanium Duetsche Gesellechat fiir Metallkunde EV Munich 1984 p 2395
7
not generate interaction between fatigue and prior creep during that investigation and a
reduction in fatigue life with the added strain-hold time was observed [11]
The microstructure of Ti-6242Si can be altered by changing the solution anneal
temperature below the beta transus (TO This affects the amounts of primary alpha and
transformed beta present and may affect the dwell sensitivity in two ways First the
amount of primary alpha which increases with decreasing solution anneal temperature
could change the strength of the alloy Second this would tend to alter plasticity and
perhaps affect the susceptibility to dwell effects according to the time-dependent
plasticity (creep) explanation
In 1988 Neal published a number of findings after performing low cycle and dwell
cycle fatigue tests on various titanium alloys including Ti-6242Si He explained the
presence of a dwell effect at temperatures below approximately 200deg C by means of
planar slip on or near the hcp basal plane (0001) and by creep-fatigue interactions at
temperatures above approximately 400deg C His explanation for the lack of dwell
sensitivity between these two temperatures is dynamic strain aging
Suri and coworkers reported in 1997 that extensive low temperature primary creep
in titanium alloys is clearly associated with extreme planar slip 2
2 S Suri T Neeraj GS Daehn DH Hou JM Scott RW Hayes and MJ Mills Materials Science and Engineering A234-236 1997 pp 996-999
8
Thiehsen et al reported in 1992 that raising the solution anneal temperature
increases both the primary and steady state high temperature creep resistance of Tishy
6242Si The beneficial effect may be derived from a combination of several sources
including the removal of such micrographic features as banding or texturing and
especially the altering or refining of the a or 13 microstructure 3
Hack and Leverent reported in 1982 that beta-processed near-alpha titanium alloys
with a large colony microstructure were found to be susceptible to internal hydrogen
embrittlement under conditions of sustained loading of fatigue cycling with a dwell
period at peak load 4 A colony is described as a cluster of acicular alpha grains aligned
in the same orientation [3] Their study found that both time-dependent deformation
and internal hydrogen are required for the embrittlement to occur Hydrogen
embrittlement occurs by localized increases in hydrogen content at the tips of long
blocked shear bands developed during time dependent plastic deformation [12] Fatigue
crack nucleation is a result of cyclic loading which causes to-and-fro slip to occur [13]
When this slip results persistent slip bands then extrusions and intrusions result Cracks
are thought to nucleate at intrusions [14] Woodfield et al presented results indicating
that thermomechanical processing can break up the aligned alpha colonies creating
randomly orientated primary alpha [5] Increasing the final solution anneal temperature
closer to the beta transus followed by quenching can not only alter the volume fraction
of primary alpha but may also decrease the possibility of any aligned alpha colonies
Reduction of susceptibility to DLCF may result through simply minimizing the volume
3 KE Thiehsen ME Kassner J Pollard DR Hiatt and B Bristow Metall Trans 24A 1993 p 1819 4 JE Hack and G R Leverant Metall Trans 13A 1982 p 1729
9
of the weaker alpha phase or by reducing the alpha colonies thought to be associated
with the facets linked to internal DLCF crack initiation [5]
Evans 1987 paper reports that his results do not support the shear band model and
in contrast suggests that there is an increase in life with hydrogen content [8] He also
states that once the cracks are formed though their growth is greatly influenced by
hydrogen concentration Previous work [6 10 12] has shown that times to failure for
creep and dwell tests with a five minute holding period per cycle are indistinguishable
Evans said that the mechanisms responsible for crack initiation are the same for creep
dwell and cyclic fatigue testing and that they probably involve time-dependent strain
accumulation
Neals findings that almost identical dwell effects were present at all levels of
hydrogen tested including a degassed material (lt10 ppm H2) were also in contrast to
those reported by Hack and Leverent In addition Neal stated that because both
alphabeta and beta heat treated structures exhibited dwell effects alloying composition
appeared the controlling factor Hack and Leverent suggested Ti-6242Si was not
susceptible to dwell effects even when beta heat treated 5 and that microstructural
features associated with the hydrogen embrittlement process are the key to DLCF in IMI
685 [12] Furthermore Neal found that the higher the stress the greater the percentage
cyclic life loss with a dwell period added [15]
5 DF Neal Sixth World Conference on Titanium Vol 1 Proceedings of the Sixth World Conference on Titanium Cannes 1988 p 175
10
EXPERIMENTAL PROCEDURE
Standard thermomechanical processing (TMP) was applied to 914 mm diameter
Ti-6242Si ingots which in turn were forged to approximately 238 mm diameter round
billets Five to six billets result from a single ingot Rectangular coupons were cut from
an ingot position designated billet with the long axis of the coupons radial to the long
axis of the billet and so that the specimen gage section would be at approximately the
mid-radius position
All specimens are identified by the heat number of the OREMET-WAH CHANG
production billet from which the sample coupons were extracted as well as by the
position designation along that billet (Fig 3) The beta transus for each billet was
determined by differential thermal analysis (DTA) The ingot chemical compositions are
presented in Table 1 and were determined by inductively coupled plasma atomic
emission spectroscopy (ICP) and gas analysis The specific processing steps follow
The ingot was heated initially to 1149deg C upset (set up on end which results in the
compression of the ingot to a specified amount) by approximately fifty percent and
forged to dimensions 813 mm x 1067 mm x L
This was followed by a forging to 737 mm square also after heating to 1149deg C and a
water quench
FIGURE 3 Flow Chart for TMP Ingot to Billet Conversion
Ingot Heat RT950209 914 mm initial diameter
Designated T1 737mm square = initial size Designated Bottom 737 nun square = initial size
Designated Tl T2 T3 T4 amp Bottom 610 mm square = initial size
11 T2 13 Bottom
Designated Tl T2 T3 T4 amp Bottom 286 mm rough round = initial size
1 2I I
5 billets 238 mm round = final size
Table 1 Ingot Compositions (wt )
Al Cr Fe Mo Ni Si Sn Zr C 0 N H
RT950209 Top 608 0003 0033 200 0007 009 201 418 0005 0107 0002 00044
Tp = 1007degC (DTA) Bottom 600 0002 0033 195 0007 009 196 409 0003 0104 0001 00047
-RT950483 Top 63 0002 0031 201 0008 009 202 417 0005 0133 0001
Tp = 1007degC (metall) Bottom 593 0002 003 194 0007 008 191 404 0006 013 0001 00060
-RT950522 Top 608 0001 0032 205 0001 008 199 412 0004 0127 0002
Tp -- 1007degC (metall) Bottom 599 0001 0033 196 0001 009 193 413 0009 0123 0003 00045
13
The alloy was then forged to 610 mm square after heating to 954deg C Next it was
heated to 1066deg C which is above the beta transus and held at that temperature for
two hours before water quenching
After heating to 968deg C and forging to 286 mm rough round the billet was
conditioned (cosmetic surface grinding) heated again to 968deg C and forged by rotary
forging machine to 238 mm round Solution annealing at 954deg C for two hours
forty-two minutes and air cooling followed
Finally the billet was annealed at 704deg C for six to nine hours air cooled and peeled
(descaled) The rectangular coupons were cut from the billet after this step
Solution heat treating of the coupons (To -3deg C to To -53deg C) for one hour followed
by an eight hour age as outlined in Table 2 preceded machining and surface treating
All solution heat treating machining and surface treating was completed by Metcut
Research Inc Dickson Testing Company Inc or a combination of both companies
The final specimens have an average gage diameter of 63 mm and a gage length of
19 mm All gage sections were peened using S-110 S-170 CW-14 or CW-33 shot to
0002 0008 A 100 to 400 coverage [16] Hardness testing was performed at
Oregon State University using the Rockwell C test
All tests fatigue and creep were performed using an 8521 Instron at Oregon State
University This Instron is a digitally controlled servohydraulic biaxial testing machine
with a maximum load capability of 20000 pounds The attached control panel allows for
precise monitoring general programming and rapid response times An additional
TABLE 2 HEAT TREATMENT TABLE FOR OREMET-WAH CHANG TI - 6242Si TEST SPECIMENS
BILLET HEAT IDENTIFICATION SAMPLE IDENTIFICATION
RT950483 RT950522 A 483 1 amp 2 and
A 522 1 amp 2 RT950209
A T2TOP1 through A T2TOP14 and Manila 2
RT950209 B T2TOP1 amp 2
RT950209 B T2TOP21 22 amp 23
RT950209 B T2TOP1R through 13R
RT950209 B T2TOP7OH through 200H
SOLUTION ANNEAL
979deg C + 14deg for 1 hr cool at 17deg C min + 3deg to below 538deg C
966deg C + 14deg for 1 hr cool at 17deg C min + 3deg to below 538deg C
954deg C for 1 hr cool at 17deg C min to 593deg C
1004deg C for 1 hr cool at 17deg C min to 593deg C
993deg C for 1 hr cool at 17deg C min+ 3deg to below 538deg C
Beta Transus exceeded Most samples returned untested
AGING
593deg C + 8deg for 8 hrs air cool
593deg C + 8deg for 8 hrs
air cool
hold at 593deg C for 5 hrs air cool
hold at 593deg C for 8 hrs air cool
593deg C + 8deg for 8 hrs air cool
593deg C + 8deg for 8 hrs air cool
PROCESSING LAB
Dickson Testing Company Inc
Metcut Research Inc (T2TOP1-14 Dickson Testing Company Inc
(Manila 2)
Metcut Research Inc
Metcut Research Inc
Dickson Testing Company Inc
Metcut Research Inc
15
computer with Labview software was used for more specific programming and data
collection during the creep tests
Prior to testing each specimen was cleaned with acetone then two strain gages were
mounted 180 degrees apart in the same position along the longitudinal axis of the gage
section Strain indicators wired to the gages were used to maintain zero strain on the
sample during installation into the grips on the Instron The Instron was programmed
to maintain zero load during this process This careful installation and alignment
procedure coupled with a grip designed to minimize possible bending stresses resulted
in highly reproducible results and minimum scatter (Fig 4)
The low cycle fatigue (LCF) testing cycle consisted of a two second loading period to
peak followed immediately by a two second unloading period back to zero load The
testing cycle for the dwell cycle fatigue tests also consisted of a two second loading to
peak load but was followed by a two minute hold time at that peak load before the two
second unloading to zero (Fig 5) All testing was performed at a stress ratio
R = 6 = 0 All values of stress and strain are reported as engineering stress and
strain
During the ambient temperature creep tests the Instron was programmed to
maintain a constant load for approximately twenty-four hours with the attached
computer monitoring and collecting strain data from the mounted strain gages The
loading time to the desired stress was sixty seconds
16
Figure 4 The Instron 8521 with Sample Loaded for a DCF Test
DWELL TIME LOW CYCLE FATIGUE
2 minute hold time6 + r--- 2 second loadunload time
LOW CYCLE FATIGUE
2 second loadunload time
6 +
Figure 5 DLCF and LCF Testing Profiles
_ -1
18
After testing axial and transverse sections were taken from specimens using a
diamond blade on a low speed saw then mounted in phenolic powder ground and
polished All polishing was accomplished using SiO2 suspension solution after grinding
on 320 400 and 600 grit silicon carbide grinding paper The samples were then etched
with a ten percent HF fifteen percent HNO3 and seventy-five percent H2O etchant
(Krolls reagent) for approximately three seconds Area fractions of primary alpha were
calculated using NIH Image Analysis computer software after scanning in micrographs
taken with an Olympus PME optical microscope
19
RESULTS
Figure 6 presents the results obtained through low cycle fatigue testing as well as
dwell cycle fatigue testing in the form of a stress versus log number of cycles to failure
plot The corresponding legend identifies each set of data the solution anneal
temperature for that set and the type of test (LCF or DLCF) Again Table 2 lists the
heat treatments for each set of Ti-6242Si specimens The plot of data in Figure 6 clearly
shows the reduction in the number of cycles to failure as a result of the added two
minute dwell period This reduction is by over an order of magnitude number of cycles
at the most elevated stresses decreasing to a factor of five at the lowest tested stresses
It is probable that the dwell cycle fatigue curves merge with the low cycle fatigue data line
at lower stresses than were tested during this investigation These results are generally
consistent with those published by Evans (Fig 7) [8] Micrographs illustrating the
typical microstructure (and volume percent primary alpha) developed by each solution
anneal temperature are pictured in Figures 8 through 14 It is clear that the dwell cycle
fatigue cycles to failure increase with increasing solution anneal temperature or
decreasing volume percent primary alpha Table 3 gives a summary of the average
primary alpha phase present and average hardness data for the associated solution anneal
temperatures
Figure 15 contains a plot of ambient temperature creep tests in the form of creep
strain versus time in seconds for a given engineering stress and expectedly displays
higher creep strains per unit of time with higher solution anneal temperatures Table 4
contains this creep strain data for each solution anneal temperature and tested stress
Figure 6 TI-6242Si Dwell amp Low Cycle Fatigue Data
1000
DCF LCF
950
900
73shy
2 co 850(i)
re
= 1007 degC
RT950209 Set A (T -41degC) DCF
RT950209Manila Set A (T3 -41deg) DCF
RT950209 Set A (T -41degc) LCF
To-41degC
Tp-14degC
800
RT950209 Set B (Tp -3degC) DCF
RT950209R Set B (T -14degC) DCF
750
O
X
RT950209R Set B (T -14degC) LCF
RT9502090H Set B (TD --Pc) LCF r X
test interrupted due to power failure
700
0 2 3
LOG CYCLES TO FAILURE
4 5 6
Figure 7 DLCF and LCF Results for IMI 685 as Reported by WJ Evans [13]
3 4
LOG CYCLES TO FAILURE N
2
I I
2011m
Figure 8 RT950209 Set B Sample T2TOP1 To -53deg C Axial Section
11
L__J L__J 2020
Figure 9 RT950209 Set A Sample T2TOP4 T13 -41deg C Transverse Section
20 pm 20microm
Figure 10 RT950522 Set A Sample 2 Tp -28deg C Transverse Section
L__1 20 1im
Figure 11 RT950483 Set A Sample 1 To -28deg C Transverse Section
1
20pm
Figure 12 RT950209 Set B Sample T2TOP6R To -14deg C Transverse Section
i
20pm
Figure 13 RT950209 Set B Sample T2TOP22 To 3deg C Transverse Section
20 pm L__I 20 pin
Figure 14 RT950209 Set B Sample T2TOP180H Unknown Solution Anneal Temperature Estimated Tp 8deg C Transverse Section
TABLE 3 SUMMARY OF AVERAGE PRIMARY ALPHA AND HARDNESS FOR EACH SOLUTION ANNEAL TEMPERATURE
Beta Transus = 1007deg C
SOLUTION ANNEAL AVERAGE PRIMARY AVERAGE ROCKWELL TEMPERATURE (degC) ALPHA PERCENTAGE HARDNESS (HRC)
954 650 no tests 966 630 276 979 544 302 993 442 no tests
Estimated 999 216 333 1004 54 315
Figure 15 Ti-6242S Creep Data (Ambient Temperature Constant Stress Tests at 917 and 862 MPa)
005
004 shy
c
ti)
2)U
003
002 constant stress 917 MPa
0
Solution Anneal Temperature 993 C
Solution Anneal Temperature 954 degC
000 0 20000
constant stress 862 MPa
40000 60000
Time (seconds)
80000 100000
TABLE 4 AMBIENT TEMPERATURE CREEP DATA FOR TI-6242Sil
Beta Transus = 1007deg C
MPa Solution Anneal cP at Final Load EP E P at E (S-1) at
Temperature ( 63 seconds ) ( 120 seconds ) ( 80 x 104 seconds ) ( 80 x 104 seconds )r
917 Tp -14deg C 00082 0010 0037 73 X 10-8
917 Tp -53deg C 00064 0008 0033 99 X10-8
862 Tp -14deg C 00011 0003 0012 26 x 10-8
862 Tp -53deg C 00005 0002 0010 26 x 1043
930 Tp -14deg C 00105 0013 0054 12 x 10-7
930 Tp -25deg C 00047 0006 0025 64 x 10-8
1 Two tests at 930 MPa failed during creep testing prior to 80 x 10 4 seconds
(A)
32
Tensile data as a function of solution anneal temperature for Ti-6242Si without
surface shot peening is presented in Table 5 As the solution anneal temperature is
increased above Tp -25deg C both the 02 offset yield strength and the ultimate tensile
strength decrease with further increases in temperature
1
TABLE 5 TENSILE PROPERTIES OF TI- 6242Si AS A FUNCTION OF SOLUTION ANNEAL TEMPERATURE ( Surfaces Not Shot Peened )
Beta Transus = 1007deg C
02 Average BILLET HEAT IDENTIFICATION Solution Anneal Yield Strength UTS El Hardness
SAMPLE IDENTIFICATION Temperature ( MPa ) ( MPa ) ( ) ( HRC ) RT950483 RT950522 A 483 1 amp 2 and To -28deg C 8894 9908 150 (2)1 295 (10)2
A 522 1 amp 2 9074 9935 150 (2) RT950209
A T2TOP1 through A T2TOP14 T -41deg C P
8798 9798 145 (2) 274 (45) and Manila 2
RT950209
B T2TOP1 amp 2 To -53deg C 8825 9722 160
RT950209 B T2TOP21 22 amp 23 To -3deg C 7895 9349 110 315 (10)
RT950209 B T2TOP1R through 13R T -14deg C
13 8260 9556 120
RT950209 Beta Transus possibly B T2TOP7OH through 200H exceeded Most samples
returned untested
Data provided by OREMET - WAH CHANG Number of tests
2 Number of tests per sample x number of samples tested
34
DISCUSSION
Chu et al Bania and Hall and Halls findings may correlate well with the greater
dwell cycle fatigue resistance of Ti-6242Si specimens annealed at higher solution anneal
temperatures and tested during this investigation [11 17 18] As mentioned previously
Chu and coworkers found that prior ambient temperature creep works to improve low
cycle fatigue life by a factor of two or more in Ti-62108 (also an alpha-beta alloy) as a
result of stable dislocation networks produced which delay the onset of fatigue damage
This team also reported that a dwell period at peak load in lieu of prior creep elicited the
same outcome with fifty or more cycles between hold periods but that only one cycle
between hold times resulted in a reduction in fatigue life As reported by Bania and Hall
and Hall alone the range of primary alpha content in Ti-6242Si will result in a minimum
creep rate change of a factor of at least two6 and the high temperature (510deg C) creep
rate is generally reduced as the volume fraction of equiaxed primary alpha is reduced
(increased solution anneal temperature) [17 18] Therefore the reduced dwell sensitivity
at lower volume percentages of primary a may be a function of a reduced creep rate and
not a result of easier crack propagation through the primary a phase
Since microstructure (varying volume percentages of primary a) was found to have
no significant effect on LCF life (Figure 6) this may be indicative of cyclic work
hardening of each microstructure to approximately the same load level during load
controlled tests
35
Referring to Table 4 and Figures 6 and 15 significant time-dependent plasticity occurs
at the higher stresses which are also associated with the greatest dwell sensitivity This
extra plasticity according to Chu et al and Hall delays the onset of fatigue cracking
[11 18] Again referring to Chu and coworkers findings it appears that small amounts
of initial monotonic deformation do not degrade the LCF properties Thus the effect
of the dwell may be that of repeated (cyclic) plasticity due to creep during the dwell
periods7
Subsequent research using the DLCF and LCF specimens tested during the present
investigation has shown that the DLCF specimens accumulated more plastic strain to
failure than the LCF specimens due to creep plasticity [19] Therefore the dwell may
simply increase the strain amplitude of a LCF test at a given stress resulting in a
decreased number of cycles to failure It was also shown that prior monotonic creep
strain comparable to that accumulated in DLCF specimens did not significantly degrade
LCF life [19] These results concur with those reported by Chu et al [11]
One possibly important point to note is that based on the tensile and hardness data
in Table 5 the tensile strength of Ti-6242Si is approximately independent of the solution
anneal temperature (or primary alpha content) up to approximately To-28deg C Above
6 PJ Bania and JA Hall Titanium Science and Technology Vol 4 Proceedings of the 5th International Conference on Titanium Munich 1984 p 2371
7 ME Kassner R Faber X Li Y Ge Y Kosaka SH Reichman and JA Hall TMS Conference 1998 to be published D Eylon RR Boyer and G Liitjering edsWarrendale 1999
36
this temperature the yield strength (YS) and ultimate tensile strength (UTS) decrease
with increasing solution anneal temperature The increased creep strain with increasing
solution anneal temperature experienced during the ambient temperature creep tests is
not then surprising This trend was also observed by Sun et al [20] High temperature
creep tests on this alloy reveal the opposite trend [21]
It appears that in the alpha-beta titanium alloys studied most of the fatigue life is
spent nucleating detectable cracks [18] as with most metals Thus bulk plasticity trends
associated with changes in dwell cycle fatigue and low cycle fatigue may be directly
related to crack nucleation Earlier work by Kansal et al suggests that with increased
primary alpha textured or aligned primary alpha becomes more obvious [22] Chu and
co-researchers studies showed that both creep and fatigue crack propagation did not
coincide with the a-13 interfaces but propagated transgranularly (through the grains)
across the a-13 colonies
Metallographic examination of a Ti-6242Si sample loaded to 876 MPa during DLCF
testing revealed that dwell cycle fatigue cracks exist in many locations away from the
principal crack and may not be associated with secondary cracks These cracks appear
to nucleate in the primary alpha phase and appear to propagate across (transgranularly)
the primary alpha grains [19] It does not appear that the cracking is associated with the
banding often associated with Ti-6242Si with higher volume percent primary alpha
[22 23 24] This banding could be associated with texture
37
CONCLUSIONS
Ambient temperature dwell and low cycle fatigue tests were performed on Ti-6ALshy
2Sn-4Zr-2Mo-01Si (Ti-6242Si) Specimens were solution annealed at various
temperatures below the beta transus to vary the volume fraction of primary alpha The
influence of the changes in primary alpha phase on dwell time low cycle fatigue (DLCF)
life were determined and compared to the conventional low cycle fatigue (LCF)
properties of the alloy It was concluded that
1 A dwell significantly decreased the number of cycles to failure
2 Increasing primary alpha associated with lower solution anneal temperatures
significantly increased susceptibility to dwell fatigue although this affect diminished
with decreasing stress
3 The above trends may be explained by ambient temperature cyclic creep of Tishy
6242Si
4 Increased susceptibility of higher primary alpha to dwell fatigue may be due to an
increased susceptibility of primary alpha to cracking during creep deformation
38
REFERENCES
1 C Andres L Wagner and G Liitjering Microstructure Pmper0 Relationships in Titanium Aluminaides and Alloys YW Kim and RR Boyer eds TMS Warrendale 1991 pp 579-586
2 EW Collings Physical Metallurgy of Titanium Alloys ASM Metals Park OH 1984
3 RR Boyer Titanium and Titanium Alloy Metals Handbook 9th Edition Vol7 ASM Metals Park OH 1982 pp 458-475
4 SL Semiatin JF Thomas Jr and PDadras MetalL Trans 14A 1983 pp 2363shy2374
5 AP Woodfield MD Gorman RR Corderman JA Sutliff and B Yamrom Titanium 95 Science and Technology CA Bienkinsop WJ Evans and HM Flower eds Institute of Materials Cambridge Univ Press 1996 pp 1116-1123
6 WJ Evans Second International Conference on Creep and Fracture of Engineering Materials and Structures Proceedings of the Second International Conference on Creep and Fracture of Engineering Materials and Structures Swansea 1984 p 395
7 DR Askeland The Science and Engineering of Materials 3rd Edition PWS Publishing Company Boston 1994
8 WJ Evans J Mater Sci Lett 6 1987 pp 571-574
9 D Eylon and JA Hall MetalL Trans 8A 1977 pp 981-990
10 WJ Evans and CR Gostelow MetalL Trans 10A 1979 pp 1837-1846
11 HP Chu BA MacDonald and OP Arora Titanium Science and Technology Vol 4 G Lutjering U Zwicker and W Bunk eds Proceedings of the 54 International Conference on Titanium Duetsche Gesellechat fur Metallkunde EV 1984 pp 2395-2402
12 JE Hack and GR Leverant MetalL Trans 13A 1982 pp 1729-1738
13 JA Bannantine JJ Corner JL Handrock Fundamentals of Metal Fatigue Analysis Prentice-Hall Englewood Cliffs NJ 1990
14 S Suresh Fatigue of Materials EA Davis IM Ward eds Cambridge University Press Cambridge 1992
15 DF Neal Sixth World Conference on Titanium Val Proceedings of the Sixth World Conference on Titanium Cannes 1988 pp 175-180
39
16 ASM Committee on Shot Peening Metals Handbook 9th Edition ASM Vol 5 1982 pp 138-149
17 PJ Bania and JA Hall Titanium Science and Technology Vol 4 Proceedings of the 5th International Conference on Titanium Munich 1984 pp 2371-2378
18 JA Hall Int J Fatigue Vol 19 Supp No 1 1997 pp S23-S37
19 ME Kassner R Faber X Li Y Ge Y Kosaka SH Reichman and JA Hall TMS Conference 1998 to be published D Eylon RR Boyer and G Liitjering eds TMS Warrendale 1999
20 S Suri T Neeraj GS Daehn DH Hou JM Scott RW Hayes and MJ Mills Materials Science and Eng A234-236 1997 pp 996-999
21 KE Thiehsen ME Kassner J Pollard DR Hiatt and BM Bristow Metall Trans 24A 1993 pp 1819-1826
22 U Kansal ME Kassner DR Hiatt and BM Bristow J Mater Eng and Pe 1 1992 pp 393-398
23 SL Semiatin and GD Lahoti Metall Trans 14A 1983 pp 105-115
24 SL Semiatin and GD Lahoti Metall Trans 14A 1983 pp 743-750
25 C Quesne C Duong F Charpentier JF Fries and P Lacombe Journal of the Less-Common Metals Vol 68 1979 pp 133-142
26 A Tahmassebi Khadem Assadi HM Flower DRF West MetTechnol Jan 1979 pp 16-23
27 WJ Evans and GF Harrison Journal of Materials Science 18 1983 pp 3449-3455
28 W Cho JW Jones JE Allison and WT Donlon Sixth World Conference on Titanium VoZ1 Proceedings of the Sixth World Conference on Titanium Cannes 1988 pp 187-192
29 T Bui-Quoc R Gomuc A Biron HL Nguyen RN Tadros Journal of Testing and Evaluation JTEVA Vol 18No 3 May 1990 pp 160- 171
30 WJ Evans and MR Bache Titanium 92 Science and Technology FH Froesand I Caplan eds TMS 1993 pp 1693-1699
31 WJ Evans and MR Bache Fatigue 16 1994 pp 443-453
32 D Eylon and CM Pierce Metall Trans 7A 1976 pp 111-121
40
33 NE Paton and MW Mahoney MetalL Trans 7A 1976 pp 1685-1689
41
APPENDIX
Figure 16 DCF LCF Creep Testing Sample Dimensions Specifications
Iii V000 PLAC2
reg 117100 1
310 1002 2 PLACeS2 PLACES
o4o401 Q IMAGES
lie 3 Cin DRILL 20 144tmt ofpit4 2 PLACES
11111311a211=1 lul 1111111)113000 Iof i 2110111011
25001005 WAS sky t aosGA 31 00 511
4 ease-750 es 01 s) El 001 2 PLACE
-20 31
masa ernowel -C0
114 shares 1 v mpe
Nur 111101114 WELDILC1 301t 11496 401S1111111 All Al map5 aIP-F C3-1114G OmiCi AolMent -601 Al fC10
pADIu 1r e41C 3LCTIDN TO bLEN0WonT1L WITHOUT UN DCA C1J1
3 IWin] or41112wISE ZrZellhen liemovt ALLeuaqs 4 ZmARP toast WITH 055 kaospAosus OR cHDPsrail 2-TAG Gt 4013113- 202 I- mum comvornA 1ta 401511S-VIO CLshy
15o I-Jaatori 2 PLACtS NOTE
gaming Oa4614S-NO
11117014 ltdi Cato 50
TA DLTA I L 41111104e
1111111111114011111VISICgems ft 111 01010011 watat wage 4110
sraclutN b4 cymmoot ICAO 4AM50Cliel ep 47 Cr ELAo GUI r
nv toorit to lic8 07482 (7113115 -702P 111429e11 114111 par pup
inrit 4s SO 1 ia
1
43
Figure 17 DCF Sampling Preparation and Testing Outline
Dwell Fatigue Testing of Billet
Sampling Specimens for fatigue tests shall be taken at top middle and bottom locations at least two diameter lengths from billet ends Two specimens are required at each location Specimen orientation shallbe radial with the gage centered approximately at the midradiusposition
Sample material provided for the alternate crystallographic structureanalysis shall be a single heat treated transverse slice from each of the billet locations listed above
Specimen Preparation Sara ogre-14 )Sample material shall be solution treated at 50degF below the _bear C c cfF
transus temperature plusmn 25degF for 1 hour Cool at 30 plusmn 5degFmin to below 1000degF Age 8 hours a 1100 plusmn 15degF
Test bats shall have a nominal gage diameter of 25 inches and gagelength of 75 inches Gage area shall be peened using S-110 5-170 CW14 or CW33 shot to 002 - 008A Coverage 100 to 400
(sample specimen drawing can be added if helpful)
Test Conditions Bars shall be dwell LCF tested to failure in load control Reportcycles to failure
Temperature Room temperature A-ratio 9 - 10 Peak Stress 126 KS) Cyclic Rate 2 minute dwell at peak stressLoad and Unloading Rate 1 - 3 seconds
Figure 18 Plot of Set A and Metcut Research Inc Dwell Cycle Fatigue Data
DWELL CYCLE FATIGUE DATA (OSU amp METCUT) 150
140
-4+0
130 shy= 1845deg F
AAACI RT950209Manila (Dickson T - 75degF 597 volume Primary aHRC278) 114shy
RT950209 Set A (Metcut T - 75degF 662 volume Primary a (avgvalue)HRC240)
O RT950483 (Ladish T - 50degF 518 volume Primary a (avgvalue)HRC303) 120 shy
O RT950522 (Ladish T - 50degF 617 volume Primary aHRC265)
RT950522 1 (Ladish T 50degF 617 volume Primary aHRC265) TEST INTERRUPTED
A Metcut Tested RT950209 (Metcut T - 45deg F)
Metcut Tested RT950209 (Metcut T - 75degF)
110
0 1 2 3 4 5
LOG CYCLES
1100
Figure 19 Ti-6242Si Heat RT950209 Solution Anneal Temperatures vs UTS
1050
a o
Vl cu
1000
950
900 shy
850
950 960 970 980 990
Solution Anneal Temperature (deg C)
1000 1010 1020
Table 6 OREMET-WAH CHANG TI - 6242Si Specimen List amp Data
BETA TRANSUS = 1845deg F = 1007degC
SET A (Includes RT950209 samples T2TOP1 through T2TOP14 RT950209Manila RT950483 amp RT950522)
TYPE TEST amp LOG CYCLES VOLUME ROCKWELL C SOLUTION ANNEAL SAMPLE ID STRESS (KSI amp MPa) TO FAILURE PRIMARY ALPHA HARDNESS TEMPERATURE ( degC and degF )
T2TOPlface DCF 135 9308 291 682 259 966 1770 T2TOP1axial DCF 135 9308 291 634 259 966 1770 T2TOP2face DCF 134 9239 302 693 297 966 1770 T2TOP2axial DCF 134 9239 302 63 297 966 1770 T2TOP 4face DCF 138 9515 259 655 254 966 1770 T2TOP 5face DCF 137 9446 264 642 288 966 1770 T2TOP 5axial DCF 137 9446 264 589 288 966 1770 T2TOP 6face DCF 130 8963 307 666 271 966 1770 T2TOP 6axial DCF 130 8963 307 617 271 966 1770 T2TOP 7face DCF 127 8756 331 648 293 966 1770 T2TOP 8face DCF 120 8274 412 639 207 966 1770 T2TOP 8axial DCF 120 8274 412 626 207 966 1770 T2TOP 9face DCF 124 8550 360 563 336 966 1770 T2TOP 9axial DCF 124 8550 360 569 336 966 1770 T2TOP10 LCF 138 9515 388 966 1770 T2TOP11 LCF 130 8963 407 966 1770 T2TOP12 LCF 120 8274 482 966 1770 T2TOP13 DCF 119 8205 419 966 1770 T2TOP14 LCF 115 7929 499 966 1770 MANILA 2face DCF 135 9308 278 597 278 966 1770
RT950483 1face DCF 135 9308 337 539 271 979 1795 RT9504831axial DCF 135 9308 337 450 271 979 1795 RT950483 2face DCF 135 9308 339 497 335 979 1795
RT950522 1face DCF 135 9308 322 TEST INTERRUPTED 619 337 979 1795 RT950522 2face DCF 135 9308 330 617 265 979 1795
Table 7 OREMET-WAH CHANG Ti - 6242Si Specimen List amp Data (cont)
BETA TRANSUS = 1845deg F = 1007deg C
SET B (Includes RT950209B 1 2 amp 3 21 22 23 1R through 13R 70H through 110H 180H amp 190H)
TYPE TEST amp LOG CYCLES VOLUME ROCKWELL C SOLUTION ANNEAL SAMPLE ID STRESS (KSI amp MPa) TO FAILURE PRIMARY ALPHA HARDNESS TEMPERATURE ( degC and degF)
T2TOPlface Creep 133 Creep 917 241 hours 641 954 1750 T2TOP1axial Creep 133 Creep 917 241 hours 640 954 1750 T2TOP2face Creep 125 Creep 862 241 hours 681 954 1750 T2TOP2axial Creep 125 Creep 862 241 hours 691 954 1750 T2TOP3 954 1750 T2TOP21face DCF 135 9308 333 416 345 1004 1840 T2TOP21axial DCF 135 9308 333 1104 345 1004 1840---T2TOP22face DCF 127 8756 367 Test 153 1004 1840 T2TOP22axial DCF 127 8756 367 Interrupted 501 1004 1840 T2TOP23face DCF 120 8274 420 521 285 1004 1840 T2TOP23axial DCF 120 8274 420 285 1004 1840 T2TOP1Rface LCF 110 7584 523 993 1820 T2TOP1Raxial LCF 110 7584 523 993 1820 T2TOP2Rface LCF 138 9515 361 993 1820 T2TOP2Raxial LCF 138 9515 361 993 1820 T2TOP3R nonconforming sample used as dummy for creep tests 993 1820 T2TOP4Rface LCF 135 9308 377 993 1820 T2TOP4Raxial LCF 135 9308 377 993 1820 T2TOP5Rface DCF 127 8756 372 578 993 1820 T2TOP5Raxial DCF 127 8756 372 481 993 1820 T2TOP6Rface DCF 135 9308 301 399 993 1820 T2TOP6Raxial DCF 135 9308 301 311 993 1820 T2TOP7Rface DCF 120 8274 412 993 1820 T2TOP7Raxial DCF 120 8274 993 1820 T2TOP8Rface DCF 138 9515 266 993 1820 T2TOP8Raxial DCF 138 9515 266 993 1820
I
Table 7 (cont) OREMET-WAH CHANG Ti - 6242Si Specimen List amp Data
BETA TRANSUS = 1845 degF = 1007 degC
SET B (Includes RT950209B 1 2 amp 3 21 22 23 1R through 13R 70H through 110H 180H amp 190H) (continued)
TYPE TEST amp LOG CYCLES VOLUME ROCKWELL C SOLUTION ANNEAL SAMPLE ID STRESS (KSI amp MPa) TO FAILURE PRIMARY ALPHA HARDNESS TEMPERATURE ( degC and degF)
T2TOP9Rface 993 1820 T2TOP9Raxial 993 1820 T2TOP1ORface 993 1820 T2TOP1ORaxial 993 1820 T2TOP11Rface 993 1820 T2TOP11Raxial 993 1820 T2TOP12Rface Creep 125 Creep 862 241 hours 993 1820 T2TOP12Raxial Creep 125 Creep 862 241 hours 993 1820 T2TOP13Rface Creep 133 Creep 917 241 hours 993 1820 T2TOP13Raxial Creep 133 Creep 917 241 hours 993 1820 T2TOP7OHface LCF 138 9515 387 T2TOP70Haxial LCF 138 9515 387 T2TOP8OHface LCF 130 8963 42 T2TOP80Haxial LCF 130 8963 42 T2TOP9OHface LCF 120 8274 477 T2TOP90Haxial LCF 120 8274 477 T2TOP100Hface LCF 110 7584 52 failed in grip T2TOP100Haxial LCF 110 7584 52 failed in grip T2TOP110Hface LCF 108 7446 519 failed in grip T2TOP110Haxial LCF 108 7446 519 failed in grip
T2TOP180Hface DCF 127 8756 388 203 333 T2TOP180Haxial DCF 127 8756 388 228 333 T2TOP19OH Defective Surface

Dwell Time Low Cycle Fatigue in Ti-6242Si
by
Robyn 0 Faber
A THESIS submitted to
Oregon State University
in partial fulfillment of the requirements for the
degree of Master of Science
Completed November 20 1998 Commencement June 1999
Master of Science thesis of Robyn 0 Faber presented on November 20 1998
APPROVED
Major Professor representing Materials Science
Coordinator of Materials Science Program
Dean of Gradua chool
I understand that my thesis will become part of the permanent collection of OregonState University libraries My signature below authorizes release of my thesis to anyreader upon request
Robyn 0 Faber Author
Redacted for Privacy
Redacted for Privacy
Redacted for Privacy
Redacted for Privacy
ACKNOWLEDGEMENT
I would like to acknowledge and thank OREMET WAH CHANG and the Oregon
Joint Schools of Engineering for their financial assistance and overall support I would
also like to acknowledge the assistance of Yoji Kasaka and Bryan Bristow at OREMET
WAH CHANG and the insight of Dr M E Kassner at Oregon State University
Finally I would like to acknowledge the assistance of Dr Karol Schrems at the Albany
Research Center with the metallography and Dr Xiao Li with the creep testing
TABLE OF CONTENTS
P
INTRODUCTION 1
REVIEW OF LI 1 ERATURE 6
EXPERIMENTAL PROCEDURE 10
RESULTS 19
DISCUSSION 34
CONCLUSIONS 37
REFERENCES 38
APPENDIX 41
LIST OF FIGURES
Figure Page
1 Alpha (primary a and transformed (3) + Beta Microstructure consisting of approximately 97 a and 3 13 3
2 Widmanstatten Microstructure 4
3 Flow Chart for TMP Ingot to Billet Conversion 11
4 The Instron 8521 with Sample Loaded for a DLCF Test 16
5 DLCF and LCF Testing Profiles 17
6 Ti-6242Si Dwell amp Low Cycle Fatigue Data 20
7 DLCF and LCF Results for IMI 685 as Reported by WJ Evans [13] 21
8 RT950209 Set B Sample T2TOP1 TD -53deg C Axial Section 22
9 RT950209 Set B Sample T2TOP4 To -41deg C Transverse Section 23
10 RT950522 Set A Sample 2 To -28deg C Transverse Section 24
11 RT950483 Set A Sample 1 To -28deg C Transverse Section 25
12 RT950209 Set B Sample T2TOP6R To -14deg C Transverse Section 26
13 RT950209 Set B Sample T2TOP22 To 3deg C Transverse Section 27
14 RT950209 Set B Sample T2TOP180H Unknown Solution Anneal Temperature Estimated To 8deg C Transverse Section 28
15 Ti-6242Si Creep Data (Ambient temperature Constant Engineering Stress Tests) 30
16 DCF LCF Creep Testing Sample Dimensions Specifications 42
17 DCF Sampling Preparation and Testing Outline 43
LIST OF FIGURES (continued)
Figure
18 Plot of Set A and Metcut Research Inc Dwell Cycle Fatigue Data
19 Ti-6242Si Heat RT950209 Solution Anneal Temperatures vs UTS
P
44
45
LIST OF TABLES
Table Fagg
1 Ingot Compositions (wt ) 12
2 Heat Treatment Table for OREMET-WAH CHANG Ti-6242Si Test Specimens 14
3 Summary of Average Primary Alpha and Hardness for Each Solution Anneal Temperature 29
4 Ambient Temperature Creep Data for Ti-6242Si 31
5 Tensile Properties of Ti-6242Si as a Function of Solution Anneal Temperature 33
6 Set A Specimen List and Data 46
7 Set B Specimen List and Data 47
Dwell Time Low Cycle Fatigue in Ti-6242Si
INTRODUCTION
Dwell sensitivity refers to the reduction in fatigue life as a result of adding a holding
time or dwell period at peak load to a low cycle fatigue (LCF) test This dwell time low
cycle fatigue (DLCF) test better simulates actual service conditions of aircraft turbine
engine components typically made from titanium alloys Ti-6A1-2Sn-4Zr-2Mo-01Si
(Ti-6242Si) a near alpha alpha-beta alloy is one such alloy used in aerospace and
aeronautical high temperature applications One specific use for Ti-6242Si is for aircraft
turbine engine compressor disks
Ti-6242Si consists of primarily a hexagonal close packed (hcp) crystallographically
structured alpha phase plus three percent or less body centered cubic (bcc) beta phase at
room temperature The transformation temperature above which the one hundred
percent beta phase is thermodynamically stable is referred to as the beta transus (T(3)
The added aluminum acts as an alpha phase stabilizer the molybdenum as a beta phase
stabilizer and the zirconium and tin as solid solution strengthening agents as well as
transformation rate retardants The added silicon maximizes creep resistance through
dispersion strengthening and the resulting stabilization of the surface engineering
properties during elevated temperatures under stress [1 2]
2
An alpha-beta (a [3) alloy is one where a mixture of alpha and beta phases exists at
equilibrium usually room temperature [2] The near-a designation refers to an a+fi
composition containing less than three percent beta [3] and therefore is near the
aa+13 phase boundary [2] Two forms of alpha phase are typically present primary
alpha and transformed beta The primary alpha is that which remains in the alpha phase
throughout heat treatment Transformed beta is alpha phase which changes to beta
during heat treatment above the beta transus then returns to alpha upon cooling [3]
This alpha may emerge as acicular or lamellar serrated platelike or Widmanstatten in
appearance [3] Widmanstatten microstructure is described as coarse colonies of aligned
alpha platelets [2] Heat treatments are a means of adjusting the microstructure to
control the properties of alpha-beta alloys [2]
The microstructures most common for Ti-6242Si are a (primary a and transformed
13) + 13 and acicular a (Widmanstatten or basketweave) plus 13 The former is a
microstructure of equiaxed alpha phase (primary a) in a transformed beta matrix (Figl)
and is produced through heat treatment below the beta transus and slow cooling This
microstructure is referred to as a + 13 has good high temperature fatigue properties and
is a stable microstructure [4] Furnace cooling produces this coarse aligned alpha
structure which some have suggested is particularly sensitive to dwell cycle fatigue [5 6]
Heat treatment above the beta transus results in a Widmanstatten aligned acicular alpha
microstructure upon cooling (Fig 2) and is known to have good high temperature creep
properties [4] As the cooling rate from above the beta transus is increased the
transformed beta becomes finer and a basketweave microstructure is produced [7]
3
Figure 1 Alpha (primary a and transformed f3)+ Beta Microstructure
consisting of approximately 97 a and 3 13
(The above micrograph is of a Ti-6242Si specimen tested during this study)
4
2011m
Figure 2 Widmanstatten Microstructure
(The above micrograph is of a Ti-6242Si specimen tested during this study)
5
Basketweave microstructure is reported to be the least susceptible to dwell cycle fatigue
by simple virtue of a more tortuous crack propagation path but processing to attain it
is unreasonable in an industrial situation [6] The cooling rate from above the beta
transus therefore significantly affects the alloys mechanical properties by altering the
microstructure [1]
The objective of the present work was to confirm the existence of a dwell debit in
near-alpha Ti-6242Si produced by alphabeta processing and investigate the
effectiveness of solution anneal temperature changes in reducing this debit Solution
annealing allows for accurate and consistent temperature control in an industrial situation
as it is accomplished after thermomechanical processing the titanium in its largest form
Studying factors affecting dwell cycle fatigue life may also aid in the determination of the
fundamental mechanism of dwell fatigue
6
REVIEW OF LITERATURE
Dwell sensitivity can result in over an order of magnitude fewer cycles to failure and
was first reported by J Waisman et al in 1973 [8] Work has been continued by Evans
and coworkers Eylon and Hall [9] and Woodfield et al [5] Most studies have focused
on the titanium alloy IMI 685 or Ti-6-4 but the most recent works cite results of tests
using a number of titanium alloys including Ti-6242Si or exclusively Ti-6242Si
The mechanism leading to dwell sensitivity is still unresolved In 1979 Evans and
Gostelow [10] suggested that ambient temperature dwell sensitivity is due to time-
dependent plastic strain accumulation and that facet formation during creep
deformation is linked to the extensive facet formation present in dwell cycle fatigue
specimens [10]
Titanium alloys have the intrinsic property to creep at ambient temperature [11]
In 1984 Chu et at found that a dwell period leads to stress relaxation which has the
same effect as prior creep [11] Chus group also reported that multiple (fifty or more)
fatigue cycles between hold times actually results in a longer life when compared to low
cycle fatigue results The given explanation that prior creep increases the resistance of
the material through the delaying of fatigue damage (hardening) is contradictory to Evans
and Gostelow but Chu et al also reported that only one cycle between hold times did
HP Chu BA MacDonald and OP Arora Titanium Science and Technology Vol 4 Eds G Lutjering U Zwicker and W Bunk Proceedings of the 5th International Conference on Titanium Duetsche Gesellechat fiir Metallkunde EV Munich 1984 p 2395
7
not generate interaction between fatigue and prior creep during that investigation and a
reduction in fatigue life with the added strain-hold time was observed [11]
The microstructure of Ti-6242Si can be altered by changing the solution anneal
temperature below the beta transus (TO This affects the amounts of primary alpha and
transformed beta present and may affect the dwell sensitivity in two ways First the
amount of primary alpha which increases with decreasing solution anneal temperature
could change the strength of the alloy Second this would tend to alter plasticity and
perhaps affect the susceptibility to dwell effects according to the time-dependent
plasticity (creep) explanation
In 1988 Neal published a number of findings after performing low cycle and dwell
cycle fatigue tests on various titanium alloys including Ti-6242Si He explained the
presence of a dwell effect at temperatures below approximately 200deg C by means of
planar slip on or near the hcp basal plane (0001) and by creep-fatigue interactions at
temperatures above approximately 400deg C His explanation for the lack of dwell
sensitivity between these two temperatures is dynamic strain aging
Suri and coworkers reported in 1997 that extensive low temperature primary creep
in titanium alloys is clearly associated with extreme planar slip 2
2 S Suri T Neeraj GS Daehn DH Hou JM Scott RW Hayes and MJ Mills Materials Science and Engineering A234-236 1997 pp 996-999
8
Thiehsen et al reported in 1992 that raising the solution anneal temperature
increases both the primary and steady state high temperature creep resistance of Tishy
6242Si The beneficial effect may be derived from a combination of several sources
including the removal of such micrographic features as banding or texturing and
especially the altering or refining of the a or 13 microstructure 3
Hack and Leverent reported in 1982 that beta-processed near-alpha titanium alloys
with a large colony microstructure were found to be susceptible to internal hydrogen
embrittlement under conditions of sustained loading of fatigue cycling with a dwell
period at peak load 4 A colony is described as a cluster of acicular alpha grains aligned
in the same orientation [3] Their study found that both time-dependent deformation
and internal hydrogen are required for the embrittlement to occur Hydrogen
embrittlement occurs by localized increases in hydrogen content at the tips of long
blocked shear bands developed during time dependent plastic deformation [12] Fatigue
crack nucleation is a result of cyclic loading which causes to-and-fro slip to occur [13]
When this slip results persistent slip bands then extrusions and intrusions result Cracks
are thought to nucleate at intrusions [14] Woodfield et al presented results indicating
that thermomechanical processing can break up the aligned alpha colonies creating
randomly orientated primary alpha [5] Increasing the final solution anneal temperature
closer to the beta transus followed by quenching can not only alter the volume fraction
of primary alpha but may also decrease the possibility of any aligned alpha colonies
Reduction of susceptibility to DLCF may result through simply minimizing the volume
3 KE Thiehsen ME Kassner J Pollard DR Hiatt and B Bristow Metall Trans 24A 1993 p 1819 4 JE Hack and G R Leverant Metall Trans 13A 1982 p 1729
9
of the weaker alpha phase or by reducing the alpha colonies thought to be associated
with the facets linked to internal DLCF crack initiation [5]
Evans 1987 paper reports that his results do not support the shear band model and
in contrast suggests that there is an increase in life with hydrogen content [8] He also
states that once the cracks are formed though their growth is greatly influenced by
hydrogen concentration Previous work [6 10 12] has shown that times to failure for
creep and dwell tests with a five minute holding period per cycle are indistinguishable
Evans said that the mechanisms responsible for crack initiation are the same for creep
dwell and cyclic fatigue testing and that they probably involve time-dependent strain
accumulation
Neals findings that almost identical dwell effects were present at all levels of
hydrogen tested including a degassed material (lt10 ppm H2) were also in contrast to
those reported by Hack and Leverent In addition Neal stated that because both
alphabeta and beta heat treated structures exhibited dwell effects alloying composition
appeared the controlling factor Hack and Leverent suggested Ti-6242Si was not
susceptible to dwell effects even when beta heat treated 5 and that microstructural
features associated with the hydrogen embrittlement process are the key to DLCF in IMI
685 [12] Furthermore Neal found that the higher the stress the greater the percentage
cyclic life loss with a dwell period added [15]
5 DF Neal Sixth World Conference on Titanium Vol 1 Proceedings of the Sixth World Conference on Titanium Cannes 1988 p 175
10
EXPERIMENTAL PROCEDURE
Standard thermomechanical processing (TMP) was applied to 914 mm diameter
Ti-6242Si ingots which in turn were forged to approximately 238 mm diameter round
billets Five to six billets result from a single ingot Rectangular coupons were cut from
an ingot position designated billet with the long axis of the coupons radial to the long
axis of the billet and so that the specimen gage section would be at approximately the
mid-radius position
All specimens are identified by the heat number of the OREMET-WAH CHANG
production billet from which the sample coupons were extracted as well as by the
position designation along that billet (Fig 3) The beta transus for each billet was
determined by differential thermal analysis (DTA) The ingot chemical compositions are
presented in Table 1 and were determined by inductively coupled plasma atomic
emission spectroscopy (ICP) and gas analysis The specific processing steps follow
The ingot was heated initially to 1149deg C upset (set up on end which results in the
compression of the ingot to a specified amount) by approximately fifty percent and
forged to dimensions 813 mm x 1067 mm x L
This was followed by a forging to 737 mm square also after heating to 1149deg C and a
water quench
FIGURE 3 Flow Chart for TMP Ingot to Billet Conversion
Ingot Heat RT950209 914 mm initial diameter
Designated T1 737mm square = initial size Designated Bottom 737 nun square = initial size
Designated Tl T2 T3 T4 amp Bottom 610 mm square = initial size
11 T2 13 Bottom
Designated Tl T2 T3 T4 amp Bottom 286 mm rough round = initial size
1 2I I
5 billets 238 mm round = final size
Table 1 Ingot Compositions (wt )
Al Cr Fe Mo Ni Si Sn Zr C 0 N H
RT950209 Top 608 0003 0033 200 0007 009 201 418 0005 0107 0002 00044
Tp = 1007degC (DTA) Bottom 600 0002 0033 195 0007 009 196 409 0003 0104 0001 00047
-RT950483 Top 63 0002 0031 201 0008 009 202 417 0005 0133 0001
Tp = 1007degC (metall) Bottom 593 0002 003 194 0007 008 191 404 0006 013 0001 00060
-RT950522 Top 608 0001 0032 205 0001 008 199 412 0004 0127 0002
Tp -- 1007degC (metall) Bottom 599 0001 0033 196 0001 009 193 413 0009 0123 0003 00045
13
The alloy was then forged to 610 mm square after heating to 954deg C Next it was
heated to 1066deg C which is above the beta transus and held at that temperature for
two hours before water quenching
After heating to 968deg C and forging to 286 mm rough round the billet was
conditioned (cosmetic surface grinding) heated again to 968deg C and forged by rotary
forging machine to 238 mm round Solution annealing at 954deg C for two hours
forty-two minutes and air cooling followed
Finally the billet was annealed at 704deg C for six to nine hours air cooled and peeled
(descaled) The rectangular coupons were cut from the billet after this step
Solution heat treating of the coupons (To -3deg C to To -53deg C) for one hour followed
by an eight hour age as outlined in Table 2 preceded machining and surface treating
All solution heat treating machining and surface treating was completed by Metcut
Research Inc Dickson Testing Company Inc or a combination of both companies
The final specimens have an average gage diameter of 63 mm and a gage length of
19 mm All gage sections were peened using S-110 S-170 CW-14 or CW-33 shot to
0002 0008 A 100 to 400 coverage [16] Hardness testing was performed at
Oregon State University using the Rockwell C test
All tests fatigue and creep were performed using an 8521 Instron at Oregon State
University This Instron is a digitally controlled servohydraulic biaxial testing machine
with a maximum load capability of 20000 pounds The attached control panel allows for
precise monitoring general programming and rapid response times An additional
TABLE 2 HEAT TREATMENT TABLE FOR OREMET-WAH CHANG TI - 6242Si TEST SPECIMENS
BILLET HEAT IDENTIFICATION SAMPLE IDENTIFICATION
RT950483 RT950522 A 483 1 amp 2 and
A 522 1 amp 2 RT950209
A T2TOP1 through A T2TOP14 and Manila 2
RT950209 B T2TOP1 amp 2
RT950209 B T2TOP21 22 amp 23
RT950209 B T2TOP1R through 13R
RT950209 B T2TOP7OH through 200H
SOLUTION ANNEAL
979deg C + 14deg for 1 hr cool at 17deg C min + 3deg to below 538deg C
966deg C + 14deg for 1 hr cool at 17deg C min + 3deg to below 538deg C
954deg C for 1 hr cool at 17deg C min to 593deg C
1004deg C for 1 hr cool at 17deg C min to 593deg C
993deg C for 1 hr cool at 17deg C min+ 3deg to below 538deg C
Beta Transus exceeded Most samples returned untested
AGING
593deg C + 8deg for 8 hrs air cool
593deg C + 8deg for 8 hrs
air cool
hold at 593deg C for 5 hrs air cool
hold at 593deg C for 8 hrs air cool
593deg C + 8deg for 8 hrs air cool
593deg C + 8deg for 8 hrs air cool
PROCESSING LAB
Dickson Testing Company Inc
Metcut Research Inc (T2TOP1-14 Dickson Testing Company Inc
(Manila 2)
Metcut Research Inc
Metcut Research Inc
Dickson Testing Company Inc
Metcut Research Inc
15
computer with Labview software was used for more specific programming and data
collection during the creep tests
Prior to testing each specimen was cleaned with acetone then two strain gages were
mounted 180 degrees apart in the same position along the longitudinal axis of the gage
section Strain indicators wired to the gages were used to maintain zero strain on the
sample during installation into the grips on the Instron The Instron was programmed
to maintain zero load during this process This careful installation and alignment
procedure coupled with a grip designed to minimize possible bending stresses resulted
in highly reproducible results and minimum scatter (Fig 4)
The low cycle fatigue (LCF) testing cycle consisted of a two second loading period to
peak followed immediately by a two second unloading period back to zero load The
testing cycle for the dwell cycle fatigue tests also consisted of a two second loading to
peak load but was followed by a two minute hold time at that peak load before the two
second unloading to zero (Fig 5) All testing was performed at a stress ratio
R = 6 = 0 All values of stress and strain are reported as engineering stress and
strain
During the ambient temperature creep tests the Instron was programmed to
maintain a constant load for approximately twenty-four hours with the attached
computer monitoring and collecting strain data from the mounted strain gages The
loading time to the desired stress was sixty seconds
16
Figure 4 The Instron 8521 with Sample Loaded for a DCF Test
DWELL TIME LOW CYCLE FATIGUE
2 minute hold time6 + r--- 2 second loadunload time
LOW CYCLE FATIGUE
2 second loadunload time
6 +
Figure 5 DLCF and LCF Testing Profiles
_ -1
18
After testing axial and transverse sections were taken from specimens using a
diamond blade on a low speed saw then mounted in phenolic powder ground and
polished All polishing was accomplished using SiO2 suspension solution after grinding
on 320 400 and 600 grit silicon carbide grinding paper The samples were then etched
with a ten percent HF fifteen percent HNO3 and seventy-five percent H2O etchant
(Krolls reagent) for approximately three seconds Area fractions of primary alpha were
calculated using NIH Image Analysis computer software after scanning in micrographs
taken with an Olympus PME optical microscope
19
RESULTS
Figure 6 presents the results obtained through low cycle fatigue testing as well as
dwell cycle fatigue testing in the form of a stress versus log number of cycles to failure
plot The corresponding legend identifies each set of data the solution anneal
temperature for that set and the type of test (LCF or DLCF) Again Table 2 lists the
heat treatments for each set of Ti-6242Si specimens The plot of data in Figure 6 clearly
shows the reduction in the number of cycles to failure as a result of the added two
minute dwell period This reduction is by over an order of magnitude number of cycles
at the most elevated stresses decreasing to a factor of five at the lowest tested stresses
It is probable that the dwell cycle fatigue curves merge with the low cycle fatigue data line
at lower stresses than were tested during this investigation These results are generally
consistent with those published by Evans (Fig 7) [8] Micrographs illustrating the
typical microstructure (and volume percent primary alpha) developed by each solution
anneal temperature are pictured in Figures 8 through 14 It is clear that the dwell cycle
fatigue cycles to failure increase with increasing solution anneal temperature or
decreasing volume percent primary alpha Table 3 gives a summary of the average
primary alpha phase present and average hardness data for the associated solution anneal
temperatures
Figure 15 contains a plot of ambient temperature creep tests in the form of creep
strain versus time in seconds for a given engineering stress and expectedly displays
higher creep strains per unit of time with higher solution anneal temperatures Table 4
contains this creep strain data for each solution anneal temperature and tested stress
Figure 6 TI-6242Si Dwell amp Low Cycle Fatigue Data
1000
DCF LCF
950
900
73shy
2 co 850(i)
re
= 1007 degC
RT950209 Set A (T -41degC) DCF
RT950209Manila Set A (T3 -41deg) DCF
RT950209 Set A (T -41degc) LCF
To-41degC
Tp-14degC
800
RT950209 Set B (Tp -3degC) DCF
RT950209R Set B (T -14degC) DCF
750
O
X
RT950209R Set B (T -14degC) LCF
RT9502090H Set B (TD --Pc) LCF r X
test interrupted due to power failure
700
0 2 3
LOG CYCLES TO FAILURE
4 5 6
Figure 7 DLCF and LCF Results for IMI 685 as Reported by WJ Evans [13]
3 4
LOG CYCLES TO FAILURE N
2
I I
2011m
Figure 8 RT950209 Set B Sample T2TOP1 To -53deg C Axial Section
11
L__J L__J 2020
Figure 9 RT950209 Set A Sample T2TOP4 T13 -41deg C Transverse Section
20 pm 20microm
Figure 10 RT950522 Set A Sample 2 Tp -28deg C Transverse Section
L__1 20 1im
Figure 11 RT950483 Set A Sample 1 To -28deg C Transverse Section
1
20pm
Figure 12 RT950209 Set B Sample T2TOP6R To -14deg C Transverse Section
i
20pm
Figure 13 RT950209 Set B Sample T2TOP22 To 3deg C Transverse Section
20 pm L__I 20 pin
Figure 14 RT950209 Set B Sample T2TOP180H Unknown Solution Anneal Temperature Estimated Tp 8deg C Transverse Section
TABLE 3 SUMMARY OF AVERAGE PRIMARY ALPHA AND HARDNESS FOR EACH SOLUTION ANNEAL TEMPERATURE
Beta Transus = 1007deg C
SOLUTION ANNEAL AVERAGE PRIMARY AVERAGE ROCKWELL TEMPERATURE (degC) ALPHA PERCENTAGE HARDNESS (HRC)
954 650 no tests 966 630 276 979 544 302 993 442 no tests
Estimated 999 216 333 1004 54 315
Figure 15 Ti-6242S Creep Data (Ambient Temperature Constant Stress Tests at 917 and 862 MPa)
005
004 shy
c
ti)
2)U
003
002 constant stress 917 MPa
0
Solution Anneal Temperature 993 C
Solution Anneal Temperature 954 degC
000 0 20000
constant stress 862 MPa
40000 60000
Time (seconds)
80000 100000
TABLE 4 AMBIENT TEMPERATURE CREEP DATA FOR TI-6242Sil
Beta Transus = 1007deg C
MPa Solution Anneal cP at Final Load EP E P at E (S-1) at
Temperature ( 63 seconds ) ( 120 seconds ) ( 80 x 104 seconds ) ( 80 x 104 seconds )r
917 Tp -14deg C 00082 0010 0037 73 X 10-8
917 Tp -53deg C 00064 0008 0033 99 X10-8
862 Tp -14deg C 00011 0003 0012 26 x 10-8
862 Tp -53deg C 00005 0002 0010 26 x 1043
930 Tp -14deg C 00105 0013 0054 12 x 10-7
930 Tp -25deg C 00047 0006 0025 64 x 10-8
1 Two tests at 930 MPa failed during creep testing prior to 80 x 10 4 seconds
(A)
32
Tensile data as a function of solution anneal temperature for Ti-6242Si without
surface shot peening is presented in Table 5 As the solution anneal temperature is
increased above Tp -25deg C both the 02 offset yield strength and the ultimate tensile
strength decrease with further increases in temperature
1
TABLE 5 TENSILE PROPERTIES OF TI- 6242Si AS A FUNCTION OF SOLUTION ANNEAL TEMPERATURE ( Surfaces Not Shot Peened )
Beta Transus = 1007deg C
02 Average BILLET HEAT IDENTIFICATION Solution Anneal Yield Strength UTS El Hardness
SAMPLE IDENTIFICATION Temperature ( MPa ) ( MPa ) ( ) ( HRC ) RT950483 RT950522 A 483 1 amp 2 and To -28deg C 8894 9908 150 (2)1 295 (10)2
A 522 1 amp 2 9074 9935 150 (2) RT950209
A T2TOP1 through A T2TOP14 T -41deg C P
8798 9798 145 (2) 274 (45) and Manila 2
RT950209
B T2TOP1 amp 2 To -53deg C 8825 9722 160
RT950209 B T2TOP21 22 amp 23 To -3deg C 7895 9349 110 315 (10)
RT950209 B T2TOP1R through 13R T -14deg C
13 8260 9556 120
RT950209 Beta Transus possibly B T2TOP7OH through 200H exceeded Most samples
returned untested
Data provided by OREMET - WAH CHANG Number of tests
2 Number of tests per sample x number of samples tested
34
DISCUSSION
Chu et al Bania and Hall and Halls findings may correlate well with the greater
dwell cycle fatigue resistance of Ti-6242Si specimens annealed at higher solution anneal
temperatures and tested during this investigation [11 17 18] As mentioned previously
Chu and coworkers found that prior ambient temperature creep works to improve low
cycle fatigue life by a factor of two or more in Ti-62108 (also an alpha-beta alloy) as a
result of stable dislocation networks produced which delay the onset of fatigue damage
This team also reported that a dwell period at peak load in lieu of prior creep elicited the
same outcome with fifty or more cycles between hold periods but that only one cycle
between hold times resulted in a reduction in fatigue life As reported by Bania and Hall
and Hall alone the range of primary alpha content in Ti-6242Si will result in a minimum
creep rate change of a factor of at least two6 and the high temperature (510deg C) creep
rate is generally reduced as the volume fraction of equiaxed primary alpha is reduced
(increased solution anneal temperature) [17 18] Therefore the reduced dwell sensitivity
at lower volume percentages of primary a may be a function of a reduced creep rate and
not a result of easier crack propagation through the primary a phase
Since microstructure (varying volume percentages of primary a) was found to have
no significant effect on LCF life (Figure 6) this may be indicative of cyclic work
hardening of each microstructure to approximately the same load level during load
controlled tests
35
Referring to Table 4 and Figures 6 and 15 significant time-dependent plasticity occurs
at the higher stresses which are also associated with the greatest dwell sensitivity This
extra plasticity according to Chu et al and Hall delays the onset of fatigue cracking
[11 18] Again referring to Chu and coworkers findings it appears that small amounts
of initial monotonic deformation do not degrade the LCF properties Thus the effect
of the dwell may be that of repeated (cyclic) plasticity due to creep during the dwell
periods7
Subsequent research using the DLCF and LCF specimens tested during the present
investigation has shown that the DLCF specimens accumulated more plastic strain to
failure than the LCF specimens due to creep plasticity [19] Therefore the dwell may
simply increase the strain amplitude of a LCF test at a given stress resulting in a
decreased number of cycles to failure It was also shown that prior monotonic creep
strain comparable to that accumulated in DLCF specimens did not significantly degrade
LCF life [19] These results concur with those reported by Chu et al [11]
One possibly important point to note is that based on the tensile and hardness data
in Table 5 the tensile strength of Ti-6242Si is approximately independent of the solution
anneal temperature (or primary alpha content) up to approximately To-28deg C Above
6 PJ Bania and JA Hall Titanium Science and Technology Vol 4 Proceedings of the 5th International Conference on Titanium Munich 1984 p 2371
7 ME Kassner R Faber X Li Y Ge Y Kosaka SH Reichman and JA Hall TMS Conference 1998 to be published D Eylon RR Boyer and G Liitjering edsWarrendale 1999
36
this temperature the yield strength (YS) and ultimate tensile strength (UTS) decrease
with increasing solution anneal temperature The increased creep strain with increasing
solution anneal temperature experienced during the ambient temperature creep tests is
not then surprising This trend was also observed by Sun et al [20] High temperature
creep tests on this alloy reveal the opposite trend [21]
It appears that in the alpha-beta titanium alloys studied most of the fatigue life is
spent nucleating detectable cracks [18] as with most metals Thus bulk plasticity trends
associated with changes in dwell cycle fatigue and low cycle fatigue may be directly
related to crack nucleation Earlier work by Kansal et al suggests that with increased
primary alpha textured or aligned primary alpha becomes more obvious [22] Chu and
co-researchers studies showed that both creep and fatigue crack propagation did not
coincide with the a-13 interfaces but propagated transgranularly (through the grains)
across the a-13 colonies
Metallographic examination of a Ti-6242Si sample loaded to 876 MPa during DLCF
testing revealed that dwell cycle fatigue cracks exist in many locations away from the
principal crack and may not be associated with secondary cracks These cracks appear
to nucleate in the primary alpha phase and appear to propagate across (transgranularly)
the primary alpha grains [19] It does not appear that the cracking is associated with the
banding often associated with Ti-6242Si with higher volume percent primary alpha
[22 23 24] This banding could be associated with texture
37
CONCLUSIONS
Ambient temperature dwell and low cycle fatigue tests were performed on Ti-6ALshy
2Sn-4Zr-2Mo-01Si (Ti-6242Si) Specimens were solution annealed at various
temperatures below the beta transus to vary the volume fraction of primary alpha The
influence of the changes in primary alpha phase on dwell time low cycle fatigue (DLCF)
life were determined and compared to the conventional low cycle fatigue (LCF)
properties of the alloy It was concluded that
1 A dwell significantly decreased the number of cycles to failure
2 Increasing primary alpha associated with lower solution anneal temperatures
significantly increased susceptibility to dwell fatigue although this affect diminished
with decreasing stress
3 The above trends may be explained by ambient temperature cyclic creep of Tishy
6242Si
4 Increased susceptibility of higher primary alpha to dwell fatigue may be due to an
increased susceptibility of primary alpha to cracking during creep deformation
38
REFERENCES
1 C Andres L Wagner and G Liitjering Microstructure Pmper0 Relationships in Titanium Aluminaides and Alloys YW Kim and RR Boyer eds TMS Warrendale 1991 pp 579-586
2 EW Collings Physical Metallurgy of Titanium Alloys ASM Metals Park OH 1984
3 RR Boyer Titanium and Titanium Alloy Metals Handbook 9th Edition Vol7 ASM Metals Park OH 1982 pp 458-475
4 SL Semiatin JF Thomas Jr and PDadras MetalL Trans 14A 1983 pp 2363shy2374
5 AP Woodfield MD Gorman RR Corderman JA Sutliff and B Yamrom Titanium 95 Science and Technology CA Bienkinsop WJ Evans and HM Flower eds Institute of Materials Cambridge Univ Press 1996 pp 1116-1123
6 WJ Evans Second International Conference on Creep and Fracture of Engineering Materials and Structures Proceedings of the Second International Conference on Creep and Fracture of Engineering Materials and Structures Swansea 1984 p 395
7 DR Askeland The Science and Engineering of Materials 3rd Edition PWS Publishing Company Boston 1994
8 WJ Evans J Mater Sci Lett 6 1987 pp 571-574
9 D Eylon and JA Hall MetalL Trans 8A 1977 pp 981-990
10 WJ Evans and CR Gostelow MetalL Trans 10A 1979 pp 1837-1846
11 HP Chu BA MacDonald and OP Arora Titanium Science and Technology Vol 4 G Lutjering U Zwicker and W Bunk eds Proceedings of the 54 International Conference on Titanium Duetsche Gesellechat fur Metallkunde EV 1984 pp 2395-2402
12 JE Hack and GR Leverant MetalL Trans 13A 1982 pp 1729-1738
13 JA Bannantine JJ Corner JL Handrock Fundamentals of Metal Fatigue Analysis Prentice-Hall Englewood Cliffs NJ 1990
14 S Suresh Fatigue of Materials EA Davis IM Ward eds Cambridge University Press Cambridge 1992
15 DF Neal Sixth World Conference on Titanium Val Proceedings of the Sixth World Conference on Titanium Cannes 1988 pp 175-180
39
16 ASM Committee on Shot Peening Metals Handbook 9th Edition ASM Vol 5 1982 pp 138-149
17 PJ Bania and JA Hall Titanium Science and Technology Vol 4 Proceedings of the 5th International Conference on Titanium Munich 1984 pp 2371-2378
18 JA Hall Int J Fatigue Vol 19 Supp No 1 1997 pp S23-S37
19 ME Kassner R Faber X Li Y Ge Y Kosaka SH Reichman and JA Hall TMS Conference 1998 to be published D Eylon RR Boyer and G Liitjering eds TMS Warrendale 1999
20 S Suri T Neeraj GS Daehn DH Hou JM Scott RW Hayes and MJ Mills Materials Science and Eng A234-236 1997 pp 996-999
21 KE Thiehsen ME Kassner J Pollard DR Hiatt and BM Bristow Metall Trans 24A 1993 pp 1819-1826
22 U Kansal ME Kassner DR Hiatt and BM Bristow J Mater Eng and Pe 1 1992 pp 393-398
23 SL Semiatin and GD Lahoti Metall Trans 14A 1983 pp 105-115
24 SL Semiatin and GD Lahoti Metall Trans 14A 1983 pp 743-750
25 C Quesne C Duong F Charpentier JF Fries and P Lacombe Journal of the Less-Common Metals Vol 68 1979 pp 133-142
26 A Tahmassebi Khadem Assadi HM Flower DRF West MetTechnol Jan 1979 pp 16-23
27 WJ Evans and GF Harrison Journal of Materials Science 18 1983 pp 3449-3455
28 W Cho JW Jones JE Allison and WT Donlon Sixth World Conference on Titanium VoZ1 Proceedings of the Sixth World Conference on Titanium Cannes 1988 pp 187-192
29 T Bui-Quoc R Gomuc A Biron HL Nguyen RN Tadros Journal of Testing and Evaluation JTEVA Vol 18No 3 May 1990 pp 160- 171
30 WJ Evans and MR Bache Titanium 92 Science and Technology FH Froesand I Caplan eds TMS 1993 pp 1693-1699
31 WJ Evans and MR Bache Fatigue 16 1994 pp 443-453
32 D Eylon and CM Pierce Metall Trans 7A 1976 pp 111-121
40
33 NE Paton and MW Mahoney MetalL Trans 7A 1976 pp 1685-1689
41
APPENDIX
Figure 16 DCF LCF Creep Testing Sample Dimensions Specifications
Iii V000 PLAC2
reg 117100 1
310 1002 2 PLACeS2 PLACES
o4o401 Q IMAGES
lie 3 Cin DRILL 20 144tmt ofpit4 2 PLACES
11111311a211=1 lul 1111111)113000 Iof i 2110111011
25001005 WAS sky t aosGA 31 00 511
4 ease-750 es 01 s) El 001 2 PLACE
-20 31
masa ernowel -C0
114 shares 1 v mpe
Nur 111101114 WELDILC1 301t 11496 401S1111111 All Al map5 aIP-F C3-1114G OmiCi AolMent -601 Al fC10
pADIu 1r e41C 3LCTIDN TO bLEN0WonT1L WITHOUT UN DCA C1J1
3 IWin] or41112wISE ZrZellhen liemovt ALLeuaqs 4 ZmARP toast WITH 055 kaospAosus OR cHDPsrail 2-TAG Gt 4013113- 202 I- mum comvornA 1ta 401511S-VIO CLshy
15o I-Jaatori 2 PLACtS NOTE
gaming Oa4614S-NO
11117014 ltdi Cato 50
TA DLTA I L 41111104e
1111111111114011111VISICgems ft 111 01010011 watat wage 4110
sraclutN b4 cymmoot ICAO 4AM50Cliel ep 47 Cr ELAo GUI r
nv toorit to lic8 07482 (7113115 -702P 111429e11 114111 par pup
inrit 4s SO 1 ia
1
43
Figure 17 DCF Sampling Preparation and Testing Outline
Dwell Fatigue Testing of Billet
Sampling Specimens for fatigue tests shall be taken at top middle and bottom locations at least two diameter lengths from billet ends Two specimens are required at each location Specimen orientation shallbe radial with the gage centered approximately at the midradiusposition
Sample material provided for the alternate crystallographic structureanalysis shall be a single heat treated transverse slice from each of the billet locations listed above
Specimen Preparation Sara ogre-14 )Sample material shall be solution treated at 50degF below the _bear C c cfF
transus temperature plusmn 25degF for 1 hour Cool at 30 plusmn 5degFmin to below 1000degF Age 8 hours a 1100 plusmn 15degF
Test bats shall have a nominal gage diameter of 25 inches and gagelength of 75 inches Gage area shall be peened using S-110 5-170 CW14 or CW33 shot to 002 - 008A Coverage 100 to 400
(sample specimen drawing can be added if helpful)
Test Conditions Bars shall be dwell LCF tested to failure in load control Reportcycles to failure
Temperature Room temperature A-ratio 9 - 10 Peak Stress 126 KS) Cyclic Rate 2 minute dwell at peak stressLoad and Unloading Rate 1 - 3 seconds
Figure 18 Plot of Set A and Metcut Research Inc Dwell Cycle Fatigue Data
DWELL CYCLE FATIGUE DATA (OSU amp METCUT) 150
140
-4+0
130 shy= 1845deg F
AAACI RT950209Manila (Dickson T - 75degF 597 volume Primary aHRC278) 114shy
RT950209 Set A (Metcut T - 75degF 662 volume Primary a (avgvalue)HRC240)
O RT950483 (Ladish T - 50degF 518 volume Primary a (avgvalue)HRC303) 120 shy
O RT950522 (Ladish T - 50degF 617 volume Primary aHRC265)
RT950522 1 (Ladish T 50degF 617 volume Primary aHRC265) TEST INTERRUPTED
A Metcut Tested RT950209 (Metcut T - 45deg F)
Metcut Tested RT950209 (Metcut T - 75degF)
110
0 1 2 3 4 5
LOG CYCLES
1100
Figure 19 Ti-6242Si Heat RT950209 Solution Anneal Temperatures vs UTS
1050
a o
Vl cu
1000
950
900 shy
850
950 960 970 980 990
Solution Anneal Temperature (deg C)
1000 1010 1020
Table 6 OREMET-WAH CHANG TI - 6242Si Specimen List amp Data
BETA TRANSUS = 1845deg F = 1007degC
SET A (Includes RT950209 samples T2TOP1 through T2TOP14 RT950209Manila RT950483 amp RT950522)
TYPE TEST amp LOG CYCLES VOLUME ROCKWELL C SOLUTION ANNEAL SAMPLE ID STRESS (KSI amp MPa) TO FAILURE PRIMARY ALPHA HARDNESS TEMPERATURE ( degC and degF )
T2TOPlface DCF 135 9308 291 682 259 966 1770 T2TOP1axial DCF 135 9308 291 634 259 966 1770 T2TOP2face DCF 134 9239 302 693 297 966 1770 T2TOP2axial DCF 134 9239 302 63 297 966 1770 T2TOP 4face DCF 138 9515 259 655 254 966 1770 T2TOP 5face DCF 137 9446 264 642 288 966 1770 T2TOP 5axial DCF 137 9446 264 589 288 966 1770 T2TOP 6face DCF 130 8963 307 666 271 966 1770 T2TOP 6axial DCF 130 8963 307 617 271 966 1770 T2TOP 7face DCF 127 8756 331 648 293 966 1770 T2TOP 8face DCF 120 8274 412 639 207 966 1770 T2TOP 8axial DCF 120 8274 412 626 207 966 1770 T2TOP 9face DCF 124 8550 360 563 336 966 1770 T2TOP 9axial DCF 124 8550 360 569 336 966 1770 T2TOP10 LCF 138 9515 388 966 1770 T2TOP11 LCF 130 8963 407 966 1770 T2TOP12 LCF 120 8274 482 966 1770 T2TOP13 DCF 119 8205 419 966 1770 T2TOP14 LCF 115 7929 499 966 1770 MANILA 2face DCF 135 9308 278 597 278 966 1770
RT950483 1face DCF 135 9308 337 539 271 979 1795 RT9504831axial DCF 135 9308 337 450 271 979 1795 RT950483 2face DCF 135 9308 339 497 335 979 1795
RT950522 1face DCF 135 9308 322 TEST INTERRUPTED 619 337 979 1795 RT950522 2face DCF 135 9308 330 617 265 979 1795
Table 7 OREMET-WAH CHANG Ti - 6242Si Specimen List amp Data (cont)
BETA TRANSUS = 1845deg F = 1007deg C
SET B (Includes RT950209B 1 2 amp 3 21 22 23 1R through 13R 70H through 110H 180H amp 190H)
TYPE TEST amp LOG CYCLES VOLUME ROCKWELL C SOLUTION ANNEAL SAMPLE ID STRESS (KSI amp MPa) TO FAILURE PRIMARY ALPHA HARDNESS TEMPERATURE ( degC and degF)
T2TOPlface Creep 133 Creep 917 241 hours 641 954 1750 T2TOP1axial Creep 133 Creep 917 241 hours 640 954 1750 T2TOP2face Creep 125 Creep 862 241 hours 681 954 1750 T2TOP2axial Creep 125 Creep 862 241 hours 691 954 1750 T2TOP3 954 1750 T2TOP21face DCF 135 9308 333 416 345 1004 1840 T2TOP21axial DCF 135 9308 333 1104 345 1004 1840---T2TOP22face DCF 127 8756 367 Test 153 1004 1840 T2TOP22axial DCF 127 8756 367 Interrupted 501 1004 1840 T2TOP23face DCF 120 8274 420 521 285 1004 1840 T2TOP23axial DCF 120 8274 420 285 1004 1840 T2TOP1Rface LCF 110 7584 523 993 1820 T2TOP1Raxial LCF 110 7584 523 993 1820 T2TOP2Rface LCF 138 9515 361 993 1820 T2TOP2Raxial LCF 138 9515 361 993 1820 T2TOP3R nonconforming sample used as dummy for creep tests 993 1820 T2TOP4Rface LCF 135 9308 377 993 1820 T2TOP4Raxial LCF 135 9308 377 993 1820 T2TOP5Rface DCF 127 8756 372 578 993 1820 T2TOP5Raxial DCF 127 8756 372 481 993 1820 T2TOP6Rface DCF 135 9308 301 399 993 1820 T2TOP6Raxial DCF 135 9308 301 311 993 1820 T2TOP7Rface DCF 120 8274 412 993 1820 T2TOP7Raxial DCF 120 8274 993 1820 T2TOP8Rface DCF 138 9515 266 993 1820 T2TOP8Raxial DCF 138 9515 266 993 1820
I
Table 7 (cont) OREMET-WAH CHANG Ti - 6242Si Specimen List amp Data
BETA TRANSUS = 1845 degF = 1007 degC
SET B (Includes RT950209B 1 2 amp 3 21 22 23 1R through 13R 70H through 110H 180H amp 190H) (continued)
TYPE TEST amp LOG CYCLES VOLUME ROCKWELL C SOLUTION ANNEAL SAMPLE ID STRESS (KSI amp MPa) TO FAILURE PRIMARY ALPHA HARDNESS TEMPERATURE ( degC and degF)
T2TOP9Rface 993 1820 T2TOP9Raxial 993 1820 T2TOP1ORface 993 1820 T2TOP1ORaxial 993 1820 T2TOP11Rface 993 1820 T2TOP11Raxial 993 1820 T2TOP12Rface Creep 125 Creep 862 241 hours 993 1820 T2TOP12Raxial Creep 125 Creep 862 241 hours 993 1820 T2TOP13Rface Creep 133 Creep 917 241 hours 993 1820 T2TOP13Raxial Creep 133 Creep 917 241 hours 993 1820 T2TOP7OHface LCF 138 9515 387 T2TOP70Haxial LCF 138 9515 387 T2TOP8OHface LCF 130 8963 42 T2TOP80Haxial LCF 130 8963 42 T2TOP9OHface LCF 120 8274 477 T2TOP90Haxial LCF 120 8274 477 T2TOP100Hface LCF 110 7584 52 failed in grip T2TOP100Haxial LCF 110 7584 52 failed in grip T2TOP110Hface LCF 108 7446 519 failed in grip T2TOP110Haxial LCF 108 7446 519 failed in grip
T2TOP180Hface DCF 127 8756 388 203 333 T2TOP180Haxial DCF 127 8756 388 228 333 T2TOP19OH Defective Surface

2
An alpha-beta (a [3) alloy is one where a mixture of alpha and beta phases exists at
equilibrium usually room temperature [2] The near-a designation refers to an a+fi
composition containing less than three percent beta [3] and therefore is near the
aa+13 phase boundary [2] Two forms of alpha phase are typically present primary
alpha and transformed beta The primary alpha is that which remains in the alpha phase
throughout heat treatment Transformed beta is alpha phase which changes to beta
during heat treatment above the beta transus then returns to alpha upon cooling [3]
This alpha may emerge as acicular or lamellar serrated platelike or Widmanstatten in
appearance [3] Widmanstatten microstructure is described as coarse colonies of aligned
alpha platelets [2] Heat treatments are a means of adjusting the microstructure to
control the properties of alpha-beta alloys [2]
The microstructures most common for Ti-6242Si are a (primary a and transformed
13) + 13 and acicular a (Widmanstatten or basketweave) plus 13 The former is a
microstructure of equiaxed alpha phase (primary a) in a transformed beta matrix (Figl)
and is produced through heat treatment below the beta transus and slow cooling This
microstructure is referred to as a + 13 has good high temperature fatigue properties and
is a stable microstructure [4] Furnace cooling produces this coarse aligned alpha
structure which some have suggested is particularly sensitive to dwell cycle fatigue [5 6]
Heat treatment above the beta transus results in a Widmanstatten aligned acicular alpha
microstructure upon cooling (Fig 2) and is known to have good high temperature creep
properties [4] As the cooling rate from above the beta transus is increased the
transformed beta becomes finer and a basketweave microstructure is produced [7]
3
Figure 1 Alpha (primary a and transformed f3)+ Beta Microstructure
consisting of approximately 97 a and 3 13
(The above micrograph is of a Ti-6242Si specimen tested during this study)
4
2011m
Figure 2 Widmanstatten Microstructure
(The above micrograph is of a Ti-6242Si specimen tested during this study)
5
Basketweave microstructure is reported to be the least susceptible to dwell cycle fatigue
by simple virtue of a more tortuous crack propagation path but processing to attain it
is unreasonable in an industrial situation [6] The cooling rate from above the beta
transus therefore significantly affects the alloys mechanical properties by altering the
microstructure [1]
The objective of the present work was to confirm the existence of a dwell debit in
near-alpha Ti-6242Si produced by alphabeta processing and investigate the
effectiveness of solution anneal temperature changes in reducing this debit Solution
annealing allows for accurate and consistent temperature control in an industrial situation
as it is accomplished after thermomechanical processing the titanium in its largest form
Studying factors affecting dwell cycle fatigue life may also aid in the determination of the
fundamental mechanism of dwell fatigue
6
REVIEW OF LITERATURE
Dwell sensitivity can result in over an order of magnitude fewer cycles to failure and
was first reported by J Waisman et al in 1973 [8] Work has been continued by Evans
and coworkers Eylon and Hall [9] and Woodfield et al [5] Most studies have focused
on the titanium alloy IMI 685 or Ti-6-4 but the most recent works cite results of tests
using a number of titanium alloys including Ti-6242Si or exclusively Ti-6242Si
The mechanism leading to dwell sensitivity is still unresolved In 1979 Evans and
Gostelow [10] suggested that ambient temperature dwell sensitivity is due to time-
dependent plastic strain accumulation and that facet formation during creep
deformation is linked to the extensive facet formation present in dwell cycle fatigue
specimens [10]
Titanium alloys have the intrinsic property to creep at ambient temperature [11]
In 1984 Chu et at found that a dwell period leads to stress relaxation which has the
same effect as prior creep [11] Chus group also reported that multiple (fifty or more)
fatigue cycles between hold times actually results in a longer life when compared to low
cycle fatigue results The given explanation that prior creep increases the resistance of
the material through the delaying of fatigue damage (hardening) is contradictory to Evans
and Gostelow but Chu et al also reported that only one cycle between hold times did
HP Chu BA MacDonald and OP Arora Titanium Science and Technology Vol 4 Eds G Lutjering U Zwicker and W Bunk Proceedings of the 5th International Conference on Titanium Duetsche Gesellechat fiir Metallkunde EV Munich 1984 p 2395
7
not generate interaction between fatigue and prior creep during that investigation and a
reduction in fatigue life with the added strain-hold time was observed [11]
The microstructure of Ti-6242Si can be altered by changing the solution anneal
temperature below the beta transus (TO This affects the amounts of primary alpha and
transformed beta present and may affect the dwell sensitivity in two ways First the
amount of primary alpha which increases with decreasing solution anneal temperature
could change the strength of the alloy Second this would tend to alter plasticity and
perhaps affect the susceptibility to dwell effects according to the time-dependent
plasticity (creep) explanation
In 1988 Neal published a number of findings after performing low cycle and dwell
cycle fatigue tests on various titanium alloys including Ti-6242Si He explained the
presence of a dwell effect at temperatures below approximately 200deg C by means of
planar slip on or near the hcp basal plane (0001) and by creep-fatigue interactions at
temperatures above approximately 400deg C His explanation for the lack of dwell
sensitivity between these two temperatures is dynamic strain aging
Suri and coworkers reported in 1997 that extensive low temperature primary creep
in titanium alloys is clearly associated with extreme planar slip 2
2 S Suri T Neeraj GS Daehn DH Hou JM Scott RW Hayes and MJ Mills Materials Science and Engineering A234-236 1997 pp 996-999
8
Thiehsen et al reported in 1992 that raising the solution anneal temperature
increases both the primary and steady state high temperature creep resistance of Tishy
6242Si The beneficial effect may be derived from a combination of several sources
including the removal of such micrographic features as banding or texturing and
especially the altering or refining of the a or 13 microstructure 3
Hack and Leverent reported in 1982 that beta-processed near-alpha titanium alloys
with a large colony microstructure were found to be susceptible to internal hydrogen
embrittlement under conditions of sustained loading of fatigue cycling with a dwell
period at peak load 4 A colony is described as a cluster of acicular alpha grains aligned
in the same orientation [3] Their study found that both time-dependent deformation
and internal hydrogen are required for the embrittlement to occur Hydrogen
embrittlement occurs by localized increases in hydrogen content at the tips of long
blocked shear bands developed during time dependent plastic deformation [12] Fatigue
crack nucleation is a result of cyclic loading which causes to-and-fro slip to occur [13]
When this slip results persistent slip bands then extrusions and intrusions result Cracks
are thought to nucleate at intrusions [14] Woodfield et al presented results indicating
that thermomechanical processing can break up the aligned alpha colonies creating
randomly orientated primary alpha [5] Increasing the final solution anneal temperature
closer to the beta transus followed by quenching can not only alter the volume fraction
of primary alpha but may also decrease the possibility of any aligned alpha colonies
Reduction of susceptibility to DLCF may result through simply minimizing the volume
3 KE Thiehsen ME Kassner J Pollard DR Hiatt and B Bristow Metall Trans 24A 1993 p 1819 4 JE Hack and G R Leverant Metall Trans 13A 1982 p 1729
9
of the weaker alpha phase or by reducing the alpha colonies thought to be associated
with the facets linked to internal DLCF crack initiation [5]
Evans 1987 paper reports that his results do not support the shear band model and
in contrast suggests that there is an increase in life with hydrogen content [8] He also
states that once the cracks are formed though their growth is greatly influenced by
hydrogen concentration Previous work [6 10 12] has shown that times to failure for
creep and dwell tests with a five minute holding period per cycle are indistinguishable
Evans said that the mechanisms responsible for crack initiation are the same for creep
dwell and cyclic fatigue testing and that they probably involve time-dependent strain
accumulation
Neals findings that almost identical dwell effects were present at all levels of
hydrogen tested including a degassed material (lt10 ppm H2) were also in contrast to
those reported by Hack and Leverent In addition Neal stated that because both
alphabeta and beta heat treated structures exhibited dwell effects alloying composition
appeared the controlling factor Hack and Leverent suggested Ti-6242Si was not
susceptible to dwell effects even when beta heat treated 5 and that microstructural
features associated with the hydrogen embrittlement process are the key to DLCF in IMI
685 [12] Furthermore Neal found that the higher the stress the greater the percentage
cyclic life loss with a dwell period added [15]
5 DF Neal Sixth World Conference on Titanium Vol 1 Proceedings of the Sixth World Conference on Titanium Cannes 1988 p 175
10
EXPERIMENTAL PROCEDURE
Standard thermomechanical processing (TMP) was applied to 914 mm diameter
Ti-6242Si ingots which in turn were forged to approximately 238 mm diameter round
billets Five to six billets result from a single ingot Rectangular coupons were cut from
an ingot position designated billet with the long axis of the coupons radial to the long
axis of the billet and so that the specimen gage section would be at approximately the
mid-radius position
All specimens are identified by the heat number of the OREMET-WAH CHANG
production billet from which the sample coupons were extracted as well as by the
position designation along that billet (Fig 3) The beta transus for each billet was
determined by differential thermal analysis (DTA) The ingot chemical compositions are
presented in Table 1 and were determined by inductively coupled plasma atomic
emission spectroscopy (ICP) and gas analysis The specific processing steps follow
The ingot was heated initially to 1149deg C upset (set up on end which results in the
compression of the ingot to a specified amount) by approximately fifty percent and
forged to dimensions 813 mm x 1067 mm x L
This was followed by a forging to 737 mm square also after heating to 1149deg C and a
water quench
FIGURE 3 Flow Chart for TMP Ingot to Billet Conversion
Ingot Heat RT950209 914 mm initial diameter
Designated T1 737mm square = initial size Designated Bottom 737 nun square = initial size
Designated Tl T2 T3 T4 amp Bottom 610 mm square = initial size
11 T2 13 Bottom
Designated Tl T2 T3 T4 amp Bottom 286 mm rough round = initial size
1 2I I
5 billets 238 mm round = final size
Table 1 Ingot Compositions (wt )
Al Cr Fe Mo Ni Si Sn Zr C 0 N H
RT950209 Top 608 0003 0033 200 0007 009 201 418 0005 0107 0002 00044
Tp = 1007degC (DTA) Bottom 600 0002 0033 195 0007 009 196 409 0003 0104 0001 00047
-RT950483 Top 63 0002 0031 201 0008 009 202 417 0005 0133 0001
Tp = 1007degC (metall) Bottom 593 0002 003 194 0007 008 191 404 0006 013 0001 00060
-RT950522 Top 608 0001 0032 205 0001 008 199 412 0004 0127 0002
Tp -- 1007degC (metall) Bottom 599 0001 0033 196 0001 009 193 413 0009 0123 0003 00045
13
The alloy was then forged to 610 mm square after heating to 954deg C Next it was
heated to 1066deg C which is above the beta transus and held at that temperature for
two hours before water quenching
After heating to 968deg C and forging to 286 mm rough round the billet was
conditioned (cosmetic surface grinding) heated again to 968deg C and forged by rotary
forging machine to 238 mm round Solution annealing at 954deg C for two hours
forty-two minutes and air cooling followed
Finally the billet was annealed at 704deg C for six to nine hours air cooled and peeled
(descaled) The rectangular coupons were cut from the billet after this step
Solution heat treating of the coupons (To -3deg C to To -53deg C) for one hour followed
by an eight hour age as outlined in Table 2 preceded machining and surface treating
All solution heat treating machining and surface treating was completed by Metcut
Research Inc Dickson Testing Company Inc or a combination of both companies
The final specimens have an average gage diameter of 63 mm and a gage length of
19 mm All gage sections were peened using S-110 S-170 CW-14 or CW-33 shot to
0002 0008 A 100 to 400 coverage [16] Hardness testing was performed at
Oregon State University using the Rockwell C test
All tests fatigue and creep were performed using an 8521 Instron at Oregon State
University This Instron is a digitally controlled servohydraulic biaxial testing machine
with a maximum load capability of 20000 pounds The attached control panel allows for
precise monitoring general programming and rapid response times An additional
TABLE 2 HEAT TREATMENT TABLE FOR OREMET-WAH CHANG TI - 6242Si TEST SPECIMENS
BILLET HEAT IDENTIFICATION SAMPLE IDENTIFICATION
RT950483 RT950522 A 483 1 amp 2 and
A 522 1 amp 2 RT950209
A T2TOP1 through A T2TOP14 and Manila 2
RT950209 B T2TOP1 amp 2
RT950209 B T2TOP21 22 amp 23
RT950209 B T2TOP1R through 13R
RT950209 B T2TOP7OH through 200H
SOLUTION ANNEAL
979deg C + 14deg for 1 hr cool at 17deg C min + 3deg to below 538deg C
966deg C + 14deg for 1 hr cool at 17deg C min + 3deg to below 538deg C
954deg C for 1 hr cool at 17deg C min to 593deg C
1004deg C for 1 hr cool at 17deg C min to 593deg C
993deg C for 1 hr cool at 17deg C min+ 3deg to below 538deg C
Beta Transus exceeded Most samples returned untested
AGING
593deg C + 8deg for 8 hrs air cool
593deg C + 8deg for 8 hrs
air cool
hold at 593deg C for 5 hrs air cool
hold at 593deg C for 8 hrs air cool
593deg C + 8deg for 8 hrs air cool
593deg C + 8deg for 8 hrs air cool
PROCESSING LAB
Dickson Testing Company Inc
Metcut Research Inc (T2TOP1-14 Dickson Testing Company Inc
(Manila 2)
Metcut Research Inc
Metcut Research Inc
Dickson Testing Company Inc
Metcut Research Inc
15
computer with Labview software was used for more specific programming and data
collection during the creep tests
Prior to testing each specimen was cleaned with acetone then two strain gages were
mounted 180 degrees apart in the same position along the longitudinal axis of the gage
section Strain indicators wired to the gages were used to maintain zero strain on the
sample during installation into the grips on the Instron The Instron was programmed
to maintain zero load during this process This careful installation and alignment
procedure coupled with a grip designed to minimize possible bending stresses resulted
in highly reproducible results and minimum scatter (Fig 4)
The low cycle fatigue (LCF) testing cycle consisted of a two second loading period to
peak followed immediately by a two second unloading period back to zero load The
testing cycle for the dwell cycle fatigue tests also consisted of a two second loading to
peak load but was followed by a two minute hold time at that peak load before the two
second unloading to zero (Fig 5) All testing was performed at a stress ratio
R = 6 = 0 All values of stress and strain are reported as engineering stress and
strain
During the ambient temperature creep tests the Instron was programmed to
maintain a constant load for approximately twenty-four hours with the attached
computer monitoring and collecting strain data from the mounted strain gages The
loading time to the desired stress was sixty seconds
16
Figure 4 The Instron 8521 with Sample Loaded for a DCF Test
DWELL TIME LOW CYCLE FATIGUE
2 minute hold time6 + r--- 2 second loadunload time
LOW CYCLE FATIGUE
2 second loadunload time
6 +
Figure 5 DLCF and LCF Testing Profiles
_ -1
18
After testing axial and transverse sections were taken from specimens using a
diamond blade on a low speed saw then mounted in phenolic powder ground and
polished All polishing was accomplished using SiO2 suspension solution after grinding
on 320 400 and 600 grit silicon carbide grinding paper The samples were then etched
with a ten percent HF fifteen percent HNO3 and seventy-five percent H2O etchant
(Krolls reagent) for approximately three seconds Area fractions of primary alpha were
calculated using NIH Image Analysis computer software after scanning in micrographs
taken with an Olympus PME optical microscope
19
RESULTS
Figure 6 presents the results obtained through low cycle fatigue testing as well as
dwell cycle fatigue testing in the form of a stress versus log number of cycles to failure
plot The corresponding legend identifies each set of data the solution anneal
temperature for that set and the type of test (LCF or DLCF) Again Table 2 lists the
heat treatments for each set of Ti-6242Si specimens The plot of data in Figure 6 clearly
shows the reduction in the number of cycles to failure as a result of the added two
minute dwell period This reduction is by over an order of magnitude number of cycles
at the most elevated stresses decreasing to a factor of five at the lowest tested stresses
It is probable that the dwell cycle fatigue curves merge with the low cycle fatigue data line
at lower stresses than were tested during this investigation These results are generally
consistent with those published by Evans (Fig 7) [8] Micrographs illustrating the
typical microstructure (and volume percent primary alpha) developed by each solution
anneal temperature are pictured in Figures 8 through 14 It is clear that the dwell cycle
fatigue cycles to failure increase with increasing solution anneal temperature or
decreasing volume percent primary alpha Table 3 gives a summary of the average
primary alpha phase present and average hardness data for the associated solution anneal
temperatures
Figure 15 contains a plot of ambient temperature creep tests in the form of creep
strain versus time in seconds for a given engineering stress and expectedly displays
higher creep strains per unit of time with higher solution anneal temperatures Table 4
contains this creep strain data for each solution anneal temperature and tested stress
Figure 6 TI-6242Si Dwell amp Low Cycle Fatigue Data
1000
DCF LCF
950
900
73shy
2 co 850(i)
re
= 1007 degC
RT950209 Set A (T -41degC) DCF
RT950209Manila Set A (T3 -41deg) DCF
RT950209 Set A (T -41degc) LCF
To-41degC
Tp-14degC
800
RT950209 Set B (Tp -3degC) DCF
RT950209R Set B (T -14degC) DCF
750
O
X
RT950209R Set B (T -14degC) LCF
RT9502090H Set B (TD --Pc) LCF r X
test interrupted due to power failure
700
0 2 3
LOG CYCLES TO FAILURE
4 5 6
Figure 7 DLCF and LCF Results for IMI 685 as Reported by WJ Evans [13]
3 4
LOG CYCLES TO FAILURE N
2
I I
2011m
Figure 8 RT950209 Set B Sample T2TOP1 To -53deg C Axial Section
11
L__J L__J 2020
Figure 9 RT950209 Set A Sample T2TOP4 T13 -41deg C Transverse Section
20 pm 20microm
Figure 10 RT950522 Set A Sample 2 Tp -28deg C Transverse Section
L__1 20 1im
Figure 11 RT950483 Set A Sample 1 To -28deg C Transverse Section
1
20pm
Figure 12 RT950209 Set B Sample T2TOP6R To -14deg C Transverse Section
i
20pm
Figure 13 RT950209 Set B Sample T2TOP22 To 3deg C Transverse Section
20 pm L__I 20 pin
Figure 14 RT950209 Set B Sample T2TOP180H Unknown Solution Anneal Temperature Estimated Tp 8deg C Transverse Section
TABLE 3 SUMMARY OF AVERAGE PRIMARY ALPHA AND HARDNESS FOR EACH SOLUTION ANNEAL TEMPERATURE
Beta Transus = 1007deg C
SOLUTION ANNEAL AVERAGE PRIMARY AVERAGE ROCKWELL TEMPERATURE (degC) ALPHA PERCENTAGE HARDNESS (HRC)
954 650 no tests 966 630 276 979 544 302 993 442 no tests
Estimated 999 216 333 1004 54 315
Figure 15 Ti-6242S Creep Data (Ambient Temperature Constant Stress Tests at 917 and 862 MPa)
005
004 shy
c
ti)
2)U
003
002 constant stress 917 MPa
0
Solution Anneal Temperature 993 C
Solution Anneal Temperature 954 degC
000 0 20000
constant stress 862 MPa
40000 60000
Time (seconds)
80000 100000
TABLE 4 AMBIENT TEMPERATURE CREEP DATA FOR TI-6242Sil
Beta Transus = 1007deg C
MPa Solution Anneal cP at Final Load EP E P at E (S-1) at
Temperature ( 63 seconds ) ( 120 seconds ) ( 80 x 104 seconds ) ( 80 x 104 seconds )r
917 Tp -14deg C 00082 0010 0037 73 X 10-8
917 Tp -53deg C 00064 0008 0033 99 X10-8
862 Tp -14deg C 00011 0003 0012 26 x 10-8
862 Tp -53deg C 00005 0002 0010 26 x 1043
930 Tp -14deg C 00105 0013 0054 12 x 10-7
930 Tp -25deg C 00047 0006 0025 64 x 10-8
1 Two tests at 930 MPa failed during creep testing prior to 80 x 10 4 seconds
(A)
32
Tensile data as a function of solution anneal temperature for Ti-6242Si without
surface shot peening is presented in Table 5 As the solution anneal temperature is
increased above Tp -25deg C both the 02 offset yield strength and the ultimate tensile
strength decrease with further increases in temperature
1
TABLE 5 TENSILE PROPERTIES OF TI- 6242Si AS A FUNCTION OF SOLUTION ANNEAL TEMPERATURE ( Surfaces Not Shot Peened )
Beta Transus = 1007deg C
02 Average BILLET HEAT IDENTIFICATION Solution Anneal Yield Strength UTS El Hardness
SAMPLE IDENTIFICATION Temperature ( MPa ) ( MPa ) ( ) ( HRC ) RT950483 RT950522 A 483 1 amp 2 and To -28deg C 8894 9908 150 (2)1 295 (10)2
A 522 1 amp 2 9074 9935 150 (2) RT950209
A T2TOP1 through A T2TOP14 T -41deg C P
8798 9798 145 (2) 274 (45) and Manila 2
RT950209
B T2TOP1 amp 2 To -53deg C 8825 9722 160
RT950209 B T2TOP21 22 amp 23 To -3deg C 7895 9349 110 315 (10)
RT950209 B T2TOP1R through 13R T -14deg C
13 8260 9556 120
RT950209 Beta Transus possibly B T2TOP7OH through 200H exceeded Most samples
returned untested
Data provided by OREMET - WAH CHANG Number of tests
2 Number of tests per sample x number of samples tested
34
DISCUSSION
Chu et al Bania and Hall and Halls findings may correlate well with the greater
dwell cycle fatigue resistance of Ti-6242Si specimens annealed at higher solution anneal
temperatures and tested during this investigation [11 17 18] As mentioned previously
Chu and coworkers found that prior ambient temperature creep works to improve low
cycle fatigue life by a factor of two or more in Ti-62108 (also an alpha-beta alloy) as a
result of stable dislocation networks produced which delay the onset of fatigue damage
This team also reported that a dwell period at peak load in lieu of prior creep elicited the
same outcome with fifty or more cycles between hold periods but that only one cycle
between hold times resulted in a reduction in fatigue life As reported by Bania and Hall
and Hall alone the range of primary alpha content in Ti-6242Si will result in a minimum
creep rate change of a factor of at least two6 and the high temperature (510deg C) creep
rate is generally reduced as the volume fraction of equiaxed primary alpha is reduced
(increased solution anneal temperature) [17 18] Therefore the reduced dwell sensitivity
at lower volume percentages of primary a may be a function of a reduced creep rate and
not a result of easier crack propagation through the primary a phase
Since microstructure (varying volume percentages of primary a) was found to have
no significant effect on LCF life (Figure 6) this may be indicative of cyclic work
hardening of each microstructure to approximately the same load level during load
controlled tests
35
Referring to Table 4 and Figures 6 and 15 significant time-dependent plasticity occurs
at the higher stresses which are also associated with the greatest dwell sensitivity This
extra plasticity according to Chu et al and Hall delays the onset of fatigue cracking
[11 18] Again referring to Chu and coworkers findings it appears that small amounts
of initial monotonic deformation do not degrade the LCF properties Thus the effect
of the dwell may be that of repeated (cyclic) plasticity due to creep during the dwell
periods7
Subsequent research using the DLCF and LCF specimens tested during the present
investigation has shown that the DLCF specimens accumulated more plastic strain to
failure than the LCF specimens due to creep plasticity [19] Therefore the dwell may
simply increase the strain amplitude of a LCF test at a given stress resulting in a
decreased number of cycles to failure It was also shown that prior monotonic creep
strain comparable to that accumulated in DLCF specimens did not significantly degrade
LCF life [19] These results concur with those reported by Chu et al [11]
One possibly important point to note is that based on the tensile and hardness data
in Table 5 the tensile strength of Ti-6242Si is approximately independent of the solution
anneal temperature (or primary alpha content) up to approximately To-28deg C Above
6 PJ Bania and JA Hall Titanium Science and Technology Vol 4 Proceedings of the 5th International Conference on Titanium Munich 1984 p 2371
7 ME Kassner R Faber X Li Y Ge Y Kosaka SH Reichman and JA Hall TMS Conference 1998 to be published D Eylon RR Boyer and G Liitjering edsWarrendale 1999
36
this temperature the yield strength (YS) and ultimate tensile strength (UTS) decrease
with increasing solution anneal temperature The increased creep strain with increasing
solution anneal temperature experienced during the ambient temperature creep tests is
not then surprising This trend was also observed by Sun et al [20] High temperature
creep tests on this alloy reveal the opposite trend [21]
It appears that in the alpha-beta titanium alloys studied most of the fatigue life is
spent nucleating detectable cracks [18] as with most metals Thus bulk plasticity trends
associated with changes in dwell cycle fatigue and low cycle fatigue may be directly
related to crack nucleation Earlier work by Kansal et al suggests that with increased
primary alpha textured or aligned primary alpha becomes more obvious [22] Chu and
co-researchers studies showed that both creep and fatigue crack propagation did not
coincide with the a-13 interfaces but propagated transgranularly (through the grains)
across the a-13 colonies
Metallographic examination of a Ti-6242Si sample loaded to 876 MPa during DLCF
testing revealed that dwell cycle fatigue cracks exist in many locations away from the
principal crack and may not be associated with secondary cracks These cracks appear
to nucleate in the primary alpha phase and appear to propagate across (transgranularly)
the primary alpha grains [19] It does not appear that the cracking is associated with the
banding often associated with Ti-6242Si with higher volume percent primary alpha
[22 23 24] This banding could be associated with texture
37
CONCLUSIONS
Ambient temperature dwell and low cycle fatigue tests were performed on Ti-6ALshy
2Sn-4Zr-2Mo-01Si (Ti-6242Si) Specimens were solution annealed at various
temperatures below the beta transus to vary the volume fraction of primary alpha The
influence of the changes in primary alpha phase on dwell time low cycle fatigue (DLCF)
life were determined and compared to the conventional low cycle fatigue (LCF)
properties of the alloy It was concluded that
1 A dwell significantly decreased the number of cycles to failure
2 Increasing primary alpha associated with lower solution anneal temperatures
significantly increased susceptibility to dwell fatigue although this affect diminished
with decreasing stress
3 The above trends may be explained by ambient temperature cyclic creep of Tishy
6242Si
4 Increased susceptibility of higher primary alpha to dwell fatigue may be due to an
increased susceptibility of primary alpha to cracking during creep deformation
38
REFERENCES
1 C Andres L Wagner and G Liitjering Microstructure Pmper0 Relationships in Titanium Aluminaides and Alloys YW Kim and RR Boyer eds TMS Warrendale 1991 pp 579-586
2 EW Collings Physical Metallurgy of Titanium Alloys ASM Metals Park OH 1984
3 RR Boyer Titanium and Titanium Alloy Metals Handbook 9th Edition Vol7 ASM Metals Park OH 1982 pp 458-475
4 SL Semiatin JF Thomas Jr and PDadras MetalL Trans 14A 1983 pp 2363shy2374
5 AP Woodfield MD Gorman RR Corderman JA Sutliff and B Yamrom Titanium 95 Science and Technology CA Bienkinsop WJ Evans and HM Flower eds Institute of Materials Cambridge Univ Press 1996 pp 1116-1123
6 WJ Evans Second International Conference on Creep and Fracture of Engineering Materials and Structures Proceedings of the Second International Conference on Creep and Fracture of Engineering Materials and Structures Swansea 1984 p 395
7 DR Askeland The Science and Engineering of Materials 3rd Edition PWS Publishing Company Boston 1994
8 WJ Evans J Mater Sci Lett 6 1987 pp 571-574
9 D Eylon and JA Hall MetalL Trans 8A 1977 pp 981-990
10 WJ Evans and CR Gostelow MetalL Trans 10A 1979 pp 1837-1846
11 HP Chu BA MacDonald and OP Arora Titanium Science and Technology Vol 4 G Lutjering U Zwicker and W Bunk eds Proceedings of the 54 International Conference on Titanium Duetsche Gesellechat fur Metallkunde EV 1984 pp 2395-2402
12 JE Hack and GR Leverant MetalL Trans 13A 1982 pp 1729-1738
13 JA Bannantine JJ Corner JL Handrock Fundamentals of Metal Fatigue Analysis Prentice-Hall Englewood Cliffs NJ 1990
14 S Suresh Fatigue of Materials EA Davis IM Ward eds Cambridge University Press Cambridge 1992
15 DF Neal Sixth World Conference on Titanium Val Proceedings of the Sixth World Conference on Titanium Cannes 1988 pp 175-180
39
16 ASM Committee on Shot Peening Metals Handbook 9th Edition ASM Vol 5 1982 pp 138-149
17 PJ Bania and JA Hall Titanium Science and Technology Vol 4 Proceedings of the 5th International Conference on Titanium Munich 1984 pp 2371-2378
18 JA Hall Int J Fatigue Vol 19 Supp No 1 1997 pp S23-S37
19 ME Kassner R Faber X Li Y Ge Y Kosaka SH Reichman and JA Hall TMS Conference 1998 to be published D Eylon RR Boyer and G Liitjering eds TMS Warrendale 1999
20 S Suri T Neeraj GS Daehn DH Hou JM Scott RW Hayes and MJ Mills Materials Science and Eng A234-236 1997 pp 996-999
21 KE Thiehsen ME Kassner J Pollard DR Hiatt and BM Bristow Metall Trans 24A 1993 pp 1819-1826
22 U Kansal ME Kassner DR Hiatt and BM Bristow J Mater Eng and Pe 1 1992 pp 393-398
23 SL Semiatin and GD Lahoti Metall Trans 14A 1983 pp 105-115
24 SL Semiatin and GD Lahoti Metall Trans 14A 1983 pp 743-750
25 C Quesne C Duong F Charpentier JF Fries and P Lacombe Journal of the Less-Common Metals Vol 68 1979 pp 133-142
26 A Tahmassebi Khadem Assadi HM Flower DRF West MetTechnol Jan 1979 pp 16-23
27 WJ Evans and GF Harrison Journal of Materials Science 18 1983 pp 3449-3455
28 W Cho JW Jones JE Allison and WT Donlon Sixth World Conference on Titanium VoZ1 Proceedings of the Sixth World Conference on Titanium Cannes 1988 pp 187-192
29 T Bui-Quoc R Gomuc A Biron HL Nguyen RN Tadros Journal of Testing and Evaluation JTEVA Vol 18No 3 May 1990 pp 160- 171
30 WJ Evans and MR Bache Titanium 92 Science and Technology FH Froesand I Caplan eds TMS 1993 pp 1693-1699
31 WJ Evans and MR Bache Fatigue 16 1994 pp 443-453
32 D Eylon and CM Pierce Metall Trans 7A 1976 pp 111-121
40
33 NE Paton and MW Mahoney MetalL Trans 7A 1976 pp 1685-1689
41
APPENDIX
Figure 16 DCF LCF Creep Testing Sample Dimensions Specifications
Iii V000 PLAC2
reg 117100 1
310 1002 2 PLACeS2 PLACES
o4o401 Q IMAGES
lie 3 Cin DRILL 20 144tmt ofpit4 2 PLACES
11111311a211=1 lul 1111111)113000 Iof i 2110111011
25001005 WAS sky t aosGA 31 00 511
4 ease-750 es 01 s) El 001 2 PLACE
-20 31
masa ernowel -C0
114 shares 1 v mpe
Nur 111101114 WELDILC1 301t 11496 401S1111111 All Al map5 aIP-F C3-1114G OmiCi AolMent -601 Al fC10
pADIu 1r e41C 3LCTIDN TO bLEN0WonT1L WITHOUT UN DCA C1J1
3 IWin] or41112wISE ZrZellhen liemovt ALLeuaqs 4 ZmARP toast WITH 055 kaospAosus OR cHDPsrail 2-TAG Gt 4013113- 202 I- mum comvornA 1ta 401511S-VIO CLshy
15o I-Jaatori 2 PLACtS NOTE
gaming Oa4614S-NO
11117014 ltdi Cato 50
TA DLTA I L 41111104e
1111111111114011111VISICgems ft 111 01010011 watat wage 4110
sraclutN b4 cymmoot ICAO 4AM50Cliel ep 47 Cr ELAo GUI r
nv toorit to lic8 07482 (7113115 -702P 111429e11 114111 par pup
inrit 4s SO 1 ia
1
43
Figure 17 DCF Sampling Preparation and Testing Outline
Dwell Fatigue Testing of Billet
Sampling Specimens for fatigue tests shall be taken at top middle and bottom locations at least two diameter lengths from billet ends Two specimens are required at each location Specimen orientation shallbe radial with the gage centered approximately at the midradiusposition
Sample material provided for the alternate crystallographic structureanalysis shall be a single heat treated transverse slice from each of the billet locations listed above
Specimen Preparation Sara ogre-14 )Sample material shall be solution treated at 50degF below the _bear C c cfF
transus temperature plusmn 25degF for 1 hour Cool at 30 plusmn 5degFmin to below 1000degF Age 8 hours a 1100 plusmn 15degF
Test bats shall have a nominal gage diameter of 25 inches and gagelength of 75 inches Gage area shall be peened using S-110 5-170 CW14 or CW33 shot to 002 - 008A Coverage 100 to 400
(sample specimen drawing can be added if helpful)
Test Conditions Bars shall be dwell LCF tested to failure in load control Reportcycles to failure
Temperature Room temperature A-ratio 9 - 10 Peak Stress 126 KS) Cyclic Rate 2 minute dwell at peak stressLoad and Unloading Rate 1 - 3 seconds
Figure 18 Plot of Set A and Metcut Research Inc Dwell Cycle Fatigue Data
DWELL CYCLE FATIGUE DATA (OSU amp METCUT) 150
140
-4+0
130 shy= 1845deg F
AAACI RT950209Manila (Dickson T - 75degF 597 volume Primary aHRC278) 114shy
RT950209 Set A (Metcut T - 75degF 662 volume Primary a (avgvalue)HRC240)
O RT950483 (Ladish T - 50degF 518 volume Primary a (avgvalue)HRC303) 120 shy
O RT950522 (Ladish T - 50degF 617 volume Primary aHRC265)
RT950522 1 (Ladish T 50degF 617 volume Primary aHRC265) TEST INTERRUPTED
A Metcut Tested RT950209 (Metcut T - 45deg F)
Metcut Tested RT950209 (Metcut T - 75degF)
110
0 1 2 3 4 5
LOG CYCLES
1100
Figure 19 Ti-6242Si Heat RT950209 Solution Anneal Temperatures vs UTS
1050
a o
Vl cu
1000
950
900 shy
850
950 960 970 980 990
Solution Anneal Temperature (deg C)
1000 1010 1020
Table 6 OREMET-WAH CHANG TI - 6242Si Specimen List amp Data
BETA TRANSUS = 1845deg F = 1007degC
SET A (Includes RT950209 samples T2TOP1 through T2TOP14 RT950209Manila RT950483 amp RT950522)
TYPE TEST amp LOG CYCLES VOLUME ROCKWELL C SOLUTION ANNEAL SAMPLE ID STRESS (KSI amp MPa) TO FAILURE PRIMARY ALPHA HARDNESS TEMPERATURE ( degC and degF )
T2TOPlface DCF 135 9308 291 682 259 966 1770 T2TOP1axial DCF 135 9308 291 634 259 966 1770 T2TOP2face DCF 134 9239 302 693 297 966 1770 T2TOP2axial DCF 134 9239 302 63 297 966 1770 T2TOP 4face DCF 138 9515 259 655 254 966 1770 T2TOP 5face DCF 137 9446 264 642 288 966 1770 T2TOP 5axial DCF 137 9446 264 589 288 966 1770 T2TOP 6face DCF 130 8963 307 666 271 966 1770 T2TOP 6axial DCF 130 8963 307 617 271 966 1770 T2TOP 7face DCF 127 8756 331 648 293 966 1770 T2TOP 8face DCF 120 8274 412 639 207 966 1770 T2TOP 8axial DCF 120 8274 412 626 207 966 1770 T2TOP 9face DCF 124 8550 360 563 336 966 1770 T2TOP 9axial DCF 124 8550 360 569 336 966 1770 T2TOP10 LCF 138 9515 388 966 1770 T2TOP11 LCF 130 8963 407 966 1770 T2TOP12 LCF 120 8274 482 966 1770 T2TOP13 DCF 119 8205 419 966 1770 T2TOP14 LCF 115 7929 499 966 1770 MANILA 2face DCF 135 9308 278 597 278 966 1770
RT950483 1face DCF 135 9308 337 539 271 979 1795 RT9504831axial DCF 135 9308 337 450 271 979 1795 RT950483 2face DCF 135 9308 339 497 335 979 1795
RT950522 1face DCF 135 9308 322 TEST INTERRUPTED 619 337 979 1795 RT950522 2face DCF 135 9308 330 617 265 979 1795
Table 7 OREMET-WAH CHANG Ti - 6242Si Specimen List amp Data (cont)
BETA TRANSUS = 1845deg F = 1007deg C
SET B (Includes RT950209B 1 2 amp 3 21 22 23 1R through 13R 70H through 110H 180H amp 190H)
TYPE TEST amp LOG CYCLES VOLUME ROCKWELL C SOLUTION ANNEAL SAMPLE ID STRESS (KSI amp MPa) TO FAILURE PRIMARY ALPHA HARDNESS TEMPERATURE ( degC and degF)
T2TOPlface Creep 133 Creep 917 241 hours 641 954 1750 T2TOP1axial Creep 133 Creep 917 241 hours 640 954 1750 T2TOP2face Creep 125 Creep 862 241 hours 681 954 1750 T2TOP2axial Creep 125 Creep 862 241 hours 691 954 1750 T2TOP3 954 1750 T2TOP21face DCF 135 9308 333 416 345 1004 1840 T2TOP21axial DCF 135 9308 333 1104 345 1004 1840---T2TOP22face DCF 127 8756 367 Test 153 1004 1840 T2TOP22axial DCF 127 8756 367 Interrupted 501 1004 1840 T2TOP23face DCF 120 8274 420 521 285 1004 1840 T2TOP23axial DCF 120 8274 420 285 1004 1840 T2TOP1Rface LCF 110 7584 523 993 1820 T2TOP1Raxial LCF 110 7584 523 993 1820 T2TOP2Rface LCF 138 9515 361 993 1820 T2TOP2Raxial LCF 138 9515 361 993 1820 T2TOP3R nonconforming sample used as dummy for creep tests 993 1820 T2TOP4Rface LCF 135 9308 377 993 1820 T2TOP4Raxial LCF 135 9308 377 993 1820 T2TOP5Rface DCF 127 8756 372 578 993 1820 T2TOP5Raxial DCF 127 8756 372 481 993 1820 T2TOP6Rface DCF 135 9308 301 399 993 1820 T2TOP6Raxial DCF 135 9308 301 311 993 1820 T2TOP7Rface DCF 120 8274 412 993 1820 T2TOP7Raxial DCF 120 8274 993 1820 T2TOP8Rface DCF 138 9515 266 993 1820 T2TOP8Raxial DCF 138 9515 266 993 1820
I
Table 7 (cont) OREMET-WAH CHANG Ti - 6242Si Specimen List amp Data
BETA TRANSUS = 1845 degF = 1007 degC
SET B (Includes RT950209B 1 2 amp 3 21 22 23 1R through 13R 70H through 110H 180H amp 190H) (continued)
TYPE TEST amp LOG CYCLES VOLUME ROCKWELL C SOLUTION ANNEAL SAMPLE ID STRESS (KSI amp MPa) TO FAILURE PRIMARY ALPHA HARDNESS TEMPERATURE ( degC and degF)
T2TOP9Rface 993 1820 T2TOP9Raxial 993 1820 T2TOP1ORface 993 1820 T2TOP1ORaxial 993 1820 T2TOP11Rface 993 1820 T2TOP11Raxial 993 1820 T2TOP12Rface Creep 125 Creep 862 241 hours 993 1820 T2TOP12Raxial Creep 125 Creep 862 241 hours 993 1820 T2TOP13Rface Creep 133 Creep 917 241 hours 993 1820 T2TOP13Raxial Creep 133 Creep 917 241 hours 993 1820 T2TOP7OHface LCF 138 9515 387 T2TOP70Haxial LCF 138 9515 387 T2TOP8OHface LCF 130 8963 42 T2TOP80Haxial LCF 130 8963 42 T2TOP9OHface LCF 120 8274 477 T2TOP90Haxial LCF 120 8274 477 T2TOP100Hface LCF 110 7584 52 failed in grip T2TOP100Haxial LCF 110 7584 52 failed in grip T2TOP110Hface LCF 108 7446 519 failed in grip T2TOP110Haxial LCF 108 7446 519 failed in grip
T2TOP180Hface DCF 127 8756 388 203 333 T2TOP180Haxial DCF 127 8756 388 228 333 T2TOP19OH Defective Surface
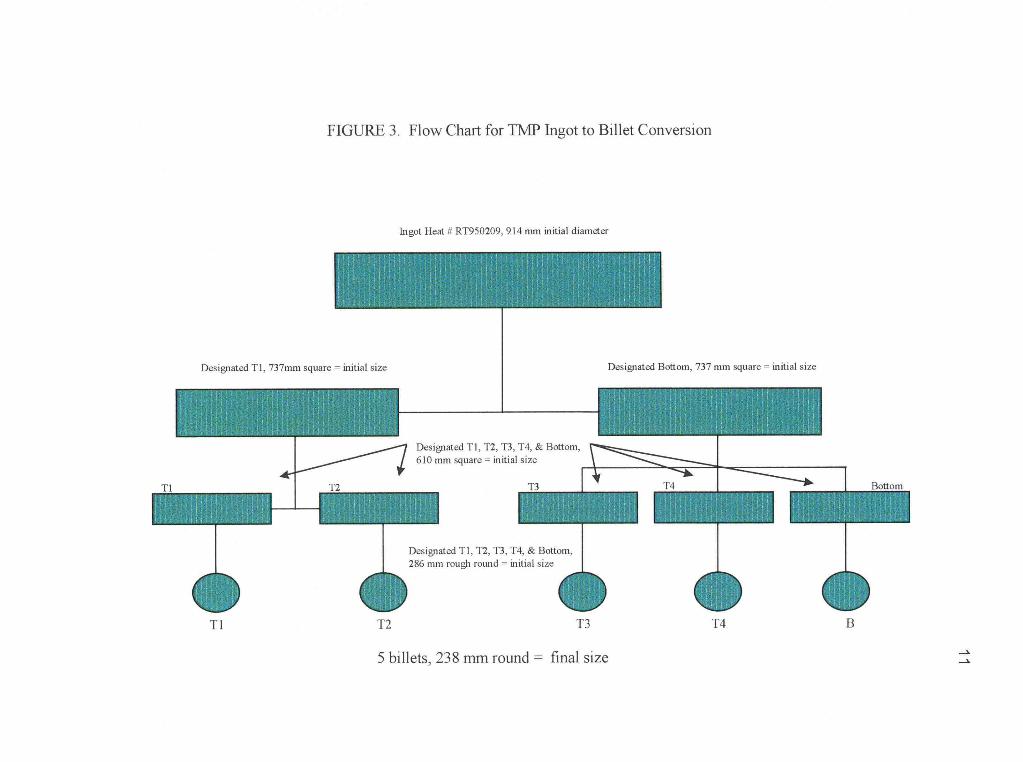

1
20pm
Figure 12 RT950209 Set B Sample T2TOP6R To -14deg C Transverse Section
i
20pm
Figure 13 RT950209 Set B Sample T2TOP22 To 3deg C Transverse Section
20 pm L__I 20 pin
Figure 14 RT950209 Set B Sample T2TOP180H Unknown Solution Anneal Temperature Estimated Tp 8deg C Transverse Section
TABLE 3 SUMMARY OF AVERAGE PRIMARY ALPHA AND HARDNESS FOR EACH SOLUTION ANNEAL TEMPERATURE
Beta Transus = 1007deg C
SOLUTION ANNEAL AVERAGE PRIMARY AVERAGE ROCKWELL TEMPERATURE (degC) ALPHA PERCENTAGE HARDNESS (HRC)
954 650 no tests 966 630 276 979 544 302 993 442 no tests
Estimated 999 216 333 1004 54 315
Figure 15 Ti-6242S Creep Data (Ambient Temperature Constant Stress Tests at 917 and 862 MPa)
005
004 shy
c
ti)
2)U
003
002 constant stress 917 MPa
0
Solution Anneal Temperature 993 C
Solution Anneal Temperature 954 degC
000 0 20000
constant stress 862 MPa
40000 60000
Time (seconds)
80000 100000
TABLE 4 AMBIENT TEMPERATURE CREEP DATA FOR TI-6242Sil
Beta Transus = 1007deg C
MPa Solution Anneal cP at Final Load EP E P at E (S-1) at
Temperature ( 63 seconds ) ( 120 seconds ) ( 80 x 104 seconds ) ( 80 x 104 seconds )r
917 Tp -14deg C 00082 0010 0037 73 X 10-8
917 Tp -53deg C 00064 0008 0033 99 X10-8
862 Tp -14deg C 00011 0003 0012 26 x 10-8
862 Tp -53deg C 00005 0002 0010 26 x 1043
930 Tp -14deg C 00105 0013 0054 12 x 10-7
930 Tp -25deg C 00047 0006 0025 64 x 10-8
1 Two tests at 930 MPa failed during creep testing prior to 80 x 10 4 seconds
(A)
32
Tensile data as a function of solution anneal temperature for Ti-6242Si without
surface shot peening is presented in Table 5 As the solution anneal temperature is
increased above Tp -25deg C both the 02 offset yield strength and the ultimate tensile
strength decrease with further increases in temperature
1
TABLE 5 TENSILE PROPERTIES OF TI- 6242Si AS A FUNCTION OF SOLUTION ANNEAL TEMPERATURE ( Surfaces Not Shot Peened )
Beta Transus = 1007deg C
02 Average BILLET HEAT IDENTIFICATION Solution Anneal Yield Strength UTS El Hardness
SAMPLE IDENTIFICATION Temperature ( MPa ) ( MPa ) ( ) ( HRC ) RT950483 RT950522 A 483 1 amp 2 and To -28deg C 8894 9908 150 (2)1 295 (10)2
A 522 1 amp 2 9074 9935 150 (2) RT950209
A T2TOP1 through A T2TOP14 T -41deg C P
8798 9798 145 (2) 274 (45) and Manila 2
RT950209
B T2TOP1 amp 2 To -53deg C 8825 9722 160
RT950209 B T2TOP21 22 amp 23 To -3deg C 7895 9349 110 315 (10)
RT950209 B T2TOP1R through 13R T -14deg C
13 8260 9556 120
RT950209 Beta Transus possibly B T2TOP7OH through 200H exceeded Most samples
returned untested
Data provided by OREMET - WAH CHANG Number of tests
2 Number of tests per sample x number of samples tested
34
DISCUSSION
Chu et al Bania and Hall and Halls findings may correlate well with the greater
dwell cycle fatigue resistance of Ti-6242Si specimens annealed at higher solution anneal
temperatures and tested during this investigation [11 17 18] As mentioned previously
Chu and coworkers found that prior ambient temperature creep works to improve low
cycle fatigue life by a factor of two or more in Ti-62108 (also an alpha-beta alloy) as a
result of stable dislocation networks produced which delay the onset of fatigue damage
This team also reported that a dwell period at peak load in lieu of prior creep elicited the
same outcome with fifty or more cycles between hold periods but that only one cycle
between hold times resulted in a reduction in fatigue life As reported by Bania and Hall
and Hall alone the range of primary alpha content in Ti-6242Si will result in a minimum
creep rate change of a factor of at least two6 and the high temperature (510deg C) creep
rate is generally reduced as the volume fraction of equiaxed primary alpha is reduced
(increased solution anneal temperature) [17 18] Therefore the reduced dwell sensitivity
at lower volume percentages of primary a may be a function of a reduced creep rate and
not a result of easier crack propagation through the primary a phase
Since microstructure (varying volume percentages of primary a) was found to have
no significant effect on LCF life (Figure 6) this may be indicative of cyclic work
hardening of each microstructure to approximately the same load level during load
controlled tests
35
Referring to Table 4 and Figures 6 and 15 significant time-dependent plasticity occurs
at the higher stresses which are also associated with the greatest dwell sensitivity This
extra plasticity according to Chu et al and Hall delays the onset of fatigue cracking
[11 18] Again referring to Chu and coworkers findings it appears that small amounts
of initial monotonic deformation do not degrade the LCF properties Thus the effect
of the dwell may be that of repeated (cyclic) plasticity due to creep during the dwell
periods7
Subsequent research using the DLCF and LCF specimens tested during the present
investigation has shown that the DLCF specimens accumulated more plastic strain to
failure than the LCF specimens due to creep plasticity [19] Therefore the dwell may
simply increase the strain amplitude of a LCF test at a given stress resulting in a
decreased number of cycles to failure It was also shown that prior monotonic creep
strain comparable to that accumulated in DLCF specimens did not significantly degrade
LCF life [19] These results concur with those reported by Chu et al [11]
One possibly important point to note is that based on the tensile and hardness data
in Table 5 the tensile strength of Ti-6242Si is approximately independent of the solution
anneal temperature (or primary alpha content) up to approximately To-28deg C Above
6 PJ Bania and JA Hall Titanium Science and Technology Vol 4 Proceedings of the 5th International Conference on Titanium Munich 1984 p 2371
7 ME Kassner R Faber X Li Y Ge Y Kosaka SH Reichman and JA Hall TMS Conference 1998 to be published D Eylon RR Boyer and G Liitjering edsWarrendale 1999
36
this temperature the yield strength (YS) and ultimate tensile strength (UTS) decrease
with increasing solution anneal temperature The increased creep strain with increasing
solution anneal temperature experienced during the ambient temperature creep tests is
not then surprising This trend was also observed by Sun et al [20] High temperature
creep tests on this alloy reveal the opposite trend [21]
It appears that in the alpha-beta titanium alloys studied most of the fatigue life is
spent nucleating detectable cracks [18] as with most metals Thus bulk plasticity trends
associated with changes in dwell cycle fatigue and low cycle fatigue may be directly
related to crack nucleation Earlier work by Kansal et al suggests that with increased
primary alpha textured or aligned primary alpha becomes more obvious [22] Chu and
co-researchers studies showed that both creep and fatigue crack propagation did not
coincide with the a-13 interfaces but propagated transgranularly (through the grains)
across the a-13 colonies
Metallographic examination of a Ti-6242Si sample loaded to 876 MPa during DLCF
testing revealed that dwell cycle fatigue cracks exist in many locations away from the
principal crack and may not be associated with secondary cracks These cracks appear
to nucleate in the primary alpha phase and appear to propagate across (transgranularly)
the primary alpha grains [19] It does not appear that the cracking is associated with the
banding often associated with Ti-6242Si with higher volume percent primary alpha
[22 23 24] This banding could be associated with texture
37
CONCLUSIONS
Ambient temperature dwell and low cycle fatigue tests were performed on Ti-6ALshy
2Sn-4Zr-2Mo-01Si (Ti-6242Si) Specimens were solution annealed at various
temperatures below the beta transus to vary the volume fraction of primary alpha The
influence of the changes in primary alpha phase on dwell time low cycle fatigue (DLCF)
life were determined and compared to the conventional low cycle fatigue (LCF)
properties of the alloy It was concluded that
1 A dwell significantly decreased the number of cycles to failure
2 Increasing primary alpha associated with lower solution anneal temperatures
significantly increased susceptibility to dwell fatigue although this affect diminished
with decreasing stress
3 The above trends may be explained by ambient temperature cyclic creep of Tishy
6242Si
4 Increased susceptibility of higher primary alpha to dwell fatigue may be due to an
increased susceptibility of primary alpha to cracking during creep deformation
38
REFERENCES
1 C Andres L Wagner and G Liitjering Microstructure Pmper0 Relationships in Titanium Aluminaides and Alloys YW Kim and RR Boyer eds TMS Warrendale 1991 pp 579-586
2 EW Collings Physical Metallurgy of Titanium Alloys ASM Metals Park OH 1984
3 RR Boyer Titanium and Titanium Alloy Metals Handbook 9th Edition Vol7 ASM Metals Park OH 1982 pp 458-475
4 SL Semiatin JF Thomas Jr and PDadras MetalL Trans 14A 1983 pp 2363shy2374
5 AP Woodfield MD Gorman RR Corderman JA Sutliff and B Yamrom Titanium 95 Science and Technology CA Bienkinsop WJ Evans and HM Flower eds Institute of Materials Cambridge Univ Press 1996 pp 1116-1123
6 WJ Evans Second International Conference on Creep and Fracture of Engineering Materials and Structures Proceedings of the Second International Conference on Creep and Fracture of Engineering Materials and Structures Swansea 1984 p 395
7 DR Askeland The Science and Engineering of Materials 3rd Edition PWS Publishing Company Boston 1994
8 WJ Evans J Mater Sci Lett 6 1987 pp 571-574
9 D Eylon and JA Hall MetalL Trans 8A 1977 pp 981-990
10 WJ Evans and CR Gostelow MetalL Trans 10A 1979 pp 1837-1846
11 HP Chu BA MacDonald and OP Arora Titanium Science and Technology Vol 4 G Lutjering U Zwicker and W Bunk eds Proceedings of the 54 International Conference on Titanium Duetsche Gesellechat fur Metallkunde EV 1984 pp 2395-2402
12 JE Hack and GR Leverant MetalL Trans 13A 1982 pp 1729-1738
13 JA Bannantine JJ Corner JL Handrock Fundamentals of Metal Fatigue Analysis Prentice-Hall Englewood Cliffs NJ 1990
14 S Suresh Fatigue of Materials EA Davis IM Ward eds Cambridge University Press Cambridge 1992
15 DF Neal Sixth World Conference on Titanium Val Proceedings of the Sixth World Conference on Titanium Cannes 1988 pp 175-180
39
16 ASM Committee on Shot Peening Metals Handbook 9th Edition ASM Vol 5 1982 pp 138-149
17 PJ Bania and JA Hall Titanium Science and Technology Vol 4 Proceedings of the 5th International Conference on Titanium Munich 1984 pp 2371-2378
18 JA Hall Int J Fatigue Vol 19 Supp No 1 1997 pp S23-S37
19 ME Kassner R Faber X Li Y Ge Y Kosaka SH Reichman and JA Hall TMS Conference 1998 to be published D Eylon RR Boyer and G Liitjering eds TMS Warrendale 1999
20 S Suri T Neeraj GS Daehn DH Hou JM Scott RW Hayes and MJ Mills Materials Science and Eng A234-236 1997 pp 996-999
21 KE Thiehsen ME Kassner J Pollard DR Hiatt and BM Bristow Metall Trans 24A 1993 pp 1819-1826
22 U Kansal ME Kassner DR Hiatt and BM Bristow J Mater Eng and Pe 1 1992 pp 393-398
23 SL Semiatin and GD Lahoti Metall Trans 14A 1983 pp 105-115
24 SL Semiatin and GD Lahoti Metall Trans 14A 1983 pp 743-750
25 C Quesne C Duong F Charpentier JF Fries and P Lacombe Journal of the Less-Common Metals Vol 68 1979 pp 133-142
26 A Tahmassebi Khadem Assadi HM Flower DRF West MetTechnol Jan 1979 pp 16-23
27 WJ Evans and GF Harrison Journal of Materials Science 18 1983 pp 3449-3455
28 W Cho JW Jones JE Allison and WT Donlon Sixth World Conference on Titanium VoZ1 Proceedings of the Sixth World Conference on Titanium Cannes 1988 pp 187-192
29 T Bui-Quoc R Gomuc A Biron HL Nguyen RN Tadros Journal of Testing and Evaluation JTEVA Vol 18No 3 May 1990 pp 160- 171
30 WJ Evans and MR Bache Titanium 92 Science and Technology FH Froesand I Caplan eds TMS 1993 pp 1693-1699
31 WJ Evans and MR Bache Fatigue 16 1994 pp 443-453
32 D Eylon and CM Pierce Metall Trans 7A 1976 pp 111-121
40
33 NE Paton and MW Mahoney MetalL Trans 7A 1976 pp 1685-1689
41
APPENDIX
Figure 16 DCF LCF Creep Testing Sample Dimensions Specifications
Iii V000 PLAC2
reg 117100 1
310 1002 2 PLACeS2 PLACES
o4o401 Q IMAGES
lie 3 Cin DRILL 20 144tmt ofpit4 2 PLACES
11111311a211=1 lul 1111111)113000 Iof i 2110111011
25001005 WAS sky t aosGA 31 00 511
4 ease-750 es 01 s) El 001 2 PLACE
-20 31
masa ernowel -C0
114 shares 1 v mpe
Nur 111101114 WELDILC1 301t 11496 401S1111111 All Al map5 aIP-F C3-1114G OmiCi AolMent -601 Al fC10
pADIu 1r e41C 3LCTIDN TO bLEN0WonT1L WITHOUT UN DCA C1J1
3 IWin] or41112wISE ZrZellhen liemovt ALLeuaqs 4 ZmARP toast WITH 055 kaospAosus OR cHDPsrail 2-TAG Gt 4013113- 202 I- mum comvornA 1ta 401511S-VIO CLshy
15o I-Jaatori 2 PLACtS NOTE
gaming Oa4614S-NO
11117014 ltdi Cato 50
TA DLTA I L 41111104e
1111111111114011111VISICgems ft 111 01010011 watat wage 4110
sraclutN b4 cymmoot ICAO 4AM50Cliel ep 47 Cr ELAo GUI r
nv toorit to lic8 07482 (7113115 -702P 111429e11 114111 par pup
inrit 4s SO 1 ia
1
43
Figure 17 DCF Sampling Preparation and Testing Outline
Dwell Fatigue Testing of Billet
Sampling Specimens for fatigue tests shall be taken at top middle and bottom locations at least two diameter lengths from billet ends Two specimens are required at each location Specimen orientation shallbe radial with the gage centered approximately at the midradiusposition
Sample material provided for the alternate crystallographic structureanalysis shall be a single heat treated transverse slice from each of the billet locations listed above
Specimen Preparation Sara ogre-14 )Sample material shall be solution treated at 50degF below the _bear C c cfF
transus temperature plusmn 25degF for 1 hour Cool at 30 plusmn 5degFmin to below 1000degF Age 8 hours a 1100 plusmn 15degF
Test bats shall have a nominal gage diameter of 25 inches and gagelength of 75 inches Gage area shall be peened using S-110 5-170 CW14 or CW33 shot to 002 - 008A Coverage 100 to 400
(sample specimen drawing can be added if helpful)
Test Conditions Bars shall be dwell LCF tested to failure in load control Reportcycles to failure
Temperature Room temperature A-ratio 9 - 10 Peak Stress 126 KS) Cyclic Rate 2 minute dwell at peak stressLoad and Unloading Rate 1 - 3 seconds
Figure 18 Plot of Set A and Metcut Research Inc Dwell Cycle Fatigue Data
DWELL CYCLE FATIGUE DATA (OSU amp METCUT) 150
140
-4+0
130 shy= 1845deg F
AAACI RT950209Manila (Dickson T - 75degF 597 volume Primary aHRC278) 114shy
RT950209 Set A (Metcut T - 75degF 662 volume Primary a (avgvalue)HRC240)
O RT950483 (Ladish T - 50degF 518 volume Primary a (avgvalue)HRC303) 120 shy
O RT950522 (Ladish T - 50degF 617 volume Primary aHRC265)
RT950522 1 (Ladish T 50degF 617 volume Primary aHRC265) TEST INTERRUPTED
A Metcut Tested RT950209 (Metcut T - 45deg F)
Metcut Tested RT950209 (Metcut T - 75degF)
110
0 1 2 3 4 5
LOG CYCLES
1100
Figure 19 Ti-6242Si Heat RT950209 Solution Anneal Temperatures vs UTS
1050
a o
Vl cu
1000
950
900 shy
850
950 960 970 980 990
Solution Anneal Temperature (deg C)
1000 1010 1020
Table 6 OREMET-WAH CHANG TI - 6242Si Specimen List amp Data
BETA TRANSUS = 1845deg F = 1007degC
SET A (Includes RT950209 samples T2TOP1 through T2TOP14 RT950209Manila RT950483 amp RT950522)
TYPE TEST amp LOG CYCLES VOLUME ROCKWELL C SOLUTION ANNEAL SAMPLE ID STRESS (KSI amp MPa) TO FAILURE PRIMARY ALPHA HARDNESS TEMPERATURE ( degC and degF )
T2TOPlface DCF 135 9308 291 682 259 966 1770 T2TOP1axial DCF 135 9308 291 634 259 966 1770 T2TOP2face DCF 134 9239 302 693 297 966 1770 T2TOP2axial DCF 134 9239 302 63 297 966 1770 T2TOP 4face DCF 138 9515 259 655 254 966 1770 T2TOP 5face DCF 137 9446 264 642 288 966 1770 T2TOP 5axial DCF 137 9446 264 589 288 966 1770 T2TOP 6face DCF 130 8963 307 666 271 966 1770 T2TOP 6axial DCF 130 8963 307 617 271 966 1770 T2TOP 7face DCF 127 8756 331 648 293 966 1770 T2TOP 8face DCF 120 8274 412 639 207 966 1770 T2TOP 8axial DCF 120 8274 412 626 207 966 1770 T2TOP 9face DCF 124 8550 360 563 336 966 1770 T2TOP 9axial DCF 124 8550 360 569 336 966 1770 T2TOP10 LCF 138 9515 388 966 1770 T2TOP11 LCF 130 8963 407 966 1770 T2TOP12 LCF 120 8274 482 966 1770 T2TOP13 DCF 119 8205 419 966 1770 T2TOP14 LCF 115 7929 499 966 1770 MANILA 2face DCF 135 9308 278 597 278 966 1770
RT950483 1face DCF 135 9308 337 539 271 979 1795 RT9504831axial DCF 135 9308 337 450 271 979 1795 RT950483 2face DCF 135 9308 339 497 335 979 1795
RT950522 1face DCF 135 9308 322 TEST INTERRUPTED 619 337 979 1795 RT950522 2face DCF 135 9308 330 617 265 979 1795
Table 7 OREMET-WAH CHANG Ti - 6242Si Specimen List amp Data (cont)
BETA TRANSUS = 1845deg F = 1007deg C
SET B (Includes RT950209B 1 2 amp 3 21 22 23 1R through 13R 70H through 110H 180H amp 190H)
TYPE TEST amp LOG CYCLES VOLUME ROCKWELL C SOLUTION ANNEAL SAMPLE ID STRESS (KSI amp MPa) TO FAILURE PRIMARY ALPHA HARDNESS TEMPERATURE ( degC and degF)
T2TOPlface Creep 133 Creep 917 241 hours 641 954 1750 T2TOP1axial Creep 133 Creep 917 241 hours 640 954 1750 T2TOP2face Creep 125 Creep 862 241 hours 681 954 1750 T2TOP2axial Creep 125 Creep 862 241 hours 691 954 1750 T2TOP3 954 1750 T2TOP21face DCF 135 9308 333 416 345 1004 1840 T2TOP21axial DCF 135 9308 333 1104 345 1004 1840---T2TOP22face DCF 127 8756 367 Test 153 1004 1840 T2TOP22axial DCF 127 8756 367 Interrupted 501 1004 1840 T2TOP23face DCF 120 8274 420 521 285 1004 1840 T2TOP23axial DCF 120 8274 420 285 1004 1840 T2TOP1Rface LCF 110 7584 523 993 1820 T2TOP1Raxial LCF 110 7584 523 993 1820 T2TOP2Rface LCF 138 9515 361 993 1820 T2TOP2Raxial LCF 138 9515 361 993 1820 T2TOP3R nonconforming sample used as dummy for creep tests 993 1820 T2TOP4Rface LCF 135 9308 377 993 1820 T2TOP4Raxial LCF 135 9308 377 993 1820 T2TOP5Rface DCF 127 8756 372 578 993 1820 T2TOP5Raxial DCF 127 8756 372 481 993 1820 T2TOP6Rface DCF 135 9308 301 399 993 1820 T2TOP6Raxial DCF 135 9308 301 311 993 1820 T2TOP7Rface DCF 120 8274 412 993 1820 T2TOP7Raxial DCF 120 8274 993 1820 T2TOP8Rface DCF 138 9515 266 993 1820 T2TOP8Raxial DCF 138 9515 266 993 1820
I
Table 7 (cont) OREMET-WAH CHANG Ti - 6242Si Specimen List amp Data
BETA TRANSUS = 1845 degF = 1007 degC
SET B (Includes RT950209B 1 2 amp 3 21 22 23 1R through 13R 70H through 110H 180H amp 190H) (continued)
TYPE TEST amp LOG CYCLES VOLUME ROCKWELL C SOLUTION ANNEAL SAMPLE ID STRESS (KSI amp MPa) TO FAILURE PRIMARY ALPHA HARDNESS TEMPERATURE ( degC and degF)
T2TOP9Rface 993 1820 T2TOP9Raxial 993 1820 T2TOP1ORface 993 1820 T2TOP1ORaxial 993 1820 T2TOP11Rface 993 1820 T2TOP11Raxial 993 1820 T2TOP12Rface Creep 125 Creep 862 241 hours 993 1820 T2TOP12Raxial Creep 125 Creep 862 241 hours 993 1820 T2TOP13Rface Creep 133 Creep 917 241 hours 993 1820 T2TOP13Raxial Creep 133 Creep 917 241 hours 993 1820 T2TOP7OHface LCF 138 9515 387 T2TOP70Haxial LCF 138 9515 387 T2TOP8OHface LCF 130 8963 42 T2TOP80Haxial LCF 130 8963 42 T2TOP9OHface LCF 120 8274 477 T2TOP90Haxial LCF 120 8274 477 T2TOP100Hface LCF 110 7584 52 failed in grip T2TOP100Haxial LCF 110 7584 52 failed in grip T2TOP110Hface LCF 108 7446 519 failed in grip T2TOP110Haxial LCF 108 7446 519 failed in grip
T2TOP180Hface DCF 127 8756 388 203 333 T2TOP180Haxial DCF 127 8756 388 228 333 T2TOP19OH Defective Surface

1
TABLE 5 TENSILE PROPERTIES OF TI- 6242Si AS A FUNCTION OF SOLUTION ANNEAL TEMPERATURE ( Surfaces Not Shot Peened )
Beta Transus = 1007deg C
02 Average BILLET HEAT IDENTIFICATION Solution Anneal Yield Strength UTS El Hardness
SAMPLE IDENTIFICATION Temperature ( MPa ) ( MPa ) ( ) ( HRC ) RT950483 RT950522 A 483 1 amp 2 and To -28deg C 8894 9908 150 (2)1 295 (10)2
A 522 1 amp 2 9074 9935 150 (2) RT950209
A T2TOP1 through A T2TOP14 T -41deg C P
8798 9798 145 (2) 274 (45) and Manila 2
RT950209
B T2TOP1 amp 2 To -53deg C 8825 9722 160
RT950209 B T2TOP21 22 amp 23 To -3deg C 7895 9349 110 315 (10)
RT950209 B T2TOP1R through 13R T -14deg C
13 8260 9556 120
RT950209 Beta Transus possibly B T2TOP7OH through 200H exceeded Most samples
returned untested
Data provided by OREMET - WAH CHANG Number of tests
2 Number of tests per sample x number of samples tested
34
DISCUSSION
Chu et al Bania and Hall and Halls findings may correlate well with the greater
dwell cycle fatigue resistance of Ti-6242Si specimens annealed at higher solution anneal
temperatures and tested during this investigation [11 17 18] As mentioned previously
Chu and coworkers found that prior ambient temperature creep works to improve low
cycle fatigue life by a factor of two or more in Ti-62108 (also an alpha-beta alloy) as a
result of stable dislocation networks produced which delay the onset of fatigue damage
This team also reported that a dwell period at peak load in lieu of prior creep elicited the
same outcome with fifty or more cycles between hold periods but that only one cycle
between hold times resulted in a reduction in fatigue life As reported by Bania and Hall
and Hall alone the range of primary alpha content in Ti-6242Si will result in a minimum
creep rate change of a factor of at least two6 and the high temperature (510deg C) creep
rate is generally reduced as the volume fraction of equiaxed primary alpha is reduced
(increased solution anneal temperature) [17 18] Therefore the reduced dwell sensitivity
at lower volume percentages of primary a may be a function of a reduced creep rate and
not a result of easier crack propagation through the primary a phase
Since microstructure (varying volume percentages of primary a) was found to have
no significant effect on LCF life (Figure 6) this may be indicative of cyclic work
hardening of each microstructure to approximately the same load level during load
controlled tests
35
Referring to Table 4 and Figures 6 and 15 significant time-dependent plasticity occurs
at the higher stresses which are also associated with the greatest dwell sensitivity This
extra plasticity according to Chu et al and Hall delays the onset of fatigue cracking
[11 18] Again referring to Chu and coworkers findings it appears that small amounts
of initial monotonic deformation do not degrade the LCF properties Thus the effect
of the dwell may be that of repeated (cyclic) plasticity due to creep during the dwell
periods7
Subsequent research using the DLCF and LCF specimens tested during the present
investigation has shown that the DLCF specimens accumulated more plastic strain to
failure than the LCF specimens due to creep plasticity [19] Therefore the dwell may
simply increase the strain amplitude of a LCF test at a given stress resulting in a
decreased number of cycles to failure It was also shown that prior monotonic creep
strain comparable to that accumulated in DLCF specimens did not significantly degrade
LCF life [19] These results concur with those reported by Chu et al [11]
One possibly important point to note is that based on the tensile and hardness data
in Table 5 the tensile strength of Ti-6242Si is approximately independent of the solution
anneal temperature (or primary alpha content) up to approximately To-28deg C Above
6 PJ Bania and JA Hall Titanium Science and Technology Vol 4 Proceedings of the 5th International Conference on Titanium Munich 1984 p 2371
7 ME Kassner R Faber X Li Y Ge Y Kosaka SH Reichman and JA Hall TMS Conference 1998 to be published D Eylon RR Boyer and G Liitjering edsWarrendale 1999
36
this temperature the yield strength (YS) and ultimate tensile strength (UTS) decrease
with increasing solution anneal temperature The increased creep strain with increasing
solution anneal temperature experienced during the ambient temperature creep tests is
not then surprising This trend was also observed by Sun et al [20] High temperature
creep tests on this alloy reveal the opposite trend [21]
It appears that in the alpha-beta titanium alloys studied most of the fatigue life is
spent nucleating detectable cracks [18] as with most metals Thus bulk plasticity trends
associated with changes in dwell cycle fatigue and low cycle fatigue may be directly
related to crack nucleation Earlier work by Kansal et al suggests that with increased
primary alpha textured or aligned primary alpha becomes more obvious [22] Chu and
co-researchers studies showed that both creep and fatigue crack propagation did not
coincide with the a-13 interfaces but propagated transgranularly (through the grains)
across the a-13 colonies
Metallographic examination of a Ti-6242Si sample loaded to 876 MPa during DLCF
testing revealed that dwell cycle fatigue cracks exist in many locations away from the
principal crack and may not be associated with secondary cracks These cracks appear
to nucleate in the primary alpha phase and appear to propagate across (transgranularly)
the primary alpha grains [19] It does not appear that the cracking is associated with the
banding often associated with Ti-6242Si with higher volume percent primary alpha
[22 23 24] This banding could be associated with texture
37
CONCLUSIONS
Ambient temperature dwell and low cycle fatigue tests were performed on Ti-6ALshy
2Sn-4Zr-2Mo-01Si (Ti-6242Si) Specimens were solution annealed at various
temperatures below the beta transus to vary the volume fraction of primary alpha The
influence of the changes in primary alpha phase on dwell time low cycle fatigue (DLCF)
life were determined and compared to the conventional low cycle fatigue (LCF)
properties of the alloy It was concluded that
1 A dwell significantly decreased the number of cycles to failure
2 Increasing primary alpha associated with lower solution anneal temperatures
significantly increased susceptibility to dwell fatigue although this affect diminished
with decreasing stress
3 The above trends may be explained by ambient temperature cyclic creep of Tishy
6242Si
4 Increased susceptibility of higher primary alpha to dwell fatigue may be due to an
increased susceptibility of primary alpha to cracking during creep deformation
38
REFERENCES
1 C Andres L Wagner and G Liitjering Microstructure Pmper0 Relationships in Titanium Aluminaides and Alloys YW Kim and RR Boyer eds TMS Warrendale 1991 pp 579-586
2 EW Collings Physical Metallurgy of Titanium Alloys ASM Metals Park OH 1984
3 RR Boyer Titanium and Titanium Alloy Metals Handbook 9th Edition Vol7 ASM Metals Park OH 1982 pp 458-475
4 SL Semiatin JF Thomas Jr and PDadras MetalL Trans 14A 1983 pp 2363shy2374
5 AP Woodfield MD Gorman RR Corderman JA Sutliff and B Yamrom Titanium 95 Science and Technology CA Bienkinsop WJ Evans and HM Flower eds Institute of Materials Cambridge Univ Press 1996 pp 1116-1123
6 WJ Evans Second International Conference on Creep and Fracture of Engineering Materials and Structures Proceedings of the Second International Conference on Creep and Fracture of Engineering Materials and Structures Swansea 1984 p 395
7 DR Askeland The Science and Engineering of Materials 3rd Edition PWS Publishing Company Boston 1994
8 WJ Evans J Mater Sci Lett 6 1987 pp 571-574
9 D Eylon and JA Hall MetalL Trans 8A 1977 pp 981-990
10 WJ Evans and CR Gostelow MetalL Trans 10A 1979 pp 1837-1846
11 HP Chu BA MacDonald and OP Arora Titanium Science and Technology Vol 4 G Lutjering U Zwicker and W Bunk eds Proceedings of the 54 International Conference on Titanium Duetsche Gesellechat fur Metallkunde EV 1984 pp 2395-2402
12 JE Hack and GR Leverant MetalL Trans 13A 1982 pp 1729-1738
13 JA Bannantine JJ Corner JL Handrock Fundamentals of Metal Fatigue Analysis Prentice-Hall Englewood Cliffs NJ 1990
14 S Suresh Fatigue of Materials EA Davis IM Ward eds Cambridge University Press Cambridge 1992
15 DF Neal Sixth World Conference on Titanium Val Proceedings of the Sixth World Conference on Titanium Cannes 1988 pp 175-180
39
16 ASM Committee on Shot Peening Metals Handbook 9th Edition ASM Vol 5 1982 pp 138-149
17 PJ Bania and JA Hall Titanium Science and Technology Vol 4 Proceedings of the 5th International Conference on Titanium Munich 1984 pp 2371-2378
18 JA Hall Int J Fatigue Vol 19 Supp No 1 1997 pp S23-S37
19 ME Kassner R Faber X Li Y Ge Y Kosaka SH Reichman and JA Hall TMS Conference 1998 to be published D Eylon RR Boyer and G Liitjering eds TMS Warrendale 1999
20 S Suri T Neeraj GS Daehn DH Hou JM Scott RW Hayes and MJ Mills Materials Science and Eng A234-236 1997 pp 996-999
21 KE Thiehsen ME Kassner J Pollard DR Hiatt and BM Bristow Metall Trans 24A 1993 pp 1819-1826
22 U Kansal ME Kassner DR Hiatt and BM Bristow J Mater Eng and Pe 1 1992 pp 393-398
23 SL Semiatin and GD Lahoti Metall Trans 14A 1983 pp 105-115
24 SL Semiatin and GD Lahoti Metall Trans 14A 1983 pp 743-750
25 C Quesne C Duong F Charpentier JF Fries and P Lacombe Journal of the Less-Common Metals Vol 68 1979 pp 133-142
26 A Tahmassebi Khadem Assadi HM Flower DRF West MetTechnol Jan 1979 pp 16-23
27 WJ Evans and GF Harrison Journal of Materials Science 18 1983 pp 3449-3455
28 W Cho JW Jones JE Allison and WT Donlon Sixth World Conference on Titanium VoZ1 Proceedings of the Sixth World Conference on Titanium Cannes 1988 pp 187-192
29 T Bui-Quoc R Gomuc A Biron HL Nguyen RN Tadros Journal of Testing and Evaluation JTEVA Vol 18No 3 May 1990 pp 160- 171
30 WJ Evans and MR Bache Titanium 92 Science and Technology FH Froesand I Caplan eds TMS 1993 pp 1693-1699
31 WJ Evans and MR Bache Fatigue 16 1994 pp 443-453
32 D Eylon and CM Pierce Metall Trans 7A 1976 pp 111-121
40
33 NE Paton and MW Mahoney MetalL Trans 7A 1976 pp 1685-1689
41
APPENDIX
Figure 16 DCF LCF Creep Testing Sample Dimensions Specifications
Iii V000 PLAC2
reg 117100 1
310 1002 2 PLACeS2 PLACES
o4o401 Q IMAGES
lie 3 Cin DRILL 20 144tmt ofpit4 2 PLACES
11111311a211=1 lul 1111111)113000 Iof i 2110111011
25001005 WAS sky t aosGA 31 00 511
4 ease-750 es 01 s) El 001 2 PLACE
-20 31
masa ernowel -C0
114 shares 1 v mpe
Nur 111101114 WELDILC1 301t 11496 401S1111111 All Al map5 aIP-F C3-1114G OmiCi AolMent -601 Al fC10
pADIu 1r e41C 3LCTIDN TO bLEN0WonT1L WITHOUT UN DCA C1J1
3 IWin] or41112wISE ZrZellhen liemovt ALLeuaqs 4 ZmARP toast WITH 055 kaospAosus OR cHDPsrail 2-TAG Gt 4013113- 202 I- mum comvornA 1ta 401511S-VIO CLshy
15o I-Jaatori 2 PLACtS NOTE
gaming Oa4614S-NO
11117014 ltdi Cato 50
TA DLTA I L 41111104e
1111111111114011111VISICgems ft 111 01010011 watat wage 4110
sraclutN b4 cymmoot ICAO 4AM50Cliel ep 47 Cr ELAo GUI r
nv toorit to lic8 07482 (7113115 -702P 111429e11 114111 par pup
inrit 4s SO 1 ia
1
43
Figure 17 DCF Sampling Preparation and Testing Outline
Dwell Fatigue Testing of Billet
Sampling Specimens for fatigue tests shall be taken at top middle and bottom locations at least two diameter lengths from billet ends Two specimens are required at each location Specimen orientation shallbe radial with the gage centered approximately at the midradiusposition
Sample material provided for the alternate crystallographic structureanalysis shall be a single heat treated transverse slice from each of the billet locations listed above
Specimen Preparation Sara ogre-14 )Sample material shall be solution treated at 50degF below the _bear C c cfF
transus temperature plusmn 25degF for 1 hour Cool at 30 plusmn 5degFmin to below 1000degF Age 8 hours a 1100 plusmn 15degF
Test bats shall have a nominal gage diameter of 25 inches and gagelength of 75 inches Gage area shall be peened using S-110 5-170 CW14 or CW33 shot to 002 - 008A Coverage 100 to 400
(sample specimen drawing can be added if helpful)
Test Conditions Bars shall be dwell LCF tested to failure in load control Reportcycles to failure
Temperature Room temperature A-ratio 9 - 10 Peak Stress 126 KS) Cyclic Rate 2 minute dwell at peak stressLoad and Unloading Rate 1 - 3 seconds
Figure 18 Plot of Set A and Metcut Research Inc Dwell Cycle Fatigue Data
DWELL CYCLE FATIGUE DATA (OSU amp METCUT) 150
140
-4+0
130 shy= 1845deg F
AAACI RT950209Manila (Dickson T - 75degF 597 volume Primary aHRC278) 114shy
RT950209 Set A (Metcut T - 75degF 662 volume Primary a (avgvalue)HRC240)
O RT950483 (Ladish T - 50degF 518 volume Primary a (avgvalue)HRC303) 120 shy
O RT950522 (Ladish T - 50degF 617 volume Primary aHRC265)
RT950522 1 (Ladish T 50degF 617 volume Primary aHRC265) TEST INTERRUPTED
A Metcut Tested RT950209 (Metcut T - 45deg F)
Metcut Tested RT950209 (Metcut T - 75degF)
110
0 1 2 3 4 5
LOG CYCLES
1100
Figure 19 Ti-6242Si Heat RT950209 Solution Anneal Temperatures vs UTS
1050
a o
Vl cu
1000
950
900 shy
850
950 960 970 980 990
Solution Anneal Temperature (deg C)
1000 1010 1020
Table 6 OREMET-WAH CHANG TI - 6242Si Specimen List amp Data
BETA TRANSUS = 1845deg F = 1007degC
SET A (Includes RT950209 samples T2TOP1 through T2TOP14 RT950209Manila RT950483 amp RT950522)
TYPE TEST amp LOG CYCLES VOLUME ROCKWELL C SOLUTION ANNEAL SAMPLE ID STRESS (KSI amp MPa) TO FAILURE PRIMARY ALPHA HARDNESS TEMPERATURE ( degC and degF )
T2TOPlface DCF 135 9308 291 682 259 966 1770 T2TOP1axial DCF 135 9308 291 634 259 966 1770 T2TOP2face DCF 134 9239 302 693 297 966 1770 T2TOP2axial DCF 134 9239 302 63 297 966 1770 T2TOP 4face DCF 138 9515 259 655 254 966 1770 T2TOP 5face DCF 137 9446 264 642 288 966 1770 T2TOP 5axial DCF 137 9446 264 589 288 966 1770 T2TOP 6face DCF 130 8963 307 666 271 966 1770 T2TOP 6axial DCF 130 8963 307 617 271 966 1770 T2TOP 7face DCF 127 8756 331 648 293 966 1770 T2TOP 8face DCF 120 8274 412 639 207 966 1770 T2TOP 8axial DCF 120 8274 412 626 207 966 1770 T2TOP 9face DCF 124 8550 360 563 336 966 1770 T2TOP 9axial DCF 124 8550 360 569 336 966 1770 T2TOP10 LCF 138 9515 388 966 1770 T2TOP11 LCF 130 8963 407 966 1770 T2TOP12 LCF 120 8274 482 966 1770 T2TOP13 DCF 119 8205 419 966 1770 T2TOP14 LCF 115 7929 499 966 1770 MANILA 2face DCF 135 9308 278 597 278 966 1770
RT950483 1face DCF 135 9308 337 539 271 979 1795 RT9504831axial DCF 135 9308 337 450 271 979 1795 RT950483 2face DCF 135 9308 339 497 335 979 1795
RT950522 1face DCF 135 9308 322 TEST INTERRUPTED 619 337 979 1795 RT950522 2face DCF 135 9308 330 617 265 979 1795
Table 7 OREMET-WAH CHANG Ti - 6242Si Specimen List amp Data (cont)
BETA TRANSUS = 1845deg F = 1007deg C
SET B (Includes RT950209B 1 2 amp 3 21 22 23 1R through 13R 70H through 110H 180H amp 190H)
TYPE TEST amp LOG CYCLES VOLUME ROCKWELL C SOLUTION ANNEAL SAMPLE ID STRESS (KSI amp MPa) TO FAILURE PRIMARY ALPHA HARDNESS TEMPERATURE ( degC and degF)
T2TOPlface Creep 133 Creep 917 241 hours 641 954 1750 T2TOP1axial Creep 133 Creep 917 241 hours 640 954 1750 T2TOP2face Creep 125 Creep 862 241 hours 681 954 1750 T2TOP2axial Creep 125 Creep 862 241 hours 691 954 1750 T2TOP3 954 1750 T2TOP21face DCF 135 9308 333 416 345 1004 1840 T2TOP21axial DCF 135 9308 333 1104 345 1004 1840---T2TOP22face DCF 127 8756 367 Test 153 1004 1840 T2TOP22axial DCF 127 8756 367 Interrupted 501 1004 1840 T2TOP23face DCF 120 8274 420 521 285 1004 1840 T2TOP23axial DCF 120 8274 420 285 1004 1840 T2TOP1Rface LCF 110 7584 523 993 1820 T2TOP1Raxial LCF 110 7584 523 993 1820 T2TOP2Rface LCF 138 9515 361 993 1820 T2TOP2Raxial LCF 138 9515 361 993 1820 T2TOP3R nonconforming sample used as dummy for creep tests 993 1820 T2TOP4Rface LCF 135 9308 377 993 1820 T2TOP4Raxial LCF 135 9308 377 993 1820 T2TOP5Rface DCF 127 8756 372 578 993 1820 T2TOP5Raxial DCF 127 8756 372 481 993 1820 T2TOP6Rface DCF 135 9308 301 399 993 1820 T2TOP6Raxial DCF 135 9308 301 311 993 1820 T2TOP7Rface DCF 120 8274 412 993 1820 T2TOP7Raxial DCF 120 8274 993 1820 T2TOP8Rface DCF 138 9515 266 993 1820 T2TOP8Raxial DCF 138 9515 266 993 1820
I
Table 7 (cont) OREMET-WAH CHANG Ti - 6242Si Specimen List amp Data
BETA TRANSUS = 1845 degF = 1007 degC
SET B (Includes RT950209B 1 2 amp 3 21 22 23 1R through 13R 70H through 110H 180H amp 190H) (continued)
TYPE TEST amp LOG CYCLES VOLUME ROCKWELL C SOLUTION ANNEAL SAMPLE ID STRESS (KSI amp MPa) TO FAILURE PRIMARY ALPHA HARDNESS TEMPERATURE ( degC and degF)
T2TOP9Rface 993 1820 T2TOP9Raxial 993 1820 T2TOP1ORface 993 1820 T2TOP1ORaxial 993 1820 T2TOP11Rface 993 1820 T2TOP11Raxial 993 1820 T2TOP12Rface Creep 125 Creep 862 241 hours 993 1820 T2TOP12Raxial Creep 125 Creep 862 241 hours 993 1820 T2TOP13Rface Creep 133 Creep 917 241 hours 993 1820 T2TOP13Raxial Creep 133 Creep 917 241 hours 993 1820 T2TOP7OHface LCF 138 9515 387 T2TOP70Haxial LCF 138 9515 387 T2TOP8OHface LCF 130 8963 42 T2TOP80Haxial LCF 130 8963 42 T2TOP9OHface LCF 120 8274 477 T2TOP90Haxial LCF 120 8274 477 T2TOP100Hface LCF 110 7584 52 failed in grip T2TOP100Haxial LCF 110 7584 52 failed in grip T2TOP110Hface LCF 108 7446 519 failed in grip T2TOP110Haxial LCF 108 7446 519 failed in grip
T2TOP180Hface DCF 127 8756 388 203 333 T2TOP180Haxial DCF 127 8756 388 228 333 T2TOP19OH Defective Surface