Embed Size (px)
Citation preview

Entry Strategy into Green Construction for Mahindra EPC
Team: Rebel YellCampus Name: IIM BangaloreNaveen K. Poddar – 1211278 ([email protected]) -2nd Year Rohit Jaiswal – 1211293 ([email protected]) -2nd YearShrey Sahay – 1211294([email protected]) -2nd YearVivek – 1211315([email protected]) -2nd Year

Approach to the Problem
Market dynamics Competitive landscape Macro-economic outlook
Regulatory environment
Internal assets / Technology
Internal SWOT Identified strategic risk areas
Summary and conclusions
Market opportunity description
Market entry strategy
Strategic directions
PricingBrand and communication
Sales and distribution
Products and servicesCustomer serviceLaunch phasing
Market analysis
Tactical launch plan
Vision and MissionObjectives
Overall StrategyPositioning
Value propositionBrand
Target segments
Execution of Market Entry
Approach Market Analysis Target Segment Competition Macroeconomics Regulations VRIO Risks Summary

Market AnalysisMarket Assessment
• The market for LEED-rated green buildings in India is projected to increase to €3.7 billion by 2012
• The total market for green building materials and equipment in India is estimated to be more than 10 times the size of the LEED-rated green building market in India.
• India’s green building footprint has grown from 20,000 sq. ft. in 2005, to projects covering 914.33 million sq. ft. by end-2011
• The projected market potential for green building material and technologies is estimated to be €73.4 billion by the year 2012.
According to IGBC: India has 1297 registered buildings, 201 certified buildings and 914.33 million sq.
ft. of green building footprint. This puts India firmly on the 2nd spot only behind the U.S in total green
building footprint.
Green Buildings in India
Growth of Green Buildings in India Source: IGBC
The graph shows the tremendous rise in the green buildings with a rapid growth rate in the recent years in India
Financial Benefits1. Reduced capital costs2. Lower operating and maintenance costs3. Reduced risks and liabilities
Environmental Benefits1. Less impact on the natural environment2. Healthy environments and improved productivity
Social Benefits1. Stronger social networks2. Increased environmental awareness
Benefits of Green Development
Green Buildings make good business sense !!!
Market Transformation and huge growth- WHY?
Sharp decline in green building material costs
Incremental cost of a commercial green building 3-5 % while a green home incremental cost 1 %,
The additional costs gets paid back within an attractive span of 3 to 4 years with substantial reduction in operational costs.
Market potential for green building products & technologies would be about USD 100 Billion by 2015 for
India
Material Cost in INR- 2003 Cost in INR-2011
Waterless Urinals 15,000 per unit 6,000 per unit
CO2 Sensors 50,000 per unit 20,000 per unit
Certified Wood 2,500 per cu. ft. 1,600 per cu. ft.
High Performance Glass 500 per sq. ft. 350 per q. ft.
High Albedo Materials 90 per sq. ft. 60 per sq. ft.
Approach Market Analysis Target Segment Competition Macroeconomics Regulations VRIO Risks Summary

Target Segment- Factory Buildings In India
FACTORY BUILDINGS SEGMENT• As per the Central Statistics Office and the National
Sample Survey Office, the total number of estimated factories in India in 2010-11 stood at 2.1 lakh.
• This was 33.2% higher than a year ago. • The highest number of factories was seen in
• Food products• Other non-metallic mineral products and• Textile sectors.
2.74%
97.26%
Share of Factory Buildings
Public Sector Private Sector
Source: Statistics of factories ,2009
20%
10%
10%60%
Share of Factory Buildings
Food Products & Beverages Other Non-Metallic mineral rpoducts TextileOthers
Source: Statistics of factories ,2009
Green Factories in India: Why is it important? Factory related pollution is the number one source of pollution
and energy consumption in the World Most of the manufacturing factories consume vast quantities of
fresh water to carry away wastes of several different types. Factory pollution includes carbon monoxide, which is mainly
produced in combustion processes Factory pollution includes CFCs, which have been shown to
destroy the ozone layer
This clearly shows the huge negative impact of buildings, especially factory buildings on our
environment.
Material Conservation
Energy Conservation
Water Conservation
Site Selection
and Planning
Indoor environment
Quality
Innovation
Aspects of a Green FactoryGreen Factory Certification System
Measures prior to 2010 Management indicator After 2010
Preventing Global Warming
Energy-saving measures for reducing CO2
CO2 emissions (per unit of production)
Integrating each Approach and Aiming for
comprehensively environmentally friendly factories
Supporting a recycling-oriented society
Zero waste activities Waste discharged externally
Final disposal rate of waste discharged externally
Reducing the risk of chemical substances
Reduction of atmospheric emissions of volatile organic compounds (VOCs)
Atmospheric emissions of volatile organic compounds (VOCs)
Contribution of Buildings in India:
Total Energy Use 25-40%
Solid Waste generation 30-40%
Global Green House gas emission 30-40%
Approach Market Analysis Target Segment Competition Macroeconomics Regulations VRIO Risks Summary

Competitive Landscape Mahindra EPC is currently present in the Solar EPC Market
SOLAR EPC LANDSCAPE
DOMESTIC PLAYERS The three biggest domestic Solar EPC Players include Mahindra Solar, Larsen and Toubro,
and Sterling & WilsonINTERNATIONAL PLAYERS
International players like Juwi, Martifer, and Conergy are entering the sector due to its burgeoning opportunities
JOINT VENTURES The major joint ventures in India include Enfinity-Titan, Vikramsolar-Proener, and
Greenforce-Gehrlicher Solar.
Price competitiveness and quality regarded as the most sought after advantages of EPC services.
Value-added services and vertically integrated businesses are less important, but still register as competitive advantages
Other EPC construction firms which may prove potential threat in future by entering into green construction segment
But, they would primarily outsource or rely on partnerships to start which Mahindra EPC can leverage by being 1st mover
OTHER EPC PLAYERS- POTENTIAL FUTURE THREATS
JP ASSOCIATESJP associate is a flagship company of Jaypee group. JP associates is one of the prominent business unit in EPC sector in India and has been in the civil engineering construction sector for past 4 decades as a turnkey project company mainly deals in mega hydro projects, construction and transportations.
LANCO INFRATECHThis Company has a powerful EPC work profile mainly in the sector of power, solar and infrastructure. Company has completed a number of thermal and power projects including Solar Energy.
IVRCLIVRCL is top Engineering, procurement and Construction Company which executes various types of projects such as civil construction, power, irrigation, industrial structure and mining. IVRCL has a long client list which includes top government sector companies like ONGC, BHEL, Power grid corporation of India, IOCL.
TATA PROJECTSTata Projects established in the year 1979 is a part of the prestigious Tata Group. It is amongst best EPC companies in India, which delivers the project on time without compromising quality.
Approach Market Analysis Target Segment Competition Macroeconomics Regulations VRIO Risks Summary

Competitive LandscapeMajor Real Estate Developers’ Energy Efficiency Activities
CONCLUSION
We can say that: The penetration into the green
factory is low There is a demand-supply gap The competitive landscape is
ideal for the market entry into this segment.
Supply
•The past few years has seen a substantial increase in the number of contractors and builders but still the supply is low
•LOW
Demand
•Demand exceeds supply by a large margin
•HIGH
Barriers to entry
•NO entry barriers for existing developers in offering green solutions.
•LOW
Bargaining Power off Suppliers
•Due to the rapid increase in the number of contractors and construction service providers
•MODERATE
Bargaining power of customers
•The country still is less prone to green factories
•LOW
Competition
•There has been significant increase in number of green construction companies
•HIGH
Competitive landscape of GREEN FACTORY SEGMENT
Developer Building Type Location Efficiency ActionsAnsal Properties & Infrastructure Limited
Residential, IT parks, commercial, SEZs Developing integrated townships with malls and hotels
Pan-India, North India focus Ansal Esencia Township, Gurgaon registered as a pilot project for GRIHA rating
DLF Limited Residential, commercial (offices, retail property) ,Hotels, infrastructure, SEZs
India’s largest real estate developer (29 cities, across 16 states)
Majority of projects in Gurgaon, Haryana; DLF City, more than 3,000 acres, is Asia’s largest private township
Active in Kolkata, Hyderabad, and Chandigarh
Provided partial funding and expertise to UNDP and BEE on ECBC implementation118
Set up DLF utilities for captive power Installed natural gas-based Combined Cooling Heating and
Power systems for commercial buildings
Hiranandani Group Commercial (hotels, retail, IT offices), SEZ, and residential
Major presence in Mumbai, with increasing presence in other metro cities
Designed BG House, a Platinum LEED building
K Raheja Corp Commercial (hotels, retail, IT offices), SEZ, and residential
Developing 15 townships and 10 hotels
Mumbai focus Developments in Bangalore, Ahmedabad, Goa, Pune, &
Hyderabad
MoU with CII-IGBC to facilitate LEED certification for 10 large-scale projects, in Mumbai, Pune, Ahmedabad, Hyderabad and Chennai
Omaxe Ltd. Residential, commercial (malls, office spaces, IT parks) North India focus, active in 40 cities, 12 states Constructed the energy-efficient Trade Tower in ChandigarhParsvnath Developers Residential, IT park, commercial and SEZ Pan-India, National Capital Region (NCR) focus
Active in more than 46 cities, 15 states Part of study on energy efficiency in India
Sobha Developers Residential, commercial (hotels, offices) Bangalore focused along with Coimbatore, Mysore, NCR and Pune
Develop Infosys energy-efficient buildings Develop IGBC accredited buildings
Unitech Group Residential, commercial and SEZ Retail, hotels, and integrated townships
Pan-India footprint (NCR, Kolkata, Chennai and Hyderabad) Indian Green Building Council member NCR developments registered as LEED Core or Shell rating
Approach Market Analysis Target Segment Competition Macroeconomics Regulations VRIO Risks Summary

Macro-economic Outlook
While the growth is imminent it is imperative that the development should happen in an environmentally
sustainable manner.
MACROECONOMIC SCENARIO The national GDP expected to grow at about 7% The contribution of the manufacturing sector to the national
GDP being quite significant at 25% Therefore, more and more factories would be set up in the
country.
TOWARDS GREEN FACTORIES Far reaching impacts on saving natural resources,
betterment of working conditions and enhanced productivity
Thereby leading to substantial national benefits
The most tangible benefits are the reduction in water and energy consumption right from day of occupancy.
The energy savings could range from 30 – 40 % and water savings around 20 – 30%.
Intangible benefits of green factory include enhanced indoor air quality, good day lighting, health, well-being and safety of the workmen.
Address national issues like energy efficiency, conservation of natural resources, handling of consumer waste, water efficiency and reduction in fossil fuel use in commuting.
BENEFITS- Tangible + Intangible
Fuel Imports And Energy Efficiency Due to rise in standard of living economic activities are increasingly becoming energy and technology intensive The rising fossil fuel demand has evoked a fear of running out of fuel reserves in the future and fear of huge imports Buildings consume significant amount of energy, of which there is a potential to save 30 to 40%.
Macroeconomic factors driving Green factories
Agriculture, Industries And Water Efficiency Agriculture is the main stay of Indian population and economy which sustains on water resources 70 percent of India’s irrigation needs and 80 percent of its domestic needs are met by groundwater Water demand is expected to rise with the expanding urbanization and industrialization thus Effective water management
strategies need to address the crisis
Dependency on Virgin Materials Rising industrial needs demand greater use of materials for various activities. Use of non renewable, virgin materials would pose a risk of depleting the available natural resources.
Waste Management and Environment With expanding industrialization and urbanization, the quantity of waste generated is increasing. In the present waste management scenario, almost 90% of the waste generated requires around 1,200 hectares of land
per year for disposal. The waste is either dumped or burnt, producing hazardous gases and leeching of toxins into the soil thereby affecting the
productivity of our land
CONCLUSION
We can say that:
In the current macro economic outlook, the future of green factories is very bright in India
This would present an ideal opportunity for Mahindra EPC to enter into this segment
Approach Market Analysis Target Segment Competition Macroeconomics Regulations VRIO Risks Summary

Policy EnvironmentPolicy and Regulatory Environment in India
India has a number of policy initiatives to mainstream energy efficiency andgreen buildings as control and regulatory instruments:
Energy Conservation Building Code 2007 The Energy Conservation Act 2001 provides for the establishment of state energy
conservation agencies to plan and execute programs. The Act led to the formation of Bureau of Energy Efficiency (BEE) that formulated
the Energy Conservation Building Code (ECBC)
The Ministry of Environment and Forests (MoEF), Environmental Impact Assessment (EIA) and Clearance
This is a mandatory requirement for all buildings with a built up area above 20,000 sq. m and such projects have to be apprised by the MoEF’s Environmental Appraisal Committees (EACs) and the State Environmental Appraisal Committees (SEACs).
The Ministry of New and Renewable Energy It initiated several programs focusing on the utilization of renewable energy sources
in buildings.
Rating Systems LEEDLEED-India was launched in 2001 and rates buildings on environmental performance and energy efficiency during the design, construction and operation stages.
GRIHAGRIHA has been developed to rate commercial, institutional and residential buildings in India emphasizing national environmental concerns, regional climatic conditions and indigenous solutions.
CONCLUSION
We can say that: The Policy and regulatory environment in India is very friendly to promotion of
green construction The policy environment is ideal for Mahindra EPC to enter into this market
segment
Approach Market Analysis Target Segment Competition Macroeconomics Regulations VRIO Risks Summary

Internal Resources & Capabilities Analysis of Mahindra EPC
Resources and Capabilities Valuable? Rare?Costly to Imitate? Exploited?
Competitive Advantage? Rationale
Green Tech. Rain water harvesting Y Y Y N Temporary Advantage leverage same vendor as used by Mahindra LifespacesWater Recycling Y Y Y Y Sustained Advantage Leverage capability of Mahindra Water UtilitiesLow conductivity materials & insulation Y Y Y Y Sustained Advantage Patented Low thermal conductivity - High Volume Fly ash Concrete by Mahindra SplendrourLighting solutions – LEDs, lighting sensors Y N N N Parity Though capability not present, this category is commodity hence should be outsourced.Glass - High performance, recyclable Y N N N Parity Though capability not present, this category is commodity hence should be outsourced.Heat Recovery wheels Y N N Y Parity Leverage capability of Mahindra Engineering ServicesHVAC systems (Continuous & On Demand) Y N N Y Parity Leverage capability of Mahindra Engineering Services
High reflective materials (Aluminium, paint) Y N N N ParityProcess steel but not aluminium. Leverage VOC content paints & adhesives by Mahindra Life
Green design and process Y Y Y N Temporary Advantage New to Green Factory ConstructionSolid Waste Management Y Y Y N Temporary Advantage New to Green Factory ConstructionSolar panels - Rooftop & facades (Transparent modules as Window) Y Y Y Y Sustained Advantage Leader in India with more than 2.5 MW Solar Rooftop projects
Expertise Engineering Y Y Y Y Sustained Advantage Partner - Mahindra Consulting Engineers & Mahindra Engineering ServicesLogistics & Supply chain Y Y Y Y Sustained Advantage Mahindra Logistics and warehousing can be leveraged.Contracting Expertise Y Y Y Y Sustained Advantage Long experience of contracting vendors for big projects. Reduces search costMarketing Y N N Y Parity Since it is a B2B scenario, branding activity is not very costly.
Finance Internal Fund Generation Y Y Y Y Sustained Advantage Mahindra Finance has network of financers and investors for project financing.External Fund Generation Y Y Y Y Sustained Advantage FY13 Revenue (INR4,850m) & EBITDA margins (10.8%). Has orders of 34.6MW Solar ProjectGovernment Relations Y Y Y Y Sustained Advantage Long term relation e.g. Tirupur Water Supply and Sewerage (TWSS). Vendor Base Y Y Y Y Sustained Advantage It has good network of vendors in Solar PV domain but lacks in other areasTechnology partners Y Y Y Y Sustained Advantage Partner with best players in Solar PV markets
Other R&D Y Y Y Y Sustained Advantage Culture of innovation and transformationProject Management Capabilities Y Y Y Y Sustained Advantage Culture of creating high capability project management processes, leaders and values
Physical Reach across Country Y Y Y Y Sustained Advantage Mahindra has wide reach across country IT infrastructure Y N Y Y Parity Leverage Tech Mahindra capabilities
HR Trained employees Y N N Y Parity 100+ experienced engineers trained by corporation. Require skills for green constructionLabour access Y Y N Y Temporary Advantage skilled labour is difficult to find in this industry
Reputation Brand Equity Y Y Y Y Sustained Advantage Reputation of On-time delivery, high quality & Parent Brand linkageCustomer Loyalty Y Y Y Y Sustained Advantage Culture of nurturing relations and striving to assess and deliver value.
This framework explains the Resources & Capabilities of MEPC which are giving it Sustainable Competitive Advantage
Approach Market Analysis Target Segment Competition Macroeconomics Regulations VRIO Risks Summary

Strategic Risk Areas to be Mitigated
Lack of awareness about green
buildings
Regulatory Risks
Product Development Risks
Third Party/Partnership
Risks
Capital Investment Risks
Failure to Combat the myth of higher
cost of green buildings
Strategic Risks
Removal of Incentives currently provided by government. This could de incentivize the clients from moving towards green factories
1. Regulatory Risks
In order to create long term competitive advantage, development of new technical product offerings is inevitable
This might increase the risk associated with the product if it requires huge R&D expenditure
2. Product Development Risks
Offerings of full turn key solutions would require third party outsourcing or strategic partnerships for certain product offerings
This might correlate our risk to the partner’s risk, thereby affecting our performance
3. Partnership/Third Party Risks
Huge initial capital investment in in product research and capability development for the new products
The products or the processes might get outdated, leading to huge capital investment losses
4. Capital Investment Risks
Failure to combat the myth that the green factories/ buildings are more expensive than normal buildings in the long run
This might affect the generation of demand, thereby increasing the associated risk of performance
5. Lack of Demand due to myth
Approach Market Analysis Target Segment Competition Macroeconomics Regulations VRIO Risks Summary

Summary of Market Analysis and Opportunity SUMMARY
MARKET TRENDS The green construction market in India is growing at a tremendous rate Market potential for green building products & technologies would be about
USD 100 Billion by 2015 for India Within green construction, the potential for green factory segment is also huge
Favorable to enter green factory segment
COMPETITIVE LANDSCAPE Number of solar EPC and construction EPC’s in the market but no one is
targeting the turnkey market in the green factory segment Mahindra EPC would have a 1st mover advantage and competitive analysis is
favorable based on porter’s forces
Favorable to enter green factory segment
MACROECONOMIC OUTLOOK The current GDP growth is also fuelled by the industrial growth which demands
for factory settlements The green factory offers the most viable and sustainable solution to the
national environmental and energy concerns
Favorable to enter green factory segment
POLICY ENVIRONMENT The government offers number of incentives to the owners of green buildings
and factories, thereby promoting it There are numerous financial schemes and two rating systems to develop the
green factory environment in India
Favorable to enter green factory segment
STRATEGIC RISKS There are certain strategic risks which is involved with venturing into green
construction segment, but these risks can be mitigated
Favorable to enter green factory segment
CONCLUSION
The market opportunity of entering into the Green factory construction segment is favorable for MAHINDRA EPC Offering the end to end turn key product solutions mitigates the cyclic risk associated with its current solar EPC model Being the 1st mover, MAHINDRA EPC can create sustainable competitive advantage for the long term market leadership
THERFORE, MAHINDRA EPC SHOULD ENTER THE GIVEN MARKET i.e. GREEN CONSTRUCTION SEGMENT OF FACTORY BUILDINGS
Approach Market Analysis Target Segment Competition Macroeconomics Regulations VRIO Risks Summary

Market Entry Strategy
Market dynamics Competitive landscape Macro-economic outlook
Regulatory environment
Internal assets / Technology
Internal SWOT Identified strategic risk areas
Summary and conclusions
Market opportunity description
Market entry strategy
Strategic directions
PricingBrand and communication
Sales and distribution
Products and servicesCustomer serviceLaunch phasing
Market analysis
Vision and MissionObjectives
Value propositionOverall StrategyTarget segments
PositioningBrand
Tactical launch plan
Execution of Market Entry

Research Methodology
• Telephonic interviews with: • Mr. Apoorva Pande (Senior consultant, Energy Utilities, PwC – Hyderabad)• Mr. Vishwajeet Kumar (ex-employee, Consultant, GL Garrad Hassan)• Mr. S.S. Das (AGM, Project execution, NTPC, Bilaspur)• Interviews with professors at IIM Bangalore
Primary research
• Databases: NSO, CRISIL, MNRE, IEA, Labour Bureau, UNIDO, IGBC, LEED – US, GRIHA-TERI• Annual reports: Mahindra Group companies
Secondary research
Methodology Vision STP Business Model Offering Partnership Innovation CVM Pricing Sales

Vision, Mission and Objective
To become the biggest EPC company in the world in green construction space by providing clean and safe environment through constant thrust on innovation and growth.
To innovate and develop reliable and efficient end-to-end green construction solutions for clean and sustainable environment .
• Develop sustainable building techniques that minimize construction waste, build healthier indoor environments, and reduce energy use while conserving natural resources.
• Reduce, Recycle: Promote resource conservation and renewable energy.
• Create economic, environmental and social value through green construction.
• Communicate the economic, environmental and social benefits of green construction to the public, industry, and government.
• Develop partnership with realtors and other stakeholders for research and understand green building features and benefits.
• Develop green construction professionals by equipping them with required tools through well directed training programs.
Objectives
MissionVision
Methodology Vision STP Business Model Offering Partnership Innovation CVM Pricing Sales

Target States of India
State/Union Territory Number of Factories 2009-10 (Source: Labour Beaureau)
Average annual rainfall (in mm) (Source: IMD)
Solar energy potential (in kWh) (Source: NSO)
Rain water harvesting potential score
Solar Energy Potential score
Market potential score Overall score
Andhra Pradesh 17153 900.7 5.6 7.19 8.21 6.76 7.39Arunachal Pradesh 10 2,935.90 5.3 8.09 7.14 1 5.41
Assam 2247 2,255.80 4.7 7.79 5.00 1.75 4.85Bihar 1918 1,230.80 5.5 7.34 7.86 1.64 5.61
Chhattisgarh 1976 1,368.40 5.3 7.40 7.14 1.66 5.40Goa 520 3,045.20 5.4 8.14 7.50 1.17 5.60
Gujarat 15576 716.3 5.8 7.11 8.93 6.23 7.42Haryana 4640 558.6 5.5 7.04 7.86 2.56 5.82
Himachal Pradesh 1545 1,323.80 5.4 7.38 7.50 1.52 5.47Jammu & Kashmir 626 1,232.70 5.2 7.34 6.79 1.21 5.11
Jharkhand 2032 1,320.70 5.4 7.38 7.50 1.68 5.52Karnataka 8541 1,145.80 5.4 7.30 7.50 3.87 6.22
Kerala 5907 3,097.40 5.4 8.16 7.50 2.98 6.21Madhya Pradesh 3523 1,093.70 5.5 7.28 7.86 2.18 5.77
Maharashtra 19457 1,147.00 5.6 7.30 8.21 7.54 7.69Manipur 85 1,370.80 5.1 7.40 6.43 1.03 4.95
Meghalaya 100 7,281.30 4.9 10.00 5.71 1.03 5.58Nagaland 90 1,910.80 5.1 7.64 6.43 1.03 5.03
Odisha 2052 1,472.60 5.5 7.45 7.86 1.69 5.66Punjab 10262 648.8 5.5 7.08 7.86 4.45 6.46
Rajasthan 6811 460.8 6.1 7.00 10.00 3.29 6.76Sikkim 46 3,090.50 4.8 8.16 5.36 1.01 4.84
Tamil Nadu 26790 910 5.6 7.20 8.21 10 8.47Tripura 407 2,400.20 5.1 7.85 6.43 1.14 5.14
UttaraKhand 2344 1,582.60 5.3 7.49 7.14 1.79 5.48Uttar Pradesh 11015 979.4 5.6 7.23 8.21 4.7 6.71West Bengal 6818 1,734.50 5.5 7.56 7.86 3.29 6.24A & N. Island 13 3,001.70 5.2 8.12 6.79 1 5.30Chandigarh 284 1,077.70 5.5 7.27 7.86 1.09 5.41
Dadra & N Haveli 1103 2,212.00 5.5 7.77 7.86 1.37 5.67Daman & Diu 1447 625 5.4 7.07 7.50 1.49 5.35
Delhi 2878 794 5.5 7.15 7.86 1.97 5.66Lakshadweep 2 1,584.70 5.2 7.49 6.79 1 5.09Puducherry 671 1,363.20 5.5 7.40 7.86 1.22 5.49
Rationale for doing state-wise segmentation:
• Policies vary across states
• Regulatory norms & renewable energy incentive structure might differ across states
• Geography plays a major role in the effectiveness of renewable energy sources
Linear interpolation done according to following:Factory score: 1- 10Solar energy potential: 5 – 10Rainwater harvesting potential: 7 – 10Higher weight age was given to number of factories and least to rainwater potential because rainwater harvesting plays comparatively insignificant role in the whole solution and more so, there was much less deviation in rainwater across the regions as compared to no. of factoriesPhase-wise implementation to be done on the basis of overall score
Methodology Vision STP Business Model Offering Partnership Innovation CVM Pricing Sales

Target IndustryIndustry Energy intensive Overall energy
consumption (in %)Manufacture of textiles High energy-intensive 7Paper and paper products High energy-intensive 1.3Coke and refined petroleum products High energy-intensive 16.6Chemical products High energy-intensive 12.4Non-metallic mineral products High energy-intensive 2.6Manufacture of basic metals High energy-intensive 13.7Food products and beverages Moderate-energy intensive 13.5Wearing apparel; dressing and dyeing Moderate-energy intensive 1.5Manufacture of leather products Moderate-energy intensive 0.9Wood and wood products Moderate-energy intensive 0.3Printing and publishing Moderate-energy intensive 0.8Rubber and plastic products Moderate-energy intensive 2.9Fabricated metal products Moderate-energy intensive 2.7Tobacco products Low energy-intensive 0.5Machinery and equipment n.e.c. Low energy-intensive 5Office, accounting and computing machinery Low energy-intensive 0.4Electrical machinery and apparatus n.e.c. Low energy-intensive 3.6Radio, TV and communication equipment Low energy-intensive 1.9Medical, precision and optical instruments Low energy-intensive 0.9Motor vehicles, trailers and semi-trailers Low energy-intensive 7.6Other transport equipment Low energy-intensive 3Furniture and other manufacturing n.e.c. Low energy-intensive 1.3Recycling Low energy-intensive 0
The various industries in the manufacturing sector were split on the basis of two dimensions:• Energy usage• Energy consumption as a % of total energy consumption in the manufacturing segment
Higher energy usage industries will have higher energy savings and hence, higher value can be provided to these customers. More so, higher value can be charged from these customers for the offering.
High energy-consumption as a % of total energy consumption reflects the market size in some sense which is relevant for our purpose.
However, this might not be an accurate measure because the solution provided would mainly include energy savings in auxiliary domains. Energy savings in the main production process, etc. might not be that easily achievable. Also, fuel energy might not be replaced by energy due to solar PV etc. in many domains.
If we continue to target industries using this metric, we should target industries like Chemical products, basic metals, food products, refined petroleum in phase 1 because of highest energy savings possible in these industries.
Methodology Vision STP Business Model Offering Partnership Innovation CVM Pricing Sales
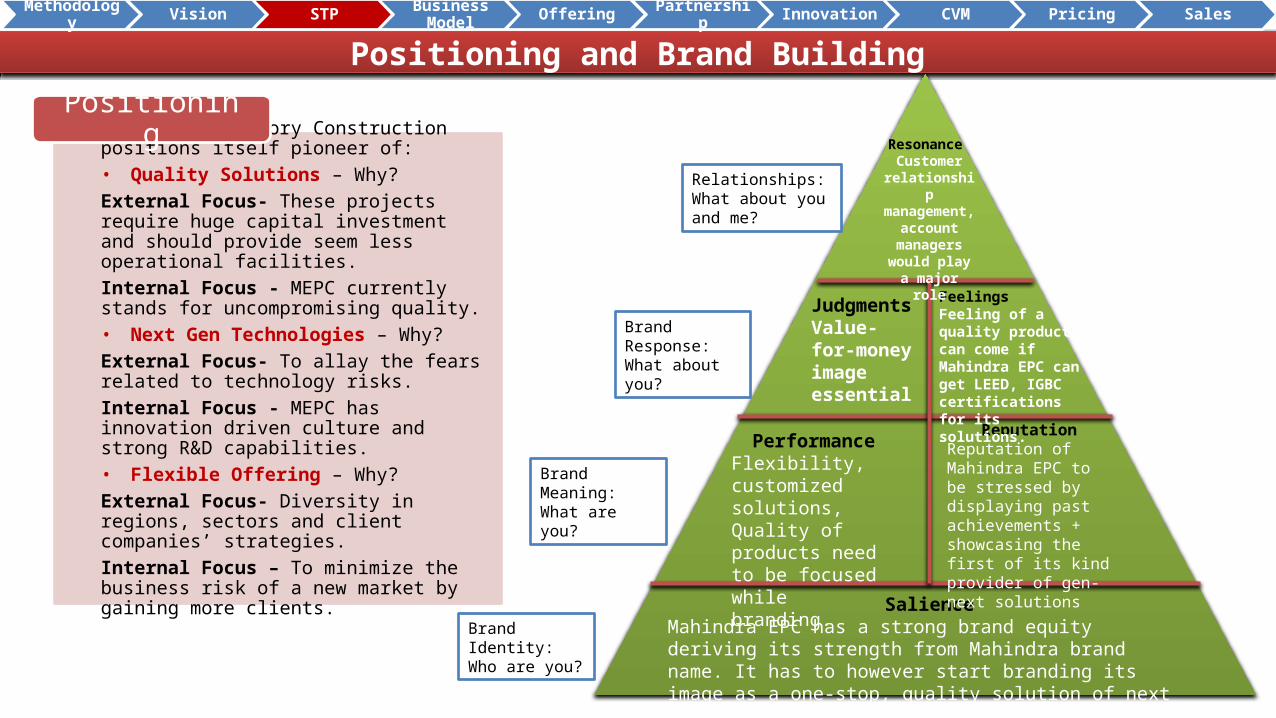
Positioning and Brand Building
SalienceMahindra EPC has a strong brand equity deriving its strength from Mahindra brand name. It has to however start branding its image as a one-stop, quality solution of next generation factory buildings
PerformanceFlexibility, customized solutions, Quality of products need to be focused while branding.
ReputationReputation of Mahindra EPC to be stressed by displaying past achievements + showcasing the first of its kind provider of gen-next solutions
FeelingsFeeling of a quality product can come if Mahindra EPC can get LEED, IGBC certifications for its solutions.
Resonance Customer
relationship management,
account managers
would play a major role
JudgmentsValue-for-money image essential
Brand Identity: Who are you?
Brand Meaning: What are you?
Brand Response: What about you?
Relationships: What about you and me?
MEPC Green Factory Construction positions itself pioneer of:• Quality Solutions – Why? External Focus- These projects require huge capital investment and should provide seem less operational facilities. Internal Focus - MEPC currently stands for uncompromising quality.• Next Gen Technologies – Why?External Focus- To allay the fears related to technology risks.Internal Focus - MEPC has innovation driven culture and strong R&D capabilities.• Flexible Offering – Why?External Focus- Diversity in regions, sectors and client companies’ strategies. Internal Focus – To minimize the business risk of a new market by gaining more clients.
Positioning
Methodology Vision STP Business Model Offering Partnership Innovation CVM Pricing Sales

Business Model
Owner Administer the contract
management
EPC ContractorSingle point of responsibility,
communication and coordination
Product offerings Vendors Specialist
ConsultantsOperation & maintenance
OwnerSpecifies
project aims and objectives
PMCConsult, advice,
supervise & assist owner in defining
the scope, contract
tendering etc.
EPC Contractor
EPC contract model- AVAILABLE OPTIONS
1. Engineering, Procurement and Construction (EPC) Contract Structure
2. Project Management Contract (PMC) Structure 3. Project Lump Sum (PLS) Structure
PROPOSED CONTRACT MODEL TO BE ADOPTED
OwnerAdminister the
contract management
EPC ContractorSingle point of responsibility,
communication & coordination
The entire project is separated into pre-agreed stages, which are awarded on lump sum basis within
the scope of contract
OwnerAdminister the contract
management
EPC ContractorSingle point of responsibility,
communication & coordination
Product Offerings Vendors Specialist
ConsultantsOperation & maintenance
The entire project is separated into pre-agreed stages, which are awarded on lump sum basis within the scope of contract
WHY THIS MODEL?
This model is a hybrid of Option 1 and Option 31. Why Option 1- Single Point EPC Contract Structure? Here, a single-point contract is awarded which includes the
entire supply of materials, design, engineering, procurement, construction and installation works.
This will help us deliver our turnkey solution as per our long term strategy
2. Why Option 3- PLS Structure? Here the project will be separated into pre-agreed stages, which
are then awarded on lump sum basis within the scope of an EPC. This is very important because Owners enjoy the advantages of a
traditional lump sum contract with a minimal risk for claims Helpful in gaining trust while we enter the market being the 1 st
mover.
Methodology Vision STP Business Model Offering Partnership Innovation CVM Pricing Sales

Business ModelRecommended EPC Contract Model in Detail- SINGLE POINT CUM PLS STRUCTURE
OwnerAdminister the contract management
EPC ContractorSingle point of responsibility,
communication & coordination
Vendors Product offerings
Energy Efficiency
Water Management
Waste Management
Indoor Quality
Specialist Consultants
Operation & maintenance
Regulatory Authority
Financing Institutions/ Banks
Module/Equipment Supplier or Partners
Utility/PPA
Project Consultant
BoS Suppliers or Partners
The entire project is separated into pre-agreed stages, which are awarded on lump sum basis within the scope of contract.
Benefits of this model SINGLE POINT MODELThis enable Mahindra EPC to meet its strategic objectives of being a one-stop end to end turn-key solution provider
PLS STRUCTUREIn short term, this enables Mahindra EPC to gain the trust of customers and gain more contracts as this reduces the risk exposure of the clientsIn long term, Mahindra EPC can move away from PLS structure to a completely single point model
Methodology Vision STP Business Model Offering Partnership Innovation CVM Pricing Sales

Product Features for Turn Key SolutionIGBC (Indian Green Building Council) Green Factories rating system addresses sustainability in industrial buildings. The programme is fundamentally designed to address national priorities and quality of life for factory workmen.
Category Points for IGBC Green Factories
Water Conservation
Energy Conservation
Material Conservation
Indoor Environment
Quality & Occupational
Health
Innovation & Design Process
Site Selection &
Planning
Green Features under IGBC Green Factory Building Rating System
Certification Level Points
Certified 51-60Silver 61-70Gold 71-80Platinum 81-100
• Design to maximize the use of daylight and ventilation• Materials used should be sourced locally, have a
recycled and contribute to healthy indoor
Insulation of roof and exterior walls to reduce heat ingress and make air conditioning more efficient
Glass – low SC and low U-Value to protect from heat transmission through windows. High VLT to allow sufficient daylight
Energy efficient lighting fixtures like LED and T5 with lighting control system
Water - Rainwater harvesting, water efficient fixtures, water recycling
Green FactoryOn Demand HVAC – Energy efficient chillers, AHU’s. Heat Exchangers, Cooling Towers
Methodology Vision STP Business Model Offering Partnership Innovation CVM Pricing Sales

Overall Strategy of Making a Green Factory
Plan SITE
• Selecting a site where regulations compliance is easy
• Access to Transport System
• Soil Erosion prevention & control
• Contaminated Site Remediation
• Design for Differently Abled
Apply DESIGN STRATEGIES
• Orient windows on South and North façade
• Provide buffer spaces on East and West
• Provide shading for windows (through overhangs, blinds, vertical fins)
• Provide sufficient windows for daylighting but restrict extensive glass to avoid heat gains
Select GREEN MATERIALS
• Select LOCAL manufactured materials (within 800 km radius)
• Select materials with RECYCLED content
• Give preference to RAPIDLY RENEWABLE MATERIALS like Bamboo
Implement strategies for ENERGY CONSERVATION
• Rooftop insulation• Occupancy sensors (in restrooms)• Daylight sensors• Efficient lighting layout (use T5 or
LED lights)• Efficient HVAC system (evaluate
efficiencies and design the system according to the specific requirements)
• Building management System (BMS) to control lighting and aircondition requirements
• Use double glazed windows (for air-conditioned spaces)
• Use building materials with insulating properties like AAC blocks, hollow brick blocks
• Use solar reflective paints on the roof or implement a green roof
• Use a solar hot water system
WATER CONSERVATION
• Install Rain water harvesting system
• Use low-flush toilets & urinals
• Select low-flow fixtures
• Install a sewage treatment plant (STP)
• Reuse treated water for landscaping
• Design a waterefficient landscaping
Install RENEWABLE ENERGY
• Install photovoltaic panels on Rooftop
• Use ground-source heat pumps
• Evaluate the installation of a small wind turbine
• Use organic waste to operate a biogas plant
Methodology Vision STP Business Model Offering Partnership Innovation CVM Pricing Sales

In-house or Outsource Green Features
*In-house means manufactured by one of Mahindra group companies
Green Features Short run Long run RemarksSolar energy solutions In-house In-house Competitive advantage in short-run. Strong brand association with solar energy solutions.
Rain water harvesting solutions Outsource In-house Mahindra Water Utilities only provides waste water treatment utilities. In the long run water harvesting capabilities can be developed as the technology is not very difficult to learn.
Low conductivity materials and insulation
In-house In-house Fly ash bricks are manufactured in-house. Patent for low thermal conductivity fly ash bricks. Very high on value addition (useful for roads, walls, etc.), should be continued in-house.
Lighting solutions – LEDs, lighting sensors
Outsource Outsource Almost becoming a commodity and hence need not develop this expertise in the long run.
Glass - High performance, recyclable Outsource Outsource Commodity and hence can be avoided to be manufactured in-house in the long run.
Heat Recovery wheels Outsource In-house Essential for supporting HVAC systems and hence should be brought in-house in the long run.
HVAC systems (Continuous & On Demand)
In-house In-house Mahindra Engineering Services has this expertise in the automotive sector. It can easily be replicated in the green building domain with minor modifications.
High reflective materials – Aluminium, special paints
Outsource Outsource Aluminium manufacturing requires high capital expenditure and they don’t have in-house manufacturing capability currently.
Green Design and Process Outsource In-house A great value addition can be provided through this. Has a lot of importance and hence should be brought in-house. In short run, they have expertise only in solar technology domain but not in other sectors.
Solid Waste Management Solutions Outsource Outsource Not a very value adding product and hence should be kept outsourced even in the long term. Lack of knowledge won’t hurt them in long run.
Construction equipment Outsource (mainly)
In-house Mahindra Construction Equipment’s product Earthmaster can be used. Many construction equipments might have to be outsourced. Mahindra Conveyor systems can also be used.
Building Construction Outsource In-house In short, vendor contacts from Mahindra Lifespaces can be leveraged and in long run as the product forms the major component of the total value of the offering, it should be brought in-house.
Methodology Vision STP Business Model Offering Partnership Innovation CVM Pricing Sales

Possible Product Innovation AreasHEATING AND COOLING
Rationale: About half of a building’s total energy is devoted to heating, ventilation and air-conditioning (HVAC)
Air purification, which incorporates technologies such as ultraviolet light and photo-reactive chemicals similar to those that occur in the Earth's atmosphere. Such systems enable buildings to reuse large amounts of their internal air and help lower heating costs.
Passive solar and radiant heating, where warm, sunlit air is diverted to heat a building or, during the summer months, used to draw in colder air for ventilation. Such passive solar designs are used in many high-efficiency buildings
INSULATION
Rationale: Energy-efficient heating can only keep a building warm if there is sufficient thermal insulation to keep the heat inside.
Insulating concrete forms (ICFs): These use interlocking polystyrene concrete forms to create a seamless wall through which air cannot penetrate.
Structural insulated panels (SIPs): These are frequently used insulation option, partly because they can be integrated into a number of materials, including particle and gypsum board, sheet metal, plastics and foams.
Phase-change materials (PCMs): These absorb or discharge heat as they change back and forth from a solid to liquid state. In a sense they "melt" and "freeze" at conditions close to room temperature and draw in or release heat in the process.
LIGHTING
Rationale: lighting eats up energy as well - somewhere between 10 and 30% of a building's total energy consumption.
LEDs: These require about one tenth of the energy of incandescent light bulbs and roughly half of that of the compact fluorescent lights (CFLs). They also last at least 40 times longer.
OLEDs (organic light emitting diode): These applications promise to make a big dent in the amount of energy spent on lighting. Therefore, these can be one of the product innovations to look into.
SELF-POWERED BUILDINGS
Rationale: The transition to true green buildings - the realm of net-zero-energy construction and beyond - will not be complete until they produce enough power to cover their own energy requirements and even send excess energy back into the power grid.
Solar power is a more widely tested method for buildings to create renewable energy. Photovoltaic cells are found not only on rooftops but also on building facades and even in transparent modules used as windows and skylights.
Wind Energy: Tall buildings and skyscrapers which has nearly constant air currents at higher altitudes, turbines can generate a considerable portion of a building's own power requirements.
Approach to innovation: Investment in R&D Partnerships with other stakeholders in value chain Early Warning System for latest developments across
Methodology Vision STP Business Model Offering Partnership Innovation CVM Pricing Sales

Customer Value ModelMahindra EPC Services Next Best Alternative Assumptions Placeholders
Benefit elements
• Energy savings (35%) due to:o Shading measures (3.4%)o Proper Window Wall Ratio (2.6%)o Changing from dark to light color (0.9%)o Improved glass (3.5%)o Polyurethane insulation on walls and roofs (2.7%)o Daylight sensors (6%)o Improved HVAC systems (12.5%)o On-demand HVAC system (1.3%)o Heat Recovery systems (1.5%)• Potable water saving of 20-30%
NA
•There is sufficient demand from the factories for Green factory solutions• Finding independent vendors for different solutions is quite difficult than narrowing down on one complete solution provider• Pricing in a normal factory building construction case depends on factory size
•Savings due to water storage (+)• Enhanced indoor air quality (+)• Higher productivity of occupants (+)•Enhanced day light and ventilation (+)• Any company making profit of more than 5 crores have to give 2% in CSR according to New Company Act. Solar technology can be helpful to take care of this 2%. (+)• Risk that energy savings might not be realized (-)• Higher government incentives (+)• Better brand image (+)• Higher reliability because of one-stop solution provider (+)• Less coordination cost because of just one point of contact (+)• Payback period might be quite large in some cases (-)• High initial setup cost might require high interest expense (-)• Better managerial expertise (+)
Cost elements• System maintenance cost•Vendor Search cost
•Vendor Search cost (much higher than in Mahindra EPC services turnkey solution)
Price elements • Depends on customization • Depends on factory size mainly
Value Proposition: Benefit elements mainly comprise of Energy savings and cost element mainly consists of reduction in vendor search cost because of one-stop turnkey solution. Thus, Value proposition to any target segment should clearly specify the elements: ‘One-stop solution’ and ‘Value-for-money in terms of energy savings’
Methodology Vision STP Business Model Offering Partnership Innovation CVM Pricing Sales

Pricing Strategy
Competitive parity pricing: This won’t work in this scenario because there are no competitors who provide flexible EPC Services solution hence, pricing an offering using this would be impossible.
Cost plus pricing: (Project cost + risk-free interest rate*cost) can be used to price an offering. This will get a minimum threshold on the price
Value-based pricing: This will work in this scenario and this will give a maximum threshold on the possible price on an offering.
Benefit = Energy saving/kWh consumed*price/kWh + Water saving (in l)*cost/litre of potable water
Cost = Maintenance cost/yr
=> Value-in-use (Mahindra EPC) = Energy saving/kWh consumed*price/kWh + Water saving (in l)*cost/litre of potable water - Maintenance cost/yr – Pmax
=> Value-in-use (NBA) = - Vendor Searchcost/project*Projects/yr – Pmarket
=> Energy saving/kWh consumed*price/kWh + Water saving (in l)*cost/litre of potable water - Maintenance cost/yr – Pmax = - Extra Vendor Search cost (in status quo contracts)/project*Projects/yr – Pmarket
ÞPmax = Pmarket + Energy saving/kWh consumed*price/kWh + Water saving (in l)*cost/litre of potable water - Maintenance cost/yr + Extra Vendor Search cost (in status quo contracts)/project*Projects/yr
ÞTry to quantify benefits mentioned in placeholders section of the value model too.Price between (Pmin, Pmax); Skimming strategy: Price nearer to Pmax, Market penetration strategy: Price nearer to Pmin
Methodology Vision STP Business Model Offering Partnership Innovation CVM Pricing Sales

Sales Model
Locating and prospecting for customers
Pre-Approach
The Approach
The sales presentation
Handling Objections/Sales Resistance:Addressing Customer Concerns
The close:Gaining Customer commitment to contract
Post-Sale follow-up:Relationship enhancement activities
Initiate Relationship
Develop Relationship
Enhance Relationship
The sales process would involve three stages: Relationship Initiation Relationship Development Relationship Enhancement
“Green Factory construction contract” involves a long and complex sales cycle. This requires an extensive investment in time and relationship for the sale to go through
Nature of sale: ENTERPRISE SALE
SALES PROCESS TO BE FOLLOWED
Methodology Vision STP Business Model Offering Partnership Innovation CVM Pricing Sales

Sales Channel
Sales Specialization
Direct Sales Force
Full Line
Strategic Accounts Major Accounts
New Business Development( Hun
ter)
Existing Account Management
(Farmer)
Territory Accounts
Consultative (hunter)
Relationship (Farmer)
Specialized
Energy Efficiency
Water Management
Waste Management
Indoor Quality
The sales process would involve three stages: Relationship Initiation Relationship Development Relationship Enhancement
“Green Factory construction contract” involves a long and complex sales cycle. This requires an extensive investment in time and relationship for the sale to go through
The sales and distribution Channel The sales and distribution Channel will be a direct sales force channel The sales force will be divided based on their specialization of the products
The Full Line: They handle accounts with full turn-key solutions Specialized: They handle product specific accounts. They will assist
the full line sales force.
Of the full line accounts, the accounts will be divided into three segments based on their strategic importance:
Strategic Accounts Major Accounts Territory Accounts
Account Managers: These are the final customer touch points, and will manage specific client accounts to harvest the relationship
Hunters: They will look for new company accounts Farmers: They will maintain and look after the current accounts
Methodology Vision STP Business Model Offering Partnership Innovation CVM Pricing Sales

Preventive: Routine checks of the equipments to prevent outages and ensure maximum availability.Corrective: Fast restoration of normalcy after the detection of failures.Data storage and archiving services
Customer Services
Relationship Management
Operation and maintenance Annual maintenance contract Technological upgradationTransfer of operational know-howCan be undertaken for first 2-3 years after commissioning and performance guarantee tests.On one hand it can be a source of revenue whereas on the other hand it can guarantee smooth transition.
Transfer of operation knowledge can be done at two stages, firstly, during the project execution clients’ staffs can be trained on the operation intricacies and secondly, periodic training programs can be launched at a central location for a pool of clients.
Provision of technological upgradation as well as replacement of the outdated equipments.Control systems for solar power system, effluent treatment system and rain harvesting system may require upgradation with the passage of time
Provision of single point of contacts to the clients to ensure fast redressal of issues.24X7 customer service facility Well-versed workforce in customer relationship management
Methodology Vision STP Business Model Offering Partnership Innovation CVM Pricing Sales

LEED vs GRIHA – Obtaining Certification
The solution will be aimed to maximize LEED rating for factories so that the owners can earn reputation in the industry and support from the Government. It will help them in building brand image and hence bringing more business to MEPC.
Features LEED rating system GRIHA rating system
Reputation Well-established & internationally renowned. Favored rating system among the private sector.
Fairly new it needs further improvement. Specifically, the material and resource sustainability criteria are poorly defined and the energy criteria can be too stringent for some projects to comply.
Local context Doesn’t work well in local context. e.g. Doesn’t give a lot of weightage to water conservation which is very important in Indian context.
Many criteria that make total sense in the Indian context. Compliance criteria for worker safety and well being is one such example.
Financing aspect Foreign Bankers would understand the documentation proving reduction in Energy & Environment safe guards slightly better as it more or less would conform to the western standards.
Difficult to receive foreign financing.
Better for which buildings? Factories requiring international standards and aesthetics; where FDI is tied to the project
Residential complexes, small-scale industries
Number of accredited professionals 710 (as of Apr 2012) 113 (as of Apr 2012)
Methodology Vision STP Business Model Offering Partnership Innovation CVM Pricing Sales

Tactical Launch Plan
Market dynamics Competitive landscape Macro-economic outlook
Regulatory environment
Internal assets / Technology
Internal SWOT Identified strategic risk areas
Summary and conclusions
Market opportunity description
Market entry strategy
Strategic directions
PricingBrand and communication
Sales and distribution
Products and servicesCustomer serviceLaunch phasing
Market analysis
Vision and MissionObjectives
Overall StrategyPositioning
Value propositionBrand
Target segments
Tactical launch plan
Execution of Market Entry
Approach Development Phase Launch Phase Way Forward

Execution of Market EntryPHASE 1 - Development Phase
Financial Outlays •Investment should be made in R&D for green product innovation and development•Outlays for innovation in solar solutions, HVAC, rainwater harvesting systems, conductivity materials, green processes, construction equipment•These investments are for long-term competitive advantage
Partnerships•Strategic Partnerships for products whose in-house capabilities is not there•Long term strategic partnerships are for product development in Lighting solutions, High performance glass, reflective materials and solid waste management solutions
•Short term partnerships in rain-water harvesting solutions, HVAC, green design and construction equipment
Sales Force Development•Development of human and technical abilities for handling accounts as per account handling channel model•Development of sales force based on the strategic requirements of various account types i.e. strategic, major and territorial•Development of training programs and incentive schemes for effectiveness of sales force and hiring of TGBC accredited professionals to bring their expertise
Finalization of Product Offerings•Turn Key Package: This would include holistic one stop green factory solution involving energy efficiency , water management, waste management and indoor quality improvement
•Specialized Packages: Through this we would provide independent services and products pertaining to the need of the customer
Leading the way itself - Key tactical Move for MEPC to launch the pilot project for a Mahindra Group factory.Why? To give a testimonial to the market of the capability and belief. This will not only build the brand image and credibility but also attract more clients
Approach Development Phase Launch Phase Way Forward

Phase 2 – Launch Phase
Since MEPC will have the first mover advantage in the Green Factory Construction segment, it has the opportunity to establish itself as the “thought leader” in the industry. It should exercise its
1. Collaborating with The Indian Green Building Council (IGBC) to create a talent pool for the industry.
i. LEED Accredited Professionals
ii. IGBC Accredited Professional Exams
2. Contribute to the capability development initiatives
3. Develop or invite independent agencies for benchmarking of projects, collect data on each project executed, so that more industry knowledge is publicly available as case studies and benchmarks for future planning of projects and improving upon past performance.
Being the Thought Leader in the Green ConstructionLaunch Campaign1. Conduct a Trade Show inviting
the major customers, media and government representatives. Demonstrate the offerings and teach them about the benefits of Green Factories and impact to the environment.
2. Target advertising using trade magazines.
3. Align the communication tone according the addressed stakeholder (e.g. client, media, government, etc.)
PR Campaign Relationship Development for accounts1. Calling Press conference pre-
launch and announcing the Green construction with a CSR activity like making a village self-energy sufficient using Solar tech
2. Coordinating the activities as thought leader with media and government.
Establishing Initial Feedback Channel• Strategic Accounts: The strategic sales force would be
invested in bringing businesses from clients with nation-wide presence
• Major Accounts: The designated sales force would look for relationship building with companies with significant presence
• Territorial Accounts: The designated sales force would look for businesses from clients having regional presence
Create channel to receive initial feedback from different stakeholders, i.e. clients, government, media, financers, local community, etc.
Approach Development Phase Launch Phase Way Forward

Possible Long Term Strategies
Expansion to new geographies • In Country: In long term, Mahindra EPC can expand to states which have low industrial penetration at the moment and
may have the potential in future• South-east Asian Market and worldwide: Mahindra EPC can also look to expand in the green construction segment in
the south-east Asian markets and other nations
Extension of Offerings • In the long term, we will extend our product offerings beyond the factory segment to• Green Schools• Residential and Commercial buildings segment.• Business Parks
• We will expand our product portfolio into new product features like wind energy. By this, we will also look for supplying the surplus power to the grid.
Innovation: Long termIn-house innovation: Incorporation of innovations in product components such as rainwater harvesting solution, HVAC systems, green designs and construction equipment
Approach Development Phase Launch Phase Way Forward

THANK YOU!

Appendix

States Favorable Neutral/off-putting
Andhra Pradesh • Renewable energy sources’ means renewable sources such as Co-generation (from renewable sources of energy like bagasse).
• The consumption of a Rural Electricity Supply Co-operative Society (RESCO) shall be taken into account for calculating the consumption of a distribution licensee for the purpose of these Regulations. There shall be no separate Renewable Power Purchase Obligation on the RESCOs.
• The State Agency shall submit quarterly status to the Commission in respect of compliance of Renewable Power Purchase Obligation (RPPO) by the obligated entity(s)
• Renewable energy sources’ means renewable sources such as Co-generation (from renewable sources of energy like bagasse).
• The consumption of a Rural Electricity Supply Co-operative Society (RESCO) shall be taken into account for calculating the consumption of a distribution licensee for the purpose of these Regulations. There shall be no separate Renewable Power Purchase Obligation on the RESCOs.
• The State Agency shall submit quarterly status to the Commission in respect of compliance of Renewable Power Purchase Obligation (RPPO) by the obligated entity(s)
Gujarat • The state has set a high Solar RPO target of 1% which is higher than Tariff policy targets.
• Average Pooled Power Cost` definition is in line with the CERC REC Regulation, 2010
• The State Agency shall submit quarterly status to the Commission in respect of compliance of renewable purchase obligation by the obligated entities in the format as stipulated by the Commission.
• The RPO regulations are not applicable on captive as well as open access consumers.
• As per the regulation the APPC of previous year would be applicable while determining the cost of power but in reality GUVNL freezes the APPC for the complete life projects.
• If the mentioned minimum quantum of power purchase from solar is not available in a particular year, then in such cases, additional wind or other energy, over and above their RPO, shall be utilized for fulfillment of the solar RPO.
• RPO trajectory beyond 2012-13 is not provided.
Regulation regarding Renewable Purchase Obligation across target states

Regulation regarding Renewable Purchase Obligation across target statesStates Favorable Neutral/off-putting
Tamil Nadu • The State Agency shall submit quarterly status to the Commission in respect of compliance of renewable purchase obligation by the obligated entities in the format as stipulated by the Commission.
• The state have set a very low solar RPO target for 2012-13 i.e. 0.1%
• The RPO targets set under TN Solar Policy 2012 and TNERC are conflicting to each other.
• The state has clarified that purchases made from co-generation units irrespective of the fuel type would be considered for fulfilling their RPO.
• The APPC defined as per TNERC excludes short term as well as purchases from liquid fuels for computation of APPC.
• Also according to draft amendment published by TNERC, the APPC should not exceed 75% of
Maharashtra • It is clearly mentioned that eligible renewable energy sources shall include Non-fossil fuel (including bagasse) based co-generation projects (both, qualifying and non-qualifying co-generation projects)
• The summary statement of RE procurement and RPO compliance by different Obligated Entities shall be published by the State Agency on cumulative basis every month on its website.
• The State Agency shall submit quarterly status to the State Commission in respect of compliance of renewable purchase obligation by the Obligated Entities
• Procurement of RE power generated within the State by Distribution Licensee at rate other than rate approved by the State Commission directly from generator or from trader shall not be considered as eligible quantum for fulfillment of renewable purchase obligation of such distribution licensee
• Captive user(s) consuming power from grid connected fossil fuel based co-generation plants, are exempted from applicability of RPO target and other related conditions as specified in these Regulations.
• The state has set a RPO target of 0.25% in line with Tariff policy but it has set a flat target of 0.5% till 2015-16.

States Favorable Neutral/off-putting
West Bengal • The regulator has clearly defined RPO target fulfillment by purchase of power both being originated from co-generation and/or renewable sources.
• RPO trajectory till 2017-18 is defined.
• To meet the RPO the licensee shall make advertisement in at least two widely published national English daily newspapers and at least one widely published Bengali daily newspaper every year.
• Average Pooled Power Cost` definition is in line with the CERC REC Regulation, 2010
• The commission in its regulation have defined RPO target from 2013-14 onwards.
• RPO targets till 2017-18 (0.6%) are not sufficient to meet Tariff policy targets
• There is no provision requiring State Agency developing methodology/reporting to commission regarding RPO compliance.
• The regulation does not specify the min capacity for Captive consumers for applicability of RPO.
Rajasthan • At the end of each financial year, each obligated entity shall submit a detailed statement regarding total electricity drawn / consumed and renewable energy /REC purchased and duly certified by the auditors to the State agency on or before ensuing 30th September.
• Solar RPO target (on DISCOMS only) of 0.75% in 2012-13 is higher than Tariff policy target.
• Each Distribution Licensee shall indicate, along with sufficient proof thereof, the estimated quantum of purchase of renewable energy for the ensuing year in tariff/ARR petition in accordance with Regulations notified by the Commission
• As per, Rajasthan Electricity Regulatory Commission (Power Purchase & Procurement Process of Distribution Licensee) (2nd Amendment) Regulations, 2011 solar RPO in Rajasthan is applicable on DISCOMS only.
• RPO targets are till 2013-14 only. A longer trajectory may be desirable
• There is separate RPO for bio-mass and that can be fulfilled by purchase of power from biomass plant only and not by purchase of REC.
• In case of genuine difficulty in complying with the renewable power purchase obligation because of non-availability of renewable energy and/or certificates, the obligated entity can approach the Commission to carry forward the compliance requirement to the next year or seek its waiver.
Regulation regarding Renewable Purchase Obligation across target states

Factor for the Enhancement in the Market Value Added