Embed Size (px)
Citation preview

April 1, 2016
Ms. Audrey Zagazeta Circlepoint 40 A/B S. First Street San Jose, CA 95113 RE: Traffic Operations Analysis for the Proposed Mixed-Use Project Located at 1890
El Camino Real in Santa Clara, California Dear Ms. Zagazeta: The purpose of this letter is to quantify the potential traffic operational issues that could occur as a result of the proposed mixed-use project at 1890 El Camino Real in Santa Clara, California. The site location is shown on Figure 1. The project as proposed would demolish an existing car sales center, a tire shop, and a real estate office and develop 58 residential units and 6,595 square feet of retail space. Figure 2 presents the site plan. Access to the site would be provided by two driveways, one located on Pierce Street and one on El Camino Real. Signage at the Pierce Street driveway would prohibit left turns in and right turns out from the project site to and from the south on Pierce Street. Thus, all of the trips to and from the site would approach and depart via El Camino Real. El Camino Real has a raised median adjacent the project site, so the project driveway on El Camino Real will be restricted to only right turns in and right turns out.
Scope of Study
The impacts of the project were evaluated following the standards and methodologies set forth by the City of Santa and the County Congestion Management Program (CMP) administered by VTA. In consultation with the City staff, the following three intersections were considered for analysis.
Study Intersections
1. Scott Boulevard and El Camino Real* 2. Lincoln Street and El Camino Real* 3. Pierce Street and El Camino Real (unsignalized)
* Denotes CMP Intersections
Traffic conditions at the study intersections were analyzed for the weekday AM and PM peak hours of adjacent street traffic. The AM peak hour is generally between 7:00 AM and 9:00 AM, and the PM peak hour is generally between 4:00 PM and 6:00 PM. It is during these periods on an average day that the most congested traffic conditions occur. Traffic conditions were evaluated for the following scenarios:
Scenario 1: Existing Conditions. Existing PM peak-hour traffic volumes at the CMP study intersections were obtained from the VTA. New turning-movement counts were conducted during the AM peak hour at the CMP study intersections and during both the AM and PM peak hours at the unsignalized study intersection.


Ms. Audrey Zagazeta April 1, 2016 Page 4 of 21
Scenario 2: Existing Plus Project Conditions. Existing traffic volumes with the project were estimated by adding to existing traffic volumes the additional traffic generated by the project. Existing plus project conditions were evaluated relative to existing conditions in order to determine the effects the project would have on the existing roadway network.
Scenario 3: Existing Plus Project Conditions with BRT. This scenario is identical to the previous scenario except that it assumes the completion of the El Camino Real Bus Rapid Transit (BRT) project. The locally preferred BRT alternative has not yet been selected. The analysis contained in this report reflects dedicated BRT lanes. This alternative would reduce the number of through lanes on El Camino Real from three to two lanes in each direction and close the existing median opening at Pierce Street.
Methodology
This section describes the methods used to determine the traffic conditions for each scenario described above. It includes descriptions of the data requirements, the analysis methodologies, and the applicable level of service standards.
Data Requirements
The data required for the analysis were obtained from new traffic counts, previous studies, field observations, and the City of Santa Clara. The following data were collected from these sources:
existing intersection volumes
existing lane geometries
signal timing and phasing
trip generation rates
Analysis Methodologies
Traffic conditions at the study intersections were evaluated using level of service (LOS). Level of Service is a qualitative description of operating conditions ranging from LOS A, or free-flow conditions with little or no delay, to LOS F, or jammed conditions with excessive delays. Intersection levels of service were calculated using the 2000 Highway Capacity Manual (HCM) methodology for signalized and unsignalized intersections. The various analysis methods are described below.
Signalized Intersections
With the HCM methodology, signalized intersection levels of service are evaluated on the basis of average control delay time (measured in seconds per vehicle) for all vehicles at the intersection. The correlation between average delay and level of service for signalized intersections is shown
in Table 1. The CMP level of service standard for signalized intersections is LOS E or better.

Ms. Audrey Zagazeta April 1, 2016 Page 5 of 21
Table 1 Signalized Intersection Level of Service Definition
Source: Transportation Research Board, 2000 Highway Capacity Manual (Washington, D.C., 2000) p10-16.
Level of
ServiceDescription
Average Control
Delay Per
Vehicle (sec.)
Signal progression is extremely favorable. Most vehicles arrive during the
green phase and do not stop at all. Short cycle lengths may also contribute to
the very low vehicle delay.
10.0 or lessA
B
Operations characterized by good signal progression and/or short cycle
lengths. More vehicles stop than with LOS A, causing higher levels of average
vehicle delay.
10.1 to 20.0
Higher delays may result from fair signal progression and/or longer cycle
lengths. Individual cycle failures may begin to appear at this level. The number
of vehicles stopping is significant, though may still pass through the
intersection without stopping.
20.1 to 35.0C
This level of delay is considered unacceptable by most drivers. This condition
often occurs with oversaturation, that is, when arrival flow rates exceed the
capacity of the intersection. Poor progression and long cycle lengths may
also be major contributing causes of such delay levels.
greater than 80.0F
The influence of congestion becomes more noticeable. Longer delays may
result from some combination of unfavorable signal progression, long cycle
lenghts, or high volume-to-capacity (V/C) ratios. Many vehicles stop and
individual cycle failures are noticeable.
35.1 to 55.0D
This is considered to be the limit of acceptable delay. These high delay values
generally indicate poor signal progression, long cycle lengths, and high
volume-to-capacity (V/C) ratios. Individual cycle failures occur frequently.
55.1 to 80.0E
Unsignalized Intersections
For stop-controlled intersections, level of service depends on the average delay experienced by vehicles that must stop or yield to on-coming traffic. Thus, for two-way stop control or T-intersections, operations are defined by the average control delay experienced by vehicles entering the intersection from the stop-controlled approaches on minor streets or from left-turn movements on major streets. Table 2 summarizes the relationship between LOS and average delay for unsignalized intersections. The City of Santa Clara has not established a level of service standard for unsignalized intersections.

Ms. Audrey Zagazeta April 1, 2016 Page 6 of 21
Table 2 Unsignalized Intersection Level of Service
Average Control Delay
Level of Service Description Per Vehicle (Sec.)
A Little or no traffic delay 10.0 or less
B Short traffic delays 10.1 to 15.0
C Average traffic delays 15.1 to 25.0
D Long traffic delays 25.1 to 35.0
E Very long traffic delays 35.1 to 50.0
F Extreme traffic delays greater than 50.0
Source: Transportation Research Board, 2000 Highway Capacity Manual (Washington, D.C., 2000) p17-2.
Queue Analysis
The vehicular queuing analysis is based on vehicle queuing for high demand turning movements at intersections that provide primary access to the project area. Vehicle queues were estimated using a Poisson probability distribution, which estimates the probability of “n” vehicles for a vehicle movement using the following formula:
P (x=n) = n e
– (
n!
Where: P (x=n) = probability of “n” vehicles in queue per lane
n = number of vehicles in the queue per lane
Average number of vehicles in the queue per lane (vehicles per hour per lane/signal cycles per hour)
The basis of the analysis is as follows: (1) the Poisson probability distribution is used to estimate the 95th percentile maximum number of queued vehicles per cycle for a particular movement; (2) the estimated maximum number of vehicles in the queue is translated into a queue length, assuming 25 feet per vehicle; and (3) the estimated maximum queue length is compared to the existing or planned available storage capacity for the movement. This analysis thus provides a basis for estimating future left-turn storage requirements at intersections. The 95th percentile queue length value indicates that during the peak hour, a queue of this length or less would occur on 95 percent of the signal cycles. Likewise, a queue length larger than the 95th percentile queue would only occur on 5 percent of the signal cycles (about 2 cycles during the peak hour for a signal with a 100-second cycle length). Therefore, left-turn storage pocket designs based on the 95th percentile queue length would ensure that storage space would be exceeded only 5 percent of the time. The 95th percentile queue length is also known as the “design queue length”.

Ms. Audrey Zagazeta April 1, 2016 Page 7 of 21
Existing Intersection Operations
Each study intersection was analyzed using existing lane configurations, existing AM and PM peak hour turning movement counts and existing traffic signal timing data. The existing lane configurations at the study intersections are shown on Figure 3, and the existing traffic volumes are shown on Figure 4. Existing PM peak-hour traffic volumes for the CMP study intersections were obtained from the VTA. New AM peak-hour turning-movement counts were conducted on October 06, 2015 for the CMP intersections. New turning-movement counts were conducted on the same date for the unsignalized study intersection during both the AM and PM peak hours. The existing intersection LOS analysis is shown in Table 3. The analysis shows that all study intersections currently operate at LOS D or better during both the AM and PM peak hours.
Table 3 Existing Intersection Level of Service Summary
Peak Count Avg.
Study Intersection Hour Date Delay LOS
1 Scott Boulevard and El Camino Real* AM 10/06/15 36.3 D
PM 09/17/14 37.7 D
2 Pierce Street and El Camino Real AM 10/06/15 18.6 C
PM 10/06/15 26.4 D
3 Lincoln Street and El Camino Real* AM 10/06/15 26.1 C
PM 09/17/14 23.1 C
Notes:
* Denotes CMP designated intersection
Intersection
Control
At signalized intersections, overall average intersection delay and LOS are reported. At
unsignalizedintersections, delay and LOS are reported for the worst stop-controlled approach.
Signal
Signal
Side-Street
Stop
Project Trip Estimates
The magnitude of traffic produced by any new development and the locations where that traffic would appear are estimated using a three-step process: (1) trip generation, (2) trip distribution, and (3) trip assignment. In determining project trip generation, the magnitude of traffic entering and exiting the site is estimated for the AM and PM peak hours. As part of the project trip distribution, an estimate is made of the directions to and from which the project trips would travel. In the project trip assignment, the project trips are assigned to specific streets. These procedures are described further in the following sections.


Ms. Audrey Zagazeta April 1, 2016 Page 10 of 21
Trip Generation
The project trip generation was estimated based on trip rates obtained from the Institute of Transportation Engineers’ (ITE) Trip Generation Manual, Ninth Edition. Based on ITE rates, the proposed 58 residential units and 6,595 square feet of retail space are expected to generate 33 AM peak-hour trips and 57 PM peak-hour trips. Trips associated with the existing uses on the project site were subtracted from the road system. The trips generated by the existing buildings on the site were obtained from driveway counts completed on Thursday October 8, 2015. Based on the driveway counts, the existing buildings on site generate 3 trips during the AM peak hour and 20 trips during the PM peak-hour. These trips were deducted from the estimated number of trips generated by the proposed new development, which results in a net increase of 30 trips in the AM peak-hour and 37 trips in the PM peak-hour. The trip generation estimates are presented in Table 4.
Table 4 Trip Generation Estimates
In Out Total In Out Total
Proposed Project
Residential Condominium /
Townhouse2 53 units 5.81 308 0.44 4 19 23 0.52 19 9 28
Single Family Detached
Housing3 5 units 9.52 48 0.75 1 3 4 1 3 2 5
Retail (Shopping Center)46.6 ksf 42.7 282 0.96 4 2 6 3.71 12 12 24
Total Project Trips 637 9 24 33 34 23 57
Existing Use
Office51.434 ksf 11.03 16 - 1 2 3 - 3 1 4
Automobile Sales60.805 ksf 32.3 26 - - - - - 4 2 6
Tire Store72.745 ksf 24.87 68 - - - - - 3 7 10
Total Trips 110 1 2 3 10 10 20
NEW TRIPS GENERATED 527 8 22 30 24 13 37
1 Rates expressed in trips per dwelling unit or 1,000 square feet (ksf).2 "Residential Condominium / Townhouse" (Land Use 230) daily and peak-hour average rates from ITE Trip Generation, 9th Edition3 "Single Family Detached Housing" (Land Use 210) daily and peak-hour average rates from ITE Trip Generation, 9th Edition4 "Shopping Center" (Land Use 820) daily and peak-hour average rates from ITE Trip Generation, 9th Edition
Trips
5 "General Office Building" (Land Use 710) daily average rate from ITE Trip Generation, 9th Edition; Peak-hour trips based on
adjacent on-street parking usage on Pierce Street counted on Thursday, October 8th, 2015.
6 "Automobile Sales" (Land Use 841) daily average rate from ITE Trip Generation, 9th Edition ; Peak Hour trips based on adjacent
on-street parking usage on El Camino Real counted on Thursday, October 8th, 2015.
7 "Tire Store" (Land Use 848) daily average rate from ITE Trip Generation, 9th Edition; Peak-hour trips from driveway counts
conducted on Thursday, October 8th, 2015.
Land Use Size
Daily AM Peak Hour PM Peak Hour
Rate1 Trips Rate1
Trips
Rate1

Ms. Audrey Zagazeta April 1, 2016 Page 11 of 21
Trip Distribution and Assignment
The directional distribution of site-generated traffic to and from the main gateways to the project area is shown in Figure 5. The trip distribution pattern was developed based on existing traffic patterns in the study area and the location of complementary land uses. The peak-hour trips generated by the proposed project were then assigned to the roadway system in accordance with the trip distribution pattern and the location of the project driveways. The project trip assignment assumes the proposed driveway turn restrictions. Inbound left turns and outbound right turns would be prohibited to and from Pierce Street. Turning movements to and from the El Camino Real project driveway would be restricted to allow only right turns in and right turns out. The net project trips at all study intersections are shown on Figure 6.
El Camino Real Bus Rapid Transit (BRT)
The El Camino Real Bus Rapid Transit Project would upgrade the 522 Rapid Bus Route on El Camino Real to Bus Rapid Transit status. The locally preferred project alternative has not yet been selected. Transit improvements could include conversion of two lanes of El Camino Real (one lane in each direction, adjacent to the median) into dedicated BRT lanes that would use median stations. Alternatively, the BRT project may install curb bulbout stations at BRT stops, in which case, the BRT vehicle would operate in the right lane along with auto traffic. Existing 522 stations would be upgraded to more substantial, rail-like stations that feature weather protection, real-time next bus information and Clipper card tap stations. Both project alternatives would include the construction of a BRT bus station on both sides of the Scott Boulevard/El Camino Real intersection. The project may also install bicycle lanes on El Camino Real in areas where there are dedicated BRT lanes.
As the 522 Rapid Bus does today, the 522 BRT route would travel from the Palo Alto Transit Center to the Eastridge Transit Center, traveling through Downtown San Jose. Around 26 BRT stations would be served along the way. The line 22 local bus, which makes all local stops, would continue to operate in the right lane, as it does today.
The analysis of existing plus project conditions with BRT reflects traffic operations that would occur under the dedicated lane alternative. In addition to the reduction in through lanes on El Camino Real from three to two in each direction, the dedicated BRT lane alternative also would eliminate the El Camino Real median opening at Pierce Street. This would prevent left turns to and from Pierce Street.
Intersection Level of Service Analysis
The level of service analysis for the three study intersections was performed for existing, existing plus project, and existing plus project conditions with BRT. The existing lane geometries of all study intersections would remain unchanged under existing plus project conditions. The project trips were added to the existing traffic volumes to obtain existing plus project traffic volumes (see Figure 7).


Ms. Audrey Zagazeta April 1, 2016 Page 15 of 21
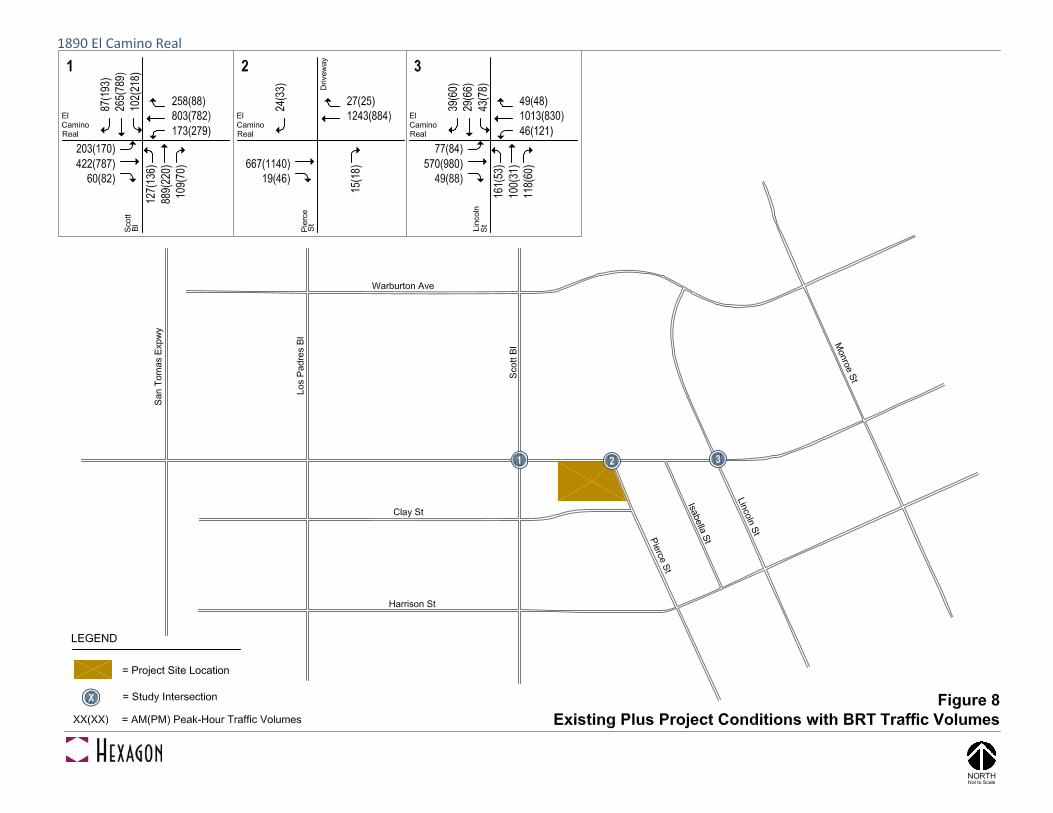
The intersection lane geometry under the existing plus project with BRT scenario reflects the dedicated BRT lane alternative, which would reduce the number of through lanes on El Camino Real available to automobiles from three to two in each direction. The dedicated lane BRT alternative also would eliminate the existing El Camino Real median opening at Pierce Street, causing the existing left turn movements at Pierce Street to be diverted to Scott Boulevard or Lincoln Street. The existing plus project conditions with BRT traffic volumes shown on Figure 8 reflect the reassignment of the existing left turns at Pierce Street. The project trip assignment also was revised to reflect the left-turn restriction at Pierce Street.
The intersection level of service results are summarized in Table 5. The results show that the project would have an insignificant impact at the study intersections based on the significance criteria established by the City of Santa Clara and the CMP. Table 5 Intersection Level of Service Summary
Peak Avg. Avg. Incr. In Incr. In Avg. Incr. In Incr. In
Study Intersection Hour Delay LOS Delay LOS Crit. Delay Crit. V/C Delay LOS Crit. Delay Crit. V/C
1 Scott Boulevard and El Camino Real* AM 36.3 D 36.4 D 0.1 0.002 37.2 D 2.4 0.091
PM 37.7 D 37.7 D 0.1 0.003 39.2 D 2.9 0.096
2 Pierce Street and El Camino Real AM 18.6 C 25.4 D n/a n/a 13.8 B n/a n/a
PM 26.4 D 39.5 E n/a n/a 13.0 B n/a n/a
3 Lincoln Street and El Camino Real* AM 26.1 C 26.2 C 0.1 0.001 25.7 C 1.4 0.125
PM 23.1 C 23.1 C 0.0 0.000 22.0 C -0.8 0.110
Notes:
* Denotes CMP designated intersection
At signalized intersections, overall average intersection delay and LOS are reported. At unsignalizedintersections, delay and LOS are reported for the worst stop-
controlled approach.
Intersection
Control
Signal
Existing
Conditions BRT Plus Project ConditionsExisting Plus Project Conditions
Signal
Side-Street
Stop
Site Access and On-Site Circulation
This section describes the site access and internal circulation for the proposed project. The site access and on-site circulation evaluation is based on the site plan dated August 18, 2015 and labeled “1890 El Camino Real” provided by Dahlin Group.
Site Access
The site access was evaluated to determine the adequacy of the site’s driveways with regard to the following: traffic volume, delays, vehicle queues, geometric design, and sight distance. Vehicular access to and from the project site / parking garage would be provided via two driveways, one on
Pierce Street and one on El Camino Real.. The site plan indicates that the Pierce Street driveway would be 24’ wide and would be restricted to allow only left turns out and right turns in. As per the plan, the El Camino Street driveway also is 24’ wide. There is a median on El Camino Real adjacent to the project site so the project driveway on El Camino Real would be restricted to on right turns in and right turns out. The driveways should be widened to comply with City of Santa Clara standards, which require that two-way driveways providing access to 25 or more residential parking spaces or garage spaces be a minimum of 26 feet wide (24-foot pavement with one-foot clearance on each side). The City requested the driveway turn restrictions to prevent potential traffic increases on Pierce Street, which is a local residential street. The turn restrictions would force all vehicles traveling to and from the project site to arrive and depart via El Camino Real.
Ms. Audrey Zagazeta April 1, 2016 Page 17 of 21
The estimated turning movements to and from the project site could be served easily by two driveways. The traffic volumes on Pierce Street are quite low such that delays turning in and out of the project driveway would be minimal.
Sight Distance at the Project Driveways
In general, the project driveways should be free and clear of any obstructions to optimize sight distance. Hexagon recommends that standard no parking zones be established adjacent to the project driveways to ensure that exiting vehicles can see pedestrians on the sidewalk, as well as vehicles on the road. Any landscaping and signage should be located in such a way to ensure an unobstructed view for drivers exiting the site.
On-Site Circulation
On-site vehicular circulation was reviewed in accordance with the City of Santa Clara Zoning Ordinance and generally accepted traffic engineering standards.
The proposed parking garage features two-way 26-foot wide drive aisles with 90 degree parking stalls on both sides. The aisle width satisfies the City’s minimum standard. Uniform size parking stalls (8’-6” wide by 16’-0” long) are proposed. The City’s code provides for standard size parking spaces (9’ wide by 18’ long) and up to 40 percent compact parking spaces (8’ by 16’). The uniform parking space dimensions may be approved under the proposed Planned Development zoning. Parking spaces that are not open on both sides must have an extra foot in width. The site plan shows that parking spaces located next to a wall would have a minimum width of 10 feet.
Resident parking will be gated so that commercial employees and visitors will be unable to access the residential parking. Remote access controls will be employed that will allow residents to open the gate for their guests. Circulation within the resident parking area is logical. One very long (approximately 150 foot) dead-end aisle with 17 stalls on one side is proposed. It is recommended that these spaces be used for assigned resident parking so that drivers who proceed down the dead-end aisle are certain to find an open space. Furthermore, ample space is provided at the end of the aisle to facilitate vehicles backing out of the end stall.
Pedestrian Access
The site plan shows that the existing sidewalks along the project frontages on El Camino Real and Pierce Street would be widened. The site plan also shows a pedestrian bulbout would be added on the southwest corner of the El Camino Real/Pierce Street intersection. Depending upon which alternative is selected by the VTA Board, the BRT project also would build pedestrian bulbouts on all four corners of the Scott Boulevard/El Camino Real intersection and two corners of the Lincoln Street/El Camino Real intersection.
Pedestrian entrances to the proposed commercial space are located along El Camino Real and Pierce Street and facing the commercial parking area. There is also a gated walkway that leads from the shared commercial parking spaces to the residential lobby.
Stairs and an elevator core are shown at the residential lobby on El Camino Real and immediately south of the parking garage entrance on Pierce Street that provide connections to the residential units on each of the floors above. Both stairs also would provide access to the adjacent streets to facilitate pedestrian access to and from the building. A third set of stairs would be provided along the western edge of the site that would connect the garage level to the upper levels. Lastly, a rear

Ms. Audrey Zagazeta April 1, 2016 Page 18 of 21
access point at the southeast corner of the project site would lead from the sidewalk on Pierce Street to another set of stairs located along the southern edge of the project site that provide pedestrian access to the podium level.
Truck Access
The site plan does not show any on-site loading zones. The project should designate loading zones along the project frontage for moving/delivery trucks. Fire and emergency access to the buildings would occur from the streets fronting the project.
Queuing
The traffic operations analysis focuses on vehicle queues at the Pierce Street/El Camino Real and Lincoln Street/El Camino Real intersections. Vehicle queues at the El Camino Real/Scott intersection are not expected to differ significantly as a result of the proposed project. The vehicle queue estimates and a tabulated summary of the findings are provided in Table 6.
El Camino Real and Pierce Street
The queuing analysis indicates that the northbound and westbound left turn at the El Camino Real/Pierce Street intersection are expected have no more than one car queued during the AM and PM peak hours without and with the project. The northbound left-turn storage shown in Table 6 represents the distance from the stop bar at El Camino Real to the proposed project driveway. The existing left-turn storage on the northbound and westbound approaches would be adequate for the projected 95th percentile queues. The project driveway on Pierce Street is not expected to be blocked by queues at the El Camino/Pierce intersection.
El Camino Real and Lincoln Street
The queuing analysis indicates that the existing left-turn pocket on eastbound El Camino Real would be adequate to accommodate the projected queue lengths during the peak AM and PM commute hours with and without the project. The planned BRT project would close the median at Pierce Street resulting in an increase in the left-turn and U-turn volume at Lincoln Street. Even so, the existing turn lane length is predicted to be adequate.
Parking Analysis
The site plan proposes a total of 113 parking spaces on site including 80 resident spaces and 33 shared commercial parking spaces. This parking lot includes 109 uniform parking spaces (78 spaces in the residential parking area and 31 spaces in the commercial parking area) and 4 Americans with Disability Act compliant parking stalls (2 spaces in the residential parking area and 2 spaces in the commercial parking area). All of the accessible spaces shown on the site plan are van accessible. The proposed parking garage would require a minimum of five accessible spaces including one van accessible space. The site plan should be modified to designate one more space within the residential parking area as an accessible space.

Ms. Audrey Zagazeta April 1, 2016 Page 19 of 21
Table 6 Vehicle Queuing and Left-Turn Pocket Storage Analysis
NBL NBL WBL WBL EBL EBL
Measurement AM PM AM PM AM PM
Existing
Cycle/Delay1 (sec) 18.3 26.4 8.8 10.9 120 120
Volume (vphpl ) 7 7 11 20 38 47
Avg. Queue (veh/ln.) 0.0 0.1 0.0 0.1 1.3 1.6
Avg. Queue2 (ft./ln) 1 1 1 2 32 39
95th %. Queue (veh) 1 1 1 1 3 4
95th %. Queue (ft.) 25 25 25 25 75 100
Storage (ft./ ln.) 60 60 125 125 170 170
Adequate (Y/N) Y Y Y Y Y Y
Existing + Project
Cycle/Delay1 (sec) 25.4 39.5 8.8 11 120 120
Volume (vphpl ) 21 15 13 26 39 48
Avg. Queue (veh/ln.) 0.1 0.2 0.0 0.1 1.3 1.6
Avg. Queue2 (ft./ln) 4 4 1 2 33 40
95th %. Queue (veh) 1 1 1 1 3 4
95th %. Queue (ft.) 25 25 25 25 75 100
Storage (ft./ ln.) 60 60 125 125 170 170
Adequate (Y/N) Y Y Y Y Y Y
BRT + Project
Cycle/Delay1 (sec) -- -- -- -- 120 120
Volume (vphpl ) -- -- -- -- 77 84
Avg. Queue (veh/ln.) -- -- -- -- 2.6 2.8
Avg. Queue2 (ft./ln) -- -- -- -- 64 70
95th %. Queue (veh) -- -- -- -- 5 6
95th %. Queue (ft.) -- -- -- -- 125 150
Storage (ft./ ln.) -- -- -- -- 170 170
Adequate (Y/N) -- -- -- -- Y Y
1 Vehicle queue calculations based on cycle length for signalized
intersections, and movement delay for unsignalized intersections.2 Assumes 25 feet per vehicle queued.
Pierce Street /
El Camino Real
Lincoln Street /
El Camino Real
The City of Santa Clara zoning regulations state that residential units in Mixed Use Combining Zoning Districts are required to provide one parking space for each studio; one and one-half spaces for each one bedroom unit; and two spaces for each two-plus bedroom unit. The parking analysis presented herein assumes the commercial space is occupied by retail use(s). In Mixed Use Combining Zoning Districts, the City of Santa Clara requires one parking space for each 200

Ms. Audrey Zagazeta April 1, 2016 Page 20 of 21
square feet of gross floor area for retail stores, shops and services. Based on these standards, the project would be required to provide 103 on-site parking spaces for residential parking and 33 on-site parking spaces for retail parking. The proposed on-site parking for retail use (33 spaces) would satisfied the City of Santa Clara zoning code regulations. However, the proposed on-site parking for residential use (80 spaces) would be 23 spaces less than the parking requirement needed for the proposed residential use (103 spaces).
Because residential parking demand peaks late at night, it is recommended that residents and guests be permitted to park in the commercial parking area after hours. The effectiveness of this shared parking arrangement will depend upon the business hours of the future retail tenant(s).
The proposed project will implement Transportation Demand Management (TDM) measures to reduce the parking demand of the proposed uses. TDM is a combination of services, incentives, facilities, and actions that reduce single-occupant vehicle (SOV) trips to help reduce traffic congestion, parking demand, and air pollution problems. The purpose of TDM is to promote more efficient utilization of existing transportation facilities, and to ensure that new developments are designed to maximize the potential for sustainable transportation usage. A Transportation Demand Management Plan will be submitted in a separate stand-alone document for the City’s approval.
The project also could make use of on-street parking spaces currently available along the project frontage on El Camino Real and Pierce Street. It should be noted that on-street parking on El Camino Real may be removed to add dedicated bicycle lanes or BRT service. It is recommended that residents also be permitted to park in the commercial parking area after hours to ensure an adequate supply of parking for residents during late night hours.
Bicycle Parking The City of Santa Clara does not have minimum parking requirements for bicycles. It is recommended that the project provide bicycle parking according to the recommendations contained in the VTA Bicycle Technical Guidelines, 2007. Based on the VTA recommendations, the project should have 19 Class I bicycle spaces plus 4 Class II bicycle spaces for the proposed residential uses. The recommended bicycle parking for the proposed retail space is 1 Class I space and 2 Class II spaces. A bicycle storage room with parking for 20 bikes is shown in the residential portion of the parking garage. Long term bicycle storage (bike lockers) with parking for 2 bikes is shown in the commercial parking garage near the El Camino Real driveway. Also bicycle racks with space to accommodate a minimum of 8 bicycles are provided near the entrances to the residential lobby and commercial space. The proposed bicycle parking would satisfy the need for both long-term and short-term bicycle parking by residents and employees.
Conclusions
The potential impacts of the project were evaluated in accordance with the standards set forth by the City of Santa Clara. The analysis of traffic operations under existing, existing plus project conditions and existing plus project conditions with BRT showed that the project would not cause any significant impacts at any of the study intersections.
Ms. Audrey Zagazeta April 1, 2016 Page 21 of 21
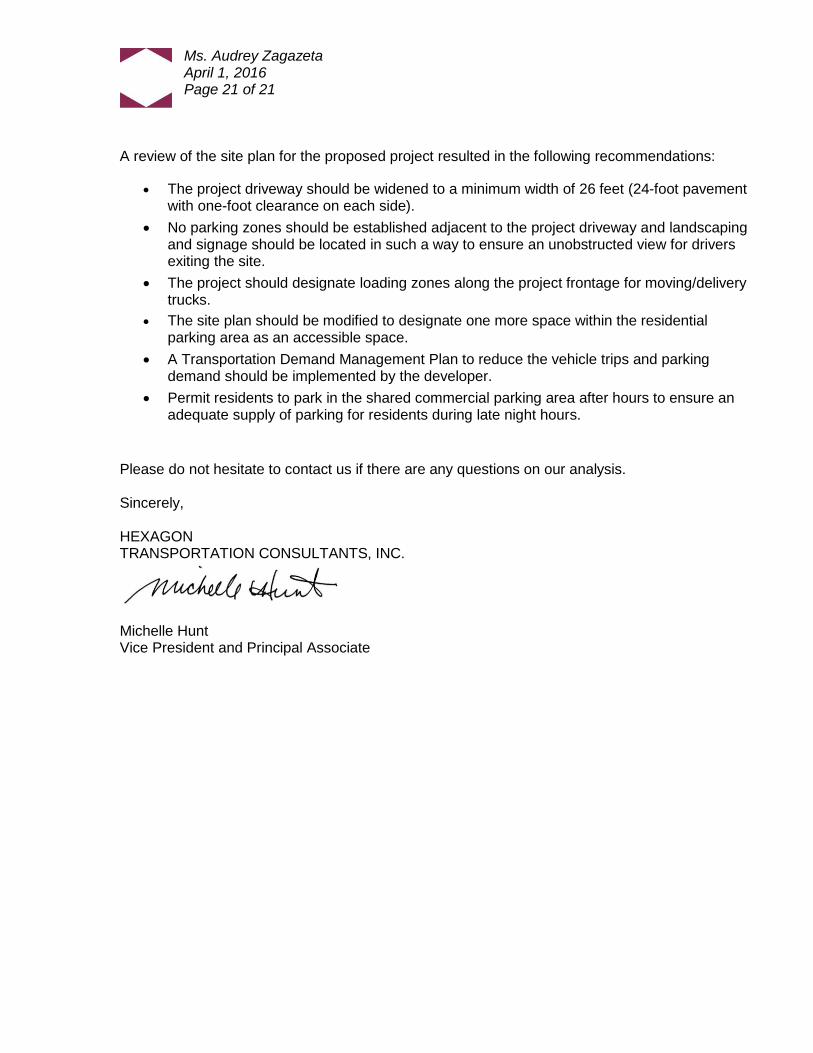
A review of the site plan for the proposed project resulted in the following recommendations:
The project driveway should be widened to a minimum width of 26 feet (24-foot pavement with one-foot clearance on each side).
No parking zones should be established adjacent to the project driveway and landscaping and signage should be located in such a way to ensure an unobstructed view for drivers exiting the site.
The project should designate loading zones along the project frontage for moving/delivery trucks.
The site plan should be modified to designate one more space within the residential parking area as an accessible space.
A Transportation Demand Management Plan to reduce the vehicle trips and parking demand should be implemented by the developer.
Permit residents to park in the shared commercial parking area after hours to ensure an adequate supply of parking for residents during late night hours.
Please do not hesitate to contact us if there are any questions on our analysis. Sincerely, HEXAGON TRANSPORTATION CONSULTANTS, INC.
Michelle Hunt Vice President and Principal Associate