Embed Size (px)
Citation preview
lo School of Life Science M
AST
ER
TH
ESIS
Estrogen action in
growth plate cartilage
Masters in Biomedicine; Master Thesis
30 ECTS (D-level)
Autumn 2011 (August 2011 – January 2012)
Report 1
Author: Ali Rafi
Email address: [email protected]
Supervisor: Professor Lars Savendahl
Email address: [email protected]
ESPE Secretary General
Department of Pediatric Endocrinology
Karolinska Institute and University Hospital
SE-171 76 Stockholm, Sweden
Examiner: Professor Abul Mandal
Email address: [email protected]
Department of Molecular Biology
School of Life Science
University of Skovde
SE-541 28 Skövde, Sweden

Abstract
Estrogen’s role in the human body is pivotal for a multitude of biological processes and it
acts as an initiator or modulator to bring about its physiological effects. It plays a
significant role in the bone mineral metabolism and linear growth in both sexes. Linear
growth in bones depends on the activity of the growth plate which comprises of resting,
proliferative and hypertrophic zones and all of these have estrogen receptors. The effects
of estrogen have been associated with two classical receptors (ER-α and ER-β). Recently
a trans-membrane estrogen receptor, GPER (G-Protein Coupled Estrogen Receptor) has
been discovered and its presence in the resting and the hypertrophic zones of the growth
plate has been confirmed. Presence of this receptor in the growth plate brings forward the
idea of its selective modulation for manipulation of growth. The aim of this project was
to do a pilot study comprising of a series of experiments utilizing IGF-1, GPER agonist
(G1) & antagonist (G15) in a specialized ex-vivo model of post-natal mice metatarsal
organ culture. We confirmed the already established findings that IGF-1 is the most
potent growth stimulator and report for the first time that bones exposed to G1-GPER
agonist at the dose concentration of 10 nM grow significantly more than the controls. No
effect of G15-GPER antagonist was seen on the growth plate even at high dose
concentration of 1 µM. However the exact mechanism of GPER action in the growth
plate needs to be evaluated in an in-depth in-vivo study.
Important terms and abbreviations
ALS Acid Labile Subunit
BMP Bone Morphogenic Peptide
BMD Bone Mineral Density
BSA Bovine Serum Albumin
DMSO Dimethyl Sulfoxide
ER-α Estrogen Receptor-alpha
ER-β Estrogen Receptor-beta
Ex-vivo Experiment done on a tissue in artificial environment
with minimum alteration of conditions
GH Growth Hormone
GPER G-Protein Coupled Estrogen Receptor
IGF-1 Insulin like Growth Factor-1
IGFBP Insulin like Growth Factor Binding Protein
PBS Phosphate buffered saline
PTHrP Parathyroid Hormone related Peptide
SD Standard Deviation
SE Standard Error

Table of content
Introduction 1
Materials and Method 6
Results 9
Discussion 14
Conclusion 17
References 17
Acknowledgments 22
1
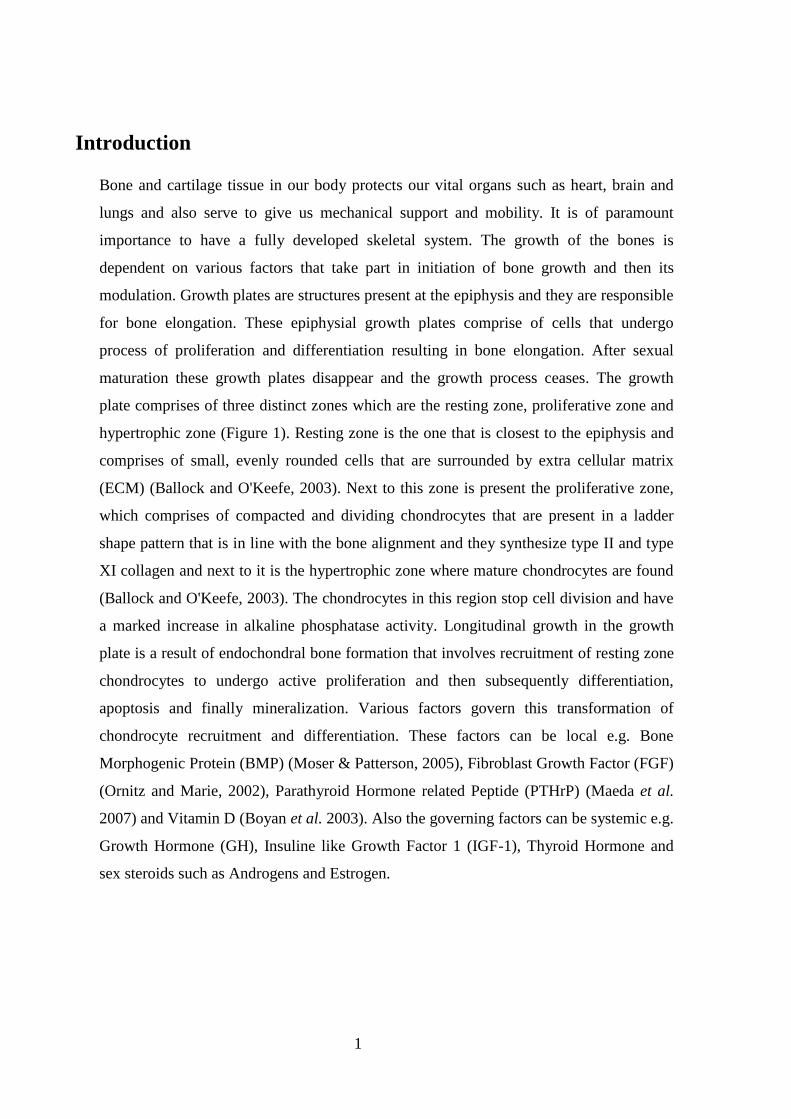
Introduction
Bone and cartilage tissue in our body protects our vital organs such as heart, brain and
lungs and also serve to give us mechanical support and mobility. It is of paramount
importance to have a fully developed skeletal system. The growth of the bones is
dependent on various factors that take part in initiation of bone growth and then its
modulation. Growth plates are structures present at the epiphysis and they are responsible
for bone elongation. These epiphysial growth plates comprise of cells that undergo
process of proliferation and differentiation resulting in bone elongation. After sexual
maturation these growth plates disappear and the growth process ceases. The growth
plate comprises of three distinct zones which are the resting zone, proliferative zone and
hypertrophic zone (Figure 1). Resting zone is the one that is closest to the epiphysis and
comprises of small, evenly rounded cells that are surrounded by extra cellular matrix
(ECM) (Ballock and O'Keefe, 2003). Next to this zone is present the proliferative zone,
which comprises of compacted and dividing chondrocytes that are present in a ladder
shape pattern that is in line with the bone alignment and they synthesize type II and type
XI collagen and next to it is the hypertrophic zone where mature chondrocytes are found
(Ballock and O'Keefe, 2003). The chondrocytes in this region stop cell division and have
a marked increase in alkaline phosphatase activity. Longitudinal growth in the growth
plate is a result of endochondral bone formation that involves recruitment of resting zone
chondrocytes to undergo active proliferation and then subsequently differentiation,
apoptosis and finally mineralization. Various factors govern this transformation of
chondrocyte recruitment and differentiation. These factors can be local e.g. Bone
Morphogenic Protein (BMP) (Moser & Patterson, 2005), Fibroblast Growth Factor (FGF)
(Ornitz and Marie, 2002), Parathyroid Hormone related Peptide (PTHrP) (Maeda et al.
2007) and Vitamin D (Boyan et al. 2003). Also the governing factors can be systemic e.g.
Growth Hormone (GH), Insuline like Growth Factor 1 (IGF-1), Thyroid Hormone and
sex steroids such as Androgens and Estrogen.

2
Resting zone Proliferative zone Hypertrophic zone
Figure 1: (Source: http://www.kumc.edu/instruction/medicine/anatomy/histoweb/bone/bone02.htm)
Hematoxylin and Eosin stained epiphysial growth plate section showing resting, proliferative and
hypertrophic zones of chondrocytes.
IGF-1 and its importance in bone physiology
Production of IGF-1, previously known as Somatomedin C, is stimulated by GH (Growth
Hormone) in the liver (Melmed, 1999). It is essential for growth of all tissues in the body
and produced in extrahepatic tissues (Ohlsson et al. 2009). In the growth plate, synthesis
of IGF-1 is mediated by interaction of NF-ƙB p65 with Stat5b in growth plate
chondrocytes (Wu et al. 2011). It has been shown that IGF-1 acts on the bone growth as a
local factor and also as a systemic factor (Liu et al. 1993). More than 90 % of IGF-1
circulates in the form of a complex that comprises of IGF binding proteins (IGFBP3 and
IGFBP5) and Acid Labile Subunit (ALS) (Boisclair et al. 2001). Individual genetic
ablation of one of these components (IGF Binding Proteins and Acid Labile Subunit)
results in development of minor skeletal abnormalities suggesting that the remaining free
IGF-1 in the serum overcompensates (Yakar et al. 2009). However, IGF-1 total knockout
mice models have shown marked growth impairment and bone destruction (Yakar et al.
2009). Hence IGF-1 presence in the body is very important in order for the bones to reach
their desired potential in terms of growth and development. IGF-1 binds to its receptor
3
IGF-R and brings about its effects (Butler AA et al. 1998). It has been shown that IGF-1
actually causes acceleration in the aging of the target cell. Increased life span has been
seen in cells in which ablation of daf-2 gene (gene encoding IGF-R) was introduced
(Dorman J.B et al. 1995). Thus the growth achieved by IGF-1 is due to accelerated
attainment of senescence by the cells in the growth plate.
Estrogen and its importance in bone physiology
Estrogen (17 β-estradiol) takes part in a multitude of physiological processes either as
initiator or modulator. The effects of estrogen in the body are highly documented and its
roles have been intensively studied. The effect of estrogen has been associated with the
presence of two classical nuclear estrogen receptors namely Estrogen Receptor-α (ER-α)
(Green et al. 1986; Greene et al. 1986) and Estrogen Receptor-β (ER-β) (Kuiper et al.
1996). Both of these are considered as factors that bring about ligand-activated
transcription. These factors are located in the cytosol where they bind estrogen molecules
and then this Estrogen-ER complex is translocated to the nucleus and there it interacts
with nuclear response elements which are present on the target gene promoter areas. ER-
α and ER-β are both expressed in the human growth plates (Nilsson et al. 2003A). ER-α
is present in the osteoblasts and mature osteocytes (Zaman et al. 2006) while ER-β is
present in osteoblasts, osteoclasts and osteocytes (Braidman et al. 2001).
Previously estrogen’s main physiological actions were generally considered to be
important in terms of female physiology. It brings about pubertal growth, development
and maintenance of female secondary sex characters thus playing the same role as played
by androgens in the male physiology. But the role of estrogen in male bone physiology
was highlighted in 1994 with the description of a case of estrogen receptor mutation
(Smith et al. 1994). The subject of the case study was a 28 year old 46 XY male who had
a height of 204 cm, a bone age of 15 years and the bone mineral density (BMD) of his
lumbar spine was 3 standard deviations (SD) below mean for his age. The striking feature
was that he was having open epiphyses and was still growing even though he was in the
third decade of his life. On further investigation, it was revealed that this subject had a
mutation in the ER-α gene. No response was seen on administration of transdermal
ethinlyl estradiol. The bone morphometric analysis revealed that his bones had a
markedly decreased mineral content with impaired bone structure but the periosteal

4
circumference remained unaffected. His serum androgen levels were normal and he had
normal male genitalia with bilateral descended testis having a volume of 25 ml each. His
sperm count was 18 million with viability being 18 % (normal is >50 %). All these
parameters indicated that the mutation in the ER-α was the cause of his skeletal disorder.
The role of estrogen in bone physiology was further highlighted in a case study of a
similar phenotype with aromatase deficiency (Conte et al. 1995). The subject, a 46 XX
female, had a mutation in the P450 (CYP19) gene that resulted in high levels of
androgens with no serum estradiol. Her bone age was found to be 10 years at a
chronological age of 14 and half. She was given estrogen therapy that resulted in bone
development and also development of secondary sex characters.
These case studies clearly indicated that estrogen is not only important for female bone
physiology but also plays a modulating role in male bone physiology. It is important for
proper mineralization of the bones in both sexes and bone growth is impaired if the
exposure to estrogen is low or if there is hampering of the estrogen action due to a
mutation in ER-α.
A third estrogen receptor has now been discovered and it is not a nuclear receptor. It is a
G-protein coupled receptor and it was initially given the designation of GPR30. It is from
the 7-transmembrane G protein receptor family and it was cloned in the late 1990s
(Carmeci et al. 1997). It was later shown to be localized on the endoplasmic reticulum
and on activation by estradiol, calcium ion influx was shown to be induced along with
synthesis of phosphatidylinositol 3, 4, 5 phosphate (Revanker et al. 2005). Also, adenylyl
cyclase activation due to GPR30 has been elicited (Filardo et al. 2002). This new
estrogen receptor is now termed as GPER (G-Protein coupled Estrogen Receptor) and its
presence has been confirmed in tissues such as brain, pancrease, cardiovascular system
and immune system (Prossnitz, E.R & Barton, M 2011). The GPER (GPR30) is also
expressed in the human growth plate (Chagin et al. 2007b) and the expression is similar
in both sexes. It is expressed by all three types of bone cells, osteoblasts, osteoclasts and
osteocytes (Heino TJ et al. 2009). It is present in the resting and hypertrophic zone but
not in the proliferative zone of the growth plate (Chagin & Savendahl 2007b).
Interference with the functioning of the GPER causes disruption of known actions of
estrogen on the growth plate (Windahl S. et al 2009). GPER expression in the growth
plate declines as puberty progresses and its presence has been linked with roles such as
5
resting chondrocyte recruitment and hypertrophic chondrocyte differentiation (Chagin &
Savendahl 2007b).
Presence of GPER in the growth plate and extensive documentation of estrogen action on
bone growth during puberty has lead to assumption of the possibility that estrogen
receptors can be targeted in order to manipulate bone growth. Non-selective estrogen
therapy is not without side effects and attempts are now being made in order to come up
with a modality that selectively targets estrogen receptors in the growth plate cartilage.
The idea of growth modulation by targeting estrogen receptors has lead the researchers to
look for and come up with SERMs (Selective Estrogen Receptor Modulators). The aim
has been to target the estrogen receptors only in the growth plate with minimal
stimulation of estrogen receptors elsewhere in the body. These attempts lead to the
synthesis of ligands for GPER that do not have affinity for other estrogen receptors. One
of these ligands is a selective agonist of GPER called G1 (Bolaga et al. 2006). The
availability of this selective agonist for GPER has immensely enhanced the
understanding of the relatively unknown mode of action of this estrogen receptor and
currently its role is being scrutinized in various kinds of disease models and conditions
that are influenced by estrogen action. Attempts were made then to come up with a
selective antagonist for the GPER and a compound was synthesized that shows
antagonistic properties on binding with GPER. This antagonist is called G15 (Dennis MK
et al. 2009). Both G1 and G15 are based on a scaffold of tetrahydro-3H-
cyclopenta[c]quinoline (Dennis MK et al. 2011).
Objective and rationale
This study comprises of a series of pilot experiments that were conducted in order to
evaluate the agonist and antagonist compounds of GPER in an ex-vivo mice metatarsal
organ culture model and it is the first testing of GPER-agonist and antagonists in a
specialized organ culture model specifically designed to study bone growth. The aim has
been to provide proof of concept that GPER can be evaluated as a possible drug target for
growth manipulation in bones. The effects on growth are studied in metatarsal bones of
3-day old post-natal mice. The C57BL/6 strain of mice was used in these experiments.
Organ cultures with IGF-1 were performed first in order to establish procedural
parameters and also to reproduce already verified effects of IGF-1 on metatarsal bones

6
(Chagin et al. 2010). Subsequently, G1 and G15 effects were then studied in order to
fully understand as to how much growth stimulation can be achieved compared to IGF-1
which is the most potent growth stimulator. This study is part of a bigger project and the
overall objective of the project is to ascertain the roles of estrogen in the growth plate and
to determine its potential with regards to manipulation of growth. This study also serves
as to lay ground work for discovery of alternate modalities to growth hormone (GH)
treatment in cases of growth stunting and also a non-invasive medical alternative to
growth plate removal surgery in cases of too much growth.
Materials and method
For this study a threefold step-wise experiment plan was devised. First series of
experiments involved ex-vivo treatment of metatarsal bones with IGF-1. It was done in
order to reproduce already verified effects and to check other procedural parameters and
gain familiarity with the technique. After the IGF-1 experiments, two subsequent series
of experiments were planned with G1-GPER agonist and G15-GPER antagonist.
Mice Metatarsal Organ Culture
It is a model in which longitudinal growth can be studied in real-time in an ex-vivo
culture of fetal or postnatal rat/mice metatarsal bones and has been established in the host
laboratory (Martensson et al. 2004).
Micro dissection of Metatarsals
Ex-vivo culture of metatarsals from 3-day old post natal mice was performed in order to
see the effects of IGF-1, GPER agonist and antagonists on growth plate. The mice were
ordered 23 days before the planned date of experiment. The gestation period of mice is
approximately 20 days. On the day of the experiment the mice were sacrificed by
administration of CO2 and then micro dissection was carried out to obtain metatarsal
bones. DMEM/F12 (without phenol red) was used as the media for these experiments and
was purchased from Invitrogen, Inc. Media without phenol red was used as phenol red
itself acts as a weak estrogen (Y Berthois et al. 1986). The media for dissection was
supplemented with 20 μg/ml gentamycin (Invitrgoen, Inc) while the media for culturing
was supplemented with 0.2% endotoxin free fraction V BSA (Bovine Serum Albumin
7
purchased from Sigma-Aldrich, Inc), 50 μg/ml ascorbic acid (ICN, Inc), 1 mM β sodium
glycerophosphate (Sigma-Aldrich, Inc) and 20 μg/ml gentamycin (Invitrogen, Inc).
Stock solutions for supplements: 10% BSA in PBS (Phosphate buffered saline)
1 M β sodium glycerophosphate
50mg/ml ascorbic acid in distilled water
In the lab the metatarsal dissection was carried out microscopically. Hind limbs were
used in order to obtain the metatarsals for all experiments. First the hind limbs were
separated from the main torso with the help of scissors. Then the hind limb was placed
inside a Petri dish containing dissection media. Incisions in the skin were made on the
dorsal and ventral side of the limbs and then the skin was peeled off using forceps leaving
only the bones and the connective tissue. The connective tissue was removed by using 30
gauge insulin syringes as knife under the microscope to clear out the bones and to cut
precisely the metatarsal-phalangeal junction. Special care needs to be taken at this step as
the bones are very fragile and growth plates can easily break if not handled carefully. The
middle three metatarsals were used in these experiments. Once the bones were liberated,
they were put into 24 well plates for culture. This study was approved by the ethics
committee at Karolinska Institute.
G1 Experiment
The limbs of the animals were dissected out under the microscope and then the
metatarsals were obtained by removing the connective tissues using an insulin syringe as
knife. The metatarsals from each animal’s right paw were collected in one Petri-dish
containing culturing media and the metatarsals from left paw were collected in another
Petri-dish. The right paw bones were used as treated and the left paw bones were used as
controls. After dissecting out all the paws, the collected bones were put in individual
wells of a 24 well plate and treated with 1 mL of media along with 1 uL of stock
solutions of G1. The stock solutions were prepared in DMSO.
Stock solutions: 1 mM, 100 µM, 10 µM
The final treatments obtained: 1 mL media + 1 µL 1mM (stock) = 1 µM
1 mL media + 1 µL 100 uM (stock) = 100 nM
1 mL media + 1 µL 10 uM (stock) = 10 nM
8
These final treatments were selected by random. Bones from two animals were taken for
each treatment with right paw bones being “treated” and left paw bones being “controls”.
The controls were treated with DMSO vehicle. The time period for the culture was 16
days with length measurements and media change done as per following schedule,
Days: 0, 2, 4, 7, 9, 11, 14, 16
The bones on these time points were retreated with the same concentration of G1 along
with media change. On day 16 the experiment was terminated with final measurements
taken. The bones were then placed in 4 % formaldehyde overnight for preservation. After
overnight placement in formaldehyde the bones were shifted to 70 % ethanol for storage.
Bone length measurements
Digital images of the cultured bones were taken using a stereo microscope (Nikon SMZ-
U) that was connected to a digital camera (Hamamatsu C4742-95) and a desktop
computer. Analysis of the images and measurements were done using the software ImajeJ
(developed by NIH). The pictures were compared with scale of 1000 µm (micrometer) in
order to calculate their length. The measurements were then put in an excel sheets where
further analysis was performed.
Analysis
First the increase in lengths of the bones at each time point of the duration of culture was
calculated. This was stratified according to treatment categories and control categories.
Then averages of increase in bone length for each treatment group and controls were
calculated for each time point in the culture. Then the standard deviation was calculated
for all observations of increase in length for each day of media change and
measurements. From standard deviation, standard error was calculated by using the
following formula,
SE = Standard Deviation (SD)/ Sqaure root (n)
where n = number of observations
The data was then plotted on a line graph with increase in length (micrometers) readings
placed on the y-axis and duration of culture (days) on the x-axis. Error bars were placed
on each time point where bone lengths were measured. To check for significance of
results, unpaired student t-test was used in excel sheets to calculate the p-values.

9
Apart from a line graph, a bar graph was also plotted with error bars for G1 results
representing the increase in bone lengths in percentages compared to specific controls.
The controls were taken as 100 percent and the increase in length was taken at midway
and end of the experiment to show the increase in length in percentages of the treated
group.
G15 Experiment
For G15 experiment a slight modification to the existing protocol was made. The
modification was that all the bones were pooled together after dissection and then
assigned to different treatment groups by random. The G15 stocks and treatment dosages
were prepared in the same way as G1 treatments. Five bones were placed in each group
and then measured accordingly. The media was changed with retreatment of bones done
as per following schedule, day 0, 3, 5, 7, 10, 12 and 14. The rest of the procedure,
analysis, calculations and presentation of data were done as described earlier.
IGF-1 Experiment
Same approach was applied to IGF-1 experiment as applied to G15. The bones were
pooled and then placed in two groups of “treated” and “controls”. The treated group was
exposed to IGF-1 (1µg/ml) and the controls were treated with vehicle. Two experiments
were performed and the media was changed according to following schedule, day 0, 2, 4,
7, 9 and 12 in experiment 1 while in experiment 2, it was 0, 3, 5, 7, 10, 12 and 14. The
rest of the procedure, analysis and calculations were done as described earlier.
Results
Effects of IGF-1 on bone growth
IGF-1(1 µg/ml) treatment causes increase in bone growth and its effects on the bone
growth are remarkable compared to controls. The difference in growth between the IGF-1
treated bones and controls was significant and this difference was maintained throughout
the culture duration of the experiment. The difference on day 12 (Figure 2) in experiment
1 and day 14 (figure 3) in experiment 2 is significant (***p < 0.001 vs control, unpaired
student t test) (Figure 2 and 3). Data represents mean ± standard error with n=4 (figure 2)
10
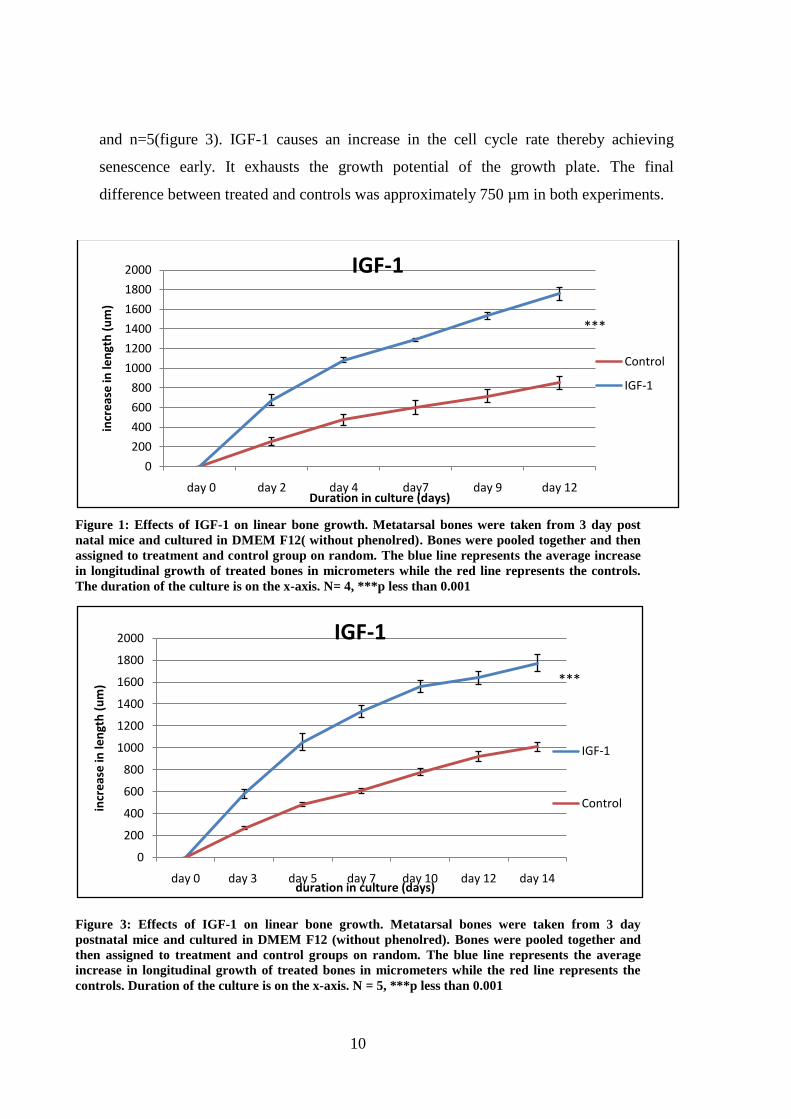
and n=5(figure 3). IGF-1 causes an increase in the cell cycle rate thereby achieving
senescence early. It exhausts the growth potential of the growth plate. The final
difference between treated and controls was approximately 750 µm in both experiments.
Figure 1: Effects of IGF-1 on linear bone growth. Metatarsal bones were taken from 3 day post
natal mice and cultured in DMEM F12( without phenolred). Bones were pooled together and then
assigned to treatment and control group on random. The blue line represents the average increase
in longitudinal growth of treated bones in micrometers while the red line represents the controls.
The duration of the culture is on the x-axis. N= 4, ***p less than 0.001
Figure 3: Effects of IGF-1 on linear bone growth. Metatarsal bones were taken from 3 day
postnatal mice and cultured in DMEM F12 (without phenolred). Bones were pooled together and
then assigned to treatment and control groups on random. The blue line represents the average
increase in longitudinal growth of treated bones in micrometers while the red line represents the
controls. Duration of the culture is on the x-axis. N = 5, ***p less than 0.001
0
200
400
600
800
1000
1200
1400
1600
1800
2000
day 0 day 2 day 4 day7 day 9 day 12
incr
eas
e in
len
gth
(u
m)
Duration in culture (days)
IGF-1
Control
IGF-1
***
0
200
400
600
800
1000
1200
1400
1600
1800
2000
day 0 day 3 day 5 day 7 day 10 day 12 day 14
incr
eas
e in
len
gth
(u
m)
duration in culture (days)
IGF-1
IGF-1
Control
***

11
G1-GPER Agonist
The effects of G1 agonist on bone growth were tested. G1 agonist is a stimulatory ligand
of GPER. In our experiment we found that G1 stimulated bone growth (Figure 4). The
most efficient concentration was 10nM (p<0.01 versus control). At higher concentrations
of 100 nM and 1 µM, no stimulatory effect was observed and growth pattern was very
much similar to vehicle treated control bones (Figure 5, 6). Data represents mean ±
standard error. n=6, **p<0.01, versus control (unpaired student t-test).
Figure 4: Effects of G1 10 nM; GPER agonist on metatarsal growth. Metatarsal bones were taken
from 3 day postnatal mice and cultured in DMEM F12 (without phenolred). Bones from one paw
were taken as “treated” and bones from the other paw were taken as “control”. The blue line
represents the average increase in longitudinal growth in the treated group and the red line
represents the control group. X-axis represents the duration of the culture. N= 6, **p less than 0.01.
0
200
400
600
800
1000
1200
1400
day 0 day 2 day 4 day 7 day 9 day 11 day 14 day 16
Incr
eas
e in
len
gth
(u
m)
Duration in culture (days)
G1- 10 nM
10 nM
10 nM Control
**

12
Figure 5: Effects of G1 100 nM; GPER agonist on metatarsal growth. Metatarsal bones were taken
from 3 day postnatal mice and cultured in DMEM F12 (without phenolred). Bones from one paw
were taken as “treated” and bones from the other paw were taken as “control”. The blue line
represents the average increase in longitudinal growth of treated bones in micrometers while the
red line represents the controls. The duration of the culture is represented on the x-axis. N=6, p>
0.05
Figure 6: Effects of G1 1 µM; GPER agonist on growth. Metatarsal bones were taken from 3 day
postnatal mice and cultured in DMEM F12 (without phenolred). Bones from one paw were taken as
“treated” and bones from the other paw were taken as “control”. The blue line represents the
average increase in longitudinal growth of treated bones in micrometers while the red line
represents the controls. X-axis represents the duration of the culture n=6, p>0.05
0
200
400
600
800
1000
1200
1400
day 0 day 2 day 4 day 7 day 9 day 11 day 14 day 16
Incr
eas
e in
len
gth
(u
m)
Duration in culture (days)
G1 100 nM
100 nM
100 nM Control
0
200
400
600
800
1000
1200
day 0 day 2 day 4 day 7 day 9 day 11 day 14 day 16
Incr
eas
e in
len
gth
(u
m)
Duration in culture (days)
G1 1 µM
1 uM
1 uM Control
13
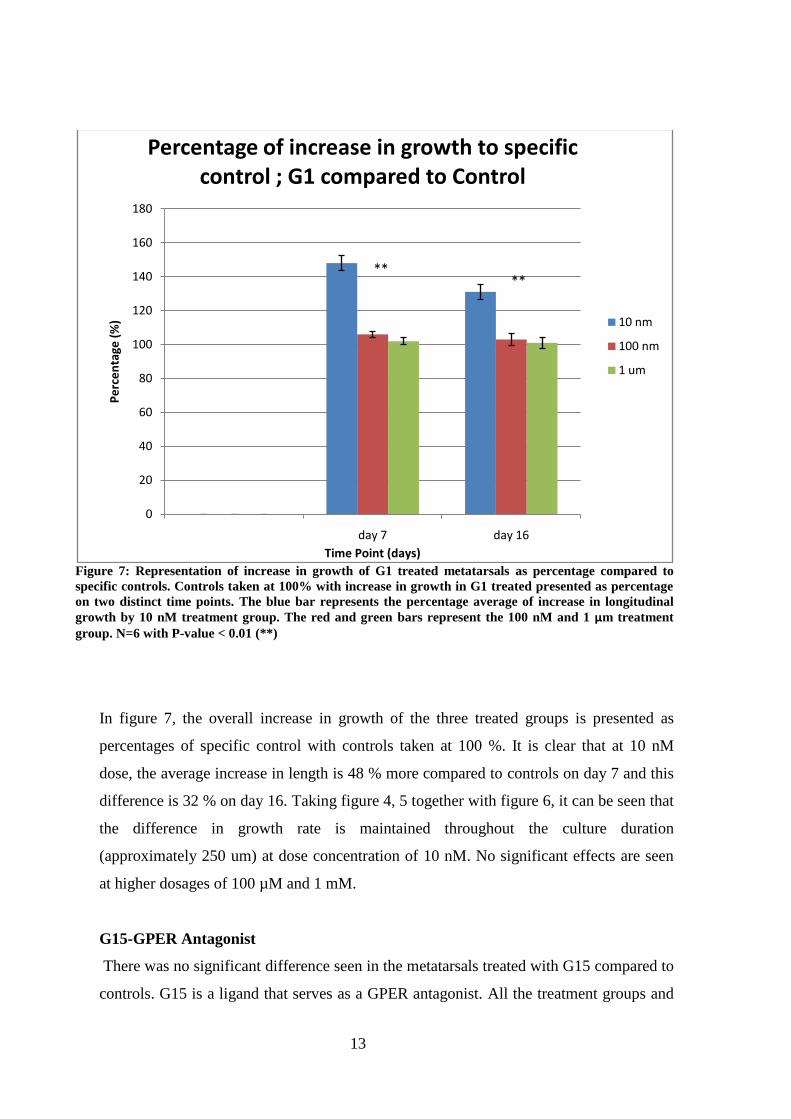
Figure 7: Representation of increase in growth of G1 treated metatarsals as percentage compared to
specific controls. Controls taken at 100% with increase in growth in G1 treated presented as percentage
on two distinct time points. The blue bar represents the percentage average of increase in longitudinal
growth by 10 nM treatment group. The red and green bars represent the 100 nM and 1 μm treatment
group. N=6 with P-value < 0.01 (**)
In figure 7, the overall increase in growth of the three treated groups is presented as
percentages of specific control with controls taken at 100 %. It is clear that at 10 nM
dose, the average increase in length is 48 % more compared to controls on day 7 and this
difference is 32 % on day 16. Taking figure 4, 5 together with figure 6, it can be seen that
the difference in growth rate is maintained throughout the culture duration
(approximately 250 um) at dose concentration of 10 nM. No significant effects are seen
at higher dosages of 100 µM and 1 mM.
G15-GPER Antagonist
There was no significant difference seen in the metatarsals treated with G15 compared to
controls. G15 is a ligand that serves as a GPER antagonist. All the treatment groups and
0
20
40
60
80
100
120
140
160
180
day 7 day 16
Pe
rce
nta
ge (
%)
Time Point (days)
Percentage of increase in growth to specific control ; G1 compared to Control
10 nm
100 nm
1 um
****
14
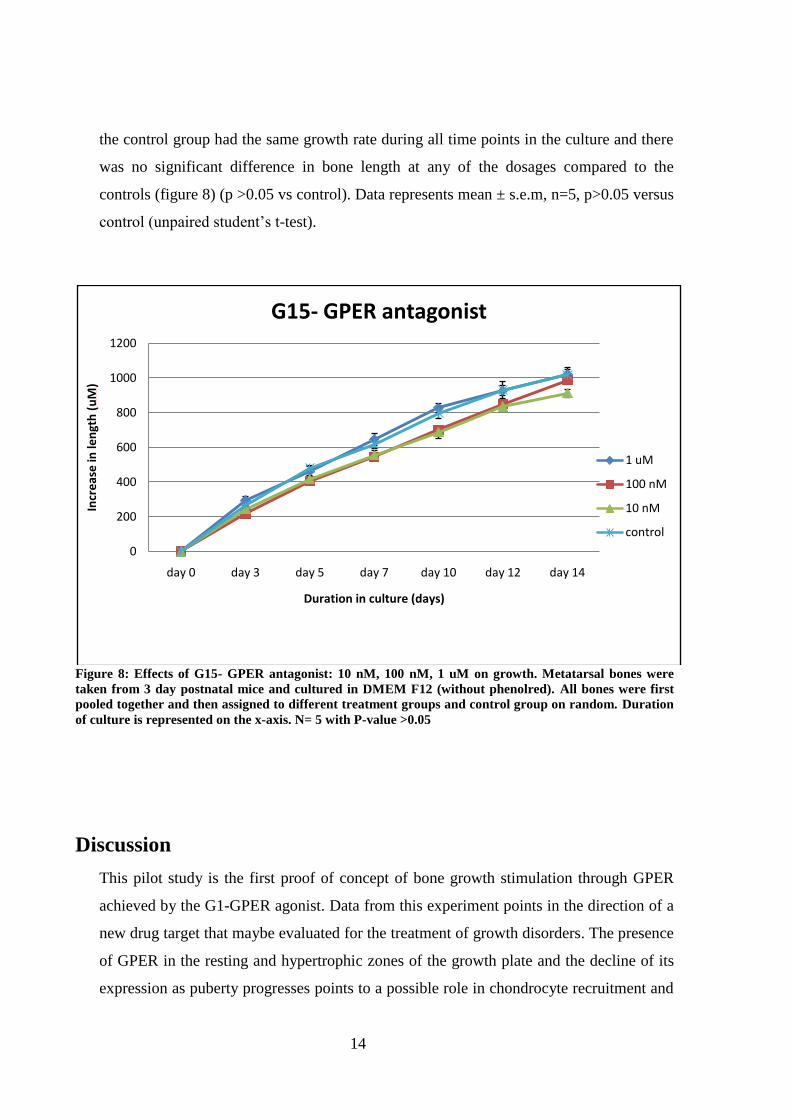
the control group had the same growth rate during all time points in the culture and there
was no significant difference in bone length at any of the dosages compared to the
controls (figure 8) (p >0.05 vs control). Data represents mean ± s.e.m, n=5, p>0.05 versus
control (unpaired student’s t-test).
Figure 8: Effects of G15- GPER antagonist: 10 nM, 100 nM, 1 uM on growth. Metatarsal bones were
taken from 3 day postnatal mice and cultured in DMEM F12 (without phenolred). All bones were first
pooled together and then assigned to different treatment groups and control group on random. Duration
of culture is represented on the x-axis. N= 5 with P-value >0.05
Discussion
This pilot study is the first proof of concept of bone growth stimulation through GPER
achieved by the G1-GPER agonist. Data from this experiment points in the direction of a
new drug target that maybe evaluated for the treatment of growth disorders. The presence
of GPER in the resting and hypertrophic zones of the growth plate and the decline of its
expression as puberty progresses points to a possible role in chondrocyte recruitment and
0
200
400
600
800
1000
1200
day 0 day 3 day 5 day 7 day 10 day 12 day 14
Incr
eas
e in
len
gth
(u
M)
Duration in culture (days)
G15- GPER antagonist
1 uM
100 nM
10 nM
control
15
hypertrophic chondrocyte differentiation (Chagin & Savendahl 2007). This decline that
was observed in the resting zone takes place in parallel in both boys and girls however in
the hypertrophic zone the decline in girls has been seen to occur much earlier compared
to boys. Since pubertal growth spurt occurs much earlier in girls compared to boys, hence
this can be an indicator that GPER takes part in pubertal growth spurt and subsequent
growth plate closure.
This study demonstrates that at the concentration of 10 nM, G1 was able to stimulate
growth in ex-vivo culture of metatarsal bones that was significantly more than the
controls (Figure 3). It is surprising that the maximum effect on bone growth is observed
at the smallest dose concentration in our treatment range. There was no observation of
any kinds of effect at higher dosages of 100 µM and 1 mM. But since the dosage
selection was made on random hence it cannot be concluded that 10 nM is the most
effective dose to see GPER agonistic activity of G1 in growth plate. In contrast to the
agonist, the G15-GPER antagonist treatment of the metatarsal bones did not reveal any
significant effect compared to controls. One possible reason for this lack of activity can
be the fact that G15 even though has antagonistic relation with GPER, still it has been
reported to have binding affinity for ER-α (Dennis MK. et al. 2011). This cross reaction
of G15 with ER-α may have been the reason behind lack of activity in treated groups
compared to controls. Other reason could be that since the treatment dose concentrations
were selected randomly hence it could be that range of effective dose concentrations may
not have been covered.
A new GPER-antagonist has been developed that has been shown to have minimum cross
reactivity with ER-α while retaining its antagonistic activity towards GPER and it has
been given the designation of G36 and is an isosteric derivative of G1 (Dennis MK. et al.
2011). G36 has not been evaluated in terms of its GPER antagonistic effects on growth
plate. It will be interesting to see the effects of G36 in our model. An antagonistic
potential may render it to be considered as a suitable drug candidate for a non-invasive
treatment for excessive growth.
Already verified effects of IGF-1on growth plate (Chagin et al. 2010) were also observed
in this study. The increase in growth that was seen in G1 treated bones (figure 3) is not as
much compared to IGF-1 treated bones (figure 2, 3). Still it is substantial enough to
suggest further probing into selective modulation via GPER by using in-vivo studies. As
16
mentioned earlier, IGF-1 brings about its effect by accelerating the cell cycle thus
attaining senescence. So basically, to achieve its effects it exhausts the growth potential
of cells. Because of that, phenomenon of catch-up growth is seen in control bones in
prolonged cultures. It is highly desirable to come up with a growth modulator that does
not affect the senescence of cells. Work is being done to evaluate the potential of GH
therapy in combination with IGF-1. No promising data has emerged so far showing that
GH in combination with IGF-1 has any synergism. It is a speculation that IGF-1 may be
shelved in the coming days and may not be available for treating growth stunting. GH
treatment will then be the only option available.
Also, on the other end of the spectrum, surgical removal of the growth plate is being
offered as therapeutic option to selective number of cases that have too much growth.
This increased acceleration of growth during pubertal development maybe a consequence
of either an increased GH production or constitutional tall stature due to inheritance.
High-dose estrogen treatment has been used for too much growth as well as it effectively
reduces adult height in extremely tall girls by inducing closure of epiphyseal end plates
(Goldzieher, 1956; Venn et al. 2008). But the side effects can range from decreased
fertility in adult life to premature ovarian failure (Hendriks et al. 2011). It may also
induce the risk of deep venous thrombosis (Weimann and Brack, 1996) and also may
render the subject vulnerable to breast cancer and gynecological cancers (Genazzani et al.
2001).
Hence, modulation of bone growth via GPER agonist and antagonist can be an alternative
to the above mentioned treatments. An agonist will be a cheaper alternative to GH
treatment which is highly expensive. An antagonist will give a preferable non-invasive
treatment modality as an alternative to growth plate removal surgery. Also, as articular
and growth plate chondrocyte regulation is pretty similar, hence this new modality maybe
modified for a wider spectrum of disorders that may include osteoarthritis and
osteoporosis.
GPER is a relatively recent discovery and not much is known about its role in the human
physiology. GPER role is being documented in the context of other disease models as
well. It has been shown in-vivo GPER knockout mice models that deletion of GPER gene
results in impaired glucose tolerance and reduced skeletal growth and it is required for
normal glucose homeostasis and bone growth (Mårtensson U.E et al. 2008). It has also

17
been localized in the human and rat heart and its stimulation has been shown to be cardio
protective (Patel VH et al. 2010). These findings are suggestive of a wider spectrum of
roles in the human physiology that GPER may be contributing to and targeting GPER
may not just be beneficial for bone growth and modulation but also, it might lead us to
discover newer and better suited therapeutic agents for a range of medical disorders.
Conclusion
This pilot study has for the first time put forward satisfactory data showing that G1
treatment with 10 nM concentration increases growth in ex-vivo culture of mouse
metatarsal bones compared to controls. This effect needs to be validated further by
careful planning of metatarsal organ cultures over a prolong period of time in order to
ascertain how persistent the effect is (3 month culture). This pilot study opens a gateway
to further studies that aim to evaluate and ascertain the mechanism of action of GPER in
the growth plate. These studies should be focused on evaluating the effects of G1 on
chondrocyte proliferation, differentiation and apoptosis in-vivo and should also be able to
answer questions such as optimum dose range for G1, its therapeutic window and its
effects on other tissues that contain GPER. The signaling pathways of GPER can be
studied by utilizing G-protein and protein kinase C knockout mouse models. We did not
see any effects of G15 on the growth plate in our cultures with possible reason being
cross reactivity with ER-alpha. The new GPER antagonist G36 which has been reported
to have very low cross reactivity profile with ER-alpha needs to be evaluated.
References
1. Bologa CG, Revankar CM, Young SM, Edwards BS, Arterburn JB, Kiselyov AS,
Parker MA, Tkachenko SE, Savchuck NP, Sklar LA, Oprea TI, Prossnitz ER.2006.
Virtual and biomolecular screening converge on a selective agonist for GPR30. Nat
Chem Biol. Apr;2(4):207-12

18
2. Boyan, B.D., Sylvia, V.L., Mckinney, N., and Schwartz, Z. (2003). Membrane
actions of vitamin D metabolites 1alpha, 25(OH) 2D3 and 24R, 25(OH) 2D3 are
retained in growth plate cartilage cells from vitamin D receptor knockout mice. J Cell
Biochem 90, 1207-1223
3. Braidman IP, Hainey L, Batra G, Selby PL, Saunders PT, Hoyland JA. Localization
of estrogen receptor beta protein expression in adult human bone. J Bone Miner
Res. 2001 Feb; 16(2):214-20
4. Butler AA, Yakar S, Gewolb IH, Karas M, Okubo Y, LeRoith D .Insulin-like growth
factor-I receptor signal transduction: at the interface between physiology and cell
biology. Comp Biochem Physiol B Biochem Mol Biol. 1998 Sep;121(1):19-26
5. Carmeci C, Thompson DA, Ring HZ, Francke U, Weigel RJ. Identification of a gene
(GPR30) withhomology to the G-protein-coupled receptor superfamily associated
with estrogen receptor expression in breast cancer. Genomics 1997;45:607–617
6. Chagin AS, Lindberg MK, Moverare S, Andersson N, Gustafsson J-Å, Sävendahl L
and Ohlsson C. 2004. Estrogen Receptor- Inhibits Skeletal Growth and has the
Capacity to Mediate Growth Plate Fusion in Female Mice. J Bone Mineral Res.
19:72-77
7. Chagin AS , Sävendahl L. 2007A. Oestrogen receptors and linear bone growth. Acta
Paediatr 96:1275-9
8. Chagin AS, Sävendahl L. 2007B. GPR30 estrogen receptor expression in the growth
plate declines as puberty progresses. J Clin Endocrinol Metab 92:4873-7
9. Chagin AS, Karimian E, Sundström K, Eriksson E, Sävendahl L. 2010. Catch up
growth after dexamethasone withdrawal occurs in cultured postnatal rat metatarsal
bones. J Endocrinol. 204:21–29
10. Conte FA, Grumbach MM, Fisher CR, Simpson ER. 1994. A syndrome of female
pseudohermaphrodism, hyper-gonadoropic hypogonadism, and multicystic ovaries
associated with missense mutation in the gene encoding aromatse (P450arom). J Clin
Endocrinol Metab 78:1287-92
19
11. Dennis MK, Burai R, Ramesh C, Petrie WK, Alcon SN, Nayak TK, Bologa CG,
Leitao A, Brailoiu E, Deliu E, Dun NJ, Sklar LA, Hathaway HJ, Arterburn JB, Oprea
TI, Prossnitz ER. 2009. In vivo effects of a GPR30 antagonist. Nat Chem Biol. 5:421-
7.
12. Dennis MK, Field AS, Burai R, Ramesh C, Petrie WK, Bologa CG, Oprea TI,
Yamaguchi Y, Hayashi S, Sklar LA, Hathaway HJ, Arterburn JB, Prossnitz ER.
Identification of a GPER/GPR30 antagonist with improved estrogen receptor
counterselectivity. J Steroid Biochem Mol Biol. 2011 Nov;127(3-5):358-66.
13. Dorman J B, B. Albinder, T. Shroyer, and C. Kenyon. The Age-1 and Daf-2 Genes
Function in a Common Pathway to Control the Lifespan of Caenorhabditis Elegans.
Genetics. 1995 December; 141(4): 1399–1406
14. Filardo EJ, Quinn JA, Frackelton AR Jr, Bland KI. Estrogen action via the G protein-
coupled receptor, GPR30: stimulation of adenylyl cyclase and cAMP-mediated
attenuation of the epidermal growth factor receptor-to-MAPK signaling axis. Mol
Endocrinol 2002; 16:70–84
15. Genazzani, A.R., Gadducci, A., and Gambacciani, M. (2001). Controversial issues in
climacteric medicine II. Hormone replacement therapy and cancer. Maturitas 40, 117-
130
16. Green, S., Walter, P., Greene, G., Krust, A., Goffin, C., Jensen, E., Scrace, G.,
Waterfield, M., and Chambon, P. (1986). Cloning of the human oestrogen receptor
cDNA. J Steroid Biochem 24, 77-83
17. Greene, G.L., Gilna, P., Waterfield, M., Baker, A., Hort, Y., and Shine, J. (1986).
Sequence and expression of human estrogen receptor complementary DNA. Science
231, 1150-1154
18. Goldzieher, M.A. (1956). Treatment of excessive growth in the adolescent female. J
Clin Endocrinol Metab 16, 249-252
19. Heino TJ, Chagin AS, Sävendahl L. The novel estrogen receptor G-protein-coupled
receptor 30 is expressed in human bone. J Endocrinol. 2008 May; 197(2):R1-6

20
20. Hendriks, A.E., Laven, J.S., Valkenburg, O., Fong, S.L., Fauser, B.C., De Ridder,
M.A., De Jong, F.H., Visser, J.A., Van Ginneken, A.M., Boot, A.M., and Drop, S.L.
(2011). Fertility and ovarian function in high-dose estrogen-treated tall women. J Clin
Endocrinol Metab 96, 1098-1105
21. Jones JI, Clemmons DR. Insulin-like growth factors and their binding proteins:
biological actions. Endocr Rev. 1995 Feb; 16(1):3-34
22. Kuiper, G.G., Enmark, E., Pelto-Huikko, M., Nilsson, S., and Gustafsson, J.A.
(1996). Cloning of a novel receptor expressed in rat prostate and ovary. Proc Natl
Acad Sci U S A 93, 5925-5930
23. Mårtensson K, Chrysis D, Sävendahl L. 2004. Interleukin-1 and TNF- act in
synergy to inhibit longitudinal growth in fetal rat metatarsal bones. J Bone Mineral
Res 19:1805-1812
24. Mårtensson UE, Salehi SA, Windahl S, Gomez MF, Swärd K, Daszkiewicz-Nilsson
J, Wendt A, Andersson N, Hellstrand P, Grände PO, Owman C, Rosen CJ,Adamo
ML, Lundquist I, Rorsman P, Nilsson BO, Ohlsson C, Olde B, Leeb-Lundberg LM.
Deletion of the G protein-coupled receptor 30 impairs glucose tolerance, reduces
bone growth, increases blood pressure, and eliminates estradiol-stimulated insulin
release in female mice. Endocrinology. 2009 Feb;150(2):687-98. Epub 2008 Oct 9
25. Moser, M., and Patterson, C. (2005). Bone morphogenetic proteins and vascular
differentiation: BMPing up vasculogenesis. Thromb Haemost 94, 713-718
26. Nilson O, Chrysis D, Pajulo O, Boman A, Holst M, Rubinstein J, Ritzén EM,
Sävendahl L 2003A Localization of estrogen receptor-, -, and androgen receptor in
the human growth plate at different pubertal stages. J Endocrinol 177:319-326
27. Ornitz, D.M., and Marie, P.J. (2002). FGF signaling pathways in endochondral and
intramembranous bone development and human genetic disease. Genes Dev 16,
1446-1465
21
28. Patel VH, Chen J, Ramanjaneya M, Karteris E, Zachariades E, Thomas P, Been
M, Randeva HS.G-protein coupled estrogen receptor 1 expression in rat and
human heart: Protective role during ischaemic stress. Int J Mol Med. 2010 Aug;
26(2):193-9
29. Prossnitz, E. R. & Barton, M. The G-protein-coupled estrogen receptor GPER in
health and disease Nat. Rev. Endocrinol. 2011 Aug 16;7(12):715-26
30. Revankar, C.M., Cimino, D.F., Sklar, L.A., Arterburn, J.B. & Prossnitz, E.R. 2005. A
transmembrane intracellular estrogen receptor mediates rapid cell signaling. Science
307, 1625–1630 (2005)
31. Smith EP, Boyd J, Frank G, et al. 1994. Estrogen resistance caused by a mutation in
the estrogen receptor in a man. N Engl J Med. 331:1056-1061
32. Weimann, E., and Brack, C. (1996). Severe thrombosis during treatment with
ethinylestradiol for tall stature. Horm Res 45, 261-263
33. Windahl SH, Andersson N, Chagin AS, Mårtensson UEA, Carlsten H, Olde B,
Swanson C, Moverare-Skrtic S, Sävendahl L, Lagerquist MK, Leeb-Lundberg LMF,
Ohlsson C. 2009. The role of the G protein-coupled Receptor GPR30 in the Effects of
Estrogen in Ovariectomized Mice. Am J Physiol Endocrinol Metab, 296:E490-6
34. Y Berthois, J A Katzenellenbogen, and B S Katzenellenbogen. Phenol red in tissue
culture media is a weak estrogen: implications concerning the study of estrogen-
responsive cells in culture. Proc Natl Acad Sci U S A. 1986 April; 83(8): 2496–2500
35. Zaman G, Jessop HL, Muzylak M, De Souza RL, Pitsillides AA, Price JS, Lanyon
LL. Osteocytes use estrogen receptor alpha to respond to strain but their ERalpha
content is regulated by estrogen. J Bone Miner Res. 2006 Aug; 21(8):1297-306

22
Acknowledgement
This study was successfully completed because of highly valuable input, guidance and
wisdom from the following people,
Professor Lars Savendhal, MD, PhD
Farasat Zaman, PhD
Assistant Professor Andraie Chagin, PhD
Karuna Vupalappati MD, MSc
Therese Cedervall MSc
A special thanks to all the staff of the Pediatric Endocrinology laboratory at the
Department of Women and Children health, Astrid Lindgren Pediatric Hospital, Solna for
their professionalism and cooperation.