Embed Size (px)
Citation preview

Chapter 2.
Quantifying the Value of U.S. Tariff Preferences for Developing Countries*
Judith M. Dean† John Wainio‡
*We are grateful to Maya Shivakumar and Nick Grossman for their superb work assembling and analyzing data. We also thank Pat Thomas for her valuable help constructing tables and Peg MacKnight for her help with the USITC Dataweb. The views expressed here are those of the authors only. They do not necessarily reflect the views of the USITC, or any of its individual Commissioners, or the USDA. † U.S. International Trade Commission ‡ U.S. Department of Agriculture
Quantifying the Value of U.S. Tariff Preferences for Developing Countries
1. Introduction
The value of industrial countries’ preferential trade programs that grant duty-free or reduced-duty access
to many developing countries’ exports has been much debated. Many developing countries, and non-
governmental organizations feel that it is crucial that modalities be developed to protect the preferential
access of developing countries. By contrast, an IMF study concluded that vulnerability to preference
erosion is heavily concentrated in a sub-set of products, especially sugar and bananas, implying that
assistance to help countries cope with preference erosion should be closely targeted at the countries at
risk.
A country granted trade preferences would presumably see demand for its exports grow, relative
to other exporting countries still facing most-favored nation (MFN) tariffs. If the country receiving
preferences is small, its exports would continue being sold in the importing country at the prevailing
tariff-inclusive price, with the exporter earning the difference. Thus, the benefits of such preferences for
the exporting country would be increased exports and a transfer of rent from the importing country. But
how important are these trade preferences to developing countries? Are the tariff margins large? Do
countries fully utilize their preferential access? Is all rent actually earned by the exporting countries? If
so, how large is this rent relative to a country’s overall exports? If it is significant, do trade preferences
granted to one developing country come at the expense of another (Panagariya 2004)?
Only recently have studies attempted to give quantitative answers to some of these questions.
Alexandraki and Lankes (2004) calculate the product-level tariff margins granted by the Canada, the
European Union, Japan, and the United States and then use these to derive an aggregate value of
preferences for each beneficiary country. They find 18 countries for which the value of preferences
exceeds 5 percent of the value of their exports. Their results suggest that the problem is heavily
1
concentrated in mostly small island economies dependent on sugar and bananas, and to a lesser extent on
textiles. But as the authors note, these values may be overstated as they assume full utilization of
preferences, constant world prices, and full rent transfer to the beneficiary countries.
Brenton and Ikezuki (2004) assess the scope and value of U.S. preferences under the African
Growth and Opportunity Act (AGOA) for 2002. They find that, overall, the least developed (AGOA
beneficiary) countries (LDCs) saw little expansion in the list of products eligible for duty-free access
under the AGOA since they already had such access under the Generalized System of Preferences (GSP).
Thus, the countries likely to benefit more from the AGOA would be the non-LDCs. But eligibility for
apparel preferences significantly affects AGOA preference utilization rates. Among countries with such
status, the LDCs have the least restrictive rules of origin, and are therefore likely to gain more than the
non-LDCs. Brenton and Ikezuki’s data show wide variation in utilization, with AGOA tariff preferences
averaging about 6percent, and only six AGOA countries with values of preferences (AGOA plus GSP)
exceeding 5percent of their total exports to the United States.
In this paper, we seek to improve upon our measures of the size, utilization, and value of all U.S.
non-reciprocal trade preference programs, in order to shed some light on the debate. We use highly
disaggregated data for all beneficiary countries in U.S. regional preference programs and in the GSP to
quantify tariff preference margins, coverage, and utilization for non-agricultural and agricultural tariff
preferences. We estimate the overall value of preferences assuming full use of preferences and then re-
estimate to incorporate actual use. We also estimate values for non-agricultural and agricultural
preferences.
Our results show that U.S. regional preference programs are generally characterized by high
coverage of beneficiary countries’ exports, high utilization by beneficiary countries, and low tariff
preference margins (except on apparel). The GSP has relatively poorer coverage in general and low
preference margins. The GSP is used little as an alternative to the regional programs but is heavily
2

utilized by countries with no alternatives. After incorporating actual utilization, we find that 29
beneficiary countries had U.S. tariff preferences valued at 5 percent or more of dutiable exports to the
United States, and 17 countries had values exceeding 5 percent of total exports to the United States in
2003. For nine of these countries, U.S. preferences were valued at 15 percent or more of dutiable exports.
Most of this value was attributable to non-agricultural tariff preferences, and especially to apparel. The
remaining value was small and attributable largely to jewelry, chemicals, electrical machinery, petroleum-
related products, melons, fresh cut flowers, frozen orange juice, raw cane sugar, and fresh asparagus. The
removal of apparel quantity restrictions in 2005 is likely to have reduced the value of U.S. apparel
preferences since 2003. While further analysis is needed, these results suggest that U.S. preference
erosion may be significant for more countries than previously thought.
Overview of U.S. Non-Reciprocal Trade Programs in 2003
In 2003, 143 countries and territories were eligible for tariff preferences under the Generalized System of
Preferences. GSP treatment in the United States is duty-free and covers “most dutiable manufactures and
semi-manufactures and selected agricultural, fishery, and primary industrial products not otherwise duty-
free” (USTR 1999). In 1996, nearly 2,000 additional items were designated duty-free for LDCs.1 But
relative to other U.S. preferential programs, the GSP has the lowest product coverage. Products deemed
import-sensitive are excluded from program coverage by law. Agricultural products subject to a tariff-
rate quota (TRQ) are not eligible for duty-free access on any quantities exceeding the quota. Other
ineligible products include most textiles, apparel, watches, footwear, handbags, luggage, work gloves, and
other apparel made partly or wholly from leather (U.S. Government 2004). The GSP has additional
limitations, including periodic expiration, the loss of GSP eligibility owing to automatic graduation once
the World Bank’s high-income country category is reached, and the loss of GSP eligibility on a product
1 In 2003, 41 countries were eligible for expanded benefits under the U.S. GSP/LDC program.
3

once “competitive needs limits” (CNL) are exceeded.2
The African Growth and Opportunity Act (AGOA) granted duty-free status to more than 6,400
products imported from sub-Saharan African countries as part of the Trade Act of 2000 (USITC 2004b).
In 2003, 38 countries were eligible for preferences under the AGOA program (www.agoa.gov). The
AGOA extended GSP duty-free status to a larger set of goods than covered by the GSP. For non-LDC
beneficiaries, products are either eligible for preferences under the AGOA or under the GSP, but not
under both. For LDC beneficiaries, however, some products are eligible for both programs. The AGOA
exempts beneficiary countries from the CNL. The program also grants duty-free and quota-free access to
apparel made in eligible sub-Saharan African countries from U.S. fabric, yarn, and thread. Apparel
imports made with regional fabrics were subject to a cap, with built-in growth over a period of eight
years. In addition, the Special Rule for Apparel (SRA) allowed LDCs to receive duty-free access for
apparel made with fabrics originating from third countries until September 2004.3 AGOA II (part of the
Trade Act of 2002) expanded preferential access, and increased the cap for apparel made with regional
fabric. AGOA III (2004) extended the program until 2015, and the third-country fabric provision until
2007.
The Caribbean Basin Economic Recovery Act (CBERA) is an extension of the Caribbean Basin
Initiative, begun in 1984 (USITC 2003). This program eliminated or reduced tariffs on eligible products
imported from designated Caribbean and Central American countries and territories. The Caribbean
Basin Trade Partnership Act (CBTPA) is the most recent extension of CBERA and was implemented as
part of the Trade Act of 2000. In 2003, 24 countries were eligible for CBERA benefits and, of those, 14
were eligible for the CBTPA. Under the CBTPA, a number of import-sensitive products became eligible
2 CNL are ceilings set for each product and country. They are intended to prevent the extension of preferential treatment to countries considered competitive in the production of an item. With certain qualifications, a country automatically loses its eligibility for a given product the year following that in which the ceiling is exceeded. 3 Although Botswana and Namibia are not LDCs, they were given third-country fabric provision eligibility in 2003.
4

for preferential duty treatment, including apparel, petroleum, and petroleum products. The CBTPA
authorizes unlimited duty-free entry for imports of apparel assembled in CBERA countries from fabrics
made and cut in the United States of U.S. yarns. If the cutting takes place in CBTPA countries rather than
the United States, the apparel must be sewn together with U.S. thread.4 The CBTPA also provides some
preferential access for apparel made from regional fabric, but unlike the AGOA, it has no third-country
fabric provision.
The Andean Trade Preference Act (ATPA) granted duty-free access beginning in 1991 to many
imports from Bolivia, Columbia, Ecuador, and Peru (USITC 2004a). After expiring in December 2001,
the ATPA was renewed retroactively as the Andean Trade Promotion and Drug Eradication Act
(ATPDEA) in late 2002. The ATPA5 has broader product coverage than the GSP, and eligibility is not
constrained by the GSP CNL or by the possibility of graduation. In 2002, ATPA preferential treatment
was expanded to include such previously excluded import-sensitive products as petroleum and petroleum
derivatives, apparel and textiles, footwear, and tuna in foil packages. The ATPA allows unlimited duty-
free and quota-free treatment for imports of textiles and apparel made in ATPA countries using yarn or
fabric, or fabric components, wholly formed in the United States. Like the CBTPA, the ATPA also
provides some preferential access for apparel made from regional fabric, but no third-country fabric
provision.
Data Description
We construct a preference database for this study using trade and tariff data at the US HTS 8-digit
level, extracted from the USITC DATAWEB database (http://dataweb.usitc.gov) and the USITC Tariff
Database (http://www.usitc.gov/tata/hts/other/dataweb). We include all U.S. imports in HS chapters 1
4 For additional eligibility criteria, see USITC (2005), pp. 1-10. 5 Hereafter, ATPA refers to ATPA or ATPADEA.
5

through 97 for the year 2003.6 The USITC records U.S. imports from beneficiary countries by customs
value7 in current U.S. dollars. The import data include the preferences claimed, the value of total
imports, dutiable imports (ex post), the duties paid, the quantity imported, and the preference-eligibility
status by country and program. The use of preferences is indicated by the preference claimed when the
product entered the United S
tates.8
MFN and preferential tariffs, including both ad valorem and specific tariffs are converted to ad
valorem equivalents (AVEs), using the USITC method.9 While the ITC tariff database does include
AVEs of tariff-rate quotas, it does not include any AVE estimates of import quotas or other types of
quantitative restrictions (QRs). The implications of omitting the 2003 U.S. QRs on apparel products are
discussed below. The tariff data include detailed information on preference eligibility by product and
program.
U.S. Tariff Preferences on Non-Agricultural Products10
Figure 1 shows U.S. imports of non-agricultural products in 2003 from beneficiary countries by tariff
treatment. The CBERA countries are split into those eligible for CBTPA and those eligible for CBERA-
6 Note that chapters HS61 and HS62 do include the value of apparel entering the United States under the production-sharing program (HTS 9802.00.80), although that value is not broken out separately. 7 Customs value is equivalent to f.o.b. value. 8 There are cases where the claim is later denied but these represent a tiny proportion of cases. 9 U.S. AVE tariffs for HTS 8-digit items with specific or compound rates are estimated by the following steps. 1) Where there is U.S. MFN import trade for an HTS item, the AVE is estimated by duties divided by dutiable U.S. imports. Trade entering under special tariff preference programs is not included. 2) Where there is no U.S. MFN import trade for an item, the quantity and customs value of all U.S. imports under that item are used and the MFN- specific and compound rates are applied to calculate the tariffs that "would have been collected " if the trade had entered as MFN trade rather than under a special program. The duties thus calculated are divided by the customs value to estimate the AVE. 3) Where there is no U.S. import trade at all for an item in a given year, the quantity and customs value of imports (MFN if available, all trade if not) in that item from the previous full year are used and the MFN-specific and compound rates for the current year are used to calculate the tariffs that "would have been collected " if the trade had entered as MFN trade in the current year. The duties thus calculated are divided by the customs value to estimate the AVE. 4) If there is no U.S. import trade for the given year or the previous year, the Office of Tariff Affairs and Trade Agreements of the USITC is asked to provide an estimated AVE. 10 Non-agricultural products are defined as all those not specified in Annex 1of the WTO Agreement on Agriculture. Detailed data are available from the authors upon request. All values are based on imports in HS chapters 1-97.
6

only, since the CBTPA includes apparel preferences and has broader non-apparel coverage. Countries
that are exclusively eligible for the GSP are split into two groups: GSP-only and GSP-LDC.
The first striking feature of Figure 1 is the high overall use of the regional preference programs.
In 2003, the United States imported about $19.6 billion of non-agricultural products from CBTPA
countries, 50 percent of which was apparel. Nearly half of these imports entered the United States under
the CBTPA program. Similarly, of the $9.8 billion the United States imported from ATPA countries (11
percent of which was apparel), nearly 60 percent entered under the ATPA program. AGOA countries
accounted for $19.1 billion of U.S. non-agricultural imports, 8 percent of which was apparel. About 68
percent of these imports entered the United States under the AGOA preference program. Only the
CBERA-only beneficiaries made little use of regional preferences. Of the $1.8 billion U.S. non-
agricultural imports from these countries, only 7 percent entered under the CBERA. The second striking
feature of Figure 1 is the low use of the GSP. Only 1 percent of U.S. imports from the CBPTA countries
and from CBERA-only countries came in under the alternative GSP program. U.S. imports from ATPA
and AGOA beneficiaries under GSP were only 3 percent and 4 percent, respectively. Even the non-LDCs
that are only eligible for the GSP made little use of the program. Only 15 percent of the $113.8 billion of
non-agricultural imports from the GSP non-LDC beneficiaries entered the United States under the GSP.
In contrast, more than half of the $8.8 billion non-agricultural imports from GSP-LDCs entered the
United States under the GSP program. Although apparel represented 13 percent of U.S. imports from
GSP-LDC countries, most of this was excluded from the GSP, leaving only 1percent of apparel imports
entering under the program.
Are U.S. Non-Agricultural Preferences Comprehensive?
Whether or not countries make incomplete use of U.S. preferences may depend partly on how
extensive the preferences are. We measure the scope of preferences by calculating coverage rates,
defined as the ratio of eligible U.S. imports to total dutiable U.S. imports, with dutiable defined as being
7

subject to duty if no preference program is claimed. Apparel coverage is problematic since technically no
apparel product is eligible, ex ante, for preferential tariff treatment. The regional programs all have
product eligibility requirements—typically, rules of origin regarding the components of the garments—
which may or may not be met. The AGOA program also requires country apparel eligibility and grants
nearly all AGOA-LDCs eligibility for the Special Rule for Apparel (SRA) . In this study, overall
coverage rates for countries in these programs are calculated assuming that all apparel imports from
eligible countries are “potentially eligible” for duty-free access. This yields apparel coverage rates of
100 percent.11 In the case of CBERA-only and the GSP, apparel coverage rates are calculated based on
actual product eligibility.
Table 1 shows coverage rates for all non-agricultural imports and for non-apparel and apparel
imports separately. Data for regional programs are shown on the left and for the alternative GSP program
on the right. Nearly all U.S. non-agricultural imports from CBTA and ATPA members were eligible for
preferences under these regional programs. Except for El Salvador, coverage rates for non-apparel
imports were 90 percent or more under both these programs. For CBERA-only countries, the scope of
regional preferences was more varied. Six of the 10 members had CBERA coverage rates of 90 percent
or more, but the remaining 4 had rates well below 50 percent. Under the alternative GSP program,
coverage of non-apparel imports exceeded 90 percent in seven of the CBTPA and ATPA countries, but
overall GSP coverage rates were well below 50 percent for most beneficiaries. For CBERA-only
countries, GSP coverage was similar to regional program coverage.
There is no overlap between AGOA program coverage and GSP coverage for AGOA non-LDC
beneficiaries. Adding up coverage under both programs reveals that virtually all U.S. non-agricultural
imports from all AGOA non-LDCs (except Eritrea) were eligible for preferences in 2003. The same was
11 The alternate extreme would be to assume that the apparel trade that qualified for preferences in 2003 is the maximum that could have qualified that year. This would imply that utilization rates were always 100 percent.
8

true for non-apparel imports (except Botswana and Swaziland). Coverage rates showed more variation
among the LDCs. Nine out of the 21 AGOA LDC beneficiaries had AGOA coverage of 90percent or
more, while for 9 others, AGOA coverage was negligible. For most other LDCs, low (high) AGOA
coverage corresponded to high (low) GSP coverage. Thus, 14 LDCs had complete coverage and another
4 had 50-90 percent coverage under the combined preference programs. AGOA coverage of non-apparel
imports was generally low relative to GSP, except for petroleum-related products. Eight of the countries
with complete AGOA coverage had exports to the United States consisting almost totally of petroleum-
related products.12
Preference coverage was much lower, on average, and more varied for GSP-only countries (Table
2). The mean coverage rate for the 60 non-LDCs was just 44 percent, and nearly half the countries had
less than 30 percent of their dutiable exports covered by the GSP. Of the 15 GSP-LDCs, half had
coverage rates of 90 percent or more, while the other half had coverage rates near or below 25 percent.
For countries such as Bangladesh, Cambodia, Nepal, Pakistan and Sri Lanka, whose exports to the United
States are dominated by apparel, GSP coverage rates were extremely low.
Are U.S. Non-Agricultural Preferences Fully Utilized? [flush left]
Utilization is defined as the share of eligible imports entering the United States under the
preference program. Table 1 clearly shows that utilization rates are typically below 100 percent. Some of
the evidence suggests that utilization rates may be correlated with coverage rates. The ATPA and
CBTPA members with virtually 100 percent coverage of their exports under the regional programs had
high average utilization rates: 83 percent and 63 percent, respectively. Both non-apparel and apparel
utilization were similarly high, although CBTPA countries showed more variable utilization than the
ATPA countries. The CBERA-only countries’ utilization rates tended to be lower, on average, as were
12 Cameroon, Chad, Congo (ROC), Congo (DROC), Cote d’Ivoire, Gabon, Nigeria,,and Seychelles.
9

their coverage rates. One might think that some of the incomplete utilization by CBTPA, CBERA, or
ATPA beneficiaries could be explained by the use of the GSP program instead. Table 1 also shows,
however, that these countries made little use of GSP preferences.13 In fact, almost no non-agricultural
imports eligible for both ATPA, CBERA, or CBTPA preferences and for GSP preferences entered the
United States under the GSP.
Among AGOA non-LDCs, high combined AGOA and GSP coverage corresponded to high
combined utilization. With the exception of Eritrea, Gabon, and Mauritius, each country showed
combined utilization rates of 75 percent or more. Average utilization of non-apparel preferences was
only 50 percent, although seven countries had rates exceeding 75 percent. For LDCs, AGOA preference
coverage was less generous than GSP coverage. Overall, average utilization of each program was about
50 percent. High (low) AGOA coverage tended to correspond to high (low) AGOA utilization. But if
AGOA utilization was low, GSP utilization tended to be high. Thus, average utilization of the combined
preference programs was above 50 percent. Interestingly, the eight AGOA countries exporting
exclusively petroleum-related products showed wide variation in utilization, despite complete AGOA
coverage.
Eleven of the 20 AGOA apparel-eligible countries made heavy use of apparel preferences, while
5 others did not use them at all. Since the AGOA exporters with high apparel utilization all were SRA-
eligible, one might suspect that high utilization was driven by the ability to avoid costly rules of origin.
However, of the nine AGOA apparel-eligible countries with low apparel utilization, five were SRA-
eligible and two (Mali and Niger) became eligible late in the year. More analysis is therefore needed to
determine the role of the SRA in preference usage.
For countries benefiting exclusively from the GSP, preference utilization appears to be quite high,
13 Columbia and Ecuador have higher GSP utilization but very low GSP coverage.
10
despite the relatively low coverage of GSP preferences (Table 2). For both non-LDCs and LDCs, average
utilization was 60 percent. About half of the non-LDCs and LDCs had utilization rates exceeding 75
percent. Particularly noteworthy are the beneficiaries whose exports include a large share of apparel.
While GSP coverage rates for Pakistan and Sri Lanka were only 7 percent and 5 percent, respectively,
their utilization rates were 80 percent and 90 percent. Similarly for Bangladesh and Nepal, GSP coverage
was only 2 percent and 5 percent, respectively, but utilization rates were 89 percent and 76 percent. This
suggests that countries without the alternative of a regional preference program do make heavy use of the
GSP but are constrained by the program’s limited coverage.
Are U.S.Non-Agricultural Preference Margins Large? [flush left]
High utilization of preferences has occurred despite evidence that preference margins are
generally low. The tariff-preference margin is calculated as the difference between the nominal MFN ad
valorem tariff equivalent (AVE) and the nominal preferential AVE, at the HS 8 digit level. Unweighted
averages for each country and program are shown in Table 1. Across member countries and all eligible
U.S. non-agricultural imports, AGOA preference margins averaged the highest (14 percent) in 2003.
CBTPA preference margins ranked second, with a mean of 9 percent, and ATPA preference margins
ranked third, with a mean of 8 percent. In all three of these programs, the range of margins was wide--
from less than 1percent to 59 percent. In contrast, CBERA-only, GSP-only, and GSP-LDC programs had
low average nominal preferences of 4 percent, 4 percent, and 5 percent, respectively, and much less
dispersion. The range of preference margins under CBERA-only countries was narrow—from less than
1 percent to 10 percent. For GSP-only and GSP-LDC-only countries, preference margins ranged from
less than 1 percent to 26 percent and, less than 1 percent to 30 percent, respectively.
Separating non-apparel from apparel margins (Table 1) reveals a different picture. Non-apparel
preference margins average 3-5 percent for ATPA, CBTPA, and CBERA countries and show little
variation across countries within each program. AGOA non-apparel preference margins are much higher-
11
-5-10 percent for more than half the countries, and 10-20 percent for a few (such as Cape Verde, Kenya,
Senegal, and Sierra Leone). A major exception to this was petroleum. Despite its importance in US-
AGOA trade, average petroleum preference margins by country did not exceed 2 percent, and most were
well below 1 percent.
Apparel preference margins stand in sharp contrast to the non-apparel margins. Again assuming
that all apparel exports from eligible countries are “potentially eligible” for U.S. tariff preferences,
apparel average margins under the AGOA, CBTPA, and ATPA are two or three times as high as those for
non-apparel for nearly all member countries. AGOA apparel margins show wide variation, from a high of
22.3 percent for Uganda to a low of 6.7 percent for Niger.
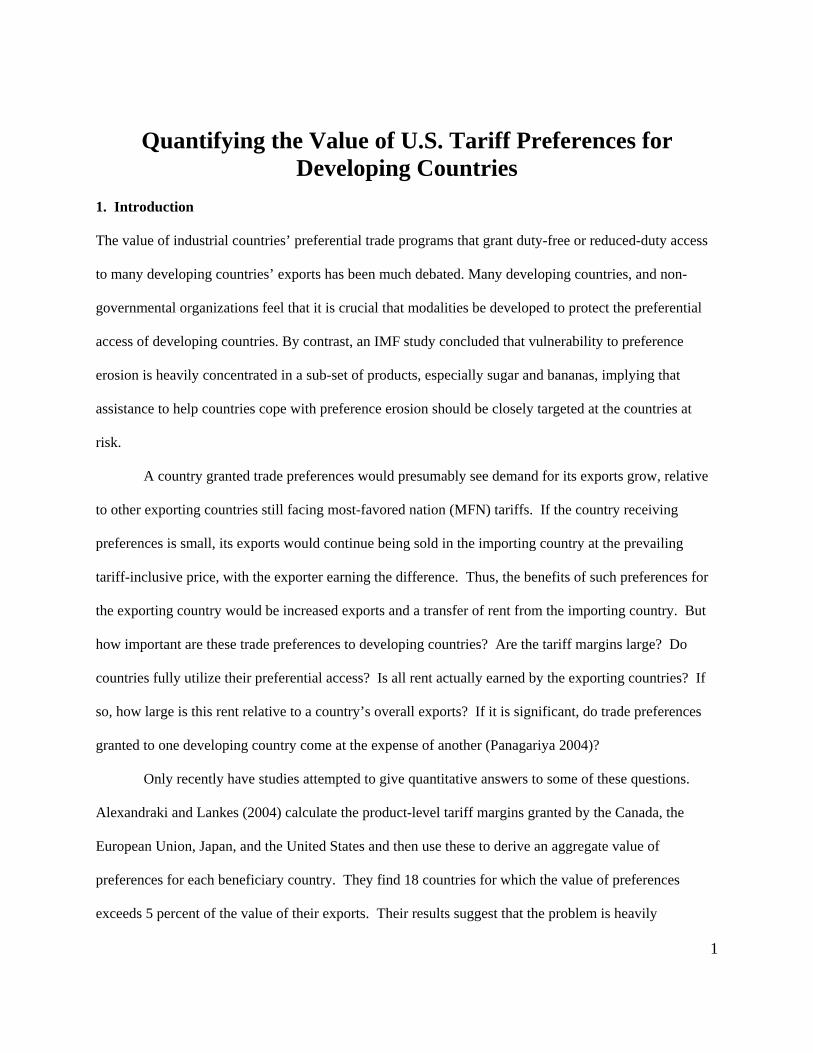
U.S. Tariff Preferences on Agricultural Imports14 Figure 2 shows U.S. agricultural imports in 2003 from beneficiary countries by tariff treatment. About
$3.9 billion of U.S. agricultural imports in that year entered duty-free under non-reciprocal trade
preference programs. The largest portion of this preferential trade—about 40 percent or $1.5 billion--
came in under the GSP program. Only a small portion of that (about $20.4 million) came in under the
GSP-LDC program. The CBERA program accounted for 37 percent ($1.4 billion) of preferential imports,
followed by the ATPA program, under which $784 million was imported. Still relatively new in 2003,
the AGOA program accounted for the remainder ($122 million).
The regional preference programs are particularly important for countries in the Caribbean and
Andean regions; almost 50 percent of U.S. agricultural imports from these countries and 40 percent from
ATPA countries in 2004 entered the United States under these programs. The GSP program has dwindled
in importance for these countries, with only 4 percent of CBERA and 5 percent of ATPA agricultural
exports to the United States entering under the GSP. When countries in these regions had a choice
14Agricultural products are here defined as those specified in Annex 1 of the WTO Agreement on Agriculture. Detailed data are available from the authors upon request.
12

between using either the regional preference program or the GSP, they used the regional program in
almost 90 percent of cases. The AGOA countries made almost equal use of the two programs, shipping
about 11 percent of their agricultural exports to the United States under the GSP and 12 percent under
AGOA. In contrast, countries that qualified only for the GSP or the GSP-LDC relied much less on U.S.
market preferences. Less than 17 percent of agricultural exports from the GSP countries came in under
preferences, while less than 6 percent of GSP-LDC exports entered under the program. Unlike non-
agricultural imports, a large percentage of U.S. agricultural imports from these beneficiary countries
already had MFN duty-free status.
Are U.S. Agricultural Preferences Comprehensive? [flush left]
Program coverage varies widely across programs and countries. Table 3 shows the share of
dutiable agricultural trade that was eligible for preferences in 2003. For participants in the CBERA and
ATPA programs, virtually 100 percent of dutiable exports to the United States were covered by regional
preferences. None of these countries shipped much to the United States that was not either MFN duty-free
or eligible for preferences. But duties on the relatively small subset of products not covered by these
programs tended to be prohibitively high, averaging about 43 percent.
For some of these countries, the GSP program alone provided broad coverage for their imports.
More than 90 percent of the dutiable agricultural exports from 11 of the 26 CBERA and ATPA
beneficiaries were eligible for duty-free treatment under the GSP, although this program was seldom
used. For the others, however, the regional programs expanded the range of products eligible for
preferences. In such countries as the Bahamas, Costa Rica, Jamaica, Nicaragua, and the Netherlands
Antilles, the CBERA program offered much more preferential coverage than the GSP. Aggregating
across beneficiaries within each program, 42 percent of ATPA and 48 percent of CBERA program
imports consisted of products not covered under the GSP. Although the remaining products were covered
by both the GSP and regional preferences, countries generally opted for the regional program.
13

AGOA agricultural coverage was generally quite low for both non-LDCs and LDCs. Only Benin
had 100 percent coverage under the AGOA. As noted earlier, the AGOA does not extend preferences to
tariff lines already covered by the GSP for non-LDC beneficiaries. Thus, the sum of coverage rates
provided by both programs reflects the overall preferential access provided their exports in the U.S.
market. When the coverage rates of both programs are taken into account, the range of preferences
offered to AGOA non-LDCs approaches 100 percent. All AGOA LDCs already had 100 percent
coverage rates under the GSP, with the exception of Tanzania. But the combined coverage of GSP and
AGOA also afforded Tanzania full coverage.
Table 3 shows coverage rates for those countries that qualified only for preferences under the
GSP or GSP-LDC programs. In general, these coverage rates tended to be low, averaging just 33.5
percent for all 61 countries. Countries that were exclusively GSP-LDC eligible had coverage rates twice
the size of GSP-only countries.
Are U.S. Agricultural Preferences Fully Utilized? [flush left]
The availability of preferences does not necessarily mean that all beneficiaries’ products covered
by these programs will actually enter duty-free. Complex and costly program regulations can limit a
recipient country’s ability to use these preferences. Rules of origin are most often cited as the primary
factor restricting beneficiary countries’ ability to fully use tariff preferences (Wainio and others 2005).
Table 3 shows the utilization rates for each program in 2003. In the case of agricultural exports from
CBERA and ATPA countries, utilization rates were quite high. With the exception of Peru, ATPA
utilization rates were 90 percent or more. Nine out of 14 CBTPA countries exhibited utilization rates
above 90 percent, while the others’ rates were between 70 percent and 87 percent. CBERA-only
countries showed more variability in using CBERA preferences but rates were still fairly high. Thus,
utilization of regional preferences was quite high, although not complete. In contrast, beneficiaries of
ATPA, CBERA, and CBTPA alike made little use of the GSP. In cases where a regional program was
14

incompletely utilized, however, the alternative GSP preferences were utilized. Thus, nearly all
beneficiaries’ eligible agricultural products entered under one of the preference programs. This is in
sharp contrast to non-agricultural products from ATPA, CBERA, or CBTPA countries, which generally
had both low coverage and low utilization under the GSP.
The results are more mixed for the AGOA countries. While 14 such countries had overall
utilization rates exceeding 90 percent, 2 countries (Benin and Niger) failed to make use of either the
AGOA or the GSP, even though some of their exports to the United States were eligible for preferences
under these programs. Several others failed to use the AGOA while making only limited use of the GSP.
Still relatively new in 2003, the AGOA was used only in agriculture by 10 of the 38 eligible recipients,
while 22 AGOA countries used the GSP.
Despite the relatively low coverage rates under the GSP, GSP-only countries recorded high
utilization rates (Table 4). Utilization averaged 89 percent, and nearly three-quarters of the 61 countries
that utilized the GSP and GSP-LDC had rates of 80 percent or more. Countries that were exclusively
GSP-LDC-eligible showed lower average utilization (60 percent), although their coverage rates were far
higher than GSP non-LDCs.
Are U.S. Agricultural Preference Margins Large? [flush left]
Agricultural products deemed to be import-sensitive are excluded from preferential access under
U.S. programs. These products tend to have the highest MFN tariffs, while products accorded
preferential access tend to face low MFN rates. Of the 1,432 agricultural tariff-lines facing an MFN rate
greater than zero, 1,204 (84 percent) are included in at least one of the nonreciprocal trade preference
programs. The MFN tariffs levied on these products in 2003 ranged from less than 1 percent to 79
percent, with the average equal to 6.4 percent. About 55 percent of the products granted some
preferential access under these programs face MFN tariffs of at least 5 percent. Many of these tariffs are
levied as in-quota rates on products facing tariff-rate quotas (TRQs), so they are only granted preferential
15

access on a limited quantity of imports. Clearly, the margin of preference – the extent to which the
preferential tariff is below the MFN tariff – on most of these products is somewhat limited.
Tables 3 and 4 show the simple average nominal tariff preference, or preference margin, that each
beneficiary faced on the sub-set of agricultural products it exported to the United States under these
programs. The averages ranged from 0.1 percent for St. Kitts-Nevis’ exports under the CBERA to 21.9
percent for Swaziland’s exports under the AGOA. The overall average across the 101 countries was
about 5.4 percent, with the average preference margins under the AGOA (9.6 percent) and CBERA (7
percent) being the highest. Few countries exported a product-mix that faced an average nominal tariff
preference greater than the 6.4 percent average tariff across all products eligible for duty-free treatment.
One might expect that beneficiaries would tend to export those products facing higher MFN rates since
they would have a greater competitive advantage in these markets over countries facing MFN rates. But
many of the agricultural products that beneficiaries tend to export under these programs, particularly
those produced in tropical climates, already face low MFN tariffs in the United States.
Quantifying the Value of U.S. Preferences
As noted above, U.S. tariff preferences should raise exports from the beneficiary country to the United
States, relative to other countries whose exports face the non-preferential tariff. The preference will also
imply a rent transfer to the exporter since the beneficiary’s exports will face no (or a reduced) tariff, but
will sell at the non-preferential tariff-inclusive price in the U.S. market. The value of the tariff preference
would then be composed of the rent earned on the level of exports prior to the preference and the rent
earned on the additional exports sold as a result of the preferences.
Following Alexandraki and Lankes (2004), we make the following simplifying assumptions:
• A.1. Products are perfect substitutes regardless of their country of origin. • A.2. The exporting country is a price-taker in world markets. • A.3. All rents from preferential access accrue to the exporter. • A.4. A change in the U.S. trade policy regime will not lead to a change in world
16

prices. We also assume that in programs that have apparel preferences, all apparel is potentially eligible for those
preferences. Under these assumptions, the duty savings from preference programs can be approximated
by the difference between the total duties that would have been collected on existing levels of US imports
from a beneficiary country in the absence of any program, and the actual duties collected given the
program(s). The value of preferences is then the beneficiary country’s duty savings as a share of its
dutiable exports to the United States. Assuming that preferences are fully utilized, their value can be
calculated using equation (1):
ijMFN pj i ij ij
i j
CustomsValueValue ( t t ) * Eligibility
CustomsValue⎛ ⎞
= − ⎜ ⎟⎜ ⎟⎝ ⎠
∑ (1)
where: i is US HTS 8-digit product, j is exporting country p indicates preference program Customs Value is the value of dutiable exports to the US
1 if product is eligible for any US preference0 if notijEligibility ⎧ ⎫
= ⎨ ⎬⎩ ⎭
.
Note that calculating equation (1) will yield an upper-bound estimate on value for at least two reasons:
imports from beneficiaries would be smaller than existing levels in the absence of preferences, and the
MFN tariff overstates the price increase in the U.S. market owing to tariffs, since some U.S. trading
partners are part of reciprocal preferential trade agreements (e.g., the North American Free Trade
Agreement, NAFTA).
Assumptions A.1-A.4, and the assumptions of complete apparel eligibility and full utilization of
preferences, all suggest that the estimates from (1) would indeed be upper-bound. While market power
and the degree of rent transfer are difficult to quantify, we have quantified preference utilization and
17

found it to be less than full, often even at the HTS 8-digit level. In order to incorporate this incomplete
utilization, we recalculate the value of preferences using equation (2):
ijMFN pj i ij ij
i j
CustomsValueValue ( t t ) * Eligibility * Utility
CustomsValue⎛ ⎞
= − ⎜ ⎟⎜ ⎟⎝ ⎠
∑ ij (2)
where Utilityij is the % of imports (HTS 8-digit level) which entered the US under any preference
program.
Table 5 shows the value of all preference programs for all beneficiary countries, and for all LDC
beneficiary countries. Below this, the value of preferences is shown for beneficiaries of both regional
programs and the GSP, and finally beneficiaries of GSP alone. For each of these country groups, the
table shows the value of all preferences for all beneficiaries in the group, and for individual countries
within the group, with duty savings exceeding 5 percent of their total dutiable exports to the United
States. The first set of columns shows values assuming full utilization (from equation (1)) and
decomposes these values into the share attributable to non-agricultural and agricultural preferences. The
second set of columns shows values after incorporating actual utilization (from equation (2)).
Looking at the overall figures in Table 5, the results in the first set of columns suggest that the
potential duty savings from all U.S. preference programs represents a small share of beneficiaries’
dutiable exports to the United States. Across beneficiary groups, however, countries in the CBTPA
program and in the AGOA-LDC program show duty savings exceeding 10 percent of their dutiable
exports to the United States. Most of this value is attributable to non-agricultural preferences. The most
striking feature of Table 5 is that 35 countries show values exceeding 5 percent of their dutiable exports to
the United States: 3 CBERA-only, 12 CBTPA, 2 ATPA, 15 AGOA, and 3 GSP countries. Values range
from 5.1 percent (Mali) to 23 percent (Cape Verde) and tend to be highest for members of the CBTPA
and AGOA. For Belize, Botswana, Cape Verde, El Salvador, Ethiopia, Guatemala, Haiti, Honduras, ,
Kenya, Lesotho, Madagascar, Mauritius, Swaziland, and Uganda, the value of U.S. preferences exceeded
18

15 percent of their dutiable exports to the United States in 2003. A second notable feature of Table 5 is
that a large proportion of countries in regional programs make the list, while only three countries from the
GSP-only group do. The third interesting feature is that almost universally, the largest proportion of the
value of preferences is attributable to non-agricultural preferences.
The second set of columns in Table 5 shows that the incorporation of actual utilization
significantly changes the assessment of the value of preferences for quite a few countries. The overall
values of preferences for countries in the CBTPA and AGOA-LDC programs fall but remain quite high--
at 8.8 percent and 13.6 percent of dutiable exports, respectively. The number of countries with
preferences valued above 5 percent of dutiable exports drops to 29. Nearly all the countries that are
members of regional groups remain on the list, but only one of the countries that are exclusively GSP-
eligible remains. The magnitudes of the values, however, change significantly. The countries for which
the value of U.S. preferences exceeds 15percent of dutiable exports now includes only Belize, Botswana,
Cape Verde, Ethiopia, Kenya, Lesotho, Madagascar, Swaziland, and Uganda. The CBTPA beneficiaries
show the largest adjustment in value after incorporating utilization, although values for half these
countries still exceed 10 percent. With a few exceptions, AGOA member countries show virtually no
change in the value of preferences. Once again, the largest proportion of value for all countries comes
from non-agricultural trade preferences.
While the value of preferences may be low for some countries when measured against total
dutiable exports, it may represent a large share of the value of their non-agricultural or agricultural
exports. Table 6 lists countries whose non-agricultural preferences exceed 5 percent of dutiable non-
agricultural exports to the United States, after incorporating utilization. This list is nearly the same as the
list in Table 5. For 17 of these 29 countries, preference values exceeded 10 percent. With a few
exceptions, most of this value is attributable to apparel preferences. Other significant products include
19

petroleum-related products,15 chemicals, jewelry, and electrical machinery. Table 7 lists 23 countries for
whose agricultural preference values exceeded 5percent of dutiable agricultural exports to the United
States, after incorporating actual utilization. Most of these countries do not appear in Table 5. Five of
these beneficiaries had preference values exceeding 10percent. Of the total preference value of all
agricultural products, 50 percent was accounted for by five products in 2003: melons, fresh cut flowers,
frozen orange juice, raw cane sugar, and fresh asparagus.
There are at least three reasons why apparel accounts for such a large share of the value of
preferences for many countries. First, apparel often accounts for a large share of exports; second, apparel-
exporting countries had high apparel utilization rates; and third, apparel exports had relatively high
preference margins. But the removal of quantitative restrictions (QRs) on apparel in January 2005 (with
the completion of the Agreement on Textiles and Clothing) reduced the relative prices of apparel imports
from China (prior to the re-imposition of QRs), South Asia, and the ASEAN countries, where QRs had
been highly restrictive. Thus, U.S. apparel imports from the CBTPA, ATPA, and AGOA countries were
likely to fall relative to their 2003 levels. Even if tariff-preference margins in 2005 remained similar to
those in 2003, these margins would be applied to a smaller value of apparel imports, thus reducing the
value of the preferences below those shown in Tables 5 and 6. Data from the U.S. Department of
Commerce suggest that U.S. 2005 apparel imports from sub-Saharan Africa dropped by 3.1 percent, and
from CBI by 0.2 percent relative to 2003; in contrast, apparel imports from the ATPA rose by 35.9
percent.16 These aggregate figures do not suggest a radical drop in the value of apparel preferences. But
15 Although the value of preferences for some AGOA countries derives exclusively from petroleum-related exports, none of these countries showed values exceeding 1percent of dutiable exports to the United States. 16 Major Shippers Report, http://www.otexa.ita.doc.gov/msr/cat1.htm, downloaded June 2006.
20

changes in imports varied greatly within these regions.17
The results in Table 5 suggest that more countries may be affected by the removal of U.S.
preferences than previously thought. To facilitate a comparison, Table 5 includes the value of preferences
calculated with respect to total exports to the United States. Using an approach similar to this study,
Brenton and Ikezuki (2004) find six AGOA countries whose preference values in 2002 exceeded 5
percent of total exports to the United States after incorporating preference utilization: Lesotho,
Madagascar, Malawi, Mauritius, Kenya, and Swaziland. Our results for 2003 include these six (with
similar value estimates), plus Botswana, Cape Verde, and Mozambique, with much higher value
estimates. We find, as do Brenton and Ikezuki, that most of this value is attributable to preferential access
for apparel. Using more aggregated data and assuming full utilization, Alexandraki and Lankes (2004)
identify 18 countries for which the value of all preferences from Canada, the European Union, Japan, and
the United States combined, exceeded 5 percent of total exports. Table 5 shows 19 countries--half of
Alexandraki and Lankes’ list and 10 additional countries--for which the value of U.S. preferences alone
exceeds 5 percent of total exports, assuming full utilization. After incorporating actual utilization, Table
5 shows that 17 countries’ values exceed this threshold.
Concluding Remarks
Close examination of U.S. import data reveals that countries that were members of the ATPA, CBTPA,
and CBERA tended to have very high utilization of regional preferences but lower GSP utilization,
although CBERA utilization was on average lower and more varied than the other regional programs.
AGOA non-LDCs, for which regional preference coverage and GSP preference coverage are
17For example, within Sub-Saharan Africa, apparel imports from Swaziland grew by 14.4 percent while imports from Mauritius fell by 38.1 percent. Within the CBI, U.S. apparel imports from Nicaragua grew by 47.9 percent, while those from the Dominican Republic fell by 12.9 percent.
21

complementary, showed high combined utilization of AGOA and GSP preferences. In many cases,
AGOA non-LDCs fully utilized both preference programs. AGOA LDCs--for which AGOA coverage
was less generous than GSP (particularly for non-agricultural, non-apparel products)--showed somewhat
lower combined utilization rates, making more use of the GSP than the AGOA. In general, utilization of
preferences was strongly related to preference coverage—except for the GSP program. Countries that
were exclusively members of the GSP exhibited high GSP utilization rates, despite relatively low
coverage rates. This was particularly true for beneficiaries whose exports were dominated by apparel.
While utilization rates are high, average tariff-preference margins in the regional preference
programs for non-apparel exports were relatively low for most countries. The AGOA countries generally
had higher non-agricultural preference margins than other beneficiary countries. For all apparel-eligible
countries, preference margins on apparel were about three times those of other non-agricultural products.
For non-agricultural products, these low margins are mainly the result of low U.S. MFN tariffs. In
contrast, for agricultural products, low preference margins are largely attributable to the exclusion of
products facing high tariffs. Overall, average GSP preference margins are lower than those offered by
regional preference programs, largely because of less extensive product coverage and the lack of apparel
preferences.
Although the erosion of U.S. tariff preferences may not have large impacts on development, it
may be more significant for a larger number of countries and products than previously thought. After
incorporating actual utilization, 29 countries, in 2003, had values of U.S. tariff preferences exceeding 5
percent of dutiable exports to the United States, and 17 countries had values exceeding 5 percent of total
exports to the United States. For nine of these countries, U.S. preferences were valued at 15 percent or
more of their total dutiable exports. The largest proportion of this value was attributable to non-
agricultural preferences, particularly preferences on apparel. The removal of U.S. quantitative
restrictions on apparel trade in 2005 has reduced apparel imports from CBI and for AGOA countries by a
22

small amount. But it has actually raised apparel imports from the ATPA and has led to a wide variation in
increases and decreases in imports across beneficiary countries. Thus, more research is needed to clarify
the impact of the completion of the ATC on the value of U.S. non-reciprocal preferences.
Several other caveats bear noting. We have assumed that the difference between the MFN tariff
and the preferential tariff accurately represents the rent transfer on each dollar of exports from the
beneficiary countries. But the existence of NAFTA and other regional agreements would tend to reduce
the prevailing tariff-inclusive U.S. price below the MFN tariff-inclusive price, lowering the rent a
beneficiary could earn. In addition, to the extent that this rent is actually shared by the exporters,
middlemen, and/or the United States itself, the value of U.S. preferences for beneficiaries would fall.
Finally, this analysis has assumed that world prices are unaffected by the introduction of tariff
preferences. Yet some beneficiary countries are large enough to affect the prevailing price in the U.S.
market for their products, thus lowering the value of their preferences. These limitations suggest that
further research is needed to assess the importance of preference erosion on beneficiary countries.
23

24
References
Alexandraki, K. and H. Lankes (2004). “The Impact of Preference Erosion on Middle Income Developing Countries,” IMF Working Paper No. 169.
Brenton, P. and T. Ikezuki (2004). “The Initial and Potential Impact of Preferential Access to the US
Market under AGOA,” World Bank Policy Research Working Papers No. 3262. Panagariya, A. (2002). “EU Preferential Trade Policies and Developing Countries,” World Economy,
Vol. 25, No.10, November 2002: 1415-32. US Government (2004). US Federal Code. Title 19, Chapter 12, Subchapter V, found at: http://www4.law.cornell.edu/uscode/html USITC (2005), The Impact of the Caribbean Basin Economic Recovery Act (Seventeenth Report 2003-
2004), USITC Publication 3804. USITC (2004a). The Impact of the Andean Trade Preference Act (Tenth Report 2003), USITC
Publication No. 3725. USITC (2004b). US Trade and Investment with Sub-Saharan Africa (Fifth Annual Report 2004), USITC
Publication 3741. USTR (1999). US Generalized System of Preferences Guidebook, found at: http://www.ustr.gov/assets/Trade_Development/Preference_Programs/ Wainio, J., S. Shapouri, M. Trueblood, and P. Gibson (2005). “Agricultural Trade Preferences and the
Developing Countries,” USDA-ERS Economic Research Report Number 6, May 2005, found at: http://www.ers.usda.gov/Publications/ERR6/

16%
77%
7%0%0%
30%
23%
16%
32%
1%
26%
17%
50%
8%
3%
18%
9%
62%
6%
4%
40%
46%
0%0%
15%
3%
42%
0%0%
55%
0%
10%
20%
30%
40%
50%
60%
70%
80%
90%
100%
CBERA-only CBTPA ATPA AGOA GSP-only GSP-LDC-onlyCountry Groups
Figure 1. Share of U.S. Non-Agricultural Imports by Type of Tariff Regime, 2003
Duty-free MFN Regional Pref--Non-Apparel Regional Preference--Apparel GSP

45%
2%
49%
4%
54%
1%
40%
5%
74%
4%
12%
11%
44%
39%
0%
17%
86%
8%0%
5.8%
0%
10%
20%
30%
40%
50%
60%
70%
80%
90%
100%
CBERA ATPA AGOA GSP-Only GSP-LDC-OnlyCountry Groups
Figure 2: Share of U.S. Agricultural Imports by Type of Tariff Regime, 2003
Duty-Free MFN Regional Preference GSP

Table 1. U.S. Non-Agricultural Imports: Preference Coverage,1 Utilization,2 and Average Nominal Tariff Preference,3 2003 CBERA Coverage CBERA Utilization CBERA Av. Tariff Pref. GSP Coverage GSP Utilization GSP Av. Tariff Pref.
Overall Non-App Overall
Non-App App Overall
Non-App App Overall
Non-App Overall Overall
Antigua 98 98 4 4 4.5 4.5 27 27 16 3.9
Aruba (.) (.) 49 50 0 3.9 3.8 4.6
Bahamas 29 29 100 100 100 3.4 3.4 4.2
Br Virgin Is 44 42 7 8 0 4.3 4.1 10.0 31 34 0 4.0
Dominica Is 99 100 98 98 3.3 3.3 99 100 0 3.3
Grenada Is 100 100 20 20 3.8 3.8 100 100 0 3.8
Montserrat Is 91 95 0 0 2.1 2.1 72 75 0 2.5
Netherlands Ant 1 1 40 40 3.6 3.6
St Kitts-Nevis 98 100 96 96 2.9 2.9 93 95 2 3.1
St Vinc / Gren 100 100 100 100 100 4.3 4.1 4.9 100 100 (.) 4.5
CBTPA Coverage CBTPA Utilization CBTPA Av. Tariff Pref. GSP Coverage GSP Utilization GSP Av. Tariff Pref.
Overall4 Non-App Overall4
Non-App App4 Overall4
Non-App App4 Overall
Non-App Overall Overall
Barbados 100 100 20 20 3 4.8 3.5 15.7 34 35 17 2.9
Belize 100 100 76 4 86 8.8 3.2 14.2 12 98 13 4.2
Costa Rica 99 98 73 79 70 7.4 4.9 16.8 32 92 12 3.7
Dominican Rep 99 97 76 65 82 8.2 4.3 15.8 30 86 7 3.8
El Salvador 98 60 65 77 64 11.2 5.0 15.4 2 38 32 4.0
Guatemala 99 96 42 94 34 10.0 3.2 15.6 5 34 11 4.6
Guyana 96 91 83 81 85 12.1 4.8 18.5 40 91 21 4.3
Haiti 100 100 66 34 67 12.6 3.7 17.3 5 97 18 4.4
Honduras 100 98 71 20 76 10.5 4.4 16.1 8 96 4 4.1
Jamaica 100 100 86 57 87 9.2 5.2 17.2 3 90 6 3.6
Nicaragua 100 100 31 32 31 13.0 5.8 16.6
Panama 99 99 48 51 9 6.9 4.8 14.4 49 53 26 3.7
St Lucia Is 100 100 61 89 0 9.4 4.3 18.3 11 16 41 3.5
Trin & Tobago 100 100 90 90 11 4.3 5.0 14.4 37 37 0 3.5
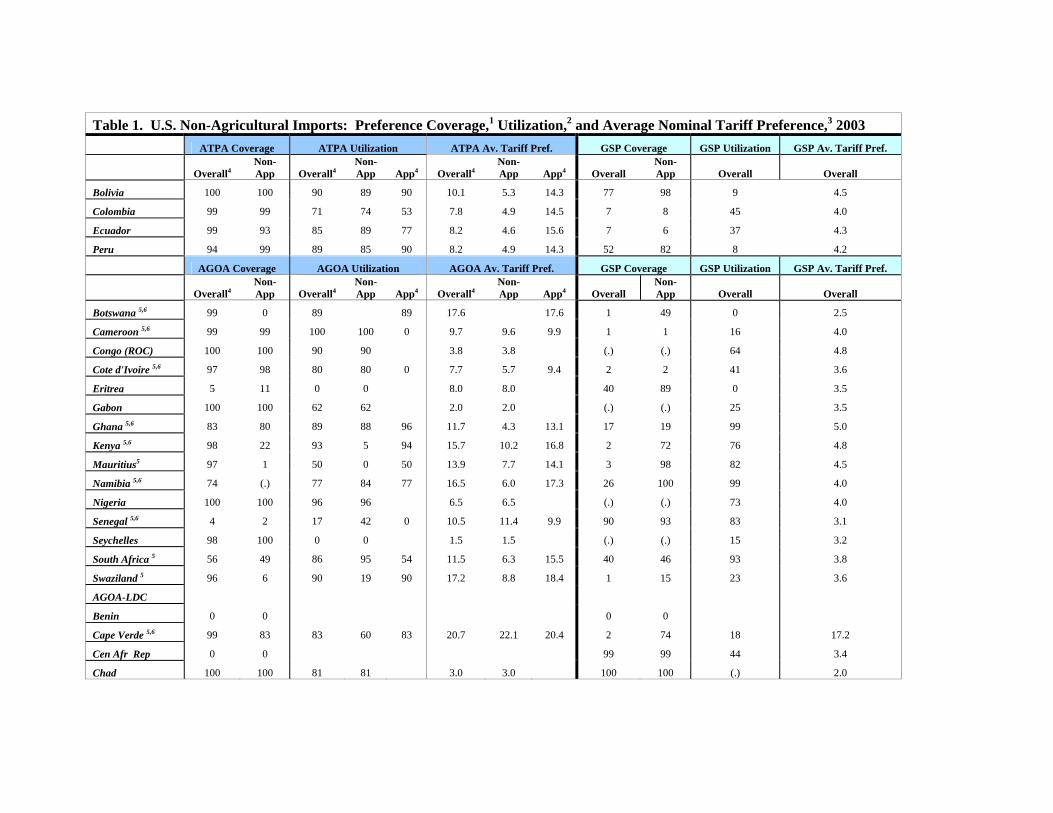
Table 1. U.S. Non-Agricultural Imports: Preference Coverage,1 Utilization,2 and Average Nominal Tariff Preference,3 2003 ATPA Coverage ATPA Utilization ATPA Av. Tariff Pref. GSP Coverage GSP Utilization GSP Av. Tariff Pref.
Overall4 Non-App Overall4
Non-App App4 Overall4
Non-App App4 Overall
Non-App Overall Overall
Bolivia 100 100 90 89 90 10.1 5.3 14.3 77 98 9 4.5
Colombia 99 99 71 74 53 7.8 4.9 14.5 7 8 45 4.0
Ecuador 99 93 85 89 77 8.2 4.6 15.6 7 6 37 4.3
Peru 94 99 89 85 90 8.2 4.9 14.3 52 82 8 4.2
AGOA Coverage AGOA Utilization AGOA Av. Tariff Pref. GSP Coverage GSP Utilization GSP Av. Tariff Pref.
Overall4 Non-App Overall4
Non-App App4 Overall4
Non-App App4 Overall
Non-App Overall Overall
Botswana 5,6 99 0 89 89 17.6 17.6 1 49 0 2.5
Cameroon 5,6 99 99 100 100 0 9.7 9.6 9.9 1 1 16 4.0
Congo (ROC) 100 100 90 90 3.8 3.8 (.) (.) 64 4.8
Cote d'Ivoire 5,6 97 98 80 80 0 7.7 5.7 9.4 2 2 41 3.6
Eritrea 5 11 0 0 8.0 8.0 40 89 0 3.5
Gabon 100 100 62 62 2.0 2.0 (.) (.) 25 3.5
Ghana 5,6 83 80 89 88 96 11.7 4.3 13.1 17 19 99 5.0
Kenya 5,6 98 22 93 5 94 15.7 10.2 16.8 2 72 76 4.8
Mauritius5 97 1 50 0 50 13.9 7.7 14.1 3 98 82 4.5
Namibia 5,6 74 (.) 77 84 77 16.5 6.0 17.3 26 100 99 4.0
Nigeria 100 100 96 96 6.5 6.5 (.) (.) 73 4.0
Senegal 5,6 4 2 17 42 0 10.5 11.4 9.9 90 93 83 3.1
Seychelles 98 100 0 0 1.5 1.5 (.) (.) 15 3.2
South Africa 5 56 49 86 95 54 11.5 6.3 15.5 40 46 93 3.8
Swaziland 5 96 6 90 19 90 17.2 8.8 18.4 1 15 23 3.6
AGOA-LDC
Benin 0 0 0 0
Cape Verde 5,6 99 83 83 60 83 20.7 22.1 20.4 2 74 18 17.2
Cen Afr Rep 0 0 99 99 44 3.4
Chad 100 100 81 81 3.0 3.0 100 100 (.) 2.0

Table 1. U.S. Non-Agricultural Imports: Preference Coverage,1 Utilization,2 and Average Nominal Tariff Preference,3 2003 AGOA Coverage AGOA Utilization AGOA Av. Tariff Pref. GSP Coverage GSP Utilization GSP Av. Tariff Pref.
Overall4 Non-App Overall4
Non-App App4 Overall4
Non-App App4 Overall
Non-App Overall Overall
Congo (DROC)7 100 100 0 0 2.1 2.1 100 100 93 5.1
Ethiopia 5,6 89 2 99 0 99 17.8 4.1 18.3 11 99 97 3.8
Gambia 0 0 73 82 29 2.5
Guinea 5 5 0 0 7.5 7.5 97 99 21 3.6
Lesotho 5,6 100 0 95 0 95 18.4 18.4 (.) 100 30 4.7
Madagascar 5,6 99 20 95 81 95 15.6 8.3 15.9 1 75 71 4.9
Malawi 5,6 100 10 97 100 97 18.6 5.3 19.1 (.) 90 100 3.2
Mali 5,6,8 25 13 0 1 0 11.0 7.2 13.4 68 79 61 5.0
Mauritania 0 0 4 100 93 2.2
Mozambique 5,6 98 0 100 0 100 20.2 20.2 2 78 39 3.0
Niger 5,6,8 4 2 7 16 0 8.2 8.6 6.7 79 81 12 4.0
Rwanda 5,6 0 0 98 98 4 4.0
Sao Tome/Prin. (.) (.) 0 0 99 100 0 2.0
Sierra Leone 13 27 0 0 12.3 12.3 35 73 9 3.1
Tanzania 5,6 41 (.) 90 0 91 13.8 5.0 14.7 16 27 90 4.8
Uganda 5,6 94 0 88 0 88 22.3 22.3 6 98 44 3.7
Zambia 5,6 1 1 0 0 3.0 3.0 97 97 100 5.1 1 Ratio of eligible imports to total dutiable imports. 2 Ratio of imports entering under preference to total eligible imports. 3 Difference between nominal ad valorem tariff equivalent and nominal preferential tariff. Covers all HS 8-digit lines with eligible US imports in 2003. 4 Apparel is defined as all lines within HS 61 and 62 (including the non-US value of production-sharing (HTS 9802.00.80)). For all countries in ATPA, CBTPA and AGOA (with apparel eligibility), overall calculations assumes all apparel is potentially eligible for apparel benefits. Thus “utilization” is actually the ratio of US imports entering under a preference to total US apparel imports. 5 Country is eligible for apparel benefits. 6 Country is eligible for special rule for apparel from LDC 7 AGOA benefits delayed until 10/31/03. 8 AGOA eligibility as of 12/03. (.) Indicates less than one percent.

Table 2. U.S. Non-Agricultural Imports: GSP Coverage1, Utilization2 and Average Tariff Preference3, 2003
Coverage (percent)
Utilization
(percent)
Av. Tariff Preference (percent)
Coverage (percent)
Utilization
(percent)
Av. Tariff Preference (percent)
Coverage (percent)
Utilization
(percent)
Av. Tariff Preference (percent)
Albania 51 69 4.2 Latvia 4 87 4.1 Tunisia 20 50 4.1
Anguilla 94 92 2.8 Lebanon 85 98 3.8 Turkey 31 86 3.9
Argentina 26 78 3.8 Lithuania 3 80 4.1 Turks 100 1 2.9
Armenia 83 100 4.5 Macedonia 9 85 4.6 Uruguay 70 93 3.7
Bahrain 34 99 3.8 Moldova 1 75 2.2 Uzbekistan 6 68 4.4
Bosnia-Herc. 74 86 5.1 Mongolia 1 12 3.1 Venezuela 7 96 3.8
Br Indian 39 0 1.7 Morocco 13 52 4.3 West Bank 84 74 6.1
Brazil 46 64 3.9 Niue 14 0 4.0 Western Sahara 100 0 2.7
Bulgaria 12 85 3.8 Norfolk 8 0 1.9 Zimbabwe 88 98 4.7
Chile 92 32 3.8 Oman 16 99 4.7
Christmas 68 0 3.1 Pakistan 5 80 4.3 GSP-LDC Cocos 64 0 4.7 Papua (.) 53 3.1 Afghanistan 27 0 2.7
Cook 76 8 5.2 Paraguay 51 97 4.4 Angola 100 94 2.0
Croatia 76 94 3.7 Philippines 39 65 4.0 Bangladesh 2 89 6.2
Czech 79 52 3.9 Pitcairn 97 0 2.3 Bhutan 22 62 8.0
Egypt 3 82 3.9 Poland 70 62 3.8 Burkina 93 61 4.3
Estonia 23 92 4.2 Romania 30 79 4.0 Burundi (.)
Fiji 2 92 3.6 Russia 14 87 4.0 Cambodia 1 72 5.7
Georgia 33 96 2.9 Slovak Rep. 13 74 3.7 Eq Guinea 100 93 1.5
Gibraltar 84 0 3.2 Solomon 96 0 4.3 Kiribati 100 0 2.9
Hungary 71 52 3.7 Sri Lanka 7 90 4.6 Nepal 5 76 4.0
India 50 87 4.0 St Helena 99 0 4.6 Samoa 8 2 4.1
Indonesia 39 65 4.1 Suriname 100 55 2.7 Somalia 95 0 1.3
Jordan 15 63 4.0 Thailand 56 76 4.0 Togo 25 100 4.6
Kazakhstan 62 100 4.3 Tokelau 22 65 4.0 Vanuatu 100 100 3.2
Kyrgystan 7 100 5.1 Tonga 95 17 3.1 Yemen 100 86 1.7 1 Ratio of eligible imports to total dutiable imports. 2 Ratio of imports entering under preference to total eligible imports. 3 Difference between nominal ad valorem tariff equivalent and nominal preferential tariff. Covers all HS 8-digit lines with eligible US imports in 2003. (.) indicates less than one percent.

Table 3. U.S. Agricultural Imports: Preference Coverage,1 Utilization,2 and Average Nominal Tariff Preference,3 2003 CBERA GSP
Coverage (percent)
Utilization (percent)
Av. Tariff Preference (percent)
GSP Coverage
(percent) GSP Utilization
(percent) Av. Tariff Preference
(percent)
Antigua 100 52 14.8 98 0
Aruba
Bahamas 100 87 4.1 0
Br Virgin Is 100 100 3.3 100 0
Dominica Is 100 61 4.3 71 40 6.4
Grenada Is 100 0 100 0
Montserrat Is
Netherlands Ant 100 89 6.4 0
St Kitts-Nevis 100 100 0.1 100 0
St Vinc / Gren 100 71 5.4 99 0
CBTPA GSP
Coverage (percent) Utilization (percent)
Av. Tariff Preference (percent)
Coverage
(percent) Utilization (percent) Av. Tariff Preference
(percent)
Barbados 100 97 8.3 82 0 Belize 100 98 11.0 60 3 3.2 Costa Rica 100 95 6.4 40 11 6.6 Dominican Rep 100 96 7.1 87 1 4.9 El Salvador 100 70 6.3 83 36 4.9 Guatemala 100 83 6.3 79 17 5.0 Guyana 100 87 4.7 99 11 4.8 Haiti 100 95 6.3 100 4 4.9 Honduras 100 82 7.9 89 20 4.5 Jamaica 100 98 6.6 41 5 4.0 Nicaragua 100 100 8.0 0 Panama 100 94 7.0 96 5 3.6 St Lucia Is 100 76 4.3 100 13 3.6
Trin & Tobago 100 93 9.4 91 6 3.5
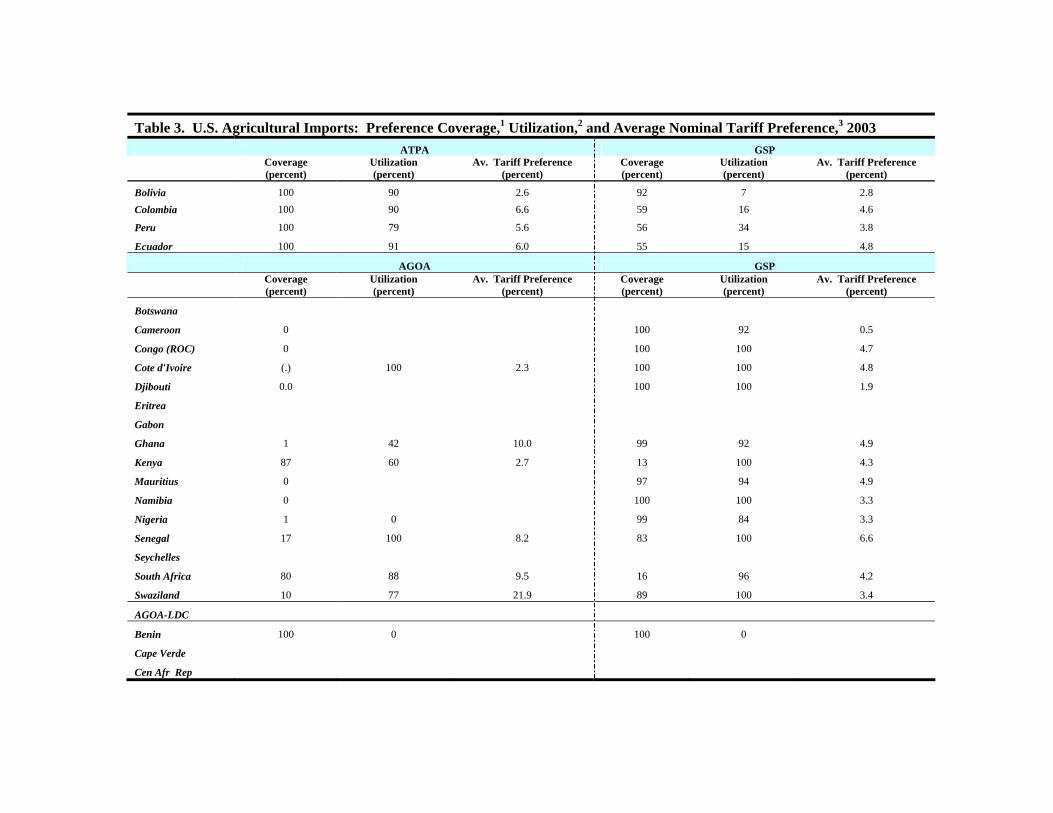
Table 3. U.S. Agricultural Imports: Preference Coverage,1 Utilization,2 and Average Nominal Tariff Preference,3 2003 ATPA GSP
Coverage (percent)
Utilization (percent)
Av. Tariff Preference (percent)
Coverage
(percent) Utilization
(percent) Av. Tariff Preference
(percent)
Bolivia 100 90 2.6 92 7 2.8 Colombia 100 90 6.6 59 16 4.6
Peru 100 79 5.6 56 34 3.8
Ecuador 100 91 6.0 55 15 4.8
AGOA GSP
Coverage (percent)
Utilization (percent)
Av. Tariff Preference (percent)
Coverage
(percent) Utilization
(percent) Av. Tariff Preference
(percent)
Botswana
Cameroon 0 100 92 0.5
Congo (ROC) 0 100 100 4.7
Cote d'Ivoire (.) 100 2.3 100 100 4.8
Djibouti 0.0 100 100 1.9
Eritrea
Gabon
Ghana 1 42 10.0 99 92 4.9
Kenya 87 60 2.7 13 100 4.3
Mauritius 0 97 94 4.9
Namibia 0 100 100 3.3
Nigeria 1 0 99 84 3.3
Senegal 17 100 8.2 83 100 6.6
Seychelles
South Africa 80 88 9.5 16 96 4.2
Swaziland 10 77 21.9 89 100 3.4
AGOA-LDC
Benin 100 0 100 0
Cape Verde
Cen Afr Rep

Table 3. U.S. Agricultural Imports: Preference Coverage,1 Utilization,2 and Average Nominal Tariff Preference,3 2003 AGOA GSP
Coverage (percent)
Utilization (percent)
Av. Tariff Preference (percent)
Coverage
(percent) Utilization (percent)
Av. Tariff Preference (percent)
Chad
Congo (DROC) 4 0 100 100 1.0
Ethiopia 39 6 1.3 100 92 3.1
Gambia
Guinea 0 100 100 6.1
Lesotho
Madagascar 0 100 71 3.7
Malawi 92 30 9.2 100 49 6.3
Mali 5
Mauritania
Mozambique 0 100 100 3.4
Niger 5 (.) 0 100 0
Rwanda
Sao Tome/Prin.
Sierra Leone 60 0 100 33 11.3
Tanzania 59 94 6.8 41 67 2.8
Uganda 42 68 2.3 100 72 0.7
Zambia 41 0 100 59 5.8 1 Ratio of eligible imports to total dutiable imports. 2 Ratio of imports entering under preference to total eligible imports. 3 Difference between nominal ad valorem tariff equivalent and nominal preferential tariff. Covers all HS 8-digit lines with eligible US imports in 2003. 4 AGOA benefits delayed until 10/31/03. 5 AGOA eligibility as of 12/03. (.) Indicates less than one percent.

Table 4. U.S. Agricultural Imports: GSP Coverage1, Utilization2 and Average Tariff Preference3, 2003
GSP Coverage (percent)
Utilization
(percent)
Av. Tariff Preference (percent)
Coverage (percent)
Utilization
(percent)
Av. Tariff Preference (percent)
Coverage (percent)
Utilization
(percent)
Av. Tariff Preference (percent)
Albania 100 34 1.9 Kyrgystan Tonga 98 100 7.0 Anguilla 100 100 6.0 Latvia 6 98 4.2 Tunisia 94 98 4.2 Argentina 36 87 4.5 Lebanon 89 97 4.6 Turkey 43 97 4.3 Armenia 57 98 5.5 Lithuania 2 83 5.4 Turks and Caicos Is. Bahrain Macedonia 76 97 6.6 Uruguay 11 94 5.3 Bosnia-Hercegov. 90 85 5.8 Moldova 30 71 6.6 Uzbekistan 100 100 3.8 Br Indian Mongolia 0 Venezuela 95 99 3.7 Brazil 24 95 4.0 Morocco 49 41 6.8 West Bank 100 100 1.3 Bulgaria 68 97 4.3 Niue Western Sahara Chile 14 83 3.8 Norfolk 100 57 2.4 Zimbabwe
Christmas Oman 20 92 1.4 GSP-LDC Cocos Is. Pakistan 49 99 4.2 Afghanistan 1 0 Cook 0 Papua 100 100 3.4 Angola Croatia 87 99 4.6 Paraguay 68 100 3.7 Bangladesh 100 68 5.9
Czech 88 81 6.2 Philippines 41 86 4.9 Bhutan 100 100 3.0 Egypt 28 98 4.2 Pitcairn 100 100 5.6 Burkina 100 62 3.7 Estonia 99 97 3.7 Poland 88 69 5.3 Burundi Fiji 98 100 3.9 Romania 14 63 4.3 Cambodia 100 88 10.6 Georgia 23 82 4.6 Russia 84 95 3.5 Eq Guinea Gibraltar Slovak Rep. 24 84 4.5 Kiribati Heard/McDonald 100 100 7.0 Solomon Is. Nepal 100 92 5.0 Hungary 71 68 4.2 Sri Lanka 93 94 3.8 Samoa 100 23 4.0 India 40 95 4.2 St Helena Somalia 100 0 Indonesia 37 97 4.4 Suriname 100 100 1.8 Togo 69 100 8.3 Jordan 84 76 5.3 Thailand 39 96 4.9 Vanuatu 100 0
Kazakhstan 0 Tokelau 100 0 Yemen 1 Ratio of eligible imports to total dutiable imports. 2 Ratio of imports entering under preference to total eligible imports. 3 Difference between nominal ad valorem tariff equivalent and nominal preferential tariff. Covers all HS 8-digit lines with eligible US imports in 2003. (.) indicates less than one percent.
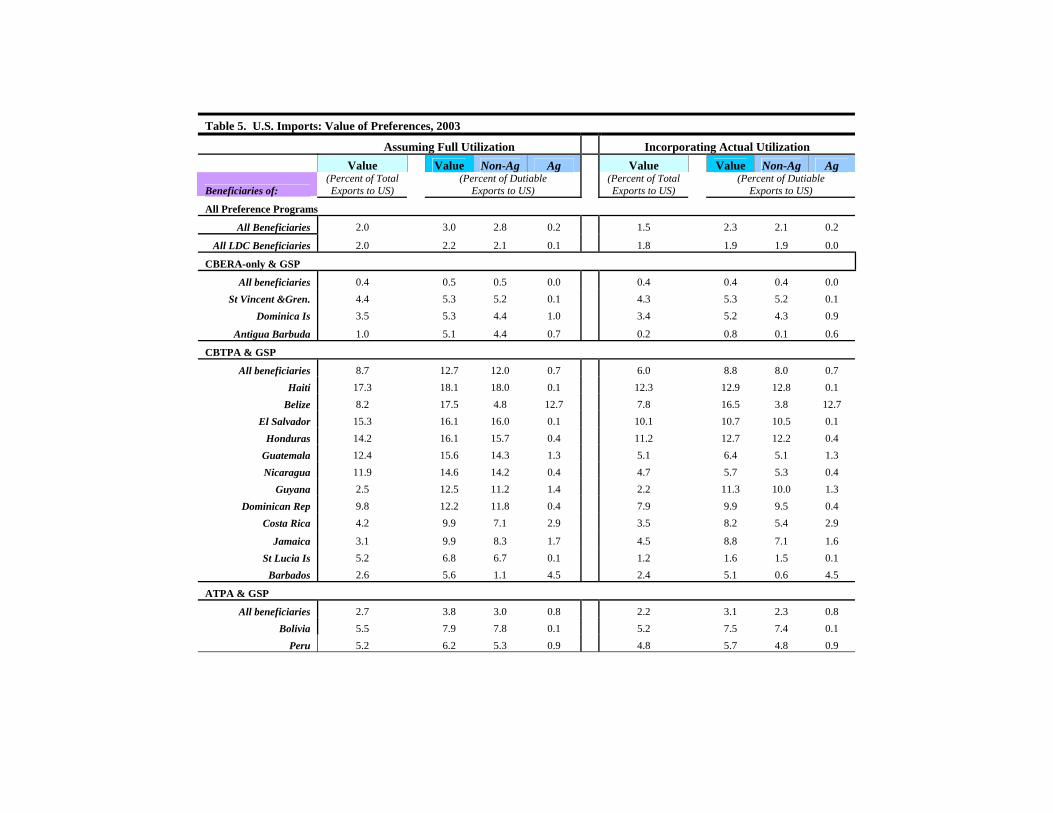
Table 5. U.S. Imports: Value of Preferences, 2003
Assuming Full Utilization Incorporating Actual Utilization Value Value Non-Ag Ag Value Value Non-Ag Ag
Beneficiaries of: (Percent of Total Exports to US)
(Percent of Dutiable Exports to US)
(Percent of Total Exports to US)
(Percent of Dutiable Exports to US)
All Preference Programs
All Beneficiaries 2.0 3.0 2.8 0.2 1.5 2.3 2.1 0.2
All LDC Beneficiaries 2.0 2.2 2.1 0.1 1.8 1.9 1.9 0.0
CBERA-only & GSP
All beneficiaries 0.4 0.5 0.5 0.0 0.4 0.4 0.4 0.0 St Vincent &Gren. 4.4 5.3 5.2 0.1 4.3 5.3 5.2 0.1
Dominica Is 3.5 5.3 4.4 1.0 3.4 5.2 4.3 0.9
Antigua Barbuda 1.0 5.1 4.4 0.7 0.2 0.8 0.1 0.6
CBTPA & GSP
All beneficiaries 8.7 12.7 12.0 0.7 6.0 8.8 8.0 0.7 Haiti 17.3 18.1 18.0 0.1 12.3 12.9 12.8 0.1
Belize 8.2 17.5 4.8 12.7 7.8 16.5 3.8 12.7 El Salvador 15.3 16.1 16.0 0.1 10.1 10.7 10.5 0.1
Honduras 14.2 16.1 15.7 0.4 11.2 12.7 12.2 0.4 Guatemala 12.4 15.6 14.3 1.3 5.1 6.4 5.1 1.3 Nicaragua 11.9 14.6 14.2 0.4 4.7 5.7 5.3 0.4
Guyana 2.5 12.5 11.2 1.4 2.2 11.3 10.0 1.3 Dominican Rep 9.8 12.2 11.8 0.4 7.9 9.9 9.5 0.4
Costa Rica 4.2 9.9 7.1 2.9 3.5 8.2 5.4 2.9
Jamaica 3.1 9.9 8.3 1.7 4.5 8.8 7.1 1.6 St Lucia Is 5.2 6.8 6.7 0.1 1.2 1.6 1.5 0.1
Barbados 2.6 5.6 1.1 4.5 2.4 5.1 0.6 4.5
ATPA & GSP
All beneficiaries 2.7 3.8 3.0 0.8 2.2 3.1 2.3 0.8 Bolivia 5.5 7.9 7.8 0.1 5.2 7.5 7.4 0.1
Peru 5.2 6.2 5.3 0.9 4.8 5.7 4.8 0.9

Table 5. U.S. Imports: Value of Preferences, 2003 Assuming Full Utilization Incorporating Actual Utilization
Value Value Non-Ag Ag Value Value Non-Ag Ag
Beneficiaries of: (Percent of Total Exports to US)
(Percent of Dutiable Exports to US)
(Percent of Total Exports to US)
(Percent of Dutiable Exports to US)
AGOA & GSP
All beneficiaries 1.4 1.8 1.7 0.1 1.1 1.4 1.3 0.0 Botswana 11.8 21.8 21.8 0.0 10.7 19.9 19.9 0.0 Swaziland 17.7 18.5 18.3 0.2 15.8 16.5 16.4 0.2
Kenya 14.4 17.4 17.4 0.1 13.4 16.3 16.2 0.1 Mauritius 15.6 16.6 16.6 0.0 8.0 8.6 8.5 0.0
Namibia 6.2 13.1 13.1 0.0 4.8 10.3 10.3 0.0 AGOA-LDC & GSP
All beneficiaries 9.7 14.4 13.7 0.7 9.1 13.6 13.0 0.5 Cape Verde 17.3 22.8 22.8 0.0 14.6 19.2 19.2 0.0
Lesotho 18.8 18.8 18.8 0.0 17.9 17.9 17.9 0.0
Uganda 1.0 18.8 18.8 0.0 0.9 16.9 16.9 0.0 Madagascar 8.6 16.5 16.5 0.0 8.2 15.8 15.8 0.0
Ethiopia 1.6 15.6 14.9 0.7 1.6 15.5 14.8 0.7 Malawi 13.0 14.5 6.7 7.9 10.9 12.3 6.5 5.8
Mozambique 7.7 8.1 5.8 2.3 7.7 8.1 5.8 2.3 Tanzania 0.9 7.4 6.6 0.8 0.8 6.8 6.0 0.7
Zambia 0.3 5.7 2.7 3.0 0.2 3.4 2.7 0.7 Mali 1.8 5.1 5.1 0.0 0.8 2.1 2.1 0.0
GSP-only
All beneficiaries 0.9 1.4 1.3 0.1 0.7 1.1 1.0 0.1 Tonga 0.2 6.2 1.1 5.0 0.2 5.1 0.1 5.0
St Helena 0.6 5.7 5.7 0.0 0.0 0.0 0.0 0.0 GSP-LDC only
All beneficiaries 0.4 0.4 0.4 0.0 0.4 0.4 0.4 0.0 Vanuatu 0.3 6.6 1.5 5.2 0.1 1.5 1.5 0.0

Table 6. U.S. Non-Agricultural Imports: Value of Preferences, 2003 Incorporating Actual Utilization
Value Non-Apparel Apparel
Beneficiaries of: (Percent of Total Dutiable
Non-Ag Exports to US)
CBERA-only & GSP
St Vinc & Gren 5.5 5.5 0.0 Dominica Is 5.3 5.3 0.0
CBTPA & GSP
Guyana 13.6 2.8 10.8 Haiti 13.0 0.2 12.8 Honduras 12.8 0.1 12.7 Jamaica 12.7 0.1 12.6 El Salvador 10.9 0.1 10.8 Dominican Rep 10.6 1.1 9.5 Belize 9.9 0.1 9.8 Costa Rica 8.2 1.2 7.0 Nicaragua 6.1 0.1 6.0 Guatemala 5.8 0.2 5.6
ATPA & GSP
Bolivia 7.6 4.1 3.5 Peru 5.2 1.0 4.2
AGOA & GSP
Botswana 19.9 0.0 19.9 Swaziland 17.2 0.0 17.2 Kenya 16.9 0.0 16.9 Namibia 10.3 0.4 9.9 Mauritius 8.6 0.1 8.5
AGOA-LDC & GSP
Ethiopia 22.0 0.3 21.7 Malawi 19.9 0.0 19.9 Cape Verde 19.2 0.6 18.6 Lesotho 17.9 0.0 17.9 Mozambique 17.8 0.0 17.8 Uganda 17.1 0.1 17 Madagascar 15.9 0.1 15.8 Tanzania 7.3 0.6 6.7

Table 7. U.S. Agricultural Imports: Value of Preferences by Country, 2003 Incorporating Actual Utilization
Value Fresh & Proc. Fruits & Veg. Sugar Other
Beneficiaries of: (Percent of Total Dutiable Agricultural Exports to US)
CBERA-only & GSP
Netherlands Ant. 5.7 0.0 0.0 5.7 CBTPA & GSP
Barbados 22.5 0.0 0.0 22.5 Belize 20.6 19.2 1.3 0.0 Guatemala 11.0 8.7 1.3 1.0 Honduras 9.2 7.3 0.4 1.5 Costa Rica 8.3 7.3 0.1 0.8 Triindad. & Tobago 5.4 0.0 0.0 5.4 ATPA & GSP
Peru 11.0 10.2 0.3 0.5 Colombia 6.7 0.3 0.6 5.8 Ecuador 6.1 2.2 0.2 3.8
AGOA & GSP
Senegal 6.8 2.8 0.0 4.0
AGOA-LDC & GSP
Malawi 8.6 0.0 0.3 8.3 Guinea 5.6 2.5 0.0 3.1 GSP-only
Tonga 7.5 7.5 0.0 0.0
Lebanon 6.8 5.3 0.4 1.1
Heard/McDonald Is. 6.4 0.0 0.0 6.4
Paraguay 6.4 0.0 6.3 0.1
Anguilla 6.0 0.0 0.0 6.0
Pitcairn Is. 5.6 0.0 0.0 5.6
Bosnia-Herzegovina 5.5 0.0 0.0 5.5
GSP-LDC-only
Cambodia 9.9 9.9 0.0 0.0
Bangladesh 6.9 0.4 0.0 6.5
Togo 5.7 0.0 0.0 5.7