Embed Size (px)
Citation preview

Revision
Revision 1 (DRAFT – Issue for Review)
Date
September 10, 2019
QUALITY ASSURANCE PROJECT PLAN TORRANCE REFINERY RULE 1180 FENCELINE AIR
MONITORING SYSTEM

Revision 1 (DRAFT – Issue for Review) Quality Assurance Project Plan
September 10, 2019 Torrance Refinery Rule 1180 Fenceline Air Monitoring System
ii
Revision History
This page is intentionally blank.

Revision 1 (DRAFT – Issue for Review) Quality Assurance Project Plan
September 10, 2019 Torrance Refinery Fenceline Air Monitoring System
1 of 48
Title and Approval Sheet
A. PROJECT MANAGEMENT
A.1 Title and Approval Sheet
Document Title:
Quality Assurance Project Plan for Torrance Refinery Rule 1180
Fenceline Air Monitoring System
Revision/Date: Revision 1 (DRAFT – Issue for Review)/September 10, 2019
System Owner:
Name (print):____________________________________________
Environmental Manager
Torrance Refining Company
3700 W. 190th Street, Torrance, California 90504
_____________________________________ / ________________
Signature/Date
Program Quality
Assurance
Manager:
Name (print):____________________________________________
Spectrum Environmental Solutions
2340 W Braker Lane Austin, Texas 78731
_____________________________________ / ________________
Signature/Date
System
Manager/Operator:
Name (print):____________________________________________
Spectrum Environmental Solutions
2340 Braker Lane, Suite A, Austin, TX 78758
_____________________________________ / ________________
Signature/Date
Rule 1180 Quality
Assurance Officer:
Name (print):____________________________________________
South Coast Air Quality Management District
21865 Copley Drive, Diamond Bar, CA 91765
_____________________________________ / ________________
Signature/Date
This approval sheet may be signed in counterparts for full approval.

Revision 1 (DRAFT – Issue for Review) Quality Assurance Project Plan
September 10, 2019 Torrance Refinery Fenceline Air Monitoring System
2 of 48
Table of Contents
A.2 Table of Contents
A. PROJECT MANAGEMENT 1 A.1 Title and Approval Sheet 1 A.2 Table of Contents 2 A.3 Distribution List 7 A.4 Project Organization and Roles 7 A.5 Problem Definition/Background 11 A.6 System Description and Approach 11 A.6.1 Open-Path Monitors 18 A.6.2 Fixed-Point Monitors 19 A.6.3 Meteorological Monitoring 20 A.6.4 Ancillary Equipment 21 A.7 Quality Objectives and Criteria 21 A.7.1 Project Quality Objectives 22 A.7.2 Measurement Performance Criteria 22 A.8 Training and Certifications 24 A.9 Documents and Records 24
B. DATA GENERATION AND ACQUISITION 26 B.1 Sampling Process Design 26 B.2 Sampling Methods 26 B.2.1 Open-Path Monitoring Systems 26 B.2.2 Fixed-Point Monitor Data 27 B.2.3 Meteorological Data Collection 27 B.2.4 Backup Monitoring 27 B.3 Monitoring Data Documentation, Custody and Control 27 B.4 Analytical Methods 27 B.4.1 Spectral Methods for Open-Path analyzers 27 B.4.2 Black Carbon Analyzer 28 B.4.3 Hydrogen Sulfide Analyzer 28 B.5 Quality Control 29 B.5.1 Automated QA/QC 29 B.5.2 Statistics for the Assessment of QC Checks 29 B.6 Equipment Inspection, Testing, and Maintenance 30 B.6.1 Open-Path FTIR Monitor Inspection, Testing and Maintenance 31 B.6.2 Open-Path UVDOAS Monitor Inspection, Testing and Maintenance 31 B.6.3 Black Carbon Monitor Inspection, Testing and Maintenance 32 B.6.4 Inspection, Testing and Maintenance of Hydrogen Sulfide Monitors 33 B.6.5 Inspection, Testing and Maintenance of Meteorological Sensors 33 B.6.6 Remote and Visual Inspection 34 B.7 Equipment Calibration 35 B.7.1 Fenceline Air Monitoring System Validation for Open-Path Systems 35 B.7.2 Quality Assurance for Black Carbon Monitors (Aethalometers) 38 B.7.3 Quality Assurance for Hydrogen Sulfide Monitors 39 B.7.4 Meteorological Equipment Calibrations 39 B.7.5 Fenceline Air Monitoring System Calibration and Verification Recordkeeping 40 B.8 Inspection of Supplies and Consumables 40 B.9 Non-Direct Measurements 40 B.10 Data Management 41

Revision 1 (DRAFT – Issue for Review) Quality Assurance Project Plan
September 10, 2019 Torrance Refinery Fenceline Air Monitoring System
3 of 48
Table of Contents
B.10.1 Website Management and Community Interface 42 B.10.2 Public Notification System 42
C. ASSESSMENT AND OVERSIGHT 43 C.1 Audits and Response Actions 43 C.1.1 Technical Systems Audits 43 C.1.2 Performance Evaluation Audits 44 C.2 Reports to Management 44
D. DATA VALIDATION AND USABILITY 45 D.1 Data Review, Verification, and Validation 45 D.1.1 Open-Path and Point Source Monitors 45 D.1.2 Meteorology Sensors 46 D.2 Verification and Validation Methods 46 D.3 Reconciliation with Data Quality Objectives 48 D.3.1 Assessment of Measurement Performance 48 D.3.2 Data Quality Assessment 48
TABLES
Table A-1: Distribution list 7 Table A-2: Key individuals and responsibilities 8 Table A-3: Target air pollutants and monitored meteorological parameters 14 Table A-4: Rule 1180 fenceline air monitoring system equipment 14 Table A-5: Approximate detection levels for open-path monitors 18 Table A-6: Performance specifications for hydrogen sulfide and black carbon fixed-point
monitors. 20 Table A-7: Performance specifications for the meteorological tower components 20 Table A-8: DQIs and MQOs for refinery fenceline air monitoring systems 23 Table A-9: DQIs and MQOs for the meteorological tower system 23 Table B-1: Inspection, testing and maintenance activities for open-path FTIR monitors 31 Table B-2: Inspection, testing and maintenance activities for open-path UVDOAS monitors 32 Table B-3: Inspection, testing and maintenance activities for black carbon monitors 32 Table B-4: Inspection, testing and maintenance activities for hydrogen sulfide monitors 33 Table B-5: Inspection, testing and maintenance activities for meteorological sensors 34 Table B-6: Quality assurance for FTIR monitors 35 Table B-7: Quality assurance for open-path UVDOAS monitors 36 Table B-8: Reference gases to be used during commissioning and periodic QA checks for
fenceline monitoring systems 38 Table B-9: Quality assurance for black carbon monitors (aethalometers) 39 Table B-10: Quality Assurance for hydrogen sulfide monitors 39 Table B-11: Meteorological sensor calibration and accuracy criteria 40
FIGURES
Figure A-1: QA organization chart 8 Figure A-2: Layout of open-path FTIR, open-path UVDOAS and fixed-point monitors 13 Figure B-2: Raw and validated data flow 41
Revision 1 (DRAFT – Issue for Review) Quality Assurance Project Plan
September 10, 2019 Torrance Refinery Fenceline Air Monitoring System
4 of 48
Table of Contents
APPENDICES
Appendix I – Fenceline Air Monitoring Equipment Specifications
Appendix II – Torrance Refinery Rule 1180 Fenceline Air Monitoring Plan
REVISION HISTORY
Revision Date Prepared by Approved by Comment
0 July 27, 2018 Glenn England Scott Weaver Issue for review - SCAQMD
1 September 10, 2019 Glenn England Valerie Tse Issue for review – DRAFT for
SCAQMD review
TORCRule1180QAPP_Draft1.0.docx

Revision 1 (DRAFT – Issue for Review) Quality Assurance Project Plan
September 10, 2019 Torrance Refinery Fenceline Air Monitoring System
5 of 48
Table of Contents
ACRONYMS AND ABBREVIATIONS
Acronym Definition
% percent
° degrees
°C degrees centigrade
µg/m3 micrograms per cubic meter
cm centimeter
cm-1 inverse centimeters (wavelength)
CV coefficient of variation
DC direct current
DQI data quality indicator
DQO data quality objective
EPA U.S. Environmental Protection Agency
FAQ frequently-asked-questions
FTIR Fourier transform infrared
GB gigabytes
GHz gigahertz
hPa hectopascals
Hz Hertz
K Kelvins
km kilometer
LAN local area network
LED light-emitting diode
m/s meters per second
mm//hr millimeters per hour
mm/hr millimeters per hour
MQO measurement quality objective
ng/m3 nanograms per cubic meter
nm nanometer
NO nitric oxide
NO2 nitrogen dioxide
NOX nitrogen oxides
O&M operation and maintenance
OPA open-path analyzer location
OPR open-path retroreflector location
PC personal computer
ppb parts per million
ppm parts per million
PMT photomultiplier tube
QA quality assurance
QAPP quality assurance project plan
QC quality control
SCAQMD South Coast Air Quality Management District
SEP supplemental environmental project
SOPs standard operating procedures
TBD to be determined
TORC Torrance Refining Company, LLC
USB universal serial bus

Revision 1 (DRAFT – Issue for Review) Quality Assurance Project Plan
September 10, 2019 Torrance Refinery Fenceline Air Monitoring System
6 of 48
Table of Contents
Acronym Definition
UV ultraviolet
UVDOAS ultraviolet differential optical absorption
spectroscopy
VAC volts alternating current
VDC volts direct current
VOCs volatile organic compounds
W watts

Revision 1 (DRAFT – Issue for Review) Quality Assurance Project Plan
September 10, 2019 Torrance Refinery Fenceline Air Monitoring System
7 of 48
Distribution List
A.3 Distribution List
The distribution list (Table A-1) identifies all individuals that should receive a copy of this Quality
Assurance Project Plan (QAPP), either in hard copy or electronic format, including any subsequent
revisions.
Table A-1: Distribution list
Name and Role Organization Email Phone Number
Valerie Tse, System
Owner
Torrance Refining
Company [email protected] (310) 212-4597
Craig Sakamoto, Rule
1180 Program Manager
Torrance Refining
Company [email protected] (310) 212-1884
Andrea Polidori, Rule
1180 Program Manager
South Coast Air Quality
Management District [email protected] (909) 396-3283
Brian Cochran, Program
QA Manager
Spectrum
Environmental Solutions [email protected] (512) 739-2904
George Lipinski, System
Manager/Operator
Spectrum
Environmental Solutions [email protected] (512) 966-9685
Dan Currin, Data/QC
Manager
Spectrum
Environmental Solutions [email protected] (512)906-9128
Alex Bellon,
Website/Data System
Manager
Spectrum
Environmental Solutions [email protected] (512)913-2213
Sam Celentano,
Technical Specialist/Site
Operator
Spectrum
Environmental Solutions [email protected] (512) 646-4555
Casey Dreyer, Data
Reviewer
Spectrum
Environmental Solutions [email protected] (512) 646-4555
Cory Higdon, Data
Reviewer
Spectrum
Environmental Solutions [email protected] (512) 646-4555
Bryan Benaway, Lead
Internal Auditor
Spectrum
Environmental Solutions [email protected] (512) 646-4555
A.4 Project Organization and Roles
This section identifies the roles and responsibilities of the key individuals involved in the operation of
the fenceline air monitoring system (Table A-2) and lines of authority and communications between
these individuals and authorities. The organizational chart (Figure A-1) provides lines of authority and
communications for all organizations involved in operation and maintenance of the fenceline air
monitoring system (including contractors and subcontractors) to accomplish the QA objectives
specified in this QAPP.

Revision 1 (DRAFT – Issue for Review) Quality Assurance Project Plan
September 10, 2019 Torrance Refinery Fenceline Air Monitoring System
8 of 48
Project Organization and Roles
Figure A-1: QA organization chart
Table A-2: Key individuals and responsibilities
Name Organization Roles Responsibilities
Valerie Tse Torrance Refining
Company System Owner
Overall system performance
Financial resources to operate and maintain the
System
Appoint System Manager and Program QA
Manager
Review/approve QAPP
Craig Sakamoto Torrance Refining
Company
Rule 1180
Program Manager
Overall system operation, maintenance and data
management
Review/approve quarterly reports
Procure Third-Party QA assessor
George Lipinski Spectrum Environmental
Solutions
System
Manager/Operator
System operation and maintenance
Oversee technical specialists and instrument
suppliers
Coordinate staff resources
System OwnerTorrance Refining Company
Valerie Tse
System Manager/OperatorSpectrum
George Lipinski
Program QA ManagerSpectrum
Brian Cochran
Rule 1180 Program ManagerTorrance Refining Company
Craig Sakamoto
Data/QA ManagerSpectrumDan Currin
Website/Data System ManagerSpectrumAlex Bellon
Technical Specialists/ Site OperatorsSpectrum
Sam Celantano
Data ReviewersSpectrum
Casey DreyerCory Higdon
Lead Internal AuditorSpectrum
Bryan Benaway
Third-Party QA AssessorTBDTBD
Lines of authority
Lines of communication

Revision 1 (DRAFT – Issue for Review) Quality Assurance Project Plan
September 10, 2019 Torrance Refinery Fenceline Air Monitoring System
9 of 48
Project Organization and Roles
Table A-2: Key individuals and responsibilities
Name Organization Roles Responsibilities
Brian Cochran Spectrum Environmental
Solutions
Program Quality
Assurance
Manager
Prepare/revise/approve QAPP
Conformance with QAPP
QAPP updates & revisions
Coordinate internal periodic QA checks and
audits
Review/approve quarterly reports
Dan Currin Spectrum Environmental
Solutions
Data/Quality
Control Manager
Oversee data collection & processing
Oversee daily data anomaly checks &
investigations
Oversee data review & validation
Review/approve quarterly reports
Alex Bellon Spectrum Environmental
Solutions
Website/Data
System Manager
Website administration
Upload reports
Ensure timely response to feedback
Issue notifications
Sam Celentano Spectrum Environmental
Solutions
Technical
Specialists/Site
Operators
Remote and on-site system operation
Preventative maintenance
Unscheduled maintenance (including minor
repairs)
System maintenance notifications
Prepare first draft quarterly reports
Casey Dreyer
Cory Higdon
Spectrum Environmental
Solutions
Data Reviewers Monitor real-time data collection & processing
Perform daily data anomaly checks &
investigations
Perform manual data review & validation
Bryan Benaway Spectrum Environmental
Solutions
Lead Internal
Auditor
Internal auditing tasks
Internal performance evaluations
Internal periodic technical audits
Internal reporting system audits
TBD TBD Third-Party Quality
Assurance
Assessor
Conduct third-party QA activities including:
• Technical systems audits e.g., field,
laboratory, data systems, data validation,
data storage, reporting & recordkeeping,
personnel, training;
• Performance evaluation audits;
• Data quality reviews.

Revision 1 (DRAFT – Issue for Review) Quality Assurance Project Plan
September 10, 2019 Torrance Refinery Fenceline Air Monitoring System
10 of 48
Project Organization and Roles
Torrance Refining Company, LLC (Torrance Refinery) is the System Owner with overall responsibility
for all aspects of fenceline air monitoring system. The System Owner provides the financial resources
necessary to operate and maintain the fenceline air monitoring system in accordance with this QAPP.
The System Owner appoints the organizations that will be responsible for system operation,
maintenance, data management and reporting. The System Owner also reviews and approves the
QAPP.
The system will be managed by a Rule 1180 Program Manager appointed by Torrance Refinery.
The Rule 1180 Program Manager will act as the central point of contact for Torrance Refinery, the
South Coast Air Quality Management District (SCAQMD) and the Program Quality Assurance
Manager. The Rule 1180 Program Manager is responsible for overseeing the system’s operation,
maintenance, reporting, and data management.
The system will be operated by a System Manager/Operator. The System Manager/Operator will be
responsible for operation and maintenance of the fenceline air monitoring system. The System
Manager/Operator will oversee technical specialists, engineers, scientists, and technicians responsible
for operation, maintenance, data collection, data quality, reporting, and website operations. The
System Manager/Operator coordinates staff coverage and serves as a technical resource for site
measurements.
The Program Quality Assurance Manager is responsible for assuring the quality of data on behalf
of the Rule 1180 Program Manager. The Program Quality Assurance Manager may communicate
directly with the System Owner, Rule 1180 Program Manager and SCAQMD, independently of the
System Manager/Operator , providing assurance that any issues identified by the Program Quality
Assurance Manager are promptly addressed. The Program Quality Assurance Manager provides QA
oversight for the system and oversees and reports on QA activities to the Rule 1180 Program
Manager. The Program Quality Assurance Manager assures that daily data review and data
management activities are performed in accordance with the QAPP, works with the Rule 1180 Program
Manager to ensure that any data issues are promptly addressed, and that data provided to the public
are of high quality. The Program Quality Assurance Manager is responsible for developing QAPP
updates and revisions when necessary.
Technical Specialists/Site Operators conduct system operation checks and perform instrument
maintenance. The technical specialists ensure that all measurements are collected in accordance with
SOPs, standard methods, and regulations, where applicable. Technical specialists perform the required
quality checks on instruments and document all work in site logs. Technical specialists may conduct
these activities on-site or remotely, as applicable to the specific activities.
The Instrument Suppliers provide technical support for the instruments deployed in the field.
The Data/Quality Control Manager is responsible for ensuring that daily data reviews are
conducted, oversees data collection and review of data anomalies (e.g., fail auto-screening), and
ensures that data validation follows the schedule and procedures described in the QAPP. The
Data/Quality Control Manager is responsible for preparing quarterly reports, providing message board
updates for O&M activities and report availability and for delivering the validated data to the System
Manager/Operator.
Daily data review and data validation are conducted by experienced air monitoring system analysts.
The Data Reviewers communicate with the Data/Quality Control Manager when there are issues and
may also interact with the Technical Specialists when they observe potential O&M issues that needs to
be addressed.

Revision 1 (DRAFT – Issue for Review) Quality Assurance Project Plan
September 10, 2019 Torrance Refinery Fenceline Air Monitoring System
11 of 48
Problem Definition/Background
The Website/Data System Manager is responsible for properly displaying data on the website,
managing inquiries from the public, and ensuring that validated quarterly reports are available for
download on a quarterly basis. Automated alerting will notify the Website/Data System Manager when
the real-time data are not available on the website. The Website/Data System will be responsible for
assessing and fixing data communication and other information technology–related issues concerning
the website and data system.
The Lead Internal Auditor will perform auditing tasks, performance evaluations, periodic technical
audits, and system audits.
The Third-Party QA Assessor will be responsible for assessing whether the fenceline air monitoring
system is being operated and maintained in accordance with the Torrance Refinery Rule 1180
Fenceline Air Monitoring Plan (provided in Appendix II) and this Quality Assurance Project Plan. The
Third-Party QA Assessor or designated representative will coordinate and perform third-party QA
activities. These will include developing and performing periodic technical systems audits and
performance evaluation audits. The Third-Party QA Assessor will prepare audit reports to the Program
Administrator and recommendations for corrective actions, if any.
A.5 Problem Definition/Background
This QAPP applies to a fenceline air monitoring system installed at the Torrance Refinery to comply
with SCAQMD Rule 1180 Refinery Fenceline and Community Air Monitoring1 (the “Rule”). This QAPP is
intended to satisfy the requirements of Rule 1180 and its associated Refinery Fenceline Air Monitoring
Guidelines.2 As suggested in the SCAQMD Rule 1180 guidelines, this QAPP generally conforms with
content requirements specified in EPA guidelines.3
Rule 1180 requires monitoring for target air compounds along the refinery fenceline using open-path
optical and point measurement technologies and meteorological monitoring instruments. The Rule
requires public access to the data in real time via a public website and notification system.
This QAPP defines criteria and actions that the project team will take to ensure that the data collected
meet all regulatory requirements and the data quality objectives (DQOs) defined in the QAPP.
A.6 System Description and Approach
The fenceline air monitoring system will collect continuous monitoring data for the target pollutants
utilizing open-path monitors and fixed-point monitors to provide continuous real-time data for target
air pollutants at or near the Torrance Refinery perimeter fenceline. The monitoring system is intended
as a permanent installation with an estimated lifespan of at least twenty years.
The system configuration includes six open-path analyzer locations (OPA), identified as OPA-1 through
OPA-6 in Figure A-2 and listed in Table A-4. Each of these six locations will have one monostatic open-
path Fourier transform infrared (FTIR) analyzer and one monostatic open-path ultraviolet differential
optical absorption (UVDOAS) analyzer. All locations serve two paths4 on an alternating 5-minute basis
by use of a computer-controlled motorized pan-and-tilt mount. For each of the six open-path analyzer
locations there are two paths identified as “a” and “b”, with open-path retroreflector (OPR) for each
analyzer located at the path end opposite the analyzer (e.g., path from OPA-1 to OPR-1a, path OPA-1
1 See http://www.aqmd.gov/docs/default-source/rule-book/reg-xi/r1180.pdf?sfvrsn=9 (accessed August 2019).
2 See http://www.aqmd.gov/docs/default-source/rule-book/support-documents/1180/rule-1180-guidelines.pdf
(accessed August 2019).
3 U.S.EPA, Guidance for quality Assurance Project Plans, QA-G5, 2002. EPA/240/R-02/009. See
https://www.epa.gov/sites/production/files/2015-06/documents/g5-final.pdf (accessed August 2019)
4 See Figure A-2 in this QAPP and Section 5 of the Torrance Refinery Rule 1180 Fenceline Air Monitoring Plan
(included in Appendix II) for path lengths.

Revision 1 (DRAFT – Issue for Review) Quality Assurance Project Plan
September 10, 2019 Torrance Refinery Fenceline Air Monitoring System
12 of 48
System Description and Approach
to OPR-1b). Additionally, continuous fixed-point monitors for measuring black carbon and hydrogen
sulfide are placed at six locations around the facility boundary (Figure A-2).
The fenceline air monitor locations were selected by considering potential for community exposure,
locations of potential emission sources, and apparent prevalent wind directions. It is expected that the
chosen locations will provide data representative of the overall air quality and meteorology of the
area.
This QAPP also addresses meteorological monitoring as specified in the Rule 1180 Guidelines.
Meteorological monitoring is necessary to characterize wind and weather patterns during monitoring
and estimate movement and dispersion of pollutants. Rule 1180 Guidelines require monitoring for
following meteorological parameters: ambient temperature, horizontal wind speed, horizontal wind
direction, barometric pressure, relative humidity, visibility, and precipitation. The parameters to be
monitored including target pollutants and meteorological parameters are listed in Table A-3. The
major components and features of the system are summarized in Table A-4. See Appendix I of this
QAPP for additional equipment specifications.

Revision 1 (DRAFT – Issue for Review) Quality Assurance Project Plan
September 10, 2019 Torrance Refinery Fenceline Air Monitoring System
13 of 48
System Description and Approach
Figure A-2: Layout of open-path FTIR, open-path UVDOAS and fixed-point monitors

Revision 1 (DRAFT – Issue for Review) Quality Assurance Project Plan
September 10, 2019 Torrance Refinery Fenceline Air Monitoring System
14 of 48
System Description and Approach
Table A-3: Target air pollutants and monitored meteorological parameters
Category Parameters
Criteria air pollutants Sulfur dioxide
Nitrogen oxides (=nitric oxide + nitrogen dioxide)
Volatile organic compounds (VOCs)
Total VOCs (selected non-methane hydrocarbons)
Formaldehyde
Acetaldehyde
Acrolein
1,3-Butadiene
Benzene
Toluene
Ethylbenzene
Xylenes (=o-xylene + m-xylene + p-xylene)
Styrene5
Other compounds
Hydrogen cyanide
Hydrogen sulfide
Carbonyl sulfide
Ammonia
Black carbon
Hydrogen fluoride
Meteorological parameters
Horizontal wind speed and direction
Temperature
Precipitation
Barometric pressure
Relative humidity
Visibility
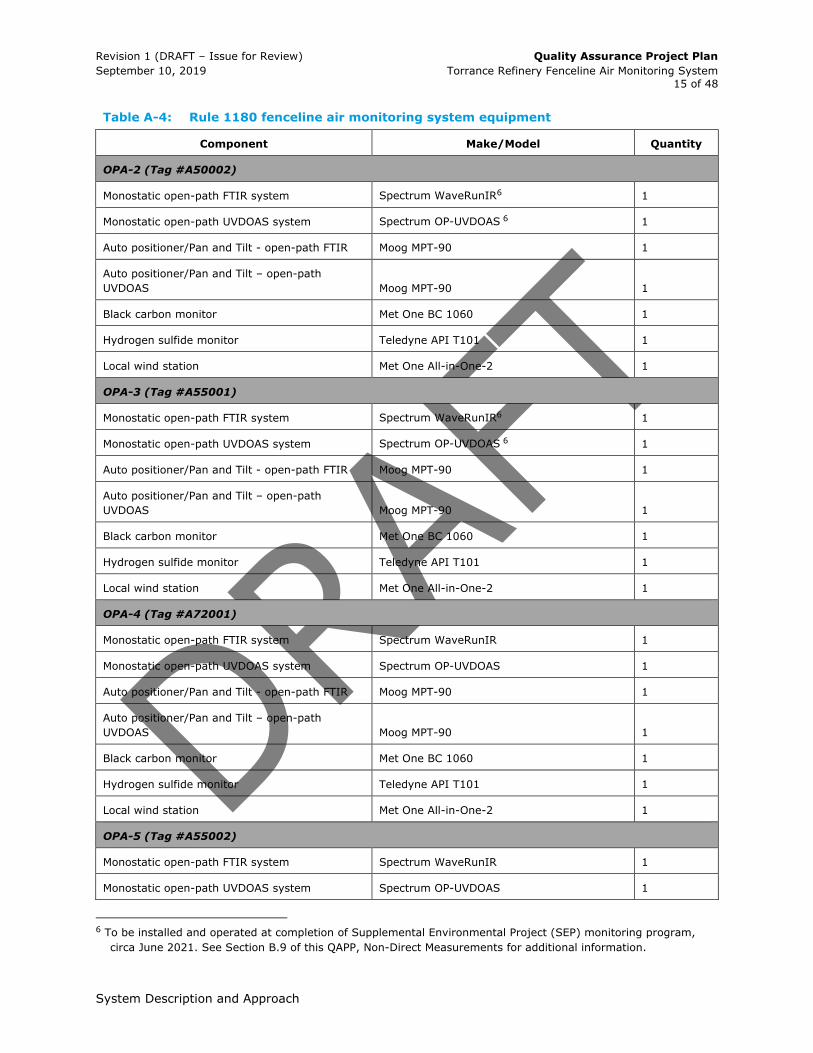
Table A-4: Rule 1180 fenceline air monitoring system equipment
Component Make/Model Quantity
OPA-1 (Tag #A50001)
Monostatic open-path FTIR system Spectrum WaveRunIR 1
Monostatic open-path UVDOAS system Spectrum OP-UVDOAS 1
Auto positioner/Pan and Tilt - open-path FTIR Moog MPT-90 1
Auto positioner/Pan and Tilt – UVDOAS Moog MPT-90 1
Local wind station Met One All-in-One-2 1
5 Styrene data will be provided in quarterly reports only.
Revision 1 (DRAFT – Issue for Review) Quality Assurance Project Plan
September 10, 2019 Torrance Refinery Fenceline Air Monitoring System
15 of 48
System Description and Approach
Table A-4: Rule 1180 fenceline air monitoring system equipment
Component Make/Model Quantity
OPA-2 (Tag #A50002)
Monostatic open-path FTIR system Spectrum WaveRunIR6 1
Monostatic open-path UVDOAS system Spectrum OP-UVDOAS 6 1
Auto positioner/Pan and Tilt - open-path FTIR Moog MPT-90 1
Auto positioner/Pan and Tilt – open-path
UVDOAS Moog MPT-90 1
Black carbon monitor Met One BC 1060 1
Hydrogen sulfide monitor Teledyne API T101 1
Local wind station Met One All-in-One-2 1
OPA-3 (Tag #A55001)
Monostatic open-path FTIR system Spectrum WaveRunIR6 1
Monostatic open-path UVDOAS system Spectrum OP-UVDOAS 6 1
Auto positioner/Pan and Tilt - open-path FTIR Moog MPT-90 1
Auto positioner/Pan and Tilt – open-path
UVDOAS Moog MPT-90 1
Black carbon monitor Met One BC 1060 1
Hydrogen sulfide monitor Teledyne API T101 1
Local wind station Met One All-in-One-2 1
OPA-4 (Tag #A72001)
Monostatic open-path FTIR system Spectrum WaveRunIR 1
Monostatic open-path UVDOAS system Spectrum OP-UVDOAS 1
Auto positioner/Pan and Tilt - open-path FTIR Moog MPT-90 1
Auto positioner/Pan and Tilt – open-path
UVDOAS Moog MPT-90 1
Black carbon monitor Met One BC 1060 1
Hydrogen sulfide monitor Teledyne API T101 1
Local wind station Met One All-in-One-2 1
OPA-5 (Tag #A55002)
Monostatic open-path FTIR system Spectrum WaveRunIR 1
Monostatic open-path UVDOAS system Spectrum OP-UVDOAS 1
6 To be installed and operated at completion of Supplemental Environmental Project (SEP) monitoring program,
circa June 2021. See Section B.9 of this QAPP, Non-Direct Measurements for additional information.

Revision 1 (DRAFT – Issue for Review) Quality Assurance Project Plan
September 10, 2019 Torrance Refinery Fenceline Air Monitoring System
16 of 48
System Description and Approach
Table A-4: Rule 1180 fenceline air monitoring system equipment
Component Make/Model Quantity
Auto positioner/Pan and Tilt - open-path FTIR Moog MPT-90 1
Auto positioner/Pan and Tilt – open-path
UVDOAS Moog MPT-90 1
Black carbon monitor Met One BC 1060 1
Hydrogen sulfide monitor Teledyne API T101 1
Local wind station Met One All-in-One-2 1
OPA-6 (Tag #A50003)
Monostatic open-path FTIR system Spectrum WaveRunIR 1
Monostatic open-path UVDOAS system Spectrum OP-UVDOAS 1
Auto positioner/Pan and Tilt - open-path FTIR Moog MPT-90 1
Auto positioner/Pan and Tilt – open-path
UVDOAS Moog MPT-90 1
Black carbon monitor Met One BC 1060 1
Hydrogen sulfide monitor Teledyne API T101 1
Local wind station Met One All-in-One-2 1
OPR-1a
Open-path FTIR Retroreflector Spectrum 1
Open-path UVDOAS retroreflector Spectrum 1
Black carbon monitor Met One BC 1060 1
Hydrogen sulfide monitor Teledyne API T101 1
OPR-1b
Open-path FTIR Retroreflector Spectrum 1
Open-path UVDOAS retroreflector Spectrum 1
OPR-2a
Open-path FTIR Retroreflector Spectrum6 1
Open-path UVDOAS retroreflector Spectrum6 1
OPR-2b
Open-path FTIR Retroreflector Spectrum6 1
Open-path UVDOAS retroreflector Spectrum6 1
OPR-3a
Open-path FTIR Retroreflector Spectrum6 1

Revision 1 (DRAFT – Issue for Review) Quality Assurance Project Plan
September 10, 2019 Torrance Refinery Fenceline Air Monitoring System
17 of 48
System Description and Approach
Table A-4: Rule 1180 fenceline air monitoring system equipment
Component Make/Model Quantity
Open-path UVDOAS retroreflector Spectrum6 1
OPR-3b
Open-path FTIR Retroreflector Spectrum6 1
Open-path UVDOAS retroreflector Spectrum6 1
OPR-4a
Open-path FTIR Retroreflector Spectrum 1
Open-path UVDOAS retroreflector Spectrum 1
OPR-4b
Open-path FTIR Retroreflector Spectrum 1
Open-path UVDOAS retroreflector Spectrum 1
OPR-5a
Open-path FTIR Retroreflector Spectrum 1
Open-path UVDOAS retroreflector Spectrum 1
OPR-5b
Open-path FTIR Retroreflector Spectrum 1
Open-path UVDOAS retroreflector Spectrum 1
OPR-6a
Open-path FTIR Retroreflector Spectrum 1
Open-path UVDOAS retroreflector Spectrum 1
OPR-6b
Open-path FTIR Retroreflector Spectrum 1
Open-path UVDOAS retroreflector Spectrum 1
Meteorological Tower System
10-meter tower assembly Met One 970895 1
Wind speed Met One 101C/2672 1
Wind direction Met One 020C/10296 1
Relative humidity/temperature Met One 085-35/5980 1
Precipitation Met One 360-1 1
Barometric pressure Met One 092 1
Visibility Met One 6400 1
Revision 1 (DRAFT – Issue for Review) Quality Assurance Project Plan
September 10, 2019 Torrance Refinery Fenceline Air Monitoring System
18 of 48
System Description and Approach
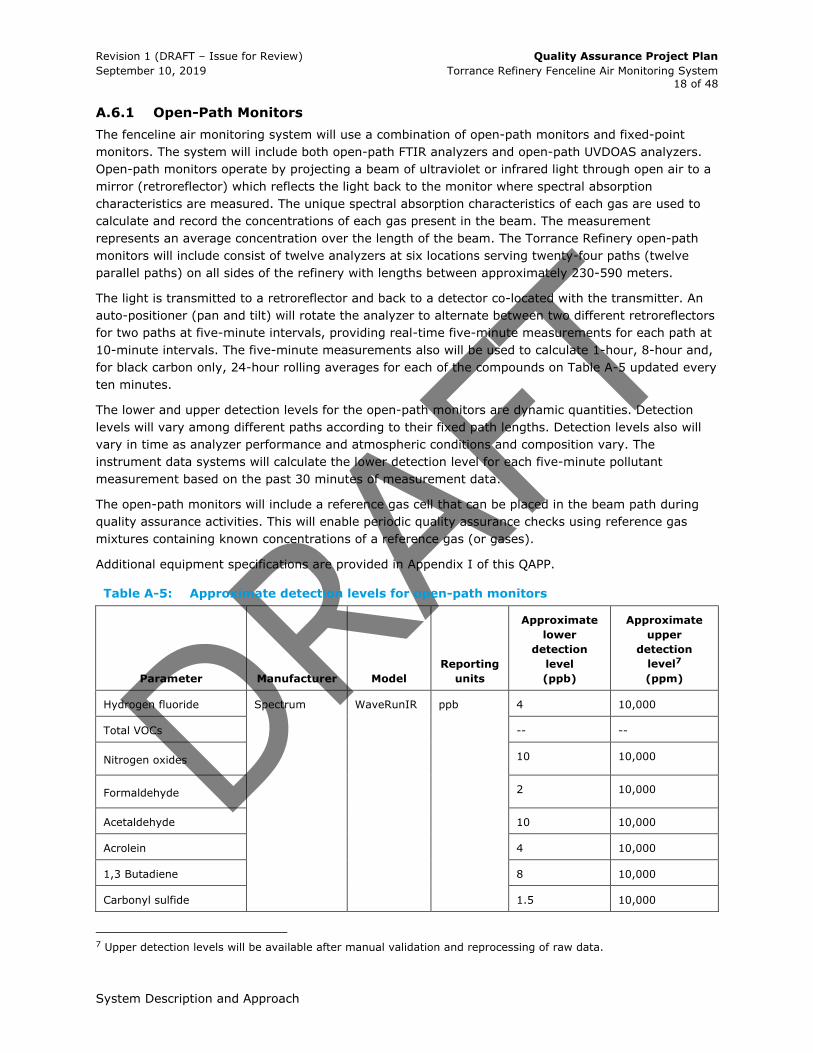
A.6.1 Open-Path Monitors
The fenceline air monitoring system will use a combination of open-path monitors and fixed-point
monitors. The system will include both open-path FTIR analyzers and open-path UVDOAS analyzers.
Open-path monitors operate by projecting a beam of ultraviolet or infrared light through open air to a
mirror (retroreflector) which reflects the light back to the monitor where spectral absorption
characteristics are measured. The unique spectral absorption characteristics of each gas are used to
calculate and record the concentrations of each gas present in the beam. The measurement
represents an average concentration over the length of the beam. The Torrance Refinery open-path
monitors will include consist of twelve analyzers at six locations serving twenty-four paths (twelve
parallel paths) on all sides of the refinery with lengths between approximately 230-590 meters.
The light is transmitted to a retroreflector and back to a detector co-located with the transmitter. An
auto-positioner (pan and tilt) will rotate the analyzer to alternate between two different retroreflectors
for two paths at five-minute intervals, providing real-time five-minute measurements for each path at
10-minute intervals. The five-minute measurements also will be used to calculate 1-hour, 8-hour and,
for black carbon only, 24-hour rolling averages for each of the compounds on Table A-5 updated every
ten minutes.
The lower and upper detection levels for the open-path monitors are dynamic quantities. Detection
levels will vary among different paths according to their fixed path lengths. Detection levels also will
vary in time as analyzer performance and atmospheric conditions and composition vary. The
instrument data systems will calculate the lower detection level for each five-minute pollutant
measurement based on the past 30 minutes of measurement data.
The open-path monitors will include a reference gas cell that can be placed in the beam path during
quality assurance activities. This will enable periodic quality assurance checks using reference gas
mixtures containing known concentrations of a reference gas (or gases).
Additional equipment specifications are provided in Appendix I of this QAPP.
Table A-5: Approximate detection levels for open-path monitors
Parameter Manufacturer Model
Reporting
units
Approximate
lower
detection
level
(ppb)
Approximate
upper
detection
level7
(ppm)
Hydrogen fluoride Spectrum WaveRunIR ppb 4 10,000
Total VOCs -- --
Nitrogen oxides 10 10,000
Formaldehyde 2 10,000
Acetaldehyde 10 10,000
Acrolein 4 10,000
1,3 Butadiene 8 10,000
Carbonyl sulfide 1.5 10,000
7 Upper detection levels will be available after manual validation and reprocessing of raw data.

Revision 1 (DRAFT – Issue for Review) Quality Assurance Project Plan
September 10, 2019 Torrance Refinery Fenceline Air Monitoring System
19 of 48
System Description and Approach
Table A-5: Approximate detection levels for open-path monitors
Parameter Manufacturer Model
Reporting
units
Approximate
lower
detection
level
(ppb)
Approximate
upper
detection
level7
(ppm)
Ammonia 2 10,000
Hydrogen cyanide 3 10,000
Sulfur dioxide Spectrum OP-UVDOAS ppb 4 100
Benzene 0.5 100
Toluene 2 100
Ethyl benzene 5 100
Xylenes (m, o and p) 5 100
A.6.2 Fixed-Point Monitors
Black carbon and hydrogen sulfide will be monitored using fixed-point analyzers, which analyze
samples collected from a single location each. Met One BC 1060 Black Carbon Monitors will monitor
black carbon concentrations at six locations around the fenceline. The BC 1060 analyzer is a two-
wavelength aethalometer, which measures the amount of black carbon in the air via attenuation of
light signals across a filter tape. Ambient air is drawn through a size-selective inlet and through a
glass fiber tape onto which ambient particulate matter is deposited. The tape is then advanced to a
light detector, which measures optical transmission of light at 880 nanometers (nm) and 370 nm
wavelengths through the tape filter, thereby providing an average measurement of ambient black
carbon for the selected sampling time.
The lower detection limit for aethalometers will decrease with increasing sampling time. Thus, a single
measurement collected over a one-hour period would have a lower detection level than a
measurement collected over five minutes. The instruments will be configured to collect and record
data in five-minute averages. The data will be used to calculate rolling averages for other time
periods, updated every five minutes. The data will be evaluated during system commissioning to
determine if five minutes is sufficient to meet the DQOs and may be adjusted for longer sampling
durations if necessary.
Hydrogen sulfide will be monitored at six locations around the fenceline using Teledyne/Advanced
Pollution Instrumentation (Teledyne/API) T101 hydrogen sulfide analyzers. In the T101 analyzer,
sulfur dioxide is removed from the sample gas in a scrubber. Hydrogen sulfide in the sample gas then
is converted into sulfur dioxide in a molybdenum converter operating at 315 °C, designed to minimize
conversion of reduced sulfur species other than hydrogen sulfide. Sulfur dioxide then is measured
through excitation by ultraviolet (UV) light, where sulfur dioxide molecules absorb UV light and
become excited at one wavelength, then decay to a lower energy state emitting UV light at a different
wavelength. The emitted light is captured on a photomultiplier tube through a bandpass filter tuned to
wavelengths emitted by excited sulfur dioxide molecules and is translated into a reading of hydrogen
sulfide concentration.
The hydrogen sulfide analyzer will collect and record data in five-minute averages. The data will be
used to calculate rolling averages, updated every five minutes.

Revision 1 (DRAFT – Issue for Review) Quality Assurance Project Plan
September 10, 2019 Torrance Refinery Fenceline Air Monitoring System
20 of 48
System Description and Approach
Table A-6 lists approximate pollutant detection limits and ranges for fixed-point monitors. See
Appendix I of the QAPP for fixed-point monitor equipment specifications.
Table A-6: Performance specifications for hydrogen sulfide and black carbon fixed-point
monitors.
Parameter
Manufacturer Model
Reporting
Units
Lower
detection
level
Upper
detection
level
Black carbon Met One BC-1060 ng/m3 200 100,000
Hydrogen sulfide
Teledyne/ Advanced
Pollution
Instrumentation
T101 ppb 0.4 10,000
A.6.3 Meteorological Monitoring
The meteorological monitoring tower will use high quality sensors that meet EPA specifications8 for
accuracy, range and resolution (Table A-7). The meteorological instruments will collect and record
data continuously. The data will be used to calculate rolling averages updated every five minutes.
Table A-7: Performance specifications for the meteorological tower components
Parameter
Sensor Make
and model
Reporting
units Accuracy9 Range Resolution
Horizontal wind speed
Met One 010C
3-cup
anemometer
Meters per
second (m/s) ± 0.1 0.4 - 55.9 0.1
Horizontal wind direction Met One 020C
airfoil vane Degrees (°) ± 3 0 to 360 0.1
Ambient temperature Met One 083E
thermistor
Degrees
Celsius (°C) ± 0.15 -30 to 50 0.1
Barometric Pressure
Met One 092
solid-state
pressure
transducer
Hectopascals
(hPa)
± 0.35 (at 20
°C)
±1.0 over full
range
±0.5 over any
200 hPa range
500 to 1,100 0.1
Relative humidity
Met One 083E
thin film
polymer
capacitor
Percent (%) ± 2 0 to 100 0.1
8 Quality Assurance Handbook for Air Pollution Measurement Systems, Volume IV: Meteorological Measurements,
U.S. Environmental Protection Agency, Research Triangle Park, North Carolina, March 2008, EPA-454/B-08-002.
See https://www3.epa.gov/ttn/amtic/files/ambient/met/Volume_IV_Meteorological_Measurements.pdf
(accessed July 19, 2018)
9 Accuracy, range and resolution values listed in this table are the manufacturer’s published performance
specifications.

Revision 1 (DRAFT – Issue for Review) Quality Assurance Project Plan
September 10, 2019 Torrance Refinery Fenceline Air Monitoring System
21 of 48
Quality Objectives and Criteria
Table A-7: Performance specifications for the meteorological tower components
Parameter
Sensor Make
and model
Reporting
units Accuracy9 Range Resolution
Precipitation
Met One 360
dual-
chambered
tipping bucket
Millimeter per
hour (mm/hr)
± 1% of
reading (0 to
30 mm/hr)
±5% of
reading (30 to
120 mm/hr)
0 to 120 0.25
Visibility
Met One 6400
IR forward
scattering
Kilometers
(km)
± 10% of
reading 0.006 to 80 --
A.6.4 Ancillary Equipment
Ancillary equipment includes sample inlets, sample transport lines, calibration and QA check
equipment, computers, data loggers, communication devices, electricity supply and conditioning
equipment, lighting, etc.
A.7 Quality Objectives and Criteria
DQOs for the fenceline air monitoring system were established to assure monitoring data can be
reported with a known degree of confidence. DQOs presented in this QAPP were established
considering EPA guidelines10 as a general example with modifications as appropriate for the
informational purposes of this Rule 1180 monitoring system:
• Monitoring data will be collected with instrumentation that provides continuous averaged
measurements;
• Records of quality control and quality assurance procedures performed during data
collection will be retained. These include calibration checks with reference gases
introduced into cells in the open-path monitor beams, fixed-point monitor calibrations,
etc.;
• References gases shall be working standards certified by comparison to a National
Institute of Science and Technology Gaseous Standard Reference Material, where these
are commercially available;
• The data completeness objective will be 75% per calendar quarter for all fenceline air
quality monitoring data including open-path monitors, fixed-point monitors and
meteorological monitors. Note, open-path monitor interferences and signal degradation
from uncontrollable adverse atmospheric conditions such as fog, rain, ozone, particulate
matter and visibility affect data completeness; therefore, periods of incomplete data due
to atmospheric conditions will be excluded from the determination of the data
completeness.
It should be recognized that DQOs for open-path monitoring technologies are not well-established
because they are new technologies in permanent monitoring system applications and performance in
10 Ambient Monitoring Guidelines for Prevention of Significant Deterioration (PSD), U.S. Environmental Protection
Agency, May 1987. EPA-450/4-87-007. See https://www.epa.gov/sites/production/files/2015-
07/documents/monguide.pdf (accessed August 2019).
Revision 1 (DRAFT – Issue for Review) Quality Assurance Project Plan
September 10, 2019 Torrance Refinery Fenceline Air Monitoring System
22 of 48
Quality Objectives and Criteria
such applications is not well established. The actual reliability of the instruments will affect availability
for collecting monitoring data. The frequency and magnitude of interferences from variable
atmospheric conditions will affect the availability for collecting monitoring data and detection levels.
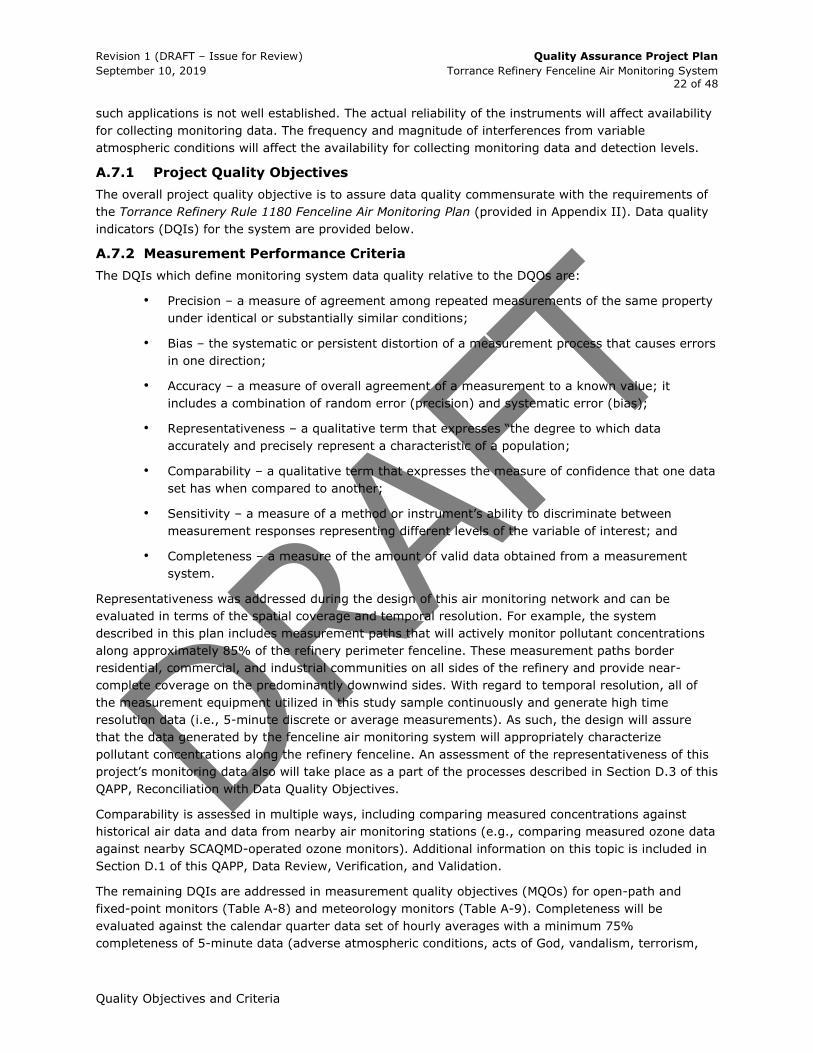
A.7.1 Project Quality Objectives
The overall project quality objective is to assure data quality commensurate with the requirements of
the Torrance Refinery Rule 1180 Fenceline Air Monitoring Plan (provided in Appendix II). Data quality
indicators (DQIs) for the system are provided below.
A.7.2 Measurement Performance Criteria
The DQIs which define monitoring system data quality relative to the DQOs are:
• Precision – a measure of agreement among repeated measurements of the same property
under identical or substantially similar conditions;
• Bias – the systematic or persistent distortion of a measurement process that causes errors
in one direction;
• Accuracy – a measure of overall agreement of a measurement to a known value; it
includes a combination of random error (precision) and systematic error (bias);
• Representativeness – a qualitative term that expresses “the degree to which data
accurately and precisely represent a characteristic of a population;
• Comparability – a qualitative term that expresses the measure of confidence that one data
set has when compared to another;
• Sensitivity – a measure of a method or instrument’s ability to discriminate between
measurement responses representing different levels of the variable of interest; and
• Completeness – a measure of the amount of valid data obtained from a measurement
system.
Representativeness was addressed during the design of this air monitoring network and can be
evaluated in terms of the spatial coverage and temporal resolution. For example, the system
described in this plan includes measurement paths that will actively monitor pollutant concentrations
along approximately 85% of the refinery perimeter fenceline. These measurement paths border
residential, commercial, and industrial communities on all sides of the refinery and provide near-
complete coverage on the predominantly downwind sides. With regard to temporal resolution, all of
the measurement equipment utilized in this study sample continuously and generate high time
resolution data (i.e., 5-minute discrete or average measurements). As such, the design will assure
that the data generated by the fenceline air monitoring system will appropriately characterize
pollutant concentrations along the refinery fenceline. An assessment of the representativeness of this
project’s monitoring data also will take place as a part of the processes described in Section D.3 of this
QAPP, Reconciliation with Data Quality Objectives.
Comparability is assessed in multiple ways, including comparing measured concentrations against
historical air data and data from nearby air monitoring stations (e.g., comparing measured ozone data
against nearby SCAQMD-operated ozone monitors). Additional information on this topic is included in
Section D.1 of this QAPP, Data Review, Verification, and Validation.
The remaining DQIs are addressed in measurement quality objectives (MQOs) for open-path and
fixed-point monitors (Table A-8) and meteorology monitors (Table A-9). Completeness will be
evaluated against the calendar quarter data set of hourly averages with a minimum 75%
completeness of 5-minute data (adverse atmospheric conditions, acts of God, vandalism, terrorism,

Revision 1 (DRAFT – Issue for Review) Quality Assurance Project Plan
September 10, 2019 Torrance Refinery Fenceline Air Monitoring System
23 of 48
Quality Objectives and Criteria
loss of station power or other events over which neither the refinery nor their monitoring contractor
has control over will not be included in data loss calculations). Note that an MQO for precision is not
specified for meteorological measurements. Formulas for calculating DQIs are presented in Section B.5
of this QAPP.
Table A-8: DQIs and MQOs for refinery fenceline air monitoring systems
DQIs
MQOs for open-path
systems MQOs for fixed point systems
MQOs for meteorological
systems
Completeness 75% 75% 75%
Accuracy See Tables B-6 – B-7 See Tables B-9 – B-10 See Table B-11
Precision See Tables B-6 – B-7 See Tables B-9 – B-10 See Table B-11
Sensitivity
(detection limits)
See Table A-5 See Table A-6 --
Table A-9: DQIs and MQOs for the meteorological tower system11
Measurement Method
Reporting
Units
Operating
Range
System
Accuracy
Sensitivity
(resolution) Completeness
Ambient
Temperature Thermistor °C -30 to 50 ± 0.15 0.1 75%
Relative Humidity Psychrometer/
Hygrometer % 0 to 100 ± 2 0.1 75%
Barometric
Pressure
Aneroid
Barometer hPa 500 to 1,100
±0.35 (at 20 °C)
±1.0 over full
range
±0.5 over any
200 hPa range
0.01 75%
Wind Speed Cup or sonic
anemometer m/s 0.4 to 50.0 ± 0.1 0.003 (0.1 mph) 75%
Wind Direction Vane or sonic
anemometer Degrees (°) 0 to 360
± 5, includes
orientation error 0.1 75%
Precipitation Tipping Bucket mm/hr 0 to 50
±1% of reading
(0 to 30 mm/hr)
±5% of reading
(30 to 120
mm/hr)
0.25 75%
11 Accuracy, range and resolution values listed in this table are the manufacturer’s published performance
specifications of the corresponding sensors.

Revision 1 (DRAFT – Issue for Review) Quality Assurance Project Plan
September 10, 2019 Torrance Refinery Fenceline Air Monitoring System
24 of 48
Training and Certifications
Table A-9: DQIs and MQOs for the meteorological tower system11
Measurement Method
Reporting
Units
Operating
Range
System
Accuracy
Sensitivity
(resolution) Completeness
Visibility Forward light
scattering meters 0.006 to 80
± 10% of
reading -- 75%
A.8 Training and Certifications
Adequate education and training are key components to any successful monitoring system that strives
to produce data of known quality meeting DQOs. Activities conducted under this QAPP will be
performed by individuals with proper training and experience. All personnel assigned to operation,
maintenance, quality assurance, and data handling will be sufficiently trained in the underlying
technical and scientific principles behind the air monitoring equipment being used. Staff assigned to
operate and maintain the system will be trained on operation and maintenance of the system prior to
and during the start-up phase. The System Manager/Operator will determine specific training
requirements for operation and maintenance of the system. Training will be provided by the System
Manager/Operator or designated representatives, and a record of training will be maintained by the
System Manager/Operator.
A.9 Documents and Records
The System Manager/Operator is responsible for distributing the most recently-approved QAPP (and
other documents used throughout the project operation) to all personnel identified in the QAPP
distribution list via email. Controlled versions of all project documents, including the QAPP, will be
maintained in electronic format by the Program Quality Assurance Manager on a network server
location accessible to the System Manager/Operator, Rule 1180 Program Manager, and Program
Quality Assurance Manager staff. The QAPP and project documents should be reviewed, updated and
re-approved as the fenceline air monitoring system requirements, design or equipment change. These
documents can be made available to SCAQMD staff upon request.
The dataset created for this monitoring program will consist of these components stored for at least
five years in the project database and project files:
• For open-path monitors:
− The 5-minute concentration measurements for each path;
− Detection limits for the 5-minute concentration measurements generated from
each path;
− Calculated 1-hour and 8-hour rolling average concentrations and respective
detection limits for each path;
− Individual absorption spectra for 5-minute measurements from each path;
• 5-minute average wind speed, wind direction, ambient temperature, barometric pressure,
visibility, relative humidity and visibility measurements at the meteorological tower, and
the calculated hourly rolling average of the 5-minute meteorological data;
• 5-minute average concentration data generated from each hydrogen sulfide monitor and
the calculated 1-hour and 8-hour rolling average concentrations; and

Revision 1 (DRAFT – Issue for Review) Quality Assurance Project Plan
September 10, 2019 Torrance Refinery Fenceline Air Monitoring System
25 of 48
Documents and Records
• 5-minute average concentration data generated from each black carbon monitor and the
calculated 8-hour and 24-hour rolling average concentrations.
The following sources of information will support these data:
• Station log books (in electronic form);
• Absorption spectra and raw data files from the open-path FTIR and UVDOAS monitors;
• Calibration and maintenance records for all measurement systems;
• Data validation and editing instructions;
• Quarterly QA audits of field operations and system performance; and
• Third-party QA audit, inspection, assessment and corrective action reports.
Quarterly data summary reports will be prepared as a part of this air monitoring program. These
reports will include a comparison of monitored target pollutant concentrations against their respective
health thresholds, assessments of data completeness, a description of any significant instrument
issues encountered, and a summary of quality control efforts. Additional detail on these quarterly
reports are provided in Section B.10, Data Management and Section C.2, Reports to Management of
this QAPP.

Revision 1 (DRAFT – Issue for Review) Quality Assurance Project Plan
September 10, 2019 Torrance Refinery Fenceline Air Monitoring System
26 of 48
Sampling Process Design
B. DATA GENERATION AND ACQUISITION
B.1 Sampling Process Design
Fenceline air monitoring data will be collected using open-path instruments to measure and record
pollutant concentrations over a path interval of nominally 500 meters (corresponding to a folded
optical path length of 1000 meters for the monostatic systems) along or near the Torrance Refinery
fenceline. Additionally, continuous fixed-point monitors will be used at six representative locations on
or near the facility fenceline to monitor levels of black carbon and hydrogen sulfide. The selection of
monitoring sites is discussed in the Torrance Refinery Rule 1180 Fenceline Air Monitoring Plan
(provided in Appendix II). Additional information on the design of this monitoring network is provided
in Section A.6 of this QAPP.
B.2 Sampling Methods
This section describes the field work associated with this program, including the sampling methods
and equipment that are used. All measurements are performed on a continuous basis; no physical
samples are collected for offsite analysis. Standard operating procedures and methods for all of the
measurement equipment used in this study can be found in the respective equipment operation
manuals.
B.2.1 Open-Path Monitoring Systems
This QAPP will serve as the primary reference for the open-path FTIR and open-path UVDOAS
monitoring systems for the Torrance Refinery. All pertinent O&M and QA/QC procedures are cited as
references and summarized in this QAPP.
The open-path analyzers are described in Section A.6.1 of this QAPP. The open-path FTIR analyzer is a
Spectrum WaveRunIRTM, and the open-path UVDOAS analyzer is a Spectrum OP-UVDOAS analyzer.
Both are mono-static multi-gas open-path analyzers. The analyzer systems operate by sending a
beam of infrared or ultraviolet light through open air from a light source to a retroreflector cube array
that redirects the light beam back to the analyzer.
The System Manager Operator team will remotely perform daily system checks, data validations, and
will travel to the site as needed to perform both routine and emergency maintenance. The Technical
Specialists/Site Operators will provide on-site checks and necessary routine maintenance (system
alignment optimization, bulb replacement, etc.) or repairs. A cellular modem interface to the analyzer
computer(s) and to the alarm system allows the System Manager/Operator team to remotely retrieve
data and system logs, conduct system performance checks, and perform certain types of system
recoveries and adjustments.
The open-path monitors will record concentrations along pathway segments along or near the
perimeter fenceline. Each measurement will be collected over a 5-minute period. All the monitors will
cover two adjacent pathways via use of an auto-positioner (pan and tilt) that will rotate the
instrument between the two paths at programmed 5-minute intervals.
Pollutant concentration data will be collected using on-site computers which will parse the data and
perform preliminary automated QC of the data. The data is then sent to a cloud server through a
cellular connection every five minutes. Once delivered to the cloud server, validation calculations and
distribution will occur. Concentration values will be presented on a public website as five-minute
measurement data, rolling 1-hour averages, rolling 8-hour averages and, for black carbon only, rolling
24-hour averages, updated for each path every ten minutes.

Revision 1 (DRAFT – Issue for Review) Quality Assurance Project Plan
September 10, 2019 Torrance Refinery Fenceline Air Monitoring System
27 of 48
Monitoring Data Documentation, Custody and Control
B.2.2 Fixed-Point Monitor Data
The fixed-point monitors for black carbon and hydrogen sulfide are described in Section A.6.2 of this
QAPP. The continuous data from each monitor will be collected in five-minute averages, updated every
five minutes. The five-minute average data will be used to calculate 1-hour rolling averages and 1-
hour rolling block averages will be used to calculate 8-hour and 24-hour rolling averages.
B.2.3 Meteorological Data Collection
Meteorological instruments installed on a 10-meter tower at one location within the refinery are
described in Section A.6.3 of this QAPP. The meteorological instruments will be configured to collect
and record data with high resolution (e.g., every five-minutes). The meteorological data may be used,
for example, to establish pollutant trajectories or determine if the measured pollutant concentrations
on a fenceline path originate upwind or downwind of Torrance Refinery operations.
B.2.4 Backup Monitoring
Rule 1180 requires alternate or temporary monitoring systems when the continuous monitoring
systems are offline for extended periods (e.g., for maintenance or repair). The alternative monitoring
systems will not be used to determine individual gaseous target compounds and/or surrogates when
the open-path systems are down due to atmospheric conditions, but only in the event of extended
periods for unscheduled maintenance or outages.
The backup monitoring plan is described in Section 6.6 of the Torrance Refinery Rule 1180 Fenceline
Air Monitoring Plan (provided in Appendix II). The approach to backup monitoring may be adjusted
over time, for example, as techniques and technologies evolve.
B.3 Monitoring Data Documentation, Custody and Control
The real-time open-path monitors and fixed-point monitors used to collect data for the fenceline air
monitoring system do not involve physical sample shipping or custody transfer. However, the real-
time monitoring data produced by the monitors will be secured and carry chain-of-custody information
to prevent unauthorized changes. Field operation records include site visit logs, continuous monitor
calibration/validation documents, and maintenance logbooks. Many of these records are in electronic
form, primarily as spreadsheets or text files. All field operation records are returned at least monthly
to the Data/QA Manager for inclusion in the project files. The automatic data polling systems are
password protected and only selected System Manager/Operator team members have access.
Monitoring data chain-of-custody records will be maintained as specified in Section 2 of the Rule 1180
Guidelines. The original monitoring data records (including the original spectral data from open-path
monitors) will be stored as read-only files. Changes will be made only to duplicates of the original
files. Changes to data records, when required, will generally occur during data validation activities.
Each data record will include one or more fields for data qualifiers entered during data review and
validation. If a change is required, the original record will be flagged “invalid – correction applied” or
similarly marked and will not be included in recalculation of time-averaged results. A duplicate record
with corrected data will be created for the same date and time and flagged “duplicate – validated” and
included in recalculation of time-averaged results. The time and date of each change to a data record,
if any, will be noted along with the names of the persons making and approving each change.
B.4 Analytical Methods
The analytical methods for each monitor type are described briefly below.
B.4.1 Spectral Methods for Open-Path analyzers
The analytical methods employed for the open-path FTIR and open-path UVDOAS systems are based
on applying a least squares regression analysis to compare calibrated reference spectra to measured

Revision 1 (DRAFT – Issue for Review) Quality Assurance Project Plan
September 10, 2019 Torrance Refinery Fenceline Air Monitoring System
28 of 48
Analytical Methods
absorption spectra as described in EPA Compendium Method TO-1612. Tables A-5 and A-6 of the QAPP
present the target compounds and their respective detection limits. Table 7-2 of the Torrance Refinery
Rule 1180 Fenceline Air Monitoring Plan (provided in Appendix II) lists the selected health-based
inhalation exposure thresholds for each compound.
B.4.2 Black Carbon Analyzer
BC concentrations are calculated based on a presumed relationship between measured optical
attenuation through the filter tape as BC accumulates and ambient BC levels based on historical
measurement data collected by thermo-optical methods. The relationship between the attenuation of
laser light through quartz filters onto which ambient particulate samples containing soot had been
collected and the concentration of “graphitic carbon” of the same samples has been established in
previous literature, and this correlation has been found to be linear over a wide concentration
range.13,14
The BC analyzer measures ambient concentration of black carbon by measuring the change in optical
transmission as BC-containing particulate matter accumulates onto a filter. Transmission of light
coming from light emitting diodes is measured across filter tape onto which sampled aerosol
containing BC is being accumulated. Reference transmission across a clean portion of the filter tape is
simultaneously measured. As BC accumulates onto the filter tape light transmission across the portion
of the tape onto which BC is accumulating relative to the reference transmission will decrease. This
transmission data is converted into BC concentration by normalizing by volumetric flow rate, time
interval of measurement and cross-sectional area of the filter spot.
The Met One BC 1060 black carbon analyzer uses two industry-standard wavelengths, 880 nm and
370nm, to determine the concentration of black carbon and “UVPM” (UV light absorbing PM).
B.4.3 Hydrogen Sulfide Analyzer
UV fluorescence fixed-point monitors will be used to monitor hydrogen sulfide. The Teledyne/Advanced
Pollution Instrumentation T101 UV fluorescence hydrogen sulfide analyzer is selected to monitor
hydrogen sulfide concentrations at six locations around the fenceline. Hydrogen sulfide is measured on
the principle that hydrogen sulfide can be converted into sulfur dioxide. The hydrogen sulfide-to-sulfur
dioxide converter receives sample gas from which the sulfur dioxide has been removed by a scrubber,
which removes sulfur dioxide from the sample gas. The hydrogen sulfide converter is a molybdenum
converter operating at 315 °C and is designed to minimize conversion of reduced sulfur species other
than hydrogen sulfide. sulfur dioxide is measured through excitation by UV light from a low-pressure
zinc-vapor lamp.
Sulfur dioxide molecules absorb UV light and become excited at a wavelength of approximately 214
nm, then decay to a lower energy state emitting UV light at wavelength of 330 nm. Excitation light is
supplied by a low-pressure zinc-vapor lamp, and light from the lamp is focused using a UV source lens
and passes through a bandpass filter configured to allow light with a wavelength of 214 nm, the
excitation frequency of sulfur dioxide.
12 Long-Path Open-Path Fourier Transform Infrared Monitoring of Atmospheric Gases, Compendium Method TO-16,
U.S. Environmental Protection Agency, Cincinnati, Ohio, 1999. See
https://www3.epa.gov/ttn/amtic/files/ambient/airtox/to-16r.pdf (accessed July 19, 2018).
13 Rosen, H., Hansen, A. D., Gundel, L., and Novakov, T., “Identification of the optically absorbing component in
urban aerosols.” Appl. Opt., 17:3859-3861, 1978.
14 Gundel, L., Dod, R., Rosen, H., and Novakov, T., “The relationship between optical attenuation and black carbon
concentration for ambient and source particles.” The Science of the Total Environment, 36:197-202, 1984.

Revision 1 (DRAFT – Issue for Review) Quality Assurance Project Plan
September 10, 2019 Torrance Refinery Fenceline Air Monitoring System
29 of 48
Quality Control
Light emitted from the decay of excited sulfur dioxide molecules is captured on a photomultiplier tube
(PMT) through a bandpass filter tuned to a wavelength of 330 nm corresponding to light emitted by
excited sulfur dioxide molecules. This filter trips away light outside of the fluorescence spectrum of
decaying excited sulfur dioxide including reflected UV form the source lamp and other stray light. To
further assure that the PMT only detects light given off by decaying sulfur dioxide the pathway of the
excitation UV and field of view of the PMT are perpendicular to each other and the inside surfaces of
the sample chamber are coated with a layer of black Teflon® that absorbs stray light.
B.5 Quality Control
This section describes QC calculations for the monitoring systems.
B.5.1 Automated QA/QC
Automated QA/QC checks will be performed continuously on all incoming data. Additionally, data will
be compared against threshold concentrations determined specifically for facility conditions. If
anomalies are found in incoming data, an email notification will be sent to the System
Manager/Operator and Program Quality Assurance Manager.
B.5.2 Statistics for the Assessment of QC Checks
Calculations of measurement uncertainty will be carried out following procedures like those used for
ambient air monitoring networks15, provided in the following subsections.
B.5.2.1 Percent Difference
All measurement quality checks start with a comparison of an audit concentration or value (flow rate)
to the concentration/value measured by the analyzer using the percent difference calculation shown in
Equation 1. For each single point check the percent difference, di, is calculated as follows:
𝑑𝑖 =𝑚𝑒𝑎𝑠−𝑎𝑢𝑑𝑖𝑡
𝑎𝑢𝑑𝑖𝑡× 100 Equation 1
Where, meas is the concentration indicated by the monitoring organization's instrument and audit is
the audit concentration of the standard used in the QC check being measured.
B.5.2.2 Precision Estimate
The precision estimate is used to assess the one-point QC checks for each instrument. The precision
estimator is the coefficient of variation (CV) and is calculated using equation 2:
𝐶𝑉, % =𝜎𝑚𝑒𝑎𝑠
𝐶𝑚𝑒𝑎𝑠̅̅ ̅̅ ̅̅ ̅̅ ̅× 100 Equation 2
Where 𝐶𝑚𝑒𝑎𝑠̅̅ ̅̅ ̅̅ ̅̅ is the average measured gas concentration and 𝜎𝑚𝑒𝑎𝑠 is the standard deviation of the
measurements, defined as:
𝜎𝑚𝑒𝑎𝑠 = √∑(𝐶𝑚𝑒𝑎𝑠−𝐶𝑚𝑒𝑎𝑠̅̅ ̅̅ ̅̅ ̅̅ ̅)2
𝑛−1 Equation 3
Where 𝐶𝑚𝑒𝑎𝑠 is a single measured concentration and n refers to the number of measurements
conducted.
B.5.2.3 Accuracy Estimate
Accuracy, A, is defined as:
15 Quality Assurance Requirements for Monitors used in Evaluations of National Ambient Air Quality Standards,
Appendix A, Part 58, Title 41 U.S. Code of Federal Regulations.

Revision 1 (DRAFT – Issue for Review) Quality Assurance Project Plan
September 10, 2019 Torrance Refinery Fenceline Air Monitoring System
30 of 48
Equipment Inspection, Testing, and Maintenance
𝐴, % =|𝐶𝑎𝑢𝑑𝑖𝑡̅̅ ̅̅ ̅̅ ̅̅ ̅−𝐶𝑚𝑒𝑎𝑠̅̅ ̅̅ ̅̅ ̅̅ ̅|
𝐶𝑎𝑢𝑑𝑖𝑡̅̅ ̅̅ ̅̅ ̅̅ ̅× 100 Equation 4
Where 𝐶𝑎𝑢𝑑𝑖𝑡 refers to the average value of the reference gas and 𝐶𝑚𝑒𝑎𝑠̅̅ ̅̅ ̅̅ ̅̅ refers to the average value
of all measurements.
B.5.2.4 Completeness
Completeness is a measure of the amount of valid data obtained from a measurement system.
Completeness objectives are listed in Table A-8 for open-path and fixed-point monitors and Table A-9
for meteorological monitors.
Due to the nature of open-path measurement devices, atmospheric conditions such as fog, high
humidity, rain, ozone, particulate matter, haze, and other conditions can affect a monitor’s ability to
provide reliable data. Since these conditions are uncontrollable, it is not possible to mitigate their
effects.
Scheduled and unscheduled maintenance also results in loss of data. Scheduled or preventative
maintenance is predictable and accounted for in setting data completeness objectives. Unscheduled
maintenance is determined by the robustness of the monitoring equipment designs, component
selections and preventative maintenance procedures. It should be noted that the reliability of the
open-path monitors is not well known over long periods of continuous operation and this was
considered in establishing data completeness objectives.
The data completeness criteria for all monitoring systems (fixed point, open-path and meteorological)
is 75% for hourly, daily and quarterly data completeness. Hourly, daily and quarterly completeness for
open-path systems are defined as follows:
% completehourly = 100 x nvalid
12−nexcluded Equation 5
Where nvalid refers to the number of valid 5-minute measurements taken within one hour, and nexcluded
refers to the number of measurements invalidated due to atmospheric conditions or scheduled
maintenance.
% completedaily = 100 x hvalid
24−hexcluded Equation 6
Where hvalid refers to the number of hours in a day with complete data (i.e., hours that have met or
exceeded the target completeness percentage) and hexcluded refers to the number of hours during which
all data is invalidated due to unsuitable atmospheric conditions or scheduled maintenance.
% completequarterly = 100 x dvalid
dquarter−dexcluded Equation 7
Where dvalid refers to the number of days in the quarter with complete data (i.e., days that have met
or exceeded the target completeness percentage), dquarter refers to the number of days in that quarter
and dexcluded refers to the number of days during which all data is invalidated due to unsuitable
atmospheric conditions or scheduled maintenance.
The completeness target for the meteorological systems will be 90%, following the same definitions as
above.
B.6 Equipment Inspection, Testing, and Maintenance
The System Manager/Operator team performs equipment inspection, testing and routine maintenance
to assure the monitoring data quality meets DQOs. This section cites procedures and summarizes
recordkeeping requirements for all field analytical instrumentation and equipment. Instrument
maintenance logs will be maintained, and all instrumentation will be checked prior to use. Detailed

Revision 1 (DRAFT – Issue for Review) Quality Assurance Project Plan
September 10, 2019 Torrance Refinery Fenceline Air Monitoring System
31 of 48
Equipment Inspection, Testing, and Maintenance
descriptions of how inspections and maintenance activities are performed can be found in the
instrument operation manuals referenced in this section (see “Procedure Documents” listed in Tables
B-1 through B-5). Additionally, information on how re-inspections should be performed and how to
assess the effectiveness of corrective actions can also be found in the instrument manuals referenced
in this section.
Field personnel will also be responsible for ensuring that critical spare parts are included with the field
instruments to reduce potential downtime for repairs. The inventory will primarily contain parts that
are subject to frequent failure, have limited useful lifetimes, and/or cannot be obtained in a timely
manner.
B.6.1 Open-Path FTIR Monitor Inspection, Testing and Maintenance
Routine open-path FTIR monitor inspection, testing and maintenance will be performed according to
the manufacturer’s recommendations (Table B-1). This table also list the recommended frequency for
each activity and cites the section numbers of the manufacturer’s Operation and Maintenance Manual
(Procedure Document) where the procedures may be found.
Table B-1: Inspection, testing and maintenance activities for open-path FTIR monitors
Activity Frequency Procedure Document
Cleaning the optical bearing Every 2 years Open-Path FTIR Manual, Spectrum
Environmental Solutions, Section 3.1
Validation cell inspection Annually Open-Path FTIR Manual, Spectrum
Environmental Solutions, Section 3.3
IR source inspection Annually Open-Path FTIR Manual, Spectrum
Environmental Solutions, Section 3.4
HeNe laser voltage level
inspection
Annually Open-Path FTIR Manual, Spectrum
Environmental Solutions, Section 3.5
IR detector inspection Annually Open-Path FTIR Manual, Spectrum
Environmental Solutions, Section 3.8
Optimizing the Tracker
Positioning
Quarterly Open-Path FTIR Manual, Spectrum
Environmental Solutions, Section 3.9
Retroreflector array cleaning Every six months Open-Path FTIR Manual, Spectrum
Environmental Solutions, Section 3.10
Telescope turning flat
cleaning
Every six months Open Path FTIR Manual, Spectrum
Environmental Solutions, Section 3.11
Telescope optics cleaning Every two years Open-Path FTIR Manual, Spectrum
Environmental Solutions, Section 3.11
B.6.2 Open-Path UVDOAS Monitor Inspection, Testing and Maintenance
Routine open-path UVDOAS monitor inspection, testing and maintenance will be performed according
to the manufacturer’s recommendations (Table B-2). This table also list the recommended frequency
for each activity and cites the section number of the manufacturer’s Operation and Maintenance
Manual (Procedure Document) where the procedures may be found.

Revision 1 (DRAFT – Issue for Review) Quality Assurance Project Plan
September 10, 2019 Torrance Refinery Fenceline Air Monitoring System
32 of 48
Equipment Inspection, Testing, and Maintenance
Table B-2: Inspection, testing and maintenance activities for open-path UVDOAS
monitors
Activity Frequency Procedure Document
Cleaning retroreflector array Every six months Open-Path UV Manual, Spectrum
Environmental Solutions, Section 3.2
Validation cell inspection Annually Open-Path UV Manual, Spectrum
Environmental Solutions, Section 3.3
UV lamp inspection Annually Open-Path UV Manual, Spectrum
Environmental Solutions, Section 3.4
B.6.3 Black Carbon Monitor Inspection, Testing and Maintenance
Routine black carbon monitor inspection, testing and maintenance will be performed according to the
manufacturer’s recommendations (Table B-3). This table lists the suggested frequency for each
activity and cites the section number of the manufacturer’s Operation and Maintenance Manual
(Procedure Document) where the procedures may be found. Maintenance that is recommended on an
“as required” basis will be evaluated once the systems are commissioned at the facility.
Table B-3: Inspection, testing and maintenance activities for black carbon monitors
Activity Minimum frequency Procedure Document
Temperature, Pressure, and Flow
Audits and Calibrations
Monthly BC 1060 Operation Manual16, Met
One Instruments, Section 6.4
Flow System Leak Checks Quarterly BC 1060 Operation Manual16, Met
One Instruments, Section 6.5
Debris Filter Changes Annually BC 1060 Operation Manual16, Met
One Instruments, Section 6.6
Inlet and Cyclone Cleaning Quarterly BC 1060 Operation Manual16, Met
One Instruments, Section 6.7
Filter Tape Installation, Loading, and
Filter Material Notes
As required (typically 2- to 12-
month intervals depending on
sampling duration between
measurements)
BC 1060 Operation Manual16, Met
One Instruments, Section 3.7
Span check Quarterly BC 1060 Operation Manual16, Met
One Instruments, Section 6.4
Leak test Quarterly BC 1060 Operation Manual16, Met
One Instruments, Section 6.5
Replace cyclone O-rings As required BC 1060 Operation Manual16, Met
One Instruments, Section 6.7
16 BC 1060 Black Carbon Monitor Operation Manual, BC 1060-9800, REV A, Met One Instruments.
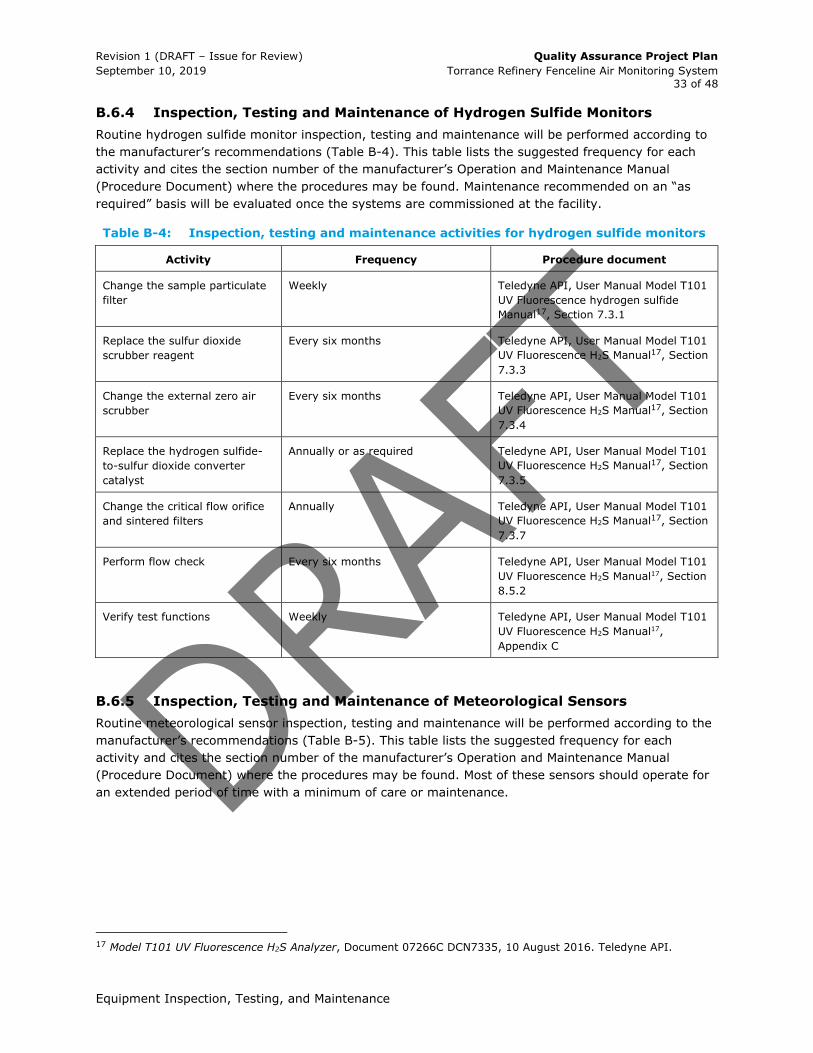
Revision 1 (DRAFT – Issue for Review) Quality Assurance Project Plan
September 10, 2019 Torrance Refinery Fenceline Air Monitoring System
33 of 48
Equipment Inspection, Testing, and Maintenance
B.6.4 Inspection, Testing and Maintenance of Hydrogen Sulfide Monitors
Routine hydrogen sulfide monitor inspection, testing and maintenance will be performed according to
the manufacturer’s recommendations (Table B-4). This table lists the suggested frequency for each
activity and cites the section number of the manufacturer’s Operation and Maintenance Manual
(Procedure Document) where the procedures may be found. Maintenance recommended on an “as
required” basis will be evaluated once the systems are commissioned at the facility.
Table B-4: Inspection, testing and maintenance activities for hydrogen sulfide monitors
Activity Frequency Procedure document
Change the sample particulate
filter
Weekly Teledyne API, User Manual Model T101
UV Fluorescence hydrogen sulfide
Manual17, Section 7.3.1
Replace the sulfur dioxide
scrubber reagent
Every six months Teledyne API, User Manual Model T101
UV Fluorescence H2S Manual17, Section
7.3.3
Change the external zero air
scrubber
Every six months Teledyne API, User Manual Model T101
UV Fluorescence H2S Manual17, Section
7.3.4
Replace the hydrogen sulfide-
to-sulfur dioxide converter
catalyst
Annually or as required Teledyne API, User Manual Model T101
UV Fluorescence H2S Manual17, Section
7.3.5
Change the critical flow orifice
and sintered filters
Annually Teledyne API, User Manual Model T101
UV Fluorescence H2S Manual17, Section
7.3.7
Perform flow check Every six months Teledyne API, User Manual Model T101
UV Fluorescence H2S Manual17, Section
8.5.2
Verify test functions Weekly Teledyne API, User Manual Model T101
UV Fluorescence H2S Manual17,
Appendix C
B.6.5 Inspection, Testing and Maintenance of Meteorological Sensors
Routine meteorological sensor inspection, testing and maintenance will be performed according to the
manufacturer’s recommendations (Table B-5). This table lists the suggested frequency for each
activity and cites the section number of the manufacturer’s Operation and Maintenance Manual
(Procedure Document) where the procedures may be found. Most of these sensors should operate for
an extended period of time with a minimum of care or maintenance.
17 Model T101 UV Fluorescence H2S Analyzer, Document 07266C DCN7335, 10 August 2016. Teledyne API.

Revision 1 (DRAFT – Issue for Review) Quality Assurance Project Plan
September 10, 2019 Torrance Refinery Fenceline Air Monitoring System
34 of 48
Equipment Inspection, Testing, and Maintenance
Table B-5: Inspection, testing and maintenance activities for meteorological sensors
Sensor Activities Frequency Procedure Document
Met One 010C wind speed
sensor
Inspect for proper
operation
Every 6 months Met One Model 010C
Wind Speed Sensor
Manual, Section 4.2
Inspect wind speed
sensor bearings
Every 6 months Met One Model 010C
Wind Speed Sensor
Manual, Section 4.5
Met One 020C wind
direction sensor
Inspect for proper
operation
Every 6 months Met One Model 020C
Wind Direction Sensor
Manual, Section 7.6
Inspect wind direction
sensor bearings
Every 6 months Met One Model 020C
Wind Direction Sensor
Manual, Section 8.1
Met One 083E relative
humidity and temperature
sensor
Inspect for proper
operation
Every 6 months Met One Model 083E/085
Relative Humidity /
Temperature Sensor
Manual, Section 4.0
Met One 092 barometric
pressure sensor
Clean the sintered filter As required Met One Model 092
Barometric Pressure
Sensor Manual, Section
8.0
Met One 360 precipitation
gauge
Clean the funnel and
buckets. Verify that the
bucket moves freely.
Every 6 months Met One Model 360
Precipitation Gauge
Operation Manual,
Section 4.0
Met One 6400 visibility
sensor
Inspect for proper
operation. Clean optics.
Every 3 months Belfort Instrument
Visibility Sensor Manual
Model 6400, Section 4.0
B.6.6 Remote and Visual Inspection
Quality control activities will include:
• Periodic checks by a remote operator;
• Periodic and as-needed site visits; and
• Documentation of the condition of the various equipment in the site log book. Any
equipment maintenance or repairs also will be documented in the site log.
Data validation will be performed in real time and at regular intervals to verify measurement
anomalies and facilitate early detection of equipment malfunctions. Any discrepancies in the logs or
inconsistencies with this QAPP will be brought to the attention of the Rule 1180 Program Manager,
Program Quality Assurance Manager, and the System Manager/Operator. Corrective actions will be
implemented by the System Manager/Operator as appropriate, verified by the Program Quality
Assurance Manager and reported to the Rule 1180 Program Manager. Section D.1 of this QAPP
provides additional details regarding data validation activities.

Revision 1 (DRAFT – Issue for Review) Quality Assurance Project Plan
September 10, 2019 Torrance Refinery Fenceline Air Monitoring System
35 of 48
Equipment Calibration
B.7 Equipment Calibration
This section summarizes calibration procedures and frequency. For open-path systems, there are no
field calibrations because the instruments are factory calibrated to spectral reference libraries. A
reference gas cell and one reference gas of known concentration will be used with the open-path
monitors for quality assurance purposes. Periodic calibration checks will be performed for the fixed-
point and meteorological monitors.
Calibrations and validations, flow rate checks, audits, and calculations will be selectively reviewed by
the Program Quality Assurance Manager to ensure that:
• Quality assurance procedures are being followed;
• The performance of all equipment is within the limits specified in this document;
• All calculations are being performed properly; and
• All data are reasonable and technically consistent.
B.7.1 Fenceline Air Monitoring System Validation for Open-Path Systems
Verify the instrument performance through various checks, many of which are described in EPA
Method TO-16r12 and in the EPA Handbook for Optical Remote Sensing for Measurement and
Monitoring of Emissions Flux and Particulate Matter18. This document outlines general QA/QC
procedures for a variety of sensing technologies, and its guidelines were used to inform this QAPP.
The frequency and acceptance criteria for each check is shown in Tables B-6 through B-8.
Table B-6: Quality assurance for FTIR monitors
Parameter Frequency Acceptance criteria Procedure document
Reference gas
QA checks
Quarterly for first two
years; semi-annually if
QA checks meet
acceptance criteria in at
least 80% of preceding
eight quarterly checks.
After major maintenance
Initial commissioning
Accuracy: ≤ 30% of
reference gas value,
calculated using
Equation 4 presented in
Section B.5.2
Precision: ± 25%,
calculated using
Equation 2 presented in
Section B.5.2
Factory and Site Acceptance Test
Plan, TORC Rule 1180 Project,
Spectrum Environmental Solutions,
Section 2.1.5
Line shift Continuous 0.5 cm-1 resolution Factory and Site Acceptance Test
Plan, TORC Rule 1180 Project,
Spectrum Environmental Solutions,
Section 2.1.2
Black body
radiation
(background)
Continuous -- Open-Path FTIR Manual, Spectrum
Environmental Solutions, Section
2.2.2 Basics of Data Collection
Software algorithm executed every
5 minutes
18 EPA Handbook: Optical and Remote Sensing for Measurement and Monitoring of Emissions Flux of Gases and
Particulate Matter, U.S. Environmental Protection Agency, September 1, 2018. See
https://www.epa.gov/sites/production/files/2016-06/documents/gd-052.pdf (accessed May 2019).

Revision 1 (DRAFT – Issue for Review) Quality Assurance Project Plan
September 10, 2019 Torrance Refinery Fenceline Air Monitoring System
36 of 48
Equipment Calibration
Table B-6: Quality assurance for FTIR monitors
Parameter Frequency Acceptance criteria Procedure document
Baseline noise
determination
Once at commissioning Instrument signal
intensity divided by the
sum of instrument noise
and stray light must be
> 5
Factory and Site Acceptance Test
Plan, TORC 1180 Project, Spectrum
Environmental Solutions, Section
2.1.3 Noise Equivalent Absorbance
(NEA) Testing
Stray light
check
Continuous -- Open-Path FTIR Manual, Spectrum
Environmental Solutions, Section
2.2.2 Basics of Data Collection;
Software algorithm executed every
5 minutes
Detection level
(sensitivity)
Quarterly for first two
years; semi-annually if
QA checks meet
acceptance criteria in at
least 80% of preceding
eight quarterly checks.
After major maintenance
Initial Commissioning
Equal to or less than the
approximate minimum
detection levels specified
in this QAPP for each
target pollutant
Factory and Site Acceptance Test
Plan, TORC 1180 Project, Spectrum
Environmental Solutions, Section
2.1.4 Detection Limit Sensitivity
Instrument
Resolution
Once at Commissioning 0.5 cm-1 resolution Factory and Site Acceptance Test
Plan, TORC Rule 1180 Project,
Spectrum Environmental Solutions,
Section 2.1.1 Instrument Resolution
Detector
Linearity
Once at Commissioning < 3.0% standard
deviation
Factory and Site Acceptance Test
Plan, TORC Rule 1180 Project,
Spectrum Environmental Solutions,
Section 2.1.6 Detector Linearity
Path
Repeatability
Tests
Once at Commissioning < 3.0% standard
deviation
Factory and Site Acceptance Test
Plan, TORC Rule 1180 Project,
Spectrum Environmental Solutions,
Section 2.1.7 Path Repeatability
Tests
Table B-7: Quality assurance for open-path UVDOAS monitors
Parameter Frequency Acceptance criteria Procedure document
Reference gas
check
Quarterly for first two
years; semi-annually if
QA checks meet
acceptance criteria in at
least 80% of preceding
eight quarterly checks.
After major maintenance
Initial Commissioning
Accuracy: ≤ 30% of
reference gas value,
calculated using Equation
4 presented in Section
B.5.2
Precision: ± 25%,
calculated using Equation
2 presented in Section
B.5.2
Factory and Site Acceptance Test
Plan, TORC Rule 1180 Project,
Spectrum Environmental Solutions,
Section 2.2.5

Revision 1 (DRAFT – Issue for Review) Quality Assurance Project Plan
September 10, 2019 Torrance Refinery Fenceline Air Monitoring System
37 of 48
Equipment Calibration
Table B-7: Quality assurance for open-path UVDOAS monitors
Parameter Frequency Acceptance criteria Procedure document
Detection level
(sensitivity)
Annual Equal to or less than the
approximate minimum
detection levels specified
in this QAPP for each
target pollutant
Factory and Site Acceptance Test
Plan, TORC 1180 Project, Spectrum
Environmental Solutions, Section
2.2.4 Detection Limit Sensitivity
Line shift Continuous 0.5 cm-1 resolution Factory and Site Acceptance Test
Plan, TORC 1180 Project, Spectrum
Environmental Solutions, Section
2.2.2 Line Shift Correction
Baseline noise
equivalent
absorbance
(NEA) test
Once at commissioning -- Factory and Site Acceptance Test
Plan, TORC 1180 Project, Spectrum
Environmental Solutions, Section
2.2.3 Noise Equivalent Absorbance
(NEA) Testing
Path
repeatability
test
Once at commissioning < 3.0% standard
deviation
Factory and Site Acceptance Test
Plan, TORC 1180 Project, Spectrum
Environmental Solutions, Section
2.2.6
Note, because open-path instruments rely on accurate spectroscopy, surrogates are used in place of
measuring DQOs for each parameter. All open-path instruments will have a reference gas or a QA cell.
Reference gases with path adjusted concentrations19 will be used for checking DQOs.
B.7.1.1 Reference Gas Spectra
Each FTIR monitor will be compared against a known IR spectra curve (e.g., from the Pacific
Northwest National Laboratory) for certain pollutants of concern. An instrument challenge test is
conducted by taking a measurement of a known concentration in an enclosed cell placed into the
normal measurement path, over a fixed path length and at a known temperature and pressure. This
serves as a quality assurance check in the presence of all the spectral interferences present in the
normal measurement path. That measurement is then compared to the reference spectra, and if
values are within acceptable criteria, the calibration can be verified. Calibration generally requires one
point, since absorption and response are linear.
A FTIR or UVDOAS challenge test with one measured gas verifies performance for all measured gases
because it verifies the spectral measurements and analysis used for all gases.18 Instrument challenge
tests will be performed with ethyl benzene, selected because of its lesser toxicity compared with other
target pollutants and satisfactory absorbance in both the infrared and ultraviolet bands making it
suitable for both the FTIR and UVDOAS challenge tests.
Another type of QA check is known as an “atmospheric challenge.” In this check, the atmospheric
concentration of a gas measured by the open path system will be compared against an expected or
known concentration value. For the UVDOAS systems, the atmospheric check will be conducted by
19 To achieve the same ppb-m absorbance with the short reference gas cell as in the full monitor path, reference
gas concentrations need to be much higher than in the ambient air (in proportion to the optical path length
difference between the monitor path and reference cell).
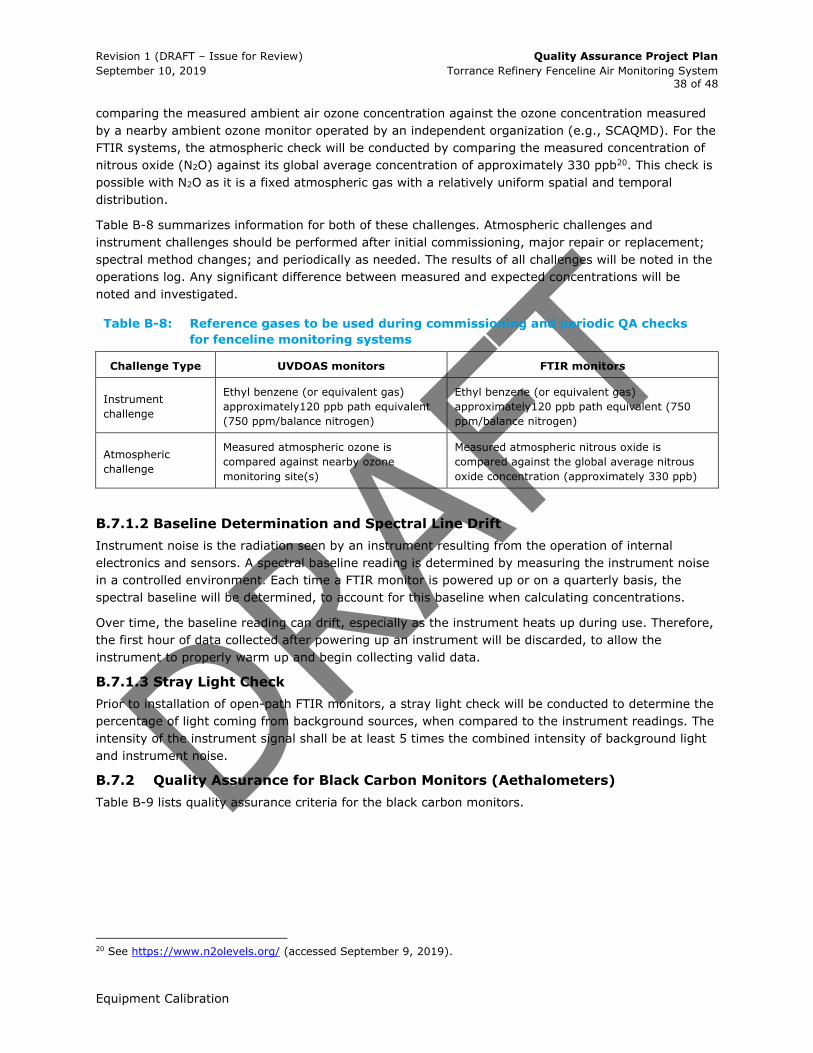
Revision 1 (DRAFT – Issue for Review) Quality Assurance Project Plan
September 10, 2019 Torrance Refinery Fenceline Air Monitoring System
38 of 48
Equipment Calibration
comparing the measured ambient air ozone concentration against the ozone concentration measured
by a nearby ambient ozone monitor operated by an independent organization (e.g., SCAQMD). For the
FTIR systems, the atmospheric check will be conducted by comparing the measured concentration of
nitrous oxide (N2O) against its global average concentration of approximately 330 ppb20. This check is
possible with N2O as it is a fixed atmospheric gas with a relatively uniform spatial and temporal
distribution.
Table B-8 summarizes information for both of these challenges. Atmospheric challenges and
instrument challenges should be performed after initial commissioning, major repair or replacement;
spectral method changes; and periodically as needed. The results of all challenges will be noted in the
operations log. Any significant difference between measured and expected concentrations will be
noted and investigated.
Table B-8: Reference gases to be used during commissioning and periodic QA checks
for fenceline monitoring systems
Challenge Type UVDOAS monitors FTIR monitors
Instrument
challenge
Ethyl benzene (or equivalent gas)
approximately120 ppb path equivalent
(750 ppm/balance nitrogen)
Ethyl benzene (or equivalent gas)
approximately120 ppb path equivalent (750
ppm/balance nitrogen)
Atmospheric
challenge
Measured atmospheric ozone is
compared against nearby ozone
monitoring site(s)
Measured atmospheric nitrous oxide is
compared against the global average nitrous
oxide concentration (approximately 330 ppb)
B.7.1.2 Baseline Determination and Spectral Line Drift
Instrument noise is the radiation seen by an instrument resulting from the operation of internal
electronics and sensors. A spectral baseline reading is determined by measuring the instrument noise
in a controlled environment. Each time a FTIR monitor is powered up or on a quarterly basis, the
spectral baseline will be determined, to account for this baseline when calculating concentrations.
Over time, the baseline reading can drift, especially as the instrument heats up during use. Therefore,
the first hour of data collected after powering up an instrument will be discarded, to allow the
instrument to properly warm up and begin collecting valid data.
B.7.1.3 Stray Light Check
Prior to installation of open-path FTIR monitors, a stray light check will be conducted to determine the
percentage of light coming from background sources, when compared to the instrument readings. The
intensity of the instrument signal shall be at least 5 times the combined intensity of background light
and instrument noise.
B.7.2 Quality Assurance for Black Carbon Monitors (Aethalometers)
Table B-9 lists quality assurance criteria for the black carbon monitors.
20 See https://www.n2olevels.org/ (accessed September 9, 2019).

Revision 1 (DRAFT – Issue for Review) Quality Assurance Project Plan
September 10, 2019 Torrance Refinery Fenceline Air Monitoring System
39 of 48
Equipment Calibration
Table B-9: Quality assurance for black carbon monitors (aethalometers)
Method Frequency Acceptance criteria Procedure document
Flow Calibration Once every 6
months
≤ ± 5% (% difference) BC1060 Black Carbon Monitor16, Met One
Instruments, Section 6.4
Leakage check Once every 6
months
≤ ± 10% (% difference) BC1060 Black Carbon Monitor16, Met One
Instruments, Section 6.5
Neutral density
optical filter test
Annual ≤ ± 10% (% difference of
slope of attenuation values)
BC1060 Black Carbon Monitor16, Met One
Instruments, Section 6.4.6
B.7.3 Quality Assurance for Hydrogen Sulfide Monitors
Table B-10 lists calibration procedures and acceptance criteria for the hydrogen sulfide monitors.
Reference gases with hydrogen sulfide concentrations of 0 ppb, 100 ppb and 1,000 ppb will be
introduced during the zero/span calibration.
Table B-10: Quality Assurance for hydrogen sulfide monitors
Parameter Frequency
Acceptance
Criteria Procedure Document
Zero/span
calibration
Every three months ± 10% Teledyne API, Model T101 UV Fluorescence
H2S Analyzer, User Manual17, Section 6
sulfur dioxide
scrubber
check
Every three months ≤ 2% Teledyne API, Model T101 UV Fluorescence
H2S Analyzer, User Manual17, Section 7.3.3
Hydrogen
sulfide
converter
efficiency
check
Every three months ≥ 96% Teledyne API, Model T101 UV Fluorescence
H2S Analyzer, User Manual17, Section 7.3.5
B.7.4 Meteorological Equipment Calibrations
This section summarizes calibration information for the meteorological sensors at the meteorological
tower system. The meteorological sensors are fully calibrated by the manufacturer at the time of
purchase. Additional calibrations and system audits for all meteorological equipment will be conducted
on a bi-annual basis, with calibrations and audits alternating on a periodic basis. The frequency for
calibration and accuracy checks was established on the basis that these measurements are for
information purposes rather than for monitoring relative to established standards. Table B-11
summarizes the calibration and accuracy criteria for the meteorological equipment.

Revision 1 (DRAFT – Issue for Review) Quality Assurance Project Plan
September 10, 2019 Torrance Refinery Fenceline Air Monitoring System
40 of 48
Inspection of Supplies and Consumables
Table B-11: Meteorological sensor calibration and accuracy criteria
Measurement
parameter Measurement principle
Accuracy
criteria Frequency
Ambient
temperature Aspirated Thermistor Met One 076B, 060-A2 ±1.0 °C Every 12 months
Relative humidity Thin film polymer capacitor, Met One 083E
±7%
relative
humidity
Every 12 months
Barometric pressure Capacitor Met One 090D ±3 mb Every 12 months
Wind speed Anemometer/Pulse Frequency Counter Met One
010C ±0.2 m/s Every 12 months
Wind direction Vane Potentiometer Met One 020C ±5
degrees Every 12 months
Precipitation Dual-chambered tipping bucket Met One 360 ±10% Every 12 months
Visibility IR forward scattering Met One 6400 ±10% Every 12 months
B.7.5 Fenceline Air Monitoring System Calibration and Verification
Recordkeeping
All calibration data will be recorded and documented following the processes described in Section A.9,
Documents and Records, and B.10, Data Management. Additionally, the field operator will document
the serial numbers of all equipment used in the calibration process in the field log, and identifying
information for all gas standards (e.g., cylinder ID, certification date, verified concentration, etc.) will
be documented in the field log. The field operator will have primary responsibly for analyzing the
calibration data following the procedures and processes described and referenced in this section.
B.8 Inspection of Supplies and Consumables
Acceptance criteria for supplies and consumables vary with the operation being conducted and are
generally described in the relevant SOPs. In general, the SOPs are checked to ensure the adequate
criteria for supplies and consumables are met and appropriate for use for the operation. Reference gas
labels will be checked to ensure they are traceable to NIST standards and meet the required accuracy
and concentration specifications. All parts received via shipment will be opened and examined to
ensure they are not damaged, the packing slips will be archived, and an inspection log shall be
maintained which records when the incoming shipments were received and inspected.
The spare parts and consumable items strategy is designed to achieve the data completeness criteria
without an inventory of redundant complete analyzers. The System Manager/Operator will order and
maintain spare parts inventory for the fenceline air monitoring systems, at the minimum quantities
recommended by the respective suppliers and as necessary to achieve the data completeness criteria.
The System Manager/Operator will also maintain a consumable supplies inventory and update it as
consumable items are used, or as new parts are ordered. The System Manager/Operator will perform
routine and emergency maintenance, including the replacement of spare parts, in an expedited
manner.
B.9 Non-Direct Measurements
This section identifies types of data that are not directly generated or collected by this measurements
program. As referenced in Table A-4 (air monitoring system equipment by location), the open path

Revision 1 (DRAFT – Issue for Review) Quality Assurance Project Plan
September 10, 2019 Torrance Refinery Fenceline Air Monitoring System
41 of 48
Data Management
measurement systems (UVDOAS and FTIR) at OPA-2 and OPA-3 will not be operated by Torrance
Refinery until the conclusion of a Supplementary Environmental Project (SEP) being administered by
SCAQMD. The SEP is scheduled for completion by approximately June 2021. Until that time, the open
path monitors at these two locations and related operation, maintenance, and data validation will be
supplied by a third party. The Torrance Refinery fenceline air monitoring system will download data
produced by the SEP systems into its database and display them on the public website; however,
Torrance Refinery is not responsible for validating the SEP data. See Section B.10.1, Website
Management and Community Interface, for additional information.
B.10 Data Management
Pollutant concentration data will be collected using on-site computers which will parse the data and
perform preliminary automated QC of the data. The data is then sent to a cloud server through a
cellular connection every five minutes for further validation, archiving, and distribution. Once delivered
to the cloud server, validation calculations and distribution will occur. Concentration values will be
presented on a public website as five-minute measurements , 1-hour rolling averages, 8-hour rolling
averages, and, for black carbon only, 24-hour rolling averages. These values will be updated for each
path every ten minutes for the open-path systems and every five minutes for fixed-point monitors.
The pathway for raw and validated data is shown in Figure B-2 and described in detail in the following
sections.
Figure B-2: Raw and validated data flow
Fenceline air monitors
Database Parsing and preliminary
automated QC
Detailed QA/QC
Email notifications
Public website
Quarterly reports
Raw data transfer
Notifications
module
4G/LTE connection
Cloud server
Website server
Third party verification,
SCAQMD
Offsite backup
and storage
System administrator
server
Weather station (1)

Revision 1 (DRAFT – Issue for Review) Quality Assurance Project Plan
September 10, 2019 Torrance Refinery Fenceline Air Monitoring System
42 of 48
Data Management
B.10.1 Website Management and Community Interface
A publicly accessible website will be created to display data in real time. A detailed description of the
website with a proposed layout, directions for interactions, and figures is provided in Section 7 of the
Torrance Refinery Rule 1180 Fenceline Air Monitoring Plan (provided in Appendix II), but a brief
overview of its functionality is provided below.
The overall goals of the website are to: inform the public of pollutant concentrations at or near the
refinery fenceline; inform the public of fenceline air monitoring system operations, outages, and
events; and educate the public on the health-based concentration thresholds, monitoring techniques
and procedures, and provide links to community emergency response planning resources.
A message board page will show a history of notifications in chronological order. This will primarily be
used to notify the public of pollutant concentrations that are greater than thresholds, instrument
outages (planned or unplanned), and announce the availability of quarterly data reports. Users will
also be able to subscribe, to receive automated notifications from the website through an email
service.
A data page will show real time values for conditions at the facility in an interactive map. Users can
view current concentrations at any of the monitors placed around the facility fenceline and view
meteorological conditions in real time. Users also will be able to view historical data for a given time
period, monitor, and parameters of their choosing.
All quarterly data reports will be made available on the website for download through the Reports
page. Any third-party data displayed on the website or contained in quarterly reports will be clearly
marked as such.
Finally, a Learning Center page will provide some insight into monitoring operations, in the form of a
FAQ page. This section will also provide information on the monitors used, potentially emitted
pollutants and their health effects, significant threshold levels, commonly used terms and definitions,
etc. Links will be provided to additional resources for users that want to learn even more.
B.10.2 Public Notification System
An email notification system, available to anyone, will send automated email alerts to announce a
pollutant anomaly, planned or unplanned monitor outages, or the availability of quarterly data reports.
Automated public notifications will be sent via email immediately after a 1-hour rolling average
pollutant concentration is measured that is greater than its respective inhalation exposure threshold.
Measurements invalidated via the automatic QA/QC system, such as during known instrument outages
or when instruments are showing operational errors, will not generate automated public notifications.
However, they will be reviewed by the Data/Quality Control Manager and the Program Quality
Assurance Manager.

Revision 1 (DRAFT – Issue for Review) Quality Assurance Project Plan
September 10, 2019 Torrance Refinery Fenceline Air Monitoring System
43 of 48
Audits and Response Actions
C. ASSESSMENT AND OVERSIGHT
C.1 Audits and Response Actions
The project team includes a quality assurance specialist whose duties are solely in the area of
independent assessment of the measurement effort. This individual is part of the same corporate
organization as the project team but holds no duties or interests in the operation of any of the
monitoring sites and networks that he/she audits. To promote objectivity and independence, the
specialists maintains designated audit equipment in a separate location from the operations center
and has access to the Program Quality Assurance Manager for assistance in promoting the quality
objectives of the company. The Program Quality Assurance Manager is also available to assist in
resolution of project issues related to quality. Assessments conducted for this project fall into two
categories: Technical systems audits and performance evaluation audits. Both provide vital
information regarding the status of the project team operation and how well the measurement data
adhere to the quality specifications of the QAPP.
All performance and technical systems audits are conducted following the guidance documents in the
“EPA Quality Assurance Handbook” series, Volumes I, II, and IV. Additional method specific quality
guidance is provided by the applicable sections of the manufacturer operating manuals, in the absence
of an EPA guidance document specific to the application of an equipment-specific measurement.
C.1.1 Technical Systems Audits
Technical systems audits for the field operation have several areas of focus. The primary goal of
Technical system audits is to determine if operation and maintenance of the fenceline air monitoring
system conforms with the procedures and criteria specified in this QAPP. The audit is conducted
employing a checklist as a guide to the major topics to be assessed, and the auditor is free to allot
greater amounts of time to any particular area as needed. The checklist is prepared in advance of the
audit and is based on information presented in the QAPP and in general, the guidance of the EPA QA
Handbook series.
The field technical system audit includes a review of overall equipment siting and exposure, site visit
logs, continuous analyzer and meteorological operating procedures and documentation and any site
maintenance activities. From this assessment, the auditor is able to determine the quality
requirements for the monitoring effort from the QAPP, and then report on the level of adherence to
the specifications. This review includes traceability documentation for gas standards and test
equipment to conduct quality control checks on pollutant and meteorological monitors. Where the
specification appears incomplete or inadequate, the auditor should be able to apply EPA guidance
document information and personal experience.
Technical systems audits may cover the following instrumentation aspects:
• Compare actual O&M practices with SOPs;
• Inspect preventative and unscheduled maintenance logs;
• Inspect spare parts inventories;
• Inspect exterior and interior structures (clean, serviceable, etc.);
• Review of logs and determinations if past problems were addressed/resolved;
• Examine all open-path, point source and meteorological monitor functions and
components using the maintenance checklist to confirm that the equipment is operating
with manufacturer specifications; and

Revision 1 (DRAFT – Issue for Review) Quality Assurance Project Plan
September 10, 2019 Torrance Refinery Fenceline Air Monitoring System
44 of 48
Reports to Management
• Analysis methods for of target compound(s) accuracy, precision and sensitivity per
requirements listed in Table A-8 and A-9.
C.1.2 Performance Evaluation Audits
Performance evaluation audits are quantitative audits and will be conducted periodically coincident
with one of the programmed quarterly assurance checks. Performance evaluation audits will consist of
third-party reviews of open-path analyzer spectral analysis and blind challenges of the monitors with
reference gases with concentrations known only to the third-party assessor. Performance evaluation
audits will be performed by the Third-Party QA Assessor.
C.2 Reports to Management
Report for field performance and technical systems audits conducted include a statement of the scope
of the audit, summary presentation of results, and a listing of specific observations or findings related
to the specifications under review. Also, the field data and traceability documents for each audit
standard employed are included. The auditor should always provide the field technician and or the
System Manager/Operator a list of preliminary findings and recommendations during a debriefing
meeting held at the conclusion of the audits. If significant deficiencies are determined that impact the
ability of the system to properly function, the System Manager/Operator will be notified immediately.
The System Manager/Operator will notify the Rule 1180 Program Manager of the situation and advise
them of the response actions being undertaken to restore the systems to full operational status. A
formal report should be provided to the project team within three weeks of completion of the audits. If
there are no corrective action items, the auditor may close the audit. If further action is required, the
audit will be classified as open pending verification that the corrective action was completed, and the
audit specification is met.
The System Manager/Operator team will develop quarterly reports summarizing systems performance
and containing the final validated monitoring results for that quarter. Quarterly reports will be due by
the end of the month, following the month for which the data were collected. After the quarterly
reports have been approved, they will be posted on the Torrance Refinery website for public access.

Revision 1 (DRAFT – Issue for Review) Quality Assurance Project Plan
September 10, 2019 Torrance Refinery Fenceline Air Monitoring System
45 of 48
Data Review, Verification, and Validation
D. DATA VALIDATION AND USABILITY
D.1 Data Review, Verification, and Validation
Data review, validation and verification procedures are presented in this section. Three types of data
are collected for this project:
• Continuous data from the open-path systems;
• Continuous data from the point source monitors; and
• Continuous data from the meteorology sensors.
Data will be declared invalid whenever documented evidence exists demonstrating that a monitor was
malfunctioning, or data were collected under non-representative conditions. It should be noted that
the monitors are independent of one another for the purpose of documenting invalid data. For
example, if the meteorological system is down, the data from an open-path or point source monitor
may still be acceptable and reported.
Data reviews and appropriate validations will be performed for each monthly data set under the
supervision of the project manager. The data management task leader will verify that the data from
the individual monitors are complete for the month. The task leader will then inform the System
Manager/Operator when the complete data set is ready.
The activities involved in validation of the data in general include the following:
• Reviewing the site visit logs, calibration data (as appropriate), audit data, and project
memoranda for indications of malfunctioning or instrument maintenance events; and
• Examining the monitor and meteorology data for spikes in the data, unusual persistence,
unusually high rates of change, or measurement values that seem incongruous with
normal measurement ranges and/or diurnal variations. Spectral analysis for selected large
or anomalous measurements may be required; and
• Comparing measured concentrations against data from nearby air monitoring stations.
Data are never declared invalid solely because they are unlikely to occur in nature but may be flagged
as suspect and be subject to further review until the cause for the apparent anomaly is determined.
The results from all quality control and quality assurance checks are evaluated to determine if the
DQOs for each instrument are being met.
Evidence of overwhelming measurement bias, external influences on the representativeness of the
data, or lack of reproducibility of the measurement data may be cause for the data to be judged
invalid.
D.1.1 Open-Path and Point Source Monitors
The open-path and point source monitor measurements and system performance data are obtained
continuously via modem. They are reviewed at least daily to verify that the systems are collecting
data and that there are no indications of equipment malfunctions. If a problem is detected in the daily
reviews, the System Manager/Operator (or his designee) is immediately notified (text or email) so
that he can direct the site operator’s corrective actions. This contact is documented via email and
distributed to the project team so that the situation may be accounted for in the monthly validation
process and summary reports.
Spectral data are archived continuously. All other data are archived by on System Manager/Operator
network drives so that they are available to post-processing and reporting personnel. Manual spectral

Revision 1 (DRAFT – Issue for Review) Quality Assurance Project Plan
September 10, 2019 Torrance Refinery Fenceline Air Monitoring System
46 of 48
Verification and Validation Methods
validations are performed on data above the action levels listed in Table 7-3 of the Torrance Refinery
Rule 1180 Fenceline Air Monitoring Plan (provided in Appendix II). Additional data validations will be
performed as needed/required during reporting or times where operations of the open-path systems
are suspect.
A conservative approach is taken with the open-path data in that it is accepted as is except under
situations where QC indicators are met. The primary QC indicators are past alarms events that have
been validated as false positives or any data deemed erroneous due to known system influences or
failures.
D.1.2 Meteorology Sensors
The meteorology data are retrieved and subject to manual data review. Certain screening tests, such
as those recommended by EPA,21 will be performed to aid in identifying data that require further
investigation.
D.2 Verification and Validation Methods
The specific checks performed during the automated QA/QC will depend on the parameter and type of
instrument. However, the following general types of checks will be performed on all measurements:
• Range checks will confirm the measurement is within pre-defined minimum and maximum
values;
• Sticking value checks will be used to flag data for further review;
• Rate of change checks will confirm that subsequent observations change by a reasonable
extent and will be used to identify potentially spurious data or instrument failure for
further review;
• Sensor codes or alarms generated by the instruments, if available, will be used to validate
observation data; and
• The return beam intensity, for open path instruments, will be used to validate data.
Per US EPA guidance on remote sensing for monitoring of ambient pollutants,18 there are four levels of
data validation: level 0, 1, 2 and 3. These levels are described below along with specific validation
activities that will be performed to ensure validity and usability of the fenceline data collected from the
open path and fixed-point monitors.
Level 0 verification includes review of raw calibration data and initial setup observation prior to
collecting field data. It also includes field observation of the equipment setup and function.
Calibration data from the open path analyzers, fixed point monitors and meteorological system will be
reviewed after each verification check has been performed to ensure they satisfy requirements set
forth in this QAPP, SOPs or operation manuals for the following criteria:
• Calibrations are performed on schedule;
• Calibrations are performed in the proper sequence;
• Calibration standards reflect conditions expected during operational measurements; and
21 On-Site Meteorological Program Guidance for Regulatory Modeling Applications, U.S. Environmental Protection
Agency, February 2000. EPA-454/R-99-5. See https://www3.epa.gov/scram001/guidance/met/mmgrma.pdf
(accessed August 2019).

Revision 1 (DRAFT – Issue for Review) Quality Assurance Project Plan
September 10, 2019 Torrance Refinery Fenceline Air Monitoring System
47 of 48
Verification and Validation Methods
• Linearity checks or other checks were performed to ensure the measurement system was
stable during calibration.
Monthly visual field inspections will also be performed to visually verify performance of monitors as
follows:
• The equipment is operational and optical data was being collected and stored;
• The equipment is aimed correctly, and the collected data is different from zero or full
saturation; and
• There are no anomalies in the time-series of data collected by the monitors or
meteorological sensors.
These inspections will be logged and kept on file for audit inspections or other review.
Level 1 validation involves downloading data from the measurement systems/instruments and
reviewing variables calculated as part of the QC process. Specific aspects that will be reviewed are the
following:
• Whether the signal intensity from the equipment has drifted or diminished relative to the
most recent maintenance activity;
• The frequency with which data exceeds the allowable ranges or fails the sticking value
check;
• Whether the measurement system contained any data collection failure flags or other
indication of anomalous data collection; and
• Whether the range and values of minimum detection limits reported by the instruments
are within expected bounds.
Level 2 review entails validating measurement data relative to ancillary measurements and historical
data. Calibration logs, audit reports, meteorological measurements, facility activity logs and historical
measurement data will be used to perform a manual review to determine whether data flagged as
anomalous should be corrected or invalidated. The following checks will be done monthly (at a
minimum):
• Trends and excursions in optical data will be reviewed against prevailing wind speed and
direction and facility process information;
• During the QA Manager review, data will be plotted, and special attention will be given to
unusually low or high outliers or deviations in the minimum measured value from day to
day;
• Data completeness and representativeness DQOs will be assessed; and
• Five-minute average data will be reviewed to flag and evaluate rapid changes in value
between successive data points.
Level 3 data validation represents the highest level of data review conducted and will be performed
by the independent Third-Party QA Assessor. This team will have a basic understanding of the
instrument operation and will be familiar with typical results from similar measurement projects.
Level 3 data validation will determine what optical remote measurement data should be invalidated if
a serious response problem with the optical technology is detected, or if calibration errors are

Revision 1 (DRAFT – Issue for Review) Quality Assurance Project Plan
September 10, 2019 Torrance Refinery Fenceline Air Monitoring System
48 of 48
Reconciliation with Data Quality Objectives
identified. The reasons for changes to data quality resulting from the validation process, as well as
details of corrective action taken, will be documented. Flags on data will be reviewed to interpret
combinations of multiple flags on the data and determine what data should be invalidated.
D.3 Reconciliation with Data Quality Objectives
Periodically throughout the data collection effort, it is the responsibility of the Program Quality
Assurance Manager and System Manager/Operator to evaluate the project progress in meeting the
client’s goals for the measurement data. This evaluation will occur annually at a minimum. Two areas
will be reviewed: the performance of the project in respect to the quality goals specified in the QAPP
and the limitations (if any) on the measurement data for their intended use. Also, per the Rule 1180
Guidelines, this annual evaluation should also assess the effectiveness of the monitoring plan covering
experimental design, representativeness of the data, and peer review. The results of this annual
evaluation will be reported to Torrance Refinery.
D.3.1 Assessment of Measurement Performance
As part of the annual review the performance of the monitoring network will be assessed to determine
to what extent the measurement data meet the requirements of the data user (client and/or
regulatory agency). In Section A.7 on Quality Objectives and Criteria, a discussion of the DQIs was
presented in relation to precision, accuracy, completeness, representativeness, and comparability
goals for the monitoring effort. Specific quantitative measures of precision, accuracy and
completeness were defined for use in estimating the quality of the data set. These measures will be
calculated and compared to the project goals.
D.3.2 Data Quality Assessment
If any of the data quality measures indicate performance outside the desired objective (e.g., an audit
results outside the project specification or a monthly completeness average less than the annual goal)
the data associated with that result are not considered useless. The burden is on the project team to
determine the extent to which a quality issue affects the related data, and ultimately how the issue
impacts the fitness for use of the data. Most often a single isolated incident in which the performance
objective is not met does not automatically render the data useless, but rather slightly reduces the
confidence that the measurement is reliable and indicates that increased quality control measures are
needed. Any such data for which there is a question of confidence will be appropriately flagged in the
database. The DQOs are assessed periodically throughout the monitoring year, and a complete
evaluation conducted at the completion of the year. A month in which the completeness statistic for a
given monitor is below the objectives is cause for concern and corrective action, but if the other 11
months are within the objective, the confidence in the annual data set should remain high.
Any potential limitations of the validated data set will be identified and communicated. The project
team will present all known or potential limitations on the data with each data submittal and will
clearly flag any such data so that users may determine if the data should be used for a particular
discussion or decision.

Revision 1 (DRAFT – Issue for Review) Quality Assurance Project Plan
September 10, 2019 Torrance Refinery Rule 1180 Fenceline Air Monitoring System
I-1 of 10
Appendix I - Fenceline Air Monitoring System Specifications
APPENDIX I
FENCELINE AIR MONITORING SYSTEM SPECIFICATIONS

Revision 1 (DRAFT – Issue for Review) Quality Assurance Project Plan
September 10, 2019 Torrance Refinery Rule 1180 Fenceline Air Monitoring System
I-2 of 10
Appendix I - Fenceline Air Monitoring System Specifications
Table I-1: Open-path FTIR analyzer specifications
Parameter Units Specification Comment
Analyzer type None FTIR
Wave resolution cm-1 0.125 - 32
Spectral range cm-1 550 – 7,800 Range is dependent on supplier
Scan frequency scans/second Varies – 0.5 to 2 at 0.5
cm-1
Scan frequency increases as
resolution decreases
Receiver configuration None monostatic
Source type None Polaris™ long lifetime
source
Detector type None Mercury Cadmium
Telluride (MCT)
Detector cooling type None Stirling cyrocooler
Detector temperature K 77
Beam splitter None ZnSe
Interferometer type None 90° dynamically aligned
Michelson interferometer
Signal to noise ratio None 100,000:1
Bench stabilization None Dynamic alignment Algorithm reduces noise
QA gas cell type None Internal linear dual pass
cell
Cell can be moved into beam path.
Cell Window None ZnSe
Operating Temperature °C 0 to 60 °C
Time resolution
(averaging time)
Minutes per
reading
5 per path
Power requirement VAC 110 - 240
Signal sampling ADC 24-bit Used for data acquisition
Output None USB
Material of construction None Aluminum with stainless
steel fasteners
Robust and ruggedness required

Revision 1 (DRAFT – Issue for Review) Quality Assurance Project Plan
September 10, 2019 Torrance Refinery Rule 1180 Fenceline Air Monitoring System
I-3 of 10
Appendix I - Fenceline Air Monitoring System Specifications
Table I-2: FTIR – ancillary equipment specifications
Parameter Units Specification Comment
Alignment Mechanism/Rotating Pedestal/Auto-positioner
Type None Moog MPT-90
Mechanism None Pan and Tilt Unit Required to remotely
position analyzer
Load capacity pounds At least 100
Pan movement range ° 435°
Tilt movement range ° 180°
Operating temperature °F 5 to 131 Without heaters (heaters
not required in southern
California weather
conditions)
Motor yype None Stepper
Communications to pan &
tilt
RS232 or LAN to PC
Communications to
sensors
RS232 Analog or LAN
pass-through
Material None Housing: 6061-T6
aluminum,
stainless steel hardware
permanently sealed radial
ball bearings
Retroreflectors
Configuration None Open hollow cubes
Hollow cube retro
reflectors have three flat
sides that are attached in
an orientation so that the
reflected beam exits at
nearly the same angle of
incidence as the incoming
beam.
Mounting None Rail mounted
Material (substrate) None Polished glass
Coating None Gold coating
Surface quality None 80-50 scratch dig
Adhesion None Mil F-48616; Humidity
MIL F-48616 or equivalent
Operating temperature
range °C -40 to 60

Revision 1 (DRAFT – Issue for Review) Quality Assurance Project Plan
September 10, 2019 Torrance Refinery Rule 1180 Fenceline Air Monitoring System
I-4 of 10
Appendix I - Fenceline Air Monitoring System Specifications
Table I-2: FTIR – ancillary equipment specifications
Parameter Units Specification Comment
Reflectivity cm-1 500 to 15,000
Array configuration None 85 to 104 cubes Varies by path length
Enclosure None Customer supplied
Heater None Optional Can help reduce
condensation
Heater power
consumption W 480 maximum
Required 120 VAC, 5
amp, 60 Hz
Table I-3: FTIR – computer and software specifications
Parameter Specification Comment
Computer Windows 7 or above;
Memory: 3 GB minimum;
Dual Core 2.1 GHz processor;
Min. 2 USB ports;
Ethernet port;
802.11 b/g/n wireless LAN.
Software
Type Real-time monitoring of pollutants
Data display Real-time display of results as well
as instrument diagnostics.
Alarms
User programmable to set alarms
when concentrations are greater
than thresholds
Notifications
Ability to send notifications when
pollutant concentrations greater
than a specified threshold are
measured
Beam intensity Ability to display beam intensity
being measured
Communication
Compatible with all computer
systems and software for data
processing
The equipment should be able to
communicate alarms, operational
parameters and results with a
computer.
Remote control Calibrations and augments done
remotely

Revision 1 (DRAFT – Issue for Review) Quality Assurance Project Plan
September 10, 2019 Torrance Refinery Rule 1180 Fenceline Air Monitoring System
I-5 of 10
Appendix I - Fenceline Air Monitoring System Specifications
Table I-3: FTIR – computer and software specifications
Parameter Specification Comment
Smart features
Analytical method customization;
Background and interference
compensation;
Retroactive spectra analysis.
Table I-4: Open-path UVDOAS analyzer specifications
Parameter Units Specification Comment
Analyzer type None open-path UVDOAS
Receiver configuration None monostatic
Spectrometer resolution nm 0.5
UV source 150 W Xenon lamp
UV source replacement hours Every 3000 hours Minimum expected
lifetime; can be longer as
long as sufficient light is
being emitted
Operational wavelength nm 210-340
Beam operating
temperature
°C -20 to 50
Indoor shelter
temperature limits
°C -15 to 35
Bench stability None Thermally-stabilized
Operating humidity % 0 to 95%
Detector type None 2048 pixel spectrometer
QA gas cell None 8-cm flow-through cell
Electrical requirements VAC 110 or 240, single phase,
50-60 Hz, 5 amp
maximum
Time resolution
(averaging time)
minutes 5 minutes per reading
Data acquisition rate Milliseconds/scan 10-1000
Data output rate 10 sec – 5 min User configurable
Output None USB
Material of construction None Aluminum with stainless
steel fasteners
Robust and ruggedness
required

Revision 1 (DRAFT – Issue for Review) Quality Assurance Project Plan
September 10, 2019 Torrance Refinery Rule 1180 Fenceline Air Monitoring System
I-6 of 10
Appendix I - Fenceline Air Monitoring System Specifications
Table I-5: Open-path UVDOAS – ancillary equipment specifications
Parameter Units Specification Comment
Alignment Mechanism / Rotating Pedestal / Auto-positioner
Type None Moog MPT-90
Mechanism None Pan and Tilt Unit Required to remotely
position analyzer
Load capacity pounds At least 100
Pan movement range ° 435°
Tilt movement range ° 180°
Operating temperature °F 5 to 131 Without heaters (heaters
not required in southern
California weather
conditions)
Motor type None Stepper
Communications to pan &
tilt
RS232 or LAN to PC
Communications to
sensors
RS232 analog or LAN
pass-through
Material None Housing: 6061-T6
aluminum,
stainless steel hardware
permanently sealed radial
ball bearings
Retroreflectors
Configuration None Open hollow cubes
Hollow cube retro
reflectors have three flat
sides that are attached in
an orientation so that the
reflected beam exits at
nearly the same angle of
incidence as the incoming
beam.
Mounting None Rail mounted
Material (substrate) None Polished glass
Coating None Enhanced aluminum
coating
Surface quality None 80-50 scratch dig
Adhesion None Mil F-48616; Humidity
MIL F-48616 or equivalent

Revision 1 (DRAFT – Issue for Review) Quality Assurance Project Plan
September 10, 2019 Torrance Refinery Rule 1180 Fenceline Air Monitoring System
I-7 of 10
Appendix I - Fenceline Air Monitoring System Specifications
Table I-5: Open-path UVDOAS – ancillary equipment specifications
Parameter Units Specification Comment
Operating temperature
range °C -40 to 60
Reflectivity Nm 200-400
Array configuration None 27 to 37 cubes Varies by path length
Enclosure None Customer supplied
Heater None Optional Can help reduce
condensation
Heater power
consumption W 480 maximum
Required 120 VAC, 5
amp, 60 Hz.
Table I-6: Open-path UVDOAS – computer and software specifications
Parameter Specification Comment
Computer Windows 7 or above;
Memory: 3GB minimum;
Dual Core 2.1 GHz processor;
Min. 2 USB ports;
Ethernet port;
802.11 b/g/n wireless LAN.
Software
Type Real-time monitoring of pollutants
Data display Real-time display of results as well
as instrument diagnostics.
Alarms
User programmable to set alarms
when concentrations are greater
than thresholds
Notifications
Ability to send notifications when
pollutant concentrations greater
than a specified threshold are
measured
Beam intensity Ability to display beam intensity
being measured
Communication
Compatible with all computer
systems and software for data
processing
The equipment should be able to
communicate alarms, operational
parameters and results with a
computer.
Remote control Calibrations and augments done
remotely

Revision 1 (DRAFT – Issue for Review) Quality Assurance Project Plan
September 10, 2019 Torrance Refinery Rule 1180 Fenceline Air Monitoring System
I-8 of 10
Appendix I - Fenceline Air Monitoring System Specifications
Table I-6: Open-path UVDOAS – computer and software specifications
Parameter Specification Comment
Smart Features
Analytical method customization;
Background and interference
compensation;
Retroactive spectra analysis.
Table I-7: Aethalometer specifications
Parameter Units Specification Comment
Cartridge filter bypass None Required Filter used for clean air tests, should
be replaced once a year.
Electronic data output None
Single serial output
through either RS-232,
USB, or Ethernet port.
1200 to 115200 baud.
Calibration kit None
Neutral density optical
filter calibration kit or
equivalent
Ability to calibrate the absorptive
properties of the instrument
Filter tape material None Reinforced glass fiber Reduce effects of relative humidity.
Flow rate options Liters per minute 2
Internal vacuum pump None Internal DC powered
pump
Light source (nm) LED light sources at
different wavelengths
Different wavelengths measure the
absorption of different types of
carbon (including black carbon at
880 nm).
Power supply Watts (W)
12 V DC. Universal
100-240 VAC 50/60 Hz
input.
12 VDC 8.5 amp output supply
included.
Pulse damper None Recommended
Decrease pump pulsations to
minimize interferences with sensitive
measurements.
Resolution
Microgram per
cubic meter
(µg/m3)
0.001
Sample inlet tubing None Static Dissipative tubing Minimize amount of tubing required.
Time base of
measurements Seconds (s) 5-minute time base

Revision 1 (DRAFT – Issue for Review) Quality Assurance Project Plan
September 10, 2019 Torrance Refinery Rule 1180 Fenceline Air Monitoring System
I-9 of 10
Appendix I - Fenceline Air Monitoring System Specifications
Table I-8: Black carbon analyzers - computer and software specifications
Parameter Specification Comment
Computer Minimum 1 GB, Windows 7
Software
Alarms Operational parameters and
analyzer operation issues logged
Communication Compatible with all computer
systems and software for data
processing
Remote control Alarm identification and
troubleshooting, calibration and
flow checks, ability to view real
time concentrations remotely
Data display Physical display on equipment
and remote display of
consolidated data
Data processing 5-minute, 1-hour, 8-hour
averaging capabilities,
processing of alarms and QA
check information
Table I-9: Hydrogen sulfide UV fluorescence analyzer specifications
Parameter Units Specification Comment
Manufacturer/model -- Teledyne/API T-101
Electronic data output None
RS-232, Ethernet, or
USB port capabilities;
Capability to transmit
analyzer information to
software
Flow rate options Liters per minute 0.65 - 1
Light source (nm)
LED light sources in the
range of sulfur dioxide
absorption wavelengths
UV light in the range of
wavelengths absorbed by sulfur
dioxide (190 nm - 230 nm).
Power supply Watts (W)
100-230VAC, 50/60Hz
(auto-switching) – 200-
300 W average
Standard US Connection.
Resolution ppb 1
Time base of
measurements Seconds (s) 5-minute time base

Revision 1 (DRAFT – Issue for Review) Quality Assurance Project Plan
September 10, 2019 Torrance Refinery Rule 1180 Fenceline Air Monitoring System
I-10 of 10
Appendix I - Fenceline Air Monitoring System Specifications
Table I-9: Hydrogen sulfide UV fluorescence analyzer specifications
Parameter Units Specification Comment
Operating Temperature °C 20-30
Lag time seconds 25

Revision 1 (DRAFT – Issue for Review) Quality Assurance Project Plan
September 10, 2019 Torrance Refinery Rule 1180 Fenceline Air Monitoring System
II-1 of 2
Appendix II - Torrance Refinery Fenceline Air Monitoring Plan (Revision 2, xx/xx/2019)
APPENDIX II
TORRANCE REFINERY FENCELINE AIR MONITORING PLAN (REVISION 2,
XX/XX/2019)
[The Monitoring Plan will be attached once approved by SCAQMD]

Revision 1 (DRAFT – Issue for Review) Quality Assurance Project Plan
September 10, 2019 Torrance Refinery Rule 1180 Fenceline Air Monitoring System
II-2 of 2
Appendix II - Torrance Refinery Fenceline Air Monitoring Plan (Revision 2, xx/xx/2019)