Embed Size (px)
DESCRIPTION
Quality Assurance/Quality Control and Quality Assurance Project Plans. Greg Thoma University of Arkansas IPEC Quality Assurance Officer. Quality Assurance/Quality Control. QA is management of the data collection system to assure validity of the data. Organization & responsibilities - PowerPoint PPT Presentation
Citation preview

Quality Assurance/Quality Control and
Quality Assurance Project Plans
Greg Thoma
University of Arkansas
IPEC Quality Assurance Officer
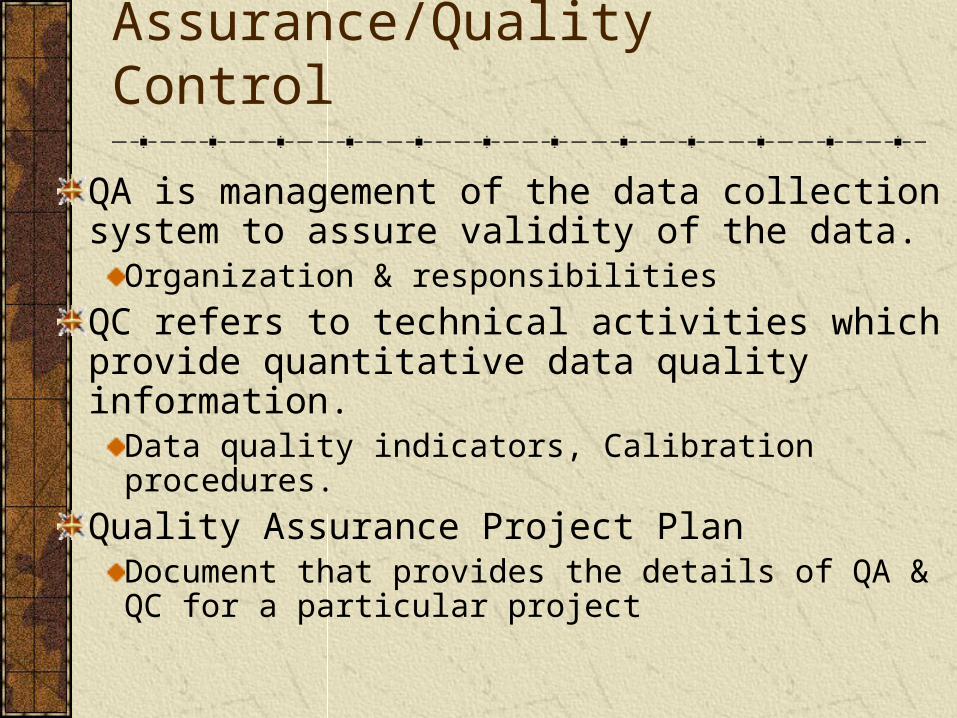
Quality Assurance/Quality Control
QA is management of the data collection system to assure validity of the data.
Organization & responsibilities
QC refers to technical activities which provide quantitative data quality information.
Data quality indicators, Calibration procedures.
Quality Assurance Project PlanDocument that provides the details of QA & QC for a particular project

Quality?
How good is “good enough”? 99.9% of the time?1 hour unsafe drinking water a month22,000 checks deducted from the wrong account an hour16,000 pieces of lost mail an hour
What does data quality mean?Universal standard? Relative measure?
The goal of generators of environmental data should be to produce data of known quality to support environmental decisions
Is the site clean?Does the technology work?

Scientific Method
Observe something interesting
Invent a tentative theory or hypothesis consistent with the observations
Use the hypothesisto make predictions
Test the predictions with planned experiments
Modify the hypothesis in light of the results
Conclude the theory is true
Discrepanciesbetween
observationand
theory?
No
Yes
How do you know if there are discrepancies?
Uncertainty in observed valued reduces the ability to
discriminate differences.

Data Life Cycle

Performance and Acceptance Criteria
Performance criteria address the adequacy of information that is to be collected for the project.
“Primary” data.
Acceptance criteria address the adequacy of existing information proposed for inclusion in the project.
“Secondary” (literature) data.

Performance and Acceptance Criteria
Effective data collection is rarely achieved in a haphazard fashion.
The hallmark of all good projects, studies, and decisions is a planned data collection.
A systematic process leads to the development of acceptance or performance criteria that are:
based on the ultimate use of the data to be collected, anddefine the quality of data required to meet the final project objectives.
QAG/4A

Performance and Acceptance Criteria
The PAC development process helps to focus studies by encouraging experimenters to clarify vague objectives and explicitly frame their study questions.
The development of PAC is a planning tool that can save resources by making data collection operations more resource-effective.
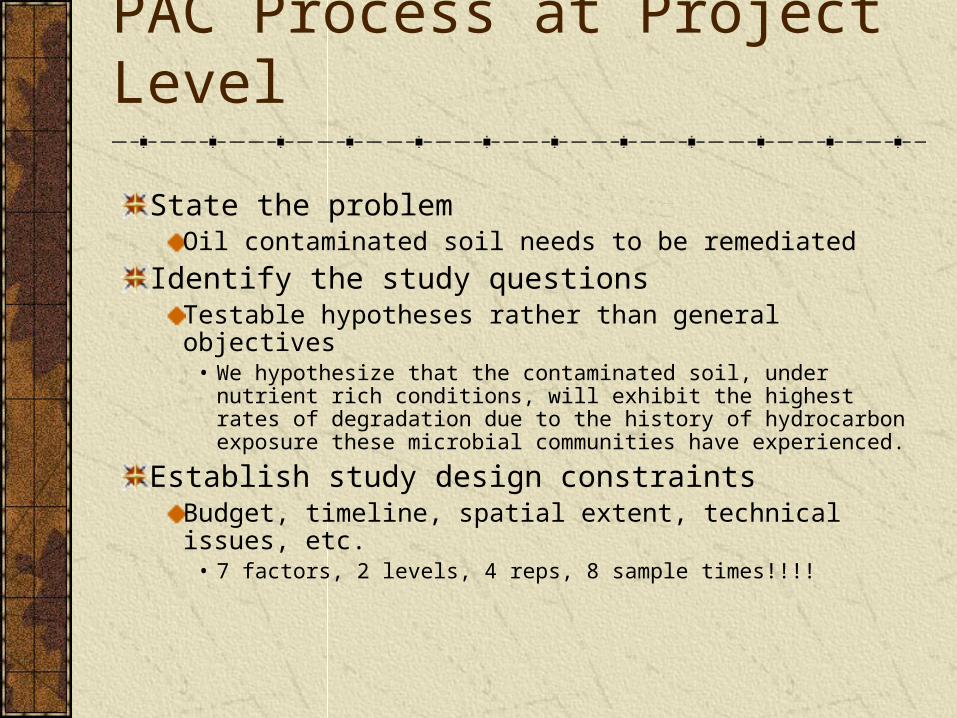
PAC Process at Project Level
State the problemOil contaminated soil needs to be remediated
Identify the study questionsTestable hypotheses rather than general objectives
• We hypothesize that the contaminated soil, under nutrient rich conditions, will exhibit the highest rates of degradation due to the history of hydrocarbon exposure these microbial communities have experienced.
Establish study design constraintsBudget, timeline, spatial extent, technical issues, etc.
• 7 factors, 2 levels, 4 reps, 8 sample times!!!!

PAC Process at Project Level
Identify data requirementsWhat needs to be measured? Soil properties, nutrient status, contaminant level, etc.
Specify information qualityMay be qualitative
• Representativeness, comparability
or quantitative• DQI: precision, bias, accuracy, and sensitivity
Strategy for information synthesisHow will it be analyzed? AVOVA? Regression?
Optimize experimental designGet ‘good enough’ data at the lowest cost

QA in Your Future?
Intergovernmental Data Quality Task Force:Uniform Federal Policy for Implementing Environmental Quality SystemsJoint initiative between the EPA, DoD, and DOE to resolve data quality inconsistencies and/or deficiencies to ensure that:
• Environmental data are of known and documented quality and suitable for their intended uses, and
• Environmental data collection and technology programs meet stated requirements.
And don’t forget TQM, ISO9000, & Six Sigma!

A Graded Approach
The level of planning detail and documentation may:
correspond to the importance of the project to its stakeholders
• e.g. significant health risks associated.
reflect the overall scope and budget of the effort• Superfund cleanup vs. proof-of-concept research
be driven by the inherent technical complexity or the political profile of the project
• complex or politically sensitive projects generally require more documentation.

Quality Assurance Project Plan
Documentation of routine laboratory practice
ElementsA. Project Management
B. Data Generation and Acquisition
C. Assessment and Oversight
D. Data Validation and Verification

Group A. Project Management
Title PageSignature Approval SheetTable of ContentsDistribution ListProject/Task OrganizationProblem Definition/BackgroundProject/Task Description and ScheduleQuality Objectives (linked to PAC)Special Training Requirements/CertificationDocumentation and Records

Performance Criteria for Phytoremediation Project
Critical measurement
Method Reference Precision BiasComplete-
nessMDL
TPH (in soil) GC/FID EPA 3540cEPA 8015 25% 70-
130% 90% 10 mg/kg
PAH and Biomarker
GC/MS-SIM EPA 8270 25% 70-
130% 90% 150 mcg/kg
Oil-Degrader Numbers (in
soil)MPN Haines et
al., (1996)0.3 log
units NA 90% 2 MPN/g
Plant BiomassShootsRoots
Gravi-metric
Salisbury and Ross
(1985)NA NA 90% 0.1 g

Performance Criteria for Phytoremediation Project
Non- Critical measurement
Method Reference Precision BiasComplete-
nessMDL
Microbial community structure
PLFA by GC/MS
Kennedy (1994) N/A N/A 90% N/A
Plant available Ca, Mg, Cu, Zn
and Na (in soil)
Mehlich 3 ICP
Donohue (1992) 20% 90-
110% 90% 1 mg/kg
Salinity Salinity Rhoades (1996) 10% N/A 90% 1 dS/m
Acceptance criteria will be developed for published meteorological data and data generated in other studies used in the modeling for this project.

Data Quality Indicators
Bias: systematic factor causing error in one directionPrecision: agreement of repeated measures of the same quantityAccuracy: combination of precision and biasRepresentativeness: how well the sample represents the populationComparability: how well two or more datasets may be combinedCompleteness: measure of the amount of valid data to the total planned collection of data.Sensitivity: separating the signal from the noise

Accuracy
0
5
10
15
20
25
Res
po
nse

Components of Variability

Representativeness
Extremely importantNAAQS sampling next to a bus stop??
Stack gas monitoring – isokinetic sampling
Sampling plan designNumber and locations
Size and sampling method and handling• Grab vs. composite, preservation methods, etc.

Group B. Measurement/Data Acquisition
Experimental DesignSampling Methods RequirementsSample Handling and Custody RequirementsAnalytical Methods RequirementsQuality Control RequirementsInstrument/Equipment Testing, Inspection, and Maintenance RequirementsInstrument Calibration and FrequencyInspection/Acceptance Requirements for Supplies Data Acquisition Requirements (Non-direct Measurements)Data Management
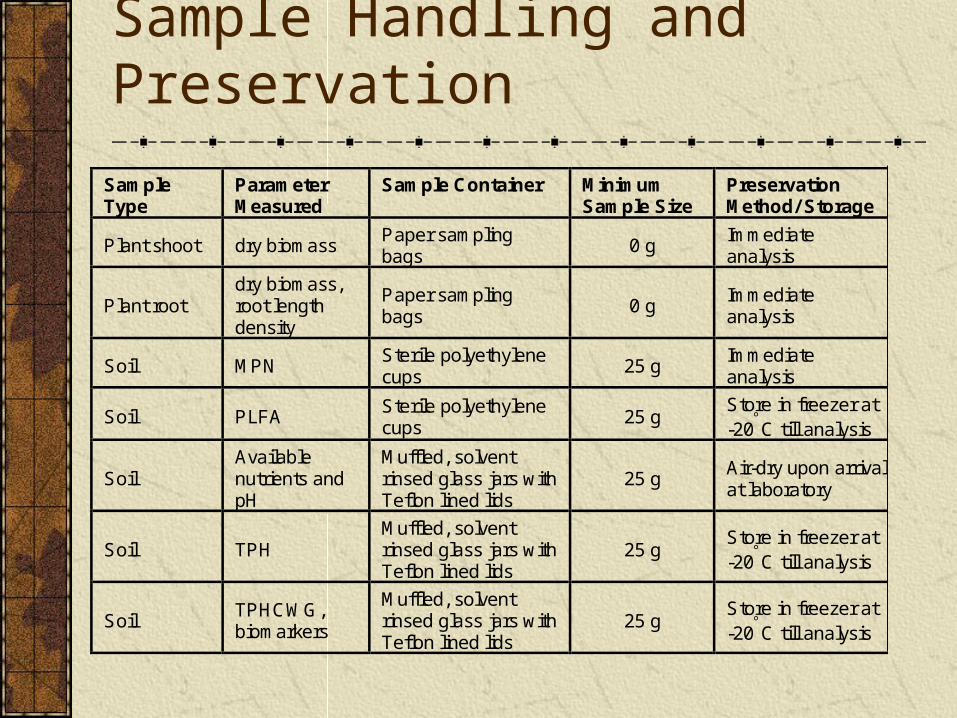
Sample Handling and Preservation
Sample Type
Parameter Measured
Sample Container Minimum Sample Size
Preservation Method/ Storage
Plant shoot dry biomass Paper sampling bags
0 g Immediate analysis
Plant root dry biomass, root length density
Paper sampling bags
0 g Immediate analysis
Soil MPN Sterile polyethylene cups
25 g Immediate analysis
Soil PLFA Sterile polyethylene cups
25 g Store in freezer at -20C till analysis
Soil Available nutrients and pH
Muffled, solvent rinsed glass jars with Teflon lined lids
25 g Air-dry upon arrival at laboratory
Soil TPH Muffled, solvent rinsed glass jars with Teflon lined lids
25 g Store in freezer at -20C till analysis
Soil TPHCWG, biomarkers
Muffled, solvent rinsed glass jars with Teflon lined lids
25 g Store in freezer at -20C till analysis

Quality Control Checks
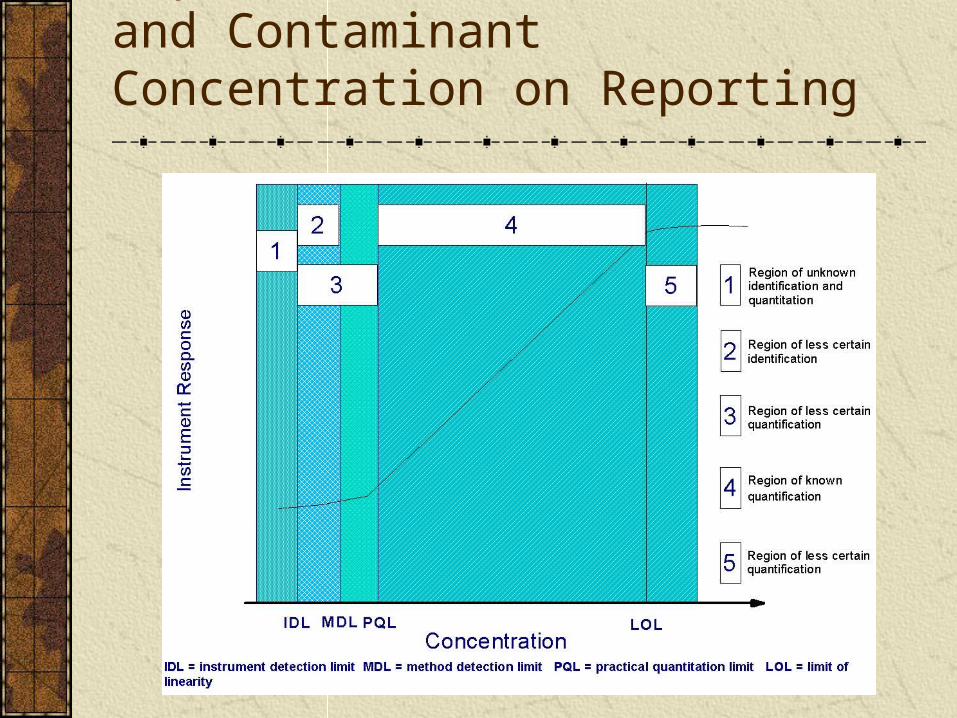
Impact of Detection Limit and Contaminant Concentration on Reporting
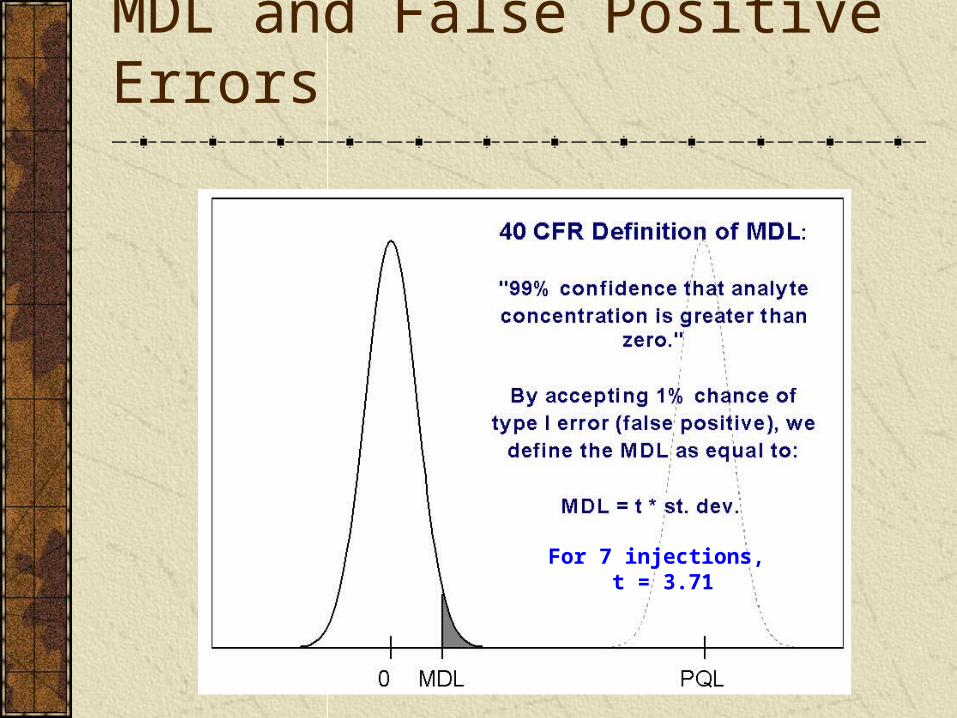
MDL and False Positive Errors
For 7 injections, t = 3.71

MDL and False Negative Errors
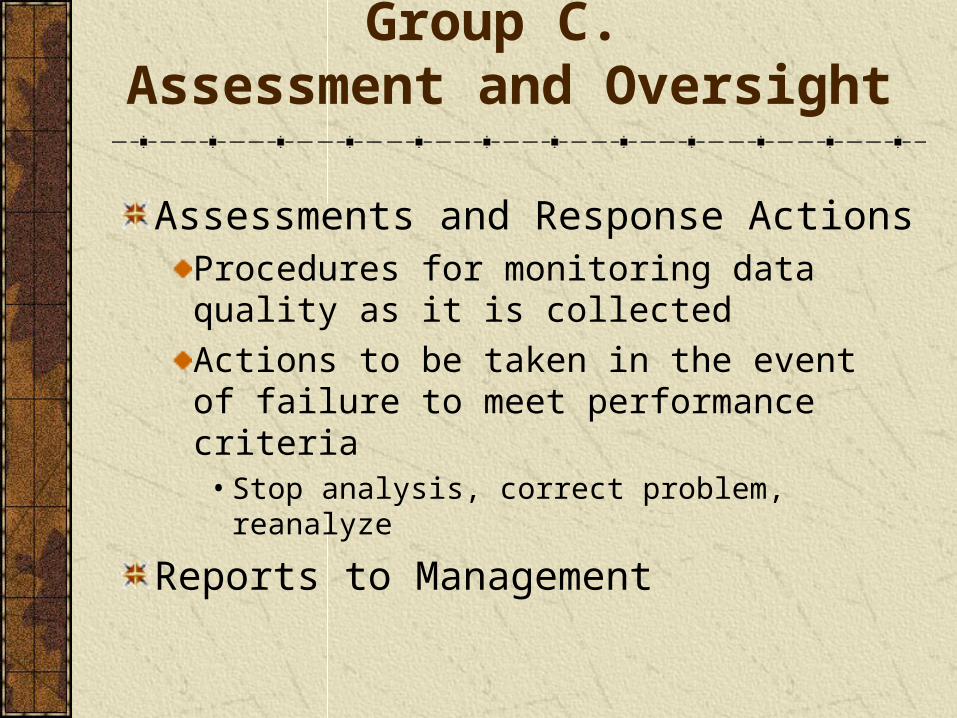
Group C. Assessment and Oversight
Assessments and Response ActionsProcedures for monitoring data quality as it is collected
Actions to be taken in the event of failure to meet performance criteria
• Stop analysis, correct problem, reanalyze
Reports to Management

Group D.Data Validation and Usability
Data review, verification, and validationReview
• Check for transcription or data reduction errors and completeness of QC information.
Verification• Were the procedures in the QAPP accurately followed?
Validation• Does the data meet the PAC specified in the QAPP?
Reconciliation with user requirementsIs the data suitable for use by decision makers?

Data Quality Assessment (DQA):
The DQA process is a quantitative processBased on statistical methods Does set of data support a particular decision with an acceptable level of confidence?
5 Steps: Review the PAC and sampling design; Conduct a preliminary data review; Select the statistical test; Verify the assumptions of the statistical test; and Draw conclusions from the data.

Example Quality Control Charts
0 10 20 30 40 50 60Sample Number
02468
101214161820
Rep
lica
te P
erce
nt D
iffe
renc
e
PYRAVGUCL
0 10 20 30 40 50 60Sample Number
0
20
40
60
80
100
120
Spi
ke P
erce
nt R
ecov
ery
PYRAVG
LCLUCL
RPD =
1 2
12 1 2
C CC C
analyte mass addedSpk SV C C
%R =

100.1 102.2
189.4
102.3 102.7
0
50
100
150
200
De
ca
ne
Co
nc
en
tra
tio
n (
pp
m)
1/1
2/0
1
2/2
3/0
1
3/1
6/0
1
4/1
/01
6/6
/01
Dat e
Surrogate Recovery Example
De
can
e r
eco
very
(%
)
100.1 102.2
189.4
102.3 102.7
0
50
100
150
200
De
ca
ne
Co
nc
en
tra
tio
n (
pp
m)
1/1
2/0
1
2/2
3/0
1
3/1
6/0
1
4/1
/01
6/6
/01
Dat e
QC batch number
A.Apblett , “Novel materials for facile separation of petroleum products from aqueous mixtures via magnetic filtration”

Benefits of Up-front Systematic Planning
Focused data requirements and optimized design for data collection;Use of clearly developed work plans for collecting data in the field; A well documented basis for data collection, evaluation, and use; Clearer statistical analysis of the final data; Sound, comprehensive QA Project Plans.

Benefits of QA
Clear lines of responsibility
Documented training and analytical competence
Standard procedures to assure data comparability
Catch and correct subtle mistakes/errors
Conclusions
Why go through the hassle & headache?QA/QC is just good science.
Documented, defensible data.
It is cheaper to do it right the first time.
Your next proposal will be better too!

Data Acquisition
Experimental DesignWill the results allow assessment of the hypothesis?
Sampling MethodsIs it representative?
How is it preserved? Transported?
Cross contamination

Data Acquisition (cont)
Analytical Measurement MethodsQuality Control
Calibration
Bias & Precision• Blanks, Duplicates, Spikes
Instrument Control
Project Management
Organization & Responsibilities
Quality Objectives & CriteriaWhat do you want to know? (Hypothesis)
What are you measuring and how ‘good’ the data needs to be.
Record KeepingLab, Field, Instrument notebooks
QA Plan for Development of Models
Project Description
Model Description - Conceptual Model
Computational Aspects
Data Source/Quality/Input‑Output
Model Validation
Model Application

Common Mistakes in MDL Determination
MiscalculationIncorrect standard deviation Incorrect degrees of freedomInsufficient replicates (need 7)
Spike out of rangeLowest standard too far from MDL
Using method based MDL w/o verification of validity for current matrix