Embed Size (px)
Citation preview

An Overview of Qualitative
and Quantitative Methods
An Overview of Qualitative
and Quantitative Methods
Jeff LazoNational Center for Atmospheric Research (NCAR)
(please don’t forget I am an economist after all)
2010 Summer WAS*IS Workshop
August 12, 2010

Social sciencesSocial sciences
• Application of the scientific process to study &
understand human cognition & behavior
– Emphasis on “process”
• Using testable theories, systematic process, and
rigorous research to answer questions about
human society
• Subjects and the theories that describe them
constantly change – unlike physical parameters,
human society is never static!
So
cia
l sc
ien
ces

Scientific
process
Scientific
process
So
cia
l sc
ien
ces
Take home point
Social sciences are true “sciences” – as are physical sciences – with theories, observations,
methods, applications – but are harder as human behavior is non-linear, dynamic, and
even “chaotic.”

Diverse disciplinesDiverse disciplines
Social science is commonly used as an umbrella term to refer to a plurality of fields outside of the natural sciences
•Anthropology
•Geography
•Communication
•Economics
•Psychology
•Political Science
•Education
•Sociology
•History
•…
So
cia
l sc
ien
ces

You’ve already heard a lot about
methods …
You’ve already heard a lot about
methods …
• Communication – Julie Demuth & Quyen Arana
• Anthropology - Jennifer Spinney & Julie Brugger
• Geography - Kenny Blumefeld & Kate Sammler
• Economics - Jeff Lazo
• Sociology - Lori Peek
• …
Methods from social sciences can be used in “non-
research” situations, discussions, and activities

Diverse methodologiesDiverse methodologies
• Direct observations
• Participatory activities
• Interviews
– Open interviews
– Semi-structured
– Structured
• Focus groups
• Document study
• Experiments
• Surveys
• Analysis of available data …
• …
So
cia
l sc
ien
ces

Features of Qualitative & Quantitative Research
Qualitative Quantitative
The aim is a complete, detailed
description.
The aim is to classify features, count
them, and construct statistical models in
an attempt to explain what is observed.
Researcher may only know roughly in
advance what he/she is looking for.
Researcher knows clearly in advance what
he/she is looking for.
Recommended during earlier phases of
research projects.
Recommended during latter phases of
research projects.
The design emerges as the study unfolds. All aspects of the study are carefully
designed before data is collected.
Researcher is the data gathering
instrument.
Researcher uses tools, such as
questionnaires or equipment to collect
numerical data.
Data is in the form of words, pictures or
objects.
Data is in the form of numbers and
statistics.
Subjective – individuals’ interpretation of
events is important ,e.g., uses participant
observation, in-depth interviews etc.
Objective seeks precise measurement &
analysis of target concepts, e.g., uses
surveys, questionnaires etc.
Qualitative data is more 'rich', time
consuming, and less able to be
generalized.
Quantitative data is more efficient, able
to test hypotheses, but may miss
contextual detail.
Researcher tends to become subjectively
immersed in the subject matter.
Researcher tends to remain objectively
separated from the subject matter.
htt
p:/
/wil
de
rdo
m.c
om
/re
sea
rch
/Qu
ali
tati
ve
Ve
rsu
sQu
an
tita
tiv
eR
ese
arc
h.h
tml

Weather Comprehension Survey(or why do methods matter?)
Weather Comprehension Survey(or why do methods matter?)
Q1 Do you know what a warning means?
� Yes
� No
But what was the respondent really THINKING?
Q1a Do you know what a warning means?
� Yes – and don’t expect me to explain my answer
� Yes - because I flipped my yes/no coin and it came up “Yes”
� Yes – because if I answer “yes” you’ll leave me alone.
� Yes – because based on that look on your face, I suspect that is the right answer.
� Yes – because if I didn’t I would probably look stupid.
� Yes – because that is the first response option
� Yes – a warning means “A warning is issued when a hazardous weather or hydrologic event is occurring, is imminent, or has a very high probability of occurring. A warning is used for conditions posing a threat to life or property ” 1
� No - because I flipped my yes/no coin and it came up “No”
� No – because it depends on what you mean by “know”
� No – because if I don’t maybe you’ll go away …
� No – because I really don’t know what a warning means . . .
1http://www.crh.noaa.gov/glossary.php?letter=w

To survey or not to survey? That is the question . . . To survey or not to survey? That is the question . . .
• Problem definition . . .
– What question am I trying to answer?
• Objective
– What information do I need?
– Who do I need it from?
– How much information do I need?
– What will I do with the information?
– How will I analyze the information?
– How and to whom will I present the results?
• Is a survey the correct method?

Different types of surveysDifferent types of surveys
• attitudinal
• behavioral
• information gathering (economic surveys)
• valuation

Advantages to surveysAdvantages to surveys• Gathering Information
– Efficient for collecting large amount of information
– Flexible to collect wide range of information
� attitudes, values, beliefs, and past behaviors.
• Questions– Standardized - relatively free from several types of errors
– Researcher can ask more complex questions
– Diminished response effect
� willing to divulge more info w/o face-to-face contact
� less likely to try to impress interviewer)
• Administration– Relatively easy to administer
� Computer-based – automatic data entry
– Economy in data collection
• Analysis– Statistical techniques to determine validity, reliability, and statistical
significance

Disadvantages to surveysDisadvantages to surveys• Gathering Information
– Questions must be general enough for all respondents
– Non-literate or illiterate populations
� only English-speaking populations
� hard-to-reach populations – “vulnerable populations”
• Questions– Can’t determine subjects’ motivation, memory, and ability to respond
– Not appropriate for studying complex social phenomena
– Subjects may not answer honestly
– No control over participant interpretation
• Administration– Low response rates
– Respondents usually self-selected
� Uncertainty about who actually filled out the questionnaire
• Analysis– Statistical techniques to determine validity, reliability, and statistical
significance

Constraints on surveysConstraints on surveys
• Regulatory constraints
– Paperwork Reduction Act / OMB
– Human Subjects / Institutional Review Board
• Costs and time resources for survey research
– natural resources damage assessment (NRDA)
– grad students and pizzas

Issues to quickly mentionIssues to quickly mention• Survey Biases
• social desirability bias• interviewer bias
• non-response bias• item non-response
• measurement bias
• hypothetical bias• information bias
• Validity - it measures what it’s supposed to measure.• face validity
• content validity• criterion validity• predictive validity
• concurrent validity• construct validity
• discriminant validity
• Reliability - yields consistent results• inter-observer• test-retest
• parallel-forms• split-half reliability

Figure 1: Survey Design and Implementation ProceduresFritz Scheuren. “What is a Survey.” http://www.amstat.org/sections/srms/pamphlet.pdf accessed 10.01.04).

Survey research –components
Survey research –components
• Survey design
• Sampling
• Implementation
• Analysis and reporting

Survey designSurvey design
Technical background
Preliminary survey design
• introduction
– tell respondents purpose of the survey
• providing information
• how to ask the correct questions
• response categories
• socio-demographic information
• de-briefing questions
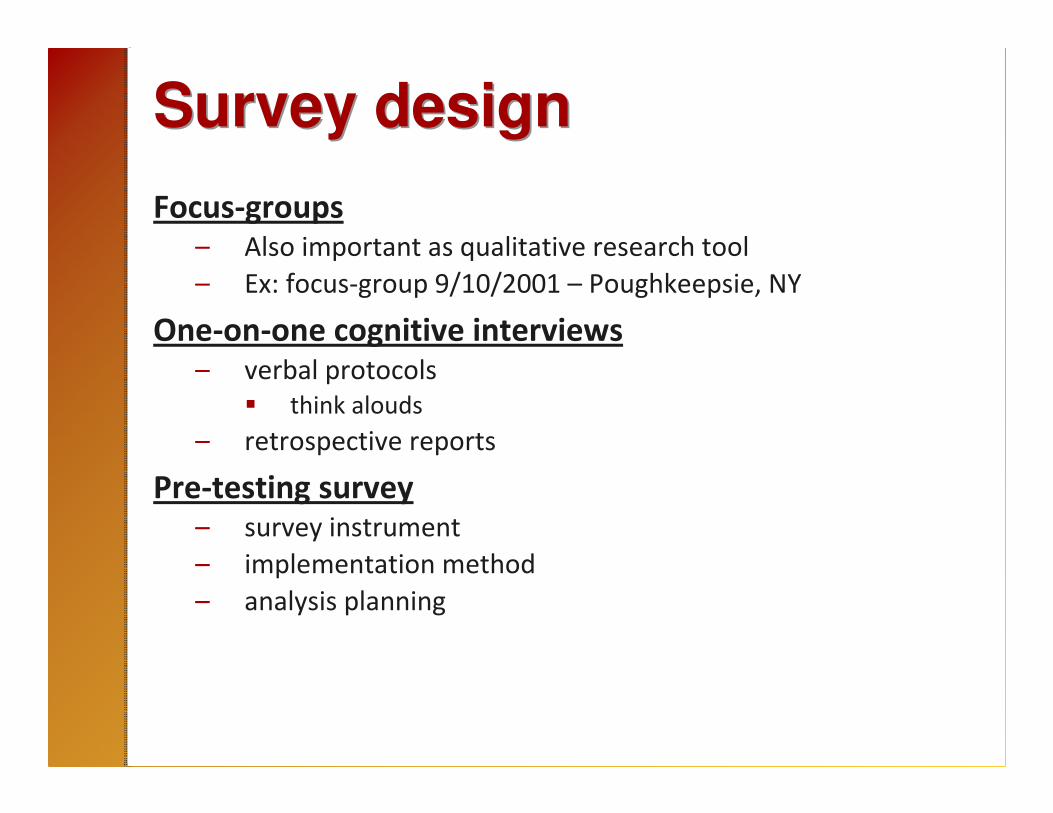
Survey designSurvey design
Focus-groups– Also important as qualitative research tool
– Ex: focus-group 9/10/2001 – Poughkeepsie, NY
One-on-one cognitive interviews– verbal protocols
� think alouds
– retrospective reports
Pre-testing survey– survey instrument
– implementation method
– analysis planning

Survey designSurvey design
• Parts of a survey
– Introduction
– Filtering questions
– Content questions
– Socio-demographic questions
– Debriefing questions
• Other considerations
– Instructions
– Formatting

Peer reviewPeer review
• Research objective . . .
• technical information
• sampling plan
• implementation plan
• formatting and presentation
• questions and survey language
– “Uncle George test”
• analysis plan

SamplingSampling
• Population, Units, Subjects and Samples– Population: entire group of people about which
information wanted.
– Units/subjects: Individual members of the population are called units
– Sample: part of population examined
• Error– Sampling: not surveying all elements of population
– Coverage: not allowing all members of the survey population to have an equal or nonzero chance of being sampled
http://www.gseis.ucla.edu/courses/ed230a2/notes2/sampling.html

SamplingSampling
• Types of Samples
– Voluntary response sample
– Convenience (accidental, haphazard) sample
– Snowball …
– Simple random sample
– Stratified random sample
– Cluster random sample
– Multistage sample design

ImplementationImplementation
methods for survey implementation– telephone
– in-person
– internet� Knowledge Networks type of access
� ResearchExec
– mixed mode – e.g., telephone/mail
– mail� the mail survey “package” – Dillman Total Design Method
(TDM)– pre-contact
– cover letter
– survey instrument
– return envelope
– incentive
– reminder post-card
– follow-up

Analysis and reportingAnalysis and reporting
• QA/QC
• response rate – AAPOR
• socio-demographics of pop / sample / respondents
• analysis methods
– content analysis
– factor analysis
– latent class variable analysis
• quantitative analysis
– summary data
– basic statistical analysis
– econometric modeling

Survey analysis (examples)Survey analysis (examples)
• Univariate analysis
– Histograms, tables, charts, etc.
– Mean, median, mode
– Range, standard deviation
• Bivariate analysis
– Crosstab/contingency tables
– Correlations (Pearson’s r, Spearman’s rho, phi, Cramers V)
• Regression analysis
– Logistic, ordinal, linear, etc.
• So much more!
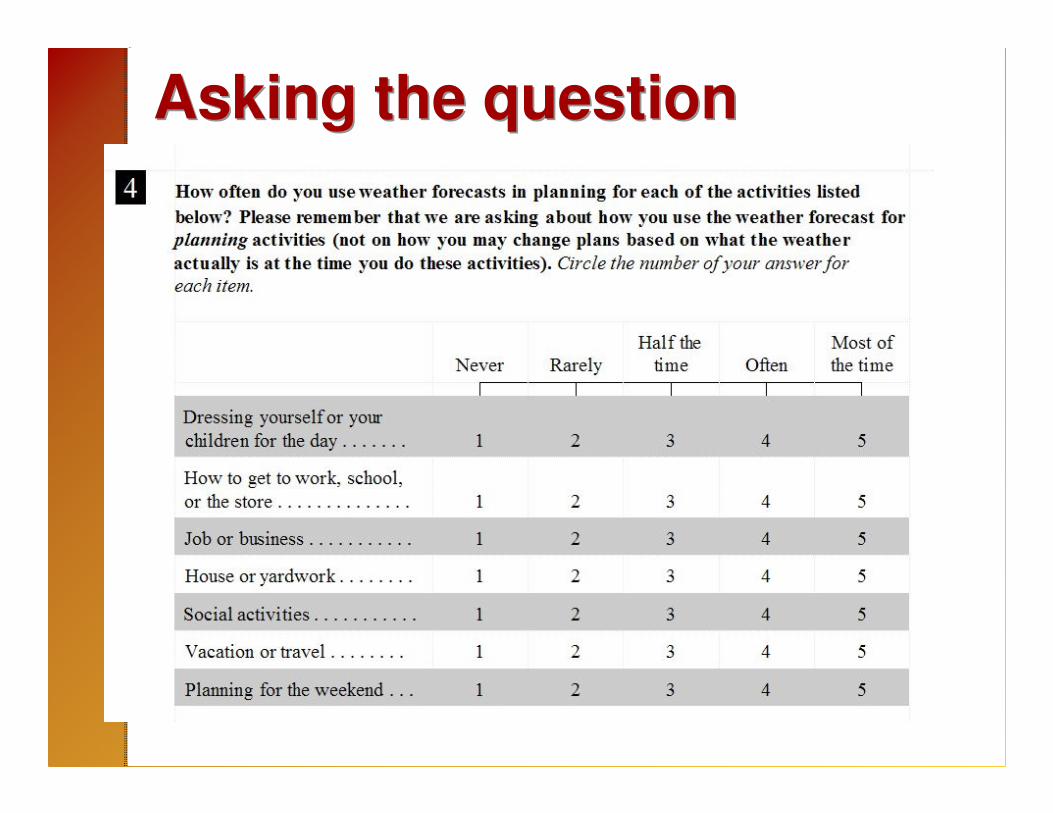
Asking the questionAsking the question

ConclusionConclusion
• Many rules
• Many resources
• Beg, borrow, and steal!
No such thing as perfect sample or survey or
study - so, sometimes better to plow ahead

Literature
• Dillman, D.A. 1999. Mail and Internet Surveys: The Tailored Design Method, 2nd Ed. John Wiley Company, New York: NY
• Ericsson, K.A. and H.A. Simon. 1993. Protocol Analysis: Verbal Reports as Data. Bradford Book, MIT Press, Cambridge, MA.
• Krueger, R. A. and M.A. Casey. 2000. Focus Groups: A Practical Guide for Applied Research. SAGE Publications
• Presser, S., J. Rothgeb, M. Couper, J. Lessler, E. Martin, J. Martin, and E. Singer. 2004. Methods for Testing and Evaluating Survey Questionnaires. New York: Wiley
• Tourangeau, R., Rips, L.J., and Rasinski, K. 2000. The Psychology of Survey Responses. Cambridge University Press.
Online resources• The American Association for Public Opinion Research:
http://www.aapor.org/
• Survey Research Center –University of California, Berkeley:
http://srcweb.berkeley.edu/index.html
• Survey Research Center –Centers of the Institute for Social Research (ISR). –
University of Michigan: http://www.isr.umich.edu/src/
• Joint Program in Survey Methodology (JPSM) –University of Maryland.
http://www.jpsm.umd.edu/jpsm/index.htm