Embed Size (px)
Citation preview
Bridging Qualitative and Quantitative Methods: APT&C – i
Proffitt Grant Proposal:
Bridging Qualitative and Quantitative Methods
in Educational Research:
Analysis of Patterns in Time and Configuration (APT&C)
Principal Investigator: Theodore W. Frick
Associate Professor and Web Director
School of Education
Indiana University Bloomington
Please note: This approach has since been renamed MAPSAT: Map & Analyze
Patterns and Structures Across Time. See https://mapsat.iu.edu
June 17, 2005
Bridging Qualitative and Quantitative Methods: APT&C – ii
Abstract
The field of education is under attack. NCLB threatens to undermine our public K-12
school system. Schools of Education are seen by K-12 principals as out of touch and lacking
curriculum rigor. The problem, in part, is due to limitations of research methodologies used
during the past century. APT&C is proposed as a mixed-mode research methodology and
software tool to help create knowledge of education that is directly linked to K-12 practice.
APT&C bridges the gap between traditional linear models in quantitative research and
qualitative research findings that lack generalizability. Empirical findings by APT&C on
patterns of practice can be used in higher education to better prepare K-12 teachers and
educational leaders for professional practice. Not only can this software be used by
educational researchers, but also by practitioners. K-12 administrators can use it to help
redesign school systems. K-12 teachers can use it as a learning tool for students to see the
impact of organization choices and teaching strategies to optimize learning.
I propose to extend 32 years of my previous research with APT to further develop
software tools, so that both temporal processes and organizational structures in education
can be understood and used for making practical decisions. Like epidemiological
research in medicine, APT&C and tools can be used to create research from which
practical decisions flow. While epidemiological research does not prove that smoking
causes lung cancer, the results for heavy smokers support a health decision to refrain
from smoking. Likewise, APT&C can be used to frame research at every level of
education.
A PDF version of this proposal with active hyperlinks to important bibliographic references and
software tool examples listed in this proposal is available at:
http://education.indiana.edu/~frick/proposals/apt&c2005proffitt.pdf .
Bridging Qualitative and Quantitative Methods: APT&C – 1
Bridging Qualitative and Quantitative Methods in Educational Research:
Analysis of Patterns in Time and Configuration (APT&C)
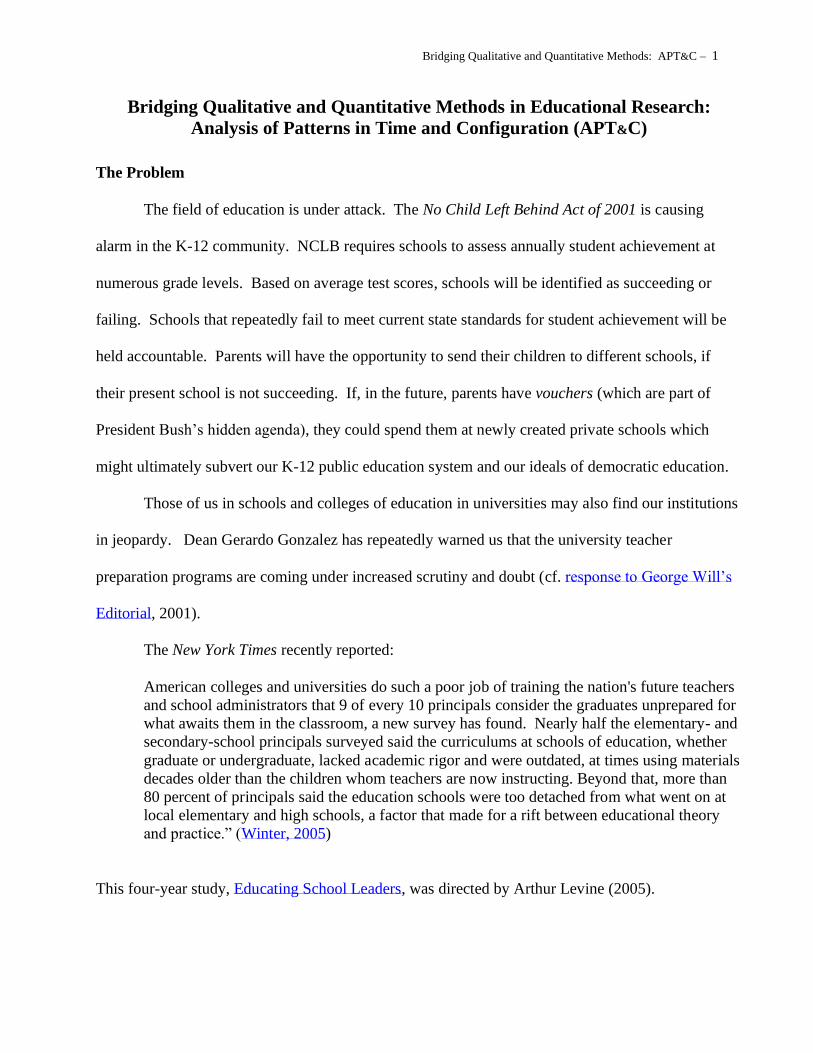
The Problem
The field of education is under attack. The No Child Left Behind Act of 2001 is causing
alarm in the K-12 community. NCLB requires schools to assess annually student achievement at
numerous grade levels. Based on average test scores, schools will be identified as succeeding or
failing. Schools that repeatedly fail to meet current state standards for student achievement will be
held accountable. Parents will have the opportunity to send their children to different schools, if
their present school is not succeeding. If, in the future, parents have vouchers (which are part of
President Bush’s hidden agenda), they could spend them at newly created private schools which
might ultimately subvert our K-12 public education system and our ideals of democratic education.
Those of us in schools and colleges of education in universities may also find our institutions
in jeopardy. Dean Gerardo Gonzalez has repeatedly warned us that the university teacher
preparation programs are coming under increased scrutiny and doubt (cf. response to George Will’s
Editorial, 2001).
The New York Times recently reported:
American colleges and universities do such a poor job of training the nation's future teachers
and school administrators that 9 of every 10 principals consider the graduates unprepared for
what awaits them in the classroom, a new survey has found. Nearly half the elementary- and
secondary-school principals surveyed said the curriculums at schools of education, whether
graduate or undergraduate, lacked academic rigor and were outdated, at times using materials
decades older than the children whom teachers are now instructing. Beyond that, more than
80 percent of principals said the education schools were too detached from what went on at
local elementary and high schools, a factor that made for a rift between educational theory
and practice.” (Winter, 2005)
This four-year study, Educating School Leaders, was directed by Arthur Levine (2005).
Bridging Qualitative and Quantitative Methods: APT&C – 2
Further evidence of the problem is the reaction of federal funding agencies. Recent policy
changes have been influenced by the likes of arguments by Shavelson and Towne in Scientific
Research in Education (2002). “Randomized trials” and “what works” have become rallying cries
for those seeking accountability in educational research.
How did we get into this predicament? Part of the problem, I believe, is due to limitations of
research methodologies that educational researchers have used. These limitations, in turn, have
impeded the development of generalizable knowledge of education that can be directly linked to
practice. The intensity of debates between quantitative and qualitative research methodologists
during the latter part of the 20th century is symptomatic of the dilemma that well-intentioned and
competent researchers face.
Background of the Problem
Research methods in education used for much of the 20th century were largely quantitative
methods. Experimental and quasi-experimental designs were commonplace (e.g., Campbell &
Stanley, 1966), and analytical techniques included ANOVA, regression analysis and their extensions
(i.e., discriminate, factor, canonical and path analysis). The basic problem is that this general linear
models approach seldom yielded findings that could be directly linked to educational practice.
Within-group and within-person variance was often large, typically obfuscating differences between
groups that could be attributed to so-called treatments, practices or programs (Medley, 1977; 1979;
Frick & Semmel, 1978). Cronbach & Snow (1977) further extended ANOVA to deal with aptitude-
treatment interactions (ATI), with hopes of reducing the within-group variance. But this, too, was
seldom successful in yielding significant results.
Egon Guba, an education professor at Indiana University, and others began to explore
alternative approaches in the 1970s and 80s that later became known as qualitative and case study

Bridging Qualitative and Quantitative Methods: APT&C – 3
methodology (cf. Guba & Lincoln, 1985; Merriam, 1997; Stake, 1995; Yin, 2003). Qualitative
methods have become widely used in educational research in the past two decades. One clear
advantage of qualitative methods is “thick description,” as Guba called it. Rich details of individual
cases can give readers helpful insight into and understanding of the educational phenomena
investigated. The unavoidable dilemma that often accompanies this approach is lack of justification
for generalizability of findings. When samples are purposive and small, generalizability in the sense
of making inferences from sample to population is seriously compromised. Indeed, respected books
on qualitative methods avoid the term ‘generalizability’ and instead employ the notion of ‘transfer’ –
i.e., results of what was found in this particular investigation may transfer to other similar situations
the reader encounters (cf. Merriam, 1997).
To the great dismay of many researchers who use qualitative methods, the pendulum has
swung back to an emphasis on funding research that would be expected, on the surface at least, to
create reliable and generalizable knowledge of education (cf., Shavelson & Town, 2002). There is
no good reason to believe that history will not repeat itself here – the inescapable problem is within-
group and within-person variance. Human behavior is purposive and difficult to predict using such
deterministic methods (linear models approach).
A Middle Ground: Analysis of Patterns in Time (APT)
In the early 1970s, I experienced firsthand the limitations of the linear models approach for
creating knowledge about education (cf. Semmel & Frick, 1985). At the same time, I was first
introduced to general systems theory, particularly through the SIGGS theory model (Maccia &
Maccia, 1966). Out of this experience grew an analytic-measurement procedure that I created, later
called Analysis of Patterns in Time (APT). This was, and still is, a paradigm shift in thinking for
quantitative methodologists steeped in the linear models tradition and the measurement theory it
Bridging Qualitative and Quantitative Methods: APT&C – 4
depends on (cf. Kuhn, 1962). The fundamental difference is that the linear models approach relates
independent measures through a mathematical function and treats deviation as error variance,
but APT measures a relation directly by counting occurrences of when a temporal pattern is true
or false in observational data. Linear models relate the measures; APT measures the relation. The
difference is subtle, but significant, as I emphasized in a seminal article on APT published in AERJ
in 1990. Clearly APT has value in classroom observational research and also for computer adaptive
mastery testing (EXSPRT). Some of my doctoral students have since used APT in their research
(e.g., An, 2003; Yin, 1998; Wang, 1996; Luk, 1994; Plew, 1989). Over the past decade, I have used
APT concepts in usability evaluation for Web design.
APT is well explicated in Frick (1990; 1983). As an example of conclusions when using
APT: In an observational study of mildly handicapped children in elementary school Rieth and
Frick (1982) found that, regardless of classroom context, when direct instruction was occurring these
students were engaged on average about 97 percent of the time. In the absence of direct instruction,
their engagement was about 57 percent. In other words, such students were 13 times more likely to
be off-task during non-direct instruction. This kind of APT finding is similar to epidemiological
findings in medicine. For example, heavy cigarette smokers are 5-10 times more likely to have lung
cancer later in their lives (Kumar, et al., 2005), and if they quit smoking the likelihood decreases.
While causal conclusions cannot be made in the absence of controlled experiments, nonetheless one
can make practical decisions based on such epidemiological evidence. We can do likewise with
APT.
The best example of use of APT was done in a study of mode errors in human-computer
interfaces by An (2003). Hers, and also the Yin (1998) study, show the value of the merging of
qualitative methods and quantification via APT. An (2003) investigated conditions of mode errors
Bridging Qualitative and Quantitative Methods: APT&C – 5
when people use modern software. Software has a ‘mode’ if the same user action does one thing in
one context and different thing in another – e.g., pressing the ‘d’ key echoes the letter ‘d’ but it also
deletes a file. She videotaped 18 people using three different typical software products: a word
processor, graphics program and an address book. They were asked to do the same authentic tasks
and to think aloud (e.g., insert a different header in MS Word). Stimulated recall interviews were
conducted immediately afterwards to clarify why participants took certain actions during the
usability evaluations. After conducting a content analysis of these qualitative data, three major
conditions for mode errors became evident.
An used qualitative methods initially because she did not know what conditions of mode
errors would emerge. Then once those became clear, she was able to develop a coding system in a
manner that would then allow quantification of patterns through APT. She found, for example, that
when users did the right action but got the wrong result, the source of user error was often software
interface elements that lacked affordance (functionality that is not obvious). This frequently resulted
in users being unable to find a software function that was hidden from view, or they thought they did
the task correctly only to find out later they had not (false success). She concluded that when these
conditions for modes occurred, software users were unsuccessful 67 percent of time in tasks they
were trying to do. This was one of many practical APT findings that have direct implication for how
we design computer interfaces for humans to use successfully.
This kind of mixed method approach to research was also used by Jacob Kounin (1970)
when studying classroom group management. A qualitative analysis of videotapes from 80
elementary classrooms led to identification of patterns of behavior. He discovered that teachers who
were ‘with-it’ had classrooms with much higher student engagement rates. Teachers who were not
‘with-it’ made targeting and timing errors in dealing with classroom behavior problems, and there
Bridging Qualitative and Quantitative Methods: APT&C – 6
was much more student off-task behavior in their classes. He then devised an observation system in
order to code the videotapes and to subsequently quantify his findings that allowed generalization.
Kounin’s research helped to identify patterns of practice that teachers could use in their classrooms.
Although I had not formalized APT at that time, Kounin was essentially doing APT.
An (2003), Yin (1998) and others could only do APT by manually coding data, counting
pattern occurrences by hand, and by estimating likelihoods on pocket calculators, since modern APT
software does not exist. Yet these studies have demonstrated the practical value of mixed
methodologies where one first uses qualitative methods for gaining understanding of patterns and
relationships, and then uses APT to code and quantify those relationships in a manner that is useful
to practitioners for making decisions based on APT predictions.
Most important, if a researcher selects a sample which is large enough and representative of
the population, then generalizability of findings about patterns is possible. APT thus addresses
limitations of typical qualitative research which lacks generalizability. If a proper sampling strategy
is used, inductive inferences from sample to population can be made from APT findings – without
being bound by the constraints of linear models in quantitative research.
Extending APT to Analysis of Configurations: APT&C
Thompson (2004) noted that APT could be extended to characterize structure or
configuration of educational systems. In our ongoing co-development of an educational systems
theory we have identified a need for measurement procedures for empirical verification of theorems
which contain structural properties such as centralization, wholeness, compactness, passive
dependence, and hierarchical order. When I formally defined APT (Frick, 1983), it allowed us to
characterize and count occurrences of temporal processes in education. Based on recent research,
we believe that we can extend APT to measure and analyze configurations in education. Configural
Bridging Qualitative and Quantitative Methods: APT&C – 7
patterns characterize structures in education – i.e., how education is organized, or relations between
parts and whole.
In the late fall, 2004, a group of IST doctoral students in my R690 class examined extant
research in education for verifying 14 theorems in our partially developed educational systems
theory. They did an extensive literature review and found empirical support for 12 of the 14
theorems (these were listed in the Proffitt proposal rejected last fall, but we did not have those data
at the time the proposal was written. See
http://www.indiana.edu/~tedfrick/est/verification14theorems.pdf). These students noted that we
need better methods of measurement for validating these theorems when conducting new studies.
They could not use APT in their study since the original data were not collected in an APT
framework. They could not use APT&C, because it has not been developed, nor were original data
collected in such a framework.
APT Software and Instruction Need to Be Developed
I initially developed and programmed APT software in BASIC for TRS-80 and Apple II
microcomputers (Frick, 1980; 1981). While these highly complex programs still actually work, they
can only be run on an IBM PC compatible computer in DOS mode (not in Windows or on a Mac),
and the interface is primitive by today’s standards (e.g., no mouse, no graphics – i.e., not GUI). I
propose to bring the APT software up to today’s interface standards and computing environments
(i.e., Web, server-side PHP, Flash, ActionScript and XML technologies). The software modules
will include the following:
Define: Create, save and modify one’s own observation systems (i.e., classifications and
categories for coding).
Bridging Qualitative and Quantitative Methods: APT&C – 8
Code: Enter, store and modify observational data using the classifications and categories
defined. Temporal aspects of data are automatically stored with each event entry (i.e., date/time
stamps), so that temporal configuration of the data is preserved.
Convey: Display temporal data for observations as events “riding on parallel conveyer
belts” which move in the direction of time through a scrolling window – to help with visual
identification of temporal patterns.
List Files: Display names of files containing definitions of observation systems, and names
of data files coded with those observation systems. One or more files can be selected by clicking on
them. The files then become input to other programs such as Convey and Analyze.
Analyze: Specify a temporal pattern using “If…then…then….?” query syntax, with
classification and category names defined earlier, and with optional Boolean operators (and, or, not)
– e.g., see table of query results from An (in Appendix A). Alternatively, one could highlight and
select an instance of the pattern from the “conveyor view” to form a query. This module will report
FLDPT results (frequency, likelihood, duration and proportion time) for the temporal pattern for
each observational data file (case) selected. It will compute means and standard deviations for these
FLDPT results when multiple files (cases) are selected. As a further option it will export FLDPT
results in spreadsheet format for further analysis in other programs (e.g., SPSS, EXCEL). This
module will be the most challenging to re-develop – due to its highly complex, recursive, pattern-
matching algorithms.
Help: An online help system will be included which explains APT and provides short
tutorials which demonstrate how to use it.
I have extensive background in computer software development for complex statistical
algorithms (e.g., CAT, EXSPRT, IRT, Bayesian reasoning, maximum likelihood, amortization –
Bridging Qualitative and Quantitative Methods: APT&C – 9
e.g., Frick 2001; 2005) and have programmed in a number of different languages over the past three
decades, including FORTRAN-V, BASIC, C, DAL, TenCORE, ToolBook, and PHP. As Web
Director for the School of Education, I have extensive experience in user-centered design and
usability testing to improve a product’s usefulness. Our highly successful Website is visited by
millions of people annually (Frick, Su & An, 2005). This combination of expertise in computer
programming, interface design, and usability evaluation puts me in a unique position to revise and
further develop the APT software described above – with some assistance from a GA with
programming and design skills. I expect this inquiry-based design process to result in a software
product that will be useful to educational researchers, easy to use, and that will allow them to
conduct research with APT that will have clear and understandable implications for educational
practice in K-12. In other words, you won’t need to be a statistician to use and understand APT, nor
to interpret the findings. As part of the development process, I plan to include School of Education
faculty in usability evaluations of APT software and subsequently to conduct workshops for faculty
and graduate students near the end of the first year.
Extending APT to APT&C and Development of Further Software
As mentioned above, APT will be extended to APT&C in order to characterize, measure and
analyze structural patterns in educational phenomena. These are technically ‘affect relations’ as
defined by Thompson. “Affect relations determine the structure of the system by the connectedness
of the components. This is important since structure provides the basis for predicting system
behavior.” (Thompson, in press 2005, p. 6). We are concerned with systems that contain a large
population – e.g., education systems, corporations – we are not trying to predict what someone will
do tomorrow afternoon. During Year 2, I propose to develop APT&C software that will allow
educational researchers to define affect relation sets, to enter empirical observations into affect

Bridging Qualitative and Quantitative Methods: APT&C – 10
relation matrices that characterize configuration. APT&C will report results from measures of
properties of affect relation sets (e.g., centralization, hierarchical order, compactness, vulnerability,
etc.).
Thompson will work on the theoretical foundations during Year 1, applying his expertise in
general systems theory, logic, set theory and topology. During the second year, I will do the
computer programming with assistance of a GA and with the consulting from Thompson to confirm
the computational accuracy and logical validity. I expect to use the same user-centered design and
development process described above.
Benefits of this Research and Development
• APT&C bridges the gap between qualitative and quantitative research methodologies; overcomes
problems of generalizability often encountered in qualitative research with small sample sizes or
in case studies; and provides findings that practitioners can understand and apply in their
classrooms.
• APT&C empirical findings on patterns of practice can be used in programs in higher education to
better prepare K-12 teachers and educational leaders for professional practice.
• APT&C software can be licensed and bring money to IU and the School of Education. I expect
this software to be in demand by scholars who conduct observational research in K-12 settings.
It will be a powerful research tool for studying processes and structure in education, and will run
on laptop computers. APT&C can also be used by school administrators and teachers.
Administrators can use it to redesign efficient school systems. Teachers can use it as a learning
tool for students to see the impact of organization and teaching strategies to optimize learning.
• APT&C software will constitute core technologies for simulating and modeling educational
systems, as part of the larger SimEd research and development program (Frick, 2004).
Bridging Qualitative and Quantitative Methods: APT&C – 11
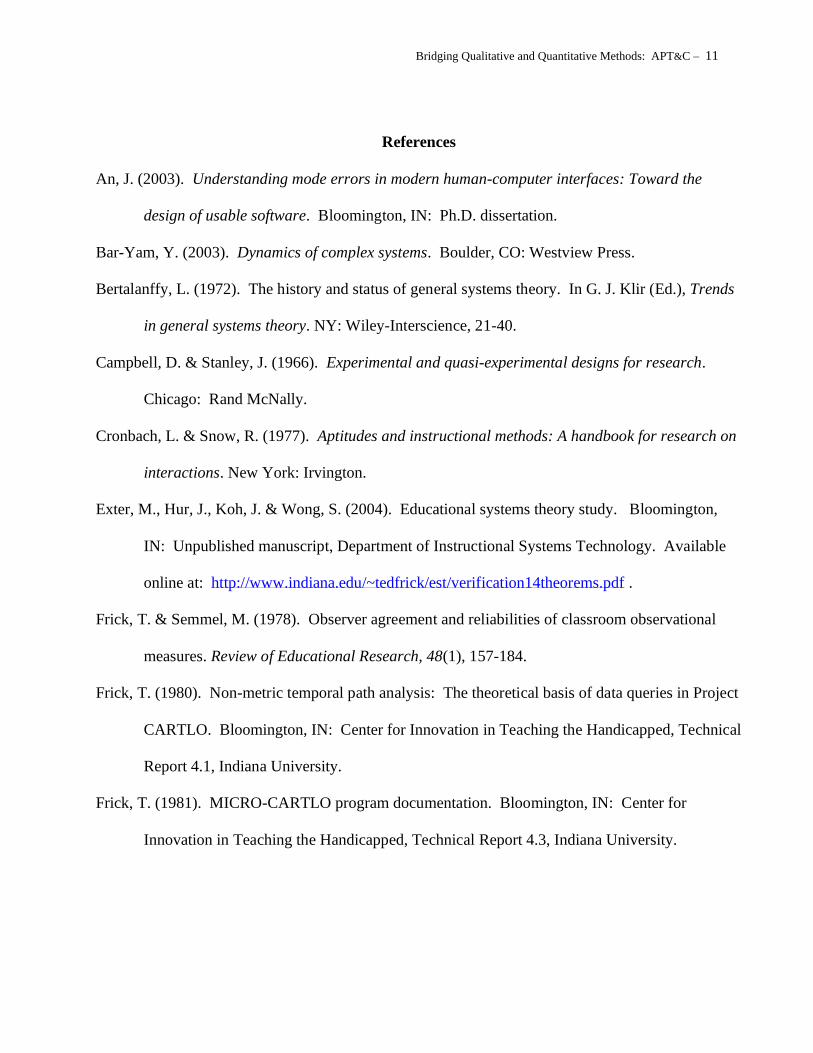
References
An, J. (2003). Understanding mode errors in modern human-computer interfaces: Toward the
design of usable software. Bloomington, IN: Ph.D. dissertation.
Bar-Yam, Y. (2003). Dynamics of complex systems. Boulder, CO: Westview Press.
Bertalanffy, L. (1972). The history and status of general systems theory. In G. J. Klir (Ed.), Trends
in general systems theory. NY: Wiley-Interscience, 21-40.
Campbell, D. & Stanley, J. (1966). Experimental and quasi-experimental designs for research.
Chicago: Rand McNally.
Cronbach, L. & Snow, R. (1977). Aptitudes and instructional methods: A handbook for research on
interactions. New York: Irvington.
Exter, M., Hur, J., Koh, J. & Wong, S. (2004). Educational systems theory study. Bloomington,
IN: Unpublished manuscript, Department of Instructional Systems Technology. Available
online at: http://www.indiana.edu/~tedfrick/est/verification14theorems.pdf .
Frick, T. & Semmel, M. (1978). Observer agreement and reliabilities of classroom observational
measures. Review of Educational Research, 48(1), 157-184.
Frick, T. (1980). Non-metric temporal path analysis: The theoretical basis of data queries in Project
CARTLO. Bloomington, IN: Center for Innovation in Teaching the Handicapped, Technical
Report 4.1, Indiana University.
Frick, T. (1981). MICRO-CARTLO program documentation. Bloomington, IN: Center for
Innovation in Teaching the Handicapped, Technical Report 4.3, Indiana University.

Bridging Qualitative and Quantitative Methods: APT&C – 12
Frick, T. (1983). Non-metric temporal path analysis: An alternative to the linear models approach
for verification of stochastic educational relations. Bloomington, IN: Ph.D. dissertation.
Available online: http://www.indiana.edu/~tedfrick/ntpa/ .
Frick, T. (1990). Analysis of patterns in time: A method of recording and quantifying temporal
relations in education. American Educational Research Journal, 27(1), 180-204. Available
online: http://www.indiana.edu/~tedfrick/apt/aerj.pdf .
Frick, T. (1992). Computerized adaptive mastery tests as expert systems. Journal of Educational
Computing Research, 8(2), 187-213. Available online:
http://www.indiana.edu/%7Etedfrick/cat/exsprt92.pdf .
Frick, T. (2001). Loan amortization program. Bloomington, IN: School of Education, Indiana
University. Available online: http://www.indiana.edu/~tedfrick/loan.html .
Frick, T. (2004). Understanding systemic change in education through SimEd. Bloomington, IN:
Indiana University, School of Education. Available online:
http://www.indiana.edu/~tedfrick/proposals/SimEd.html .
Frick, T. (2005). Web tool for sequential Bayesian decision making. Bloomington, IN: School of
Education, Indiana University. Available online:
http://www.indiana.edu/~tedfrick/decide/start.html .
Frick, T., Su, B. & An, Y-J. (2005). Building a large, successful Website on a shoestring: A decade
of progress. Submitted to TechTrends (under review). Available online:
http://www.indiana.edu/~tedfrick/techtrends/edwebfinal.pdf .
Gonzalez, G. (2001). Teachers are receiving rigorous professional preparation at IU (Guest
Editorial). Bloomington, IN: Herald Times, Feb. 26, 2001. Available online:
Bridging Qualitative and Quantitative Methods: APT&C – 13
http://www.heraldtimesonline.com/stories/2001/02/26/digitalcity.010226_HT_A6_SLB4333
0.sto?lin .
Guba, E. & Lincoln, Y. (1985). Naturalistic inquiry. Newbury Park, CA: Sage.
Kounin, J. (1970). Discipline and group management in classrooms. Huntington, NY: R. E.
Krieger.
Kuhn, T. (1962). The structure of scientific revolutions. Chicago: University of Chicago Press.
Kumar, V., Abbas, A., Fausto, N., (2005). Robbins and Cotran pathologic basis of disease (7th
edition). Philadelphia: Elsevier/Saunders.
Levine, A. (2005). Educating school leaders. NY: Columbia University Teachers College, The
Education Schools Project. Available online: http://www.edschools.org/pdf/Final313.pdf .
Luk, H. (1994). Computer adaptive tests: a comparison of item response theoretic and normative
expert systems approaches. Bloomington, IN: Ph.D. dissertation.
Maccia, E.S. & Maccia, G.S. (1966). Development of educational theory derived from three theory
models. Washington, DC: U.S. Office of Education, Project No. 5-0638.
Medley, D. (1977). Teacher competence and teacher effectiveness: A review of process-product
research. Washington, DC: American Association of Colleges for Teacher Education.
Medley, D. (1979). The effectiveness of teachers. In P. L. Peterson & H. Walberg (Eds), Research
in Teaching: Concepts, Findings, and Implications. Berkeley, CA: McCutchan, 11-27.
Merriam, S. (1997). Qualitative research and case study applications in education. San Francisco:
Jossey Bass.
No child left behind (2001, NCLB Act signed into law by President George W. Bush on Jan. 8,
2002). Available online at: http://www.ed.gov/nclb/landing.jhtml .
Bridging Qualitative and Quantitative Methods: APT&C – 14
Plew, G. T. (1989). An empirical investigation of major adaptive testing methodologies and an
expert systems approach. Bloomington, IN: Ph.D. dissertation.
Rieth, H. & Frick, T. (1982). An analysis of academic learning time (ALT) of mildly handicapped
students in special education service delivery systems. Initial report on classroom process
variables. Bloomington, IN: Center for Innovation in Teaching the Handicapped, Indiana
University.
Semmel, M. & Frick, T. (1985). Learner competence in school. In Kaufman, M., Agard, J., and
Semmel, M. (Eds.), Mainstreaming: Learners and their environments. Cambridge, MA:
Brookline Books, 99-150.
Shavelson, R. & Towne, L. (2002). Scientific research in education. Washington, DC: National
Academy Press.
Stake, R. (1995). The art of case study research. Thousand Oaks, CA: Sage.
Thompson, K. (2004). A-GSBT: Axiomatic-general systems behavioral theory. Available online:
http://www.raven58technologies.com/index.html (retrieved Nov. 5, 2004).
Thompson, K. (in press, 2005). “General system” defined for predictive technologies of A-GSBT
(Axiomatic-General Systems Behavioral Theory). Scientific Inquiry Journal.
Wang, K. (1996). Computerized adaptive testing: a comparison of item response theoretic
approach and expert systems approaches in polychotomous grading. Bloomington, IN:
Ph.D. dissertation.
Winter, G. (2005). Study finds poor performance by nation's education schools. NY: New York
Times, March 15, 2005.
Wolfram, S. (2002). A new kind of science. Champaign, IL: Wolfram Media, Inc.

Bridging Qualitative and Quantitative Methods: APT&C – 15
Yin, L.C. (1998). Dynamic learning patterns during individualized instruction. Bloomington, IN:
Ph.D. dissertation.
Yin, R. (2003). Case study research: Design and methods. Thousand Oaks, CA: Sage.

Bridging Qualitative and Quantitative Methods: APT&C – 16
*Budget Notes and Justification
The primary consultant is Kenneth Thompson. He is the head researcher of Raven58
Technologies, located in Columbus, Ohio. His expertise is in general systems theory, logic
(sentential and predicate calculus), mathematics (set theory, di-graph theory, and topology) and
education (systems and organization). His role during Year 1 will be to develop the important
theoretical foundations for the &C part of APT&C. He will be applying concepts from set, di-graph
and topological theories in mathematics and from axiomatic-general systems behavioral theory (A-
GSBT) in order to build the quantitative measures of configuration required by APT&C, which
include: complexity, hierarchical order, compactness, centralization, active dependence, passive
dependence, independence, interdependence, strongness, unilateralness, weakness, disconnectivity,
wholeness, integration, segregation, homomorphism, isomorphism, automorphism, and vulnerability.
Thompson’s role during Year 2 will be to refine these measures as we attempt to write
computer software to carry them out and to help ensure the logical validity and accuracy of software
computational algorithms.
A graduate assistant with expertise in computer programming in Flash ActionScript and
human-computer interface design will be needed. While I will be the lead programmer, the GA will
carry out significant software development and quality assurance testing. The GA will be needed for
both Years 1 and 2.
Bridging Qualitative and Quantitative Methods: APT&C – 17
Timeline
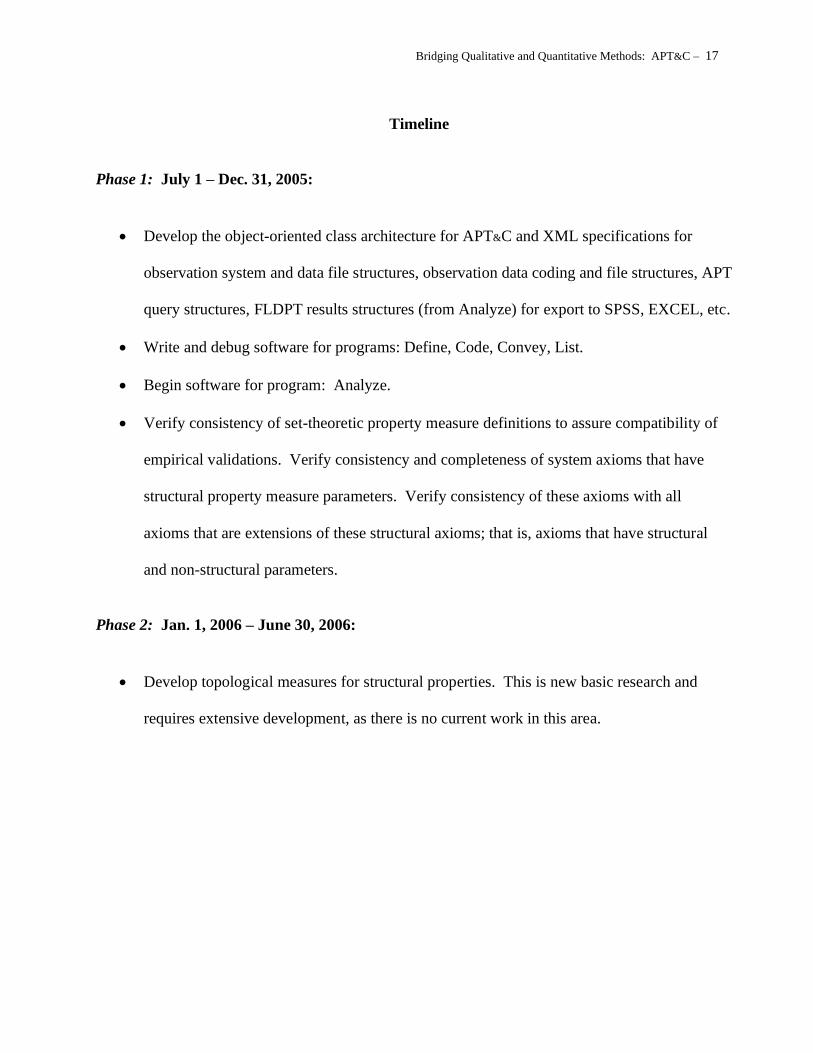
Phase 1: July 1 – Dec. 31, 2005:
• Develop the object-oriented class architecture for APT&C and XML specifications for
observation system and data file structures, observation data coding and file structures, APT
query structures, FLDPT results structures (from Analyze) for export to SPSS, EXCEL, etc.
• Write and debug software for programs: Define, Code, Convey, List.
• Begin software for program: Analyze.
• Verify consistency of set-theoretic property measure definitions to assure compatibility of
empirical validations. Verify consistency and completeness of system axioms that have
structural property measure parameters. Verify consistency of these axioms with all
axioms that are extensions of these structural axioms; that is, axioms that have structural
and non-structural parameters.
Phase 2: Jan. 1, 2006 – June 30, 2006:
• Develop topological measures for structural properties. This is new basic research and
requires extensive development, as there is no current work in this area.

Bridging Qualitative and Quantitative Methods: APT&C – 18
• Continue writing and testing software for program: Analyze.
• Write software for program: Help (including online tutorials).
• Perform quality assurance tests of software.
• Conduct usability evaluations of APT with School of Education faculty and graduate
students.
• Conduct workshops on APT for SoE faculty and graduate students.
Phase 3: July 1, 2006 – December 31, 2006:
• Continue development of topological measures. Define various topological properties as
required and verify consistency with other system properties, extending the properties as
required. Begin validation of measures.
• Write and debug software for &C measures: complexity, hierarchical order, compactness,
centralization, active dependence, passive dependence, independence, interdependence,
strongness, unilateralness, weakness, disconnectivity, wholeness, integration, segregation,
homomorphism, isomorphism, automorphism, and vulnerability.
Phase 4: Jan. 1, 2007 – June 30, 2007:
• Continue to validate topological measures and define decision procedures for application
to empirical systems.
• Finish writing and quality assurance testing of software for &C measures.
• Conduct usability evaluations of APT with School of Education faculty and graduate
students
• Conduct workshops on APT for SoE faculty and graduate students.

Bridging Qualitative and Quantitative Methods: APT&C – 19
Other Proffitt Grants
Elizabeth Boling (PI), Kennon Smith, Malinda Eccarius, and Ted Frick. Visual
Representations to Support Learning: Effectiveness of Graphical Elements Used to Extend the
Meaning of Instructional Illustrations. (Award amount: $39,864.00, funded from June 2003 - June
2005.) This grant is funded by the Proffitt Foundation. Elizabeth Boling is the principal
investigator. My role is minor, mostly to assist with research methodology issues such as reliability
of measurement and statistical analysis. The project is making good progress. Data on
interpretation of meanings of graphical elements from different populations and cultures have been
collected and analyzed. Several conference presentations have been made, a paper submitted for
publication, and further populations are currently being compared.
Other Grant Support and Pending Proposals
At this time, I have no grant support for the research proposed here, and no pending
proposals.
Bridging Qualitative and Quantitative Methods: APT&C – 20
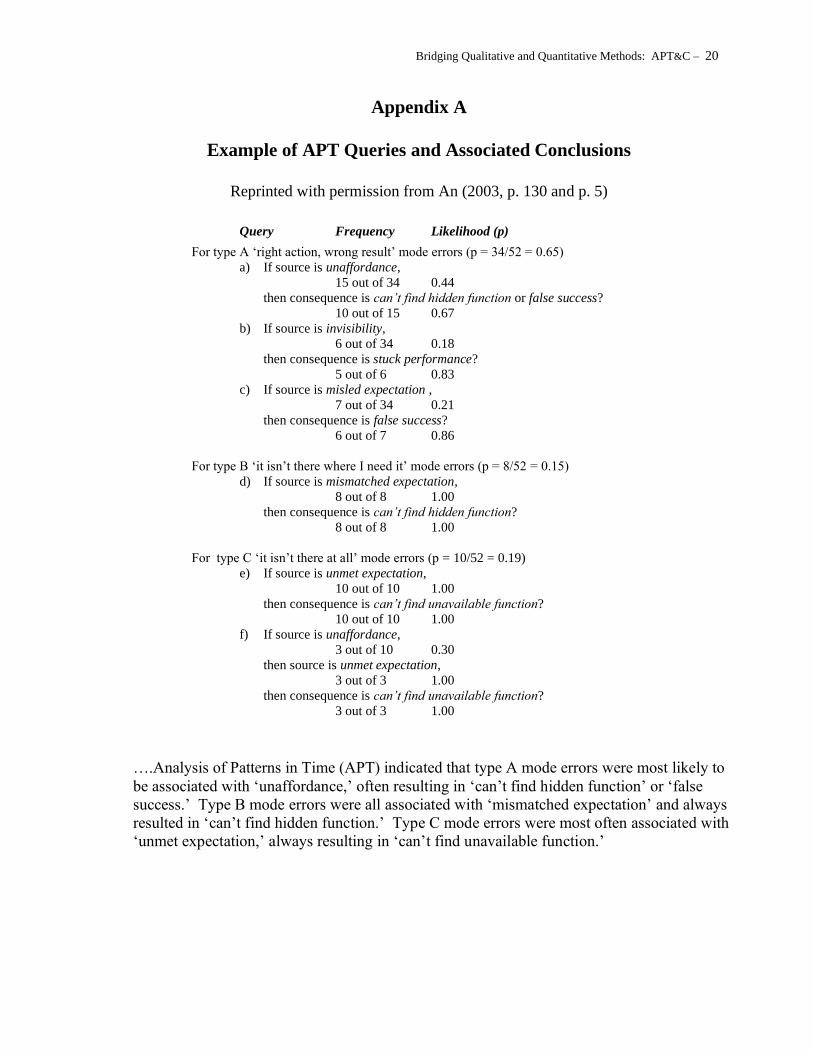
Appendix A
Example of APT Queries and Associated Conclusions
Reprinted with permission from An (2003, p. 130 and p. 5)
Query Frequency Likelihood (p)
For type A ‘right action, wrong result’ mode errors (p = 34/52 = 0.65)
a) If source is unaffordance,
15 out of 34 0.44
then consequence is can’t find hidden function or false success?
10 out of 15 0.67
b) If source is invisibility,
6 out of 34 0.18
then consequence is stuck performance?
5 out of 6 0.83
c) If source is misled expectation ,
7 out of 34 0.21
then consequence is false success?
6 out of 7 0.86
For type B ‘it isn’t there where I need it’ mode errors (p = 8/52 = 0.15)
d) If source is mismatched expectation,
8 out of 8 1.00
then consequence is can’t find hidden function?
8 out of 8 1.00
For type C ‘it isn’t there at all’ mode errors (p = 10/52 = 0.19)
e) If source is unmet expectation,
10 out of 10 1.00
then consequence is can’t find unavailable function?
10 out of 10 1.00
f) If source is unaffordance,
3 out of 10 0.30
then source is unmet expectation,
3 out of 3 1.00
then consequence is can’t find unavailable function?
3 out of 3 1.00
….Analysis of Patterns in Time (APT) indicated that type A mode errors were most likely to
be associated with ‘unaffordance,’ often resulting in ‘can’t find hidden function’ or ‘false
success.’ Type B mode errors were all associated with ‘mismatched expectation’ and always
resulted in ‘can’t find hidden function.’ Type C mode errors were most often associated with
‘unmet expectation,’ always resulting in ‘can’t find unavailable function.’