Embed Size (px)
Citation preview

BREAKER PAGE /
DIVIDER
The breaker page can be used
to split up your presentation in
sections, and more.
CHANGE PICTURE
• Right click on the picture
• Choose Change picture
• Browse to find and insert
a new picture
CHANGE SLIDE
LAYOUT
Go to Home Menu
– click on Layout and select
between predefined layouts Q4 REPORT
J O A C I M L I N D O F F, C E O & R E I N H A R D M AY E R , C F O
J A N U A R Y 2 6 , 2 0 1 7

BREAKER PAGE /
DIVIDER
The breaker page can be used
to split up your presentation in
sections, and more.
CHANGE PICTURE
• Right click on the picture
• Choose Change picture
• Browse to find and insert
a new picture
CHANGE SLIDE
LAYOUT
Go to Home Menu
– click on Layout and select
between predefined layouts
OVERVIEW
GENERAL BUSINESS J O A C I M L I N D O F F, C E O

BREAKER PAGE /
DIVIDER
The breaker page can be used
to split up your presentation in
sections, and more.
CHANGE PICTURE
• Right click on the picture
• Choose Change picture
• Browse to find and insert
a new picture
CHANGE SLIDE
LAYOUT
Go to Home Menu
– click on Layout and select
between predefined layouts
• Organic top line growth: Order intake: -1.1%; Net sales: -2.3%
• Gross margin: -1.1 pp due to unfavorable product and country mix
• Efficiency enhancements: saved SEK 140-150 M in Q4 due to Big 5
• EBITA-growth*: +2.6% to SEK 1,970 M (1,920)
• Restructuring cost: SEK 321 M (174)
• Strong Cash Flow from operations: + 20% to SEK 1,783 M and Cash Conversion increased to
80.4%
• FDA update: New governance model for sites under Consent Decree – enhancing remediation
progress and level of control
• Distribution of Patient & Post-Acute Care: Progress according to plan
• Proposed dividend per share: SEK 2.00 (2.80)
Q4 IN BRIEF E B I TA * C O N T I N U I N G T O G R O W
*Before restructuring, acquisition and integration costs 3

BREAKER PAGE /
DIVIDER
The breaker page can be used
to split up your presentation in
sections, and more.
CHANGE PICTURE
• Right click on the picture
• Choose Change picture
• Browse to find and insert
a new picture
CHANGE SLIDE
LAYOUT
Go to Home Menu
– click on Layout and select
between predefined layouts
• Organic order intake -1.1%
• Weak performance in SW and EMEA
• ACT +5.4% PPAC +1.4%, SW -9.2%
• APAC +5.5%, Americas +2.4%, EMEA -6.9 %
• Organic net sales -2.3%
• Affected by SW and negative order intake growth in Q3 (-3.2%)
• ACT +2.5%, PPAC -0.9%, SW -7.2%
• EMEA -0.8%, APAC -1.0%, Americas -4.8%
TOP LINE DEVELOPMENT N E T S A L E S A F F E C T E D B Y W E A K O R D E R I N TA K E I N Q 3
* Before restructuring, acquisition and integration
costs
4

BREAKER PAGE /
DIVIDER
The breaker page can be used
to split up your presentation in
sections, and more.
CHANGE PICTURE
• Right click on the picture
• Choose Change picture
• Browse to find and insert
a new picture
CHANGE SLIDE
LAYOUT
Go to Home Menu
– click on Layout and select
between predefined layouts
Q 4 Q4
2 0 16 2015
EM EA 1 4 6 2 1 6 7 2 -14,6% 5 4 3 5 5 7 12 -3,3%
A m ericas 7 6 9 7 9 8 -8,0% 2 7 9 6 2 9 6 4 -6,3%
A P A C 7 5 6 6 9 7 2,4% 2 4 12 2 3 3 7 1,3%
S urg ic a l wo rk f lo ws 2 9 8 7 3 16 7 - 9 ,2 % 10 6 4 3 11 0 13 - 3 ,1%
* Adjusted for currency, acquisit ions and divestments
YTD
2015 %*O rde r In t a k e , e xt e rna l %*
Y T D
2 0 16
• Organic order intake: -9.2%
• Infection Control and Integrated Workflow
Solutions did not meet strong Q4 2015
• APAC grew slightly while EMEA and
Americas showed significant decrease
• Organic net sales: -7.2%
• Infection Control and Integrated Workflow
Solutions driving the decline, mitigated by
strong delivery from Life Science
• All regions reported a decline, most
significant in Americas
• Gross profit -11.5% and EBITA* -7.7%
• Higher restructuring costs: Write-offs of
intangible assets and on-going transformation
• A plan to reignite growth has been activated
• Several product launches in 2017
Q4 BCU UPDATE – SURGICAL WORKFLOWS W E A K T O P L I N E D E V E L O P M E N T C O M PA R E D T O S T R O N G Q 4 2 0 1 5
* Before restructuring, acquisition and integration costs
Q 4 2 0 16 Q4 2015 Y T D 2 0 16 YTD 2015
S e gm e nt O v e rv ie w, m S E K % %
Order Intake, external 2 9 8 7 3 167 -5,7% 10 6 4 3 11 013 -3,4%
N et Sales , external 3 7 9 4 3 982 -4,7% 10 4 9 6 10 891 -3,6%
C o st o f Go o ds /Serv ices so ld - 2 3 5 1 -2 351 0,0% - 6 5 3 5 -6 663 1,9%
G ro s s P ro f it 1 4 4 3 1 6 3 1 - 11,5 % 3 9 6 1 4 2 2 8 - 6 ,3 %
Gro ss m argin, % 3 8 ,0 % 41,0% -3,0% 3 7 ,7 % 38,8% -1,1%
EB ITA befo re res truc turing-,
integrat io n and acquis it io n co s ts 7 5 2 815 -7,7% 1 2 8 3 1 233 4,1%
EB ITA m argin, % 19 ,8 % 20,5% -0,7% 12 ,2 % 11,3% 0,9%
R estruc turing-, integrat io n and
acquis it io n co s ts - 12 6 - 59 -113,6% - 2 5 5 - 151 -68,9%
E B IT 6 19 749 - 17 ,4 % 1 0 0 1 1 054 - 5 ,0 %
EB IT m argin, % 16 ,3 % 18,8% -2,5% 9 ,5 % 9,7% -0,2%
S urg ic a l W o rk f lo ws S urg ic a l W o rk f lo ws
5

BREAKER PAGE /
DIVIDER
The breaker page can be used
to split up your presentation in
sections, and more.
CHANGE PICTURE
• Right click on the picture
• Choose Change picture
• Browse to find and insert
a new picture
CHANGE SLIDE
LAYOUT
Go to Home Menu
– click on Layout and select
between predefined layouts
Q 4 Q4
2 0 16 2015
EM EA 1 0 0 9 9 6 3 2,3% 3 6 5 4 3 6 15 2,3%
A m ericas 1 7 3 6 1 5 4 8 5,7% 6 2 0 0 5 9 5 7 3,0%
A P A C 7 4 7 6 4 4 9,3% 2 2 0 5 2 0 6 5 4,7%
A c ut e C a re T he ra p ie s 3 4 9 2 3 15 5 5 ,4 % 12 0 5 9 11 6 3 7 3 ,1%
* Adjusted for currency, acquisit ions and divestments
O rde r In t a k e , e xt e rna l %*
Y T D
2 0 16
YTD
2015 %*
Q 4 2 0 16 Q4 2015 Y T D 2 0 16 YTD 2015
S e gm e nt O v e rv ie w, m S E K % %
Order Intake, external 3 4 9 2 3 155 10,7% 12 0 5 9 11 637 3,6%
N et Sales , external 3 6 4 9 3 402 7,3% 11 8 0 4 11 577 2,0%
C o st o f Go o ds /Serv ices so ld - 1 6 5 9 -1 506 -10,2% - 5 2 5 2 -5 149 -2,0%
G ro s s P ro f it 1 9 9 0 1 8 9 6 5 ,0 % 6 5 5 2 6 4 2 8 1,9 %
Gro ss m argin, % 5 4 ,5 % 55,7% -1,2% 5 5 ,5 % 55,5% 0,0%
EB ITA befo re res truc turing-,
integrat io n and acquis it io n co s ts 9 2 3 825 11,9% 2 3 2 6 2 276 2,2%
EB ITA m argin, % 2 5 ,3 % 24,3% 1,0% 19 ,7 % 19,7% 0,0%
R estruc turing-, integrat io n and
acquis it io n co s ts - 6 5 - 79 17,7% - 7 5 9 - 331 -129,3%
E B IT 7 0 4 5 9 5 18 ,3 % 1 0 0 0 1 3 4 6 - 2 5 ,7 %
EB IT m argin, % 19 ,3 % 17,5% 1,8% 8 ,5 % 11,6% -3,1%
A c ut e C a re T he ra p ie s A c ut e C a re T he ra p ie s• Organic order intake: +5,4 %
• Strong performance in Cardiopulmonary
and Vascular Interventions
• Organic net sales: +2,5 %
• Cardiac Surgery and Vascular
Interventions demonstrate strong growth
• All regions increased order intake & net sales
• Gross margin declined 1.2 pp
• Due to low margin deals for Ventilators in
EMEA
• EBITA*-growth of 11.9%
• EBITA*-margin up 1.0 pp to 25.3%
Q4 BCU UPDATE – ACUTE CARE THERAPIES B R O A D G R O W T H P U S H E D T H E E B I TA * - M A R G I N I N T H E R I G H T D I R E C T I O N
* Before restructuring, acquisition and integration costs 6

BREAKER PAGE /
DIVIDER
The breaker page can be used
to split up your presentation in
sections, and more.
CHANGE PICTURE
• Right click on the picture
• Choose Change picture
• Browse to find and insert
a new picture
CHANGE SLIDE
LAYOUT
Go to Home Menu
– click on Layout and select
between predefined layouts
Q 4 Q4
2 0 16 2015
EM EA 1 0 0 0 9 7 4 -2,8% 3 6 5 4 3 7 6 5 -1,1%
A m ericas 8 5 6 8 0 6 6,4% 2 9 4 2 3 0 5 4 -3,6%
A P A C 2 4 7 2 2 4 3,7% 8 4 4 9 6 2 -11,7%
P a t ie n t & P o s t - A c ut e
C a re 2 10 3 2 0 0 4 1,4 % 7 4 4 0 7 7 8 1 - 3 ,4 %
* Adjusted for currency, acquisit ions and divestments
O rde r In t a k e , e xt e rna l %*
Y T D
2 0 16
YTD
2015 %*
• Organic order intake: +1.4 %
• Strong development of Capital Goods,
driven by good performance in Americas
and APAC.
• EMEA affected negatively by weak
performance in Hygiene and Medical Beds
• Organic net sales: -0.9%
• A mixed picture with weak performance in
Hygiene and Medical Beds and strong
performance in several other segments
• Decline in APAC and EMEA while
Americas increased its organic net sales
• Gross Profit: +3.5%
• EBITA*: +3.5%
Q4 BCU UPDATE – PATIENT & POST-ACUTE CARE G R O W T H I N O R G A N I C O R D E R I N TA K E
* Before restructuring, acquisition and integration costs
Q 4 2 0 16 Q4 2015 Y T D 2 0 16 YTD 2015
S e gm e nt O v e rv ie w, m S E K % %
Order Intake, external 2 10 3 2 004 4,9% 7 4 4 0 7 781 -4,4%
N et Sales , external 2 0 8 0 2 033 2,3% 7 4 5 6 7 767 -4,0%
C o st o f Go o ds /Serv ices so ld - 1 12 6 -1 111 -1,4% - 4 12 9 -4 260 3,1%
G ro s s P ro f it 9 5 4 9 2 2 3 ,5 % 3 3 2 7 3 5 0 7 - 5 ,1%
Gro ss m argin, % 4 5 ,9 % 45,4% 0,5% 4 4 ,6 % 45,2% -0,6%
EB ITA befo re res truc turing-,
integrat io n and acquis it io n co s ts 3 6 0 348 3,5% 9 5 6 889 7,5%
EB ITA m argin, % 17 ,3 % 17,1% 0,2% 12 ,8 % 11,4% 1,4%
R estruc turing-, integrat io n and
acquis it io n co s ts - 112 - 33 - 16 5 - 184 10,3%
E B IT 2 12 2 8 2 - 2 4 ,8 % 6 6 5 5 7 3 16 ,1%
EB IT m argin, % 10 ,2 % 13,9% -3,7% 8 ,9 % 7,4% 1,5%
P a t ie n t & P o s t - A c ut e P a t ie n t & P o s t - A c ut e
7

BREAKER PAGE /
DIVIDER
The breaker page can be used
to split up your presentation in
sections, and more.
CHANGE PICTURE
• Right click on the picture
• Choose Change picture
• Browse to find and insert
a new picture
CHANGE SLIDE
LAYOUT
Go to Home Menu
– click on Layout and select
between predefined layouts
• Utilized approximately SEK 70 M in Q4
• New governance model for entities
covered by the Consent Decree
• To enhance control and to meet time
schedule in remediation
• Management reporting directly to Getinge
Executive Team
FDA & REMEDIATION UPDATE I M P R O V E M E N T M E A S U R E S C O N T I N U E S
Background: The Consent Decree
• Signed between Maquet and FDA in February
2015
• Legal agreement entered into voluntarily
• Focusing on completing required
improvements
• 4 legal entities covered by the CD
• The Consent Decree consists of 3 phases
• All Getinge sites are in phase 1
• An ongoing dialogue with the FDA
• Annual inspections
• Accordingly, we cannot rule out additional
requirements, sanctions or costs
• We will provide an update when we have new
material information
8

BREAKER PAGE /
DIVIDER
The breaker page can be used
to split up your presentation in
sections, and more.
CHANGE PICTURE
• Right click on the picture
• Choose Change picture
• Browse to find and insert
a new picture
CHANGE SLIDE
LAYOUT
Go to Home Menu
– click on Layout and select
between predefined layouts
• Progress in line with plan in a structured process
• Executive Team appointed and effective from April 1st
• Internal recruitments except for CFO
• Financial targets and strategy being reviewed
• Patient & Post-Acute Care
• The New Getinge
• Presented when the preparation of the proposal to the shareholders is finished
UPDATE ON PROPOSED SPIN-OFF M O V I N G F O R W A R D A H E A D O F P L A N
9
BREAKER PAGE /
DIVIDER
The breaker page can be used
to split up your presentation in
sections, and more.
CHANGE PICTURE
• Right click on the picture
• Choose Change picture
• Browse to find and insert
a new picture
CHANGE SLIDE
LAYOUT
Go to Home Menu
– click on Layout and select
between predefined layouts
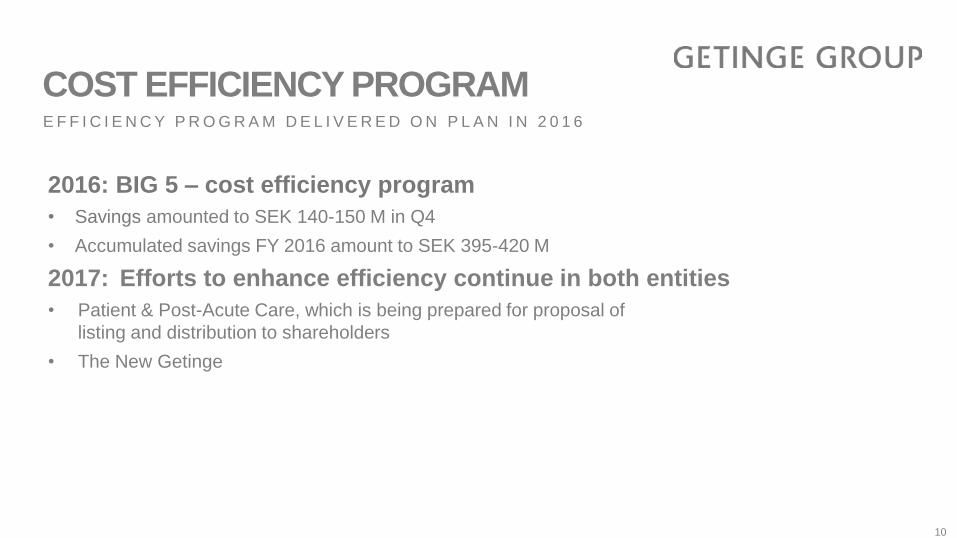
2016: BIG 5 – cost efficiency program
• Savings amounted to SEK 140-150 M in Q4
• Accumulated savings FY 2016 amount to SEK 395-420 M
2017: Efforts to enhance efficiency continue in both entities
• Patient & Post-Acute Care, which is being prepared for proposal of
listing and distribution to shareholders
• The New Getinge
COST EFFICIENCY PROGRAM E F F I C I E N C Y P R O G R A M D E L I V E R E D O N P L A N I N 2 0 1 6
10

BREAKER PAGE /
DIVIDER
The breaker page can be used
to split up your presentation in
sections, and more.
CHANGE PICTURE
• Right click on the picture
• Choose Change picture
• Browse to find and insert
a new picture
CHANGE SLIDE
LAYOUT
Go to Home Menu
– click on Layout and select
between predefined layouts
A large number of launches
• Important launches in 2016 bringing positive effects in 2017
• A large pipeline for 2017, especially within Surgical Workflows
• Long term plan for the value segment
R&D spending in future growth
• Increase our total R&D investments going forward
• Focus on R&D in areas of strength
R&D AND LAUNCHES IN 2017 F O C U S E D R & D F O R L O N G T E R M P R O F I TA B L E G R O W T H
11

BREAKER PAGE /
DIVIDER
The breaker page can be used
to split up your presentation in
sections, and more.
CHANGE PICTURE
• Right click on the picture
• Choose Change picture
• Browse to find and insert
a new picture
CHANGE SLIDE
LAYOUT
Go to Home Menu
– click on Layout and select
between predefined layouts
OVERVIEW
FINANCIALS R E I N H A R D M AY E R , C F O

BREAKER PAGE /
DIVIDER
The breaker page can be used
to split up your presentation in
sections, and more.
CHANGE PICTURE
• Right click on the picture
• Choose Change picture
• Browse to find and insert
a new picture
CHANGE SLIDE
LAYOUT
Go to Home Menu
– click on Layout and select
between predefined layouts Results

BREAKER PAGE /
DIVIDER
The breaker page can be used
to split up your presentation in
sections, and more.
CHANGE PICTURE
• Right click on the picture
• Choose Change picture
• Browse to find and insert
a new picture
CHANGE SLIDE
LAYOUT
Go to Home Menu
– click on Layout and select
between predefined layouts
Q 4 Q4
2 0 16 2015
EM EA 3 4 7 1 3 609 -6,9% 12 7 4 3 13 092 -1,1%
A m ericas 3 3 6 1 3 152 2,4% 11 9 3 8 11 975 -1,0%
A P A C 1 7 5 0 1 565 5,5% 5 4 6 1 5 364 0,2%
G ro up T o t a l 8 5 8 2 8 3 2 6 - 1,1% 3 0 14 2 3 0 4 3 1 - 0 ,8 %
* Adjusted for currency, acquisit ions and divestments
O rde r In t a k e , e xt e rna l %*
Y T D
2 0 16
YTD
2015 %*
SEK M
Q 4
2 0 16
Q4
2015
C hange
%
Y T D
2 0 16
YTD
2015 C hange %
Order intake, SEK M 8 5 8 2 8 326 3,1% 3 0 14 2 30 431 -1,0%
Organic -1,1% -0,8%
FX-effec ts 3,9 pp -0,2pp
A cquis it io ns / dives tm ents 0,3 pp 0,0 pp
N et Sales 9 5 2 3 9 417 1,1% 2 9 7 5 6 30 235 -1,6%
Organic -2,3% -1,5%
FX-effec ts 3,1 pp -0,2pp
A cquis it io ns / dives tm ents 0,3 pp -0,1 pp
Gro ss M argin, % 4 6 ,1 47,2 -1,1 4 6 ,5 46,8 -0,3
Selling expenses (in % o f net sales) 17 ,0 17,2 -0,2 2 1,0 21,8 -0,8
A dm in expenses (in % o f net sales) 9 ,1 8,2 0,9 11,3 10,9 0,4
EB ITA *, SEK M 1 9 7 0 1 920 2,6% 4 3 4 1 4 179 3,9%
EB ITA * m argin, % 2 0 ,7 20,4 0,3 14 ,6 13,8 0,8
* Before restructuring-, integrat ion
and acquisit ion costs
Order intake organically
• Slight decline in the quarter and for the FY
Net sales organically
• Decline in Q4, due to weak order intake in Q3
• FY affected by decline in Q3-Q4
Gross margin
• Declined in Q4 due to product mix and regional
S&A – admin expenses increased in Q4 • Mainly due to strengthening of the Quality
Organization
• Adjusted for currency effects S&A was flat
(0.2%) compared to Q4 2015
• Operating expenses declined 3.9% in Q4 and
4.9% FY 2016
EBITA*-growth
• Q4: 2.6 % and the margin increased to 20.7 %
• FY: 3.9 % and the margin increased to 14.6 %
PERFORMANCE C O N T I N U E D C O S T R E D U C T I O N S
* Before restructuring, acquisition and integration costs 14

BREAKER PAGE /
DIVIDER
The breaker page can be used
to split up your presentation in
sections, and more.
CHANGE PICTURE
• Right click on the picture
• Choose Change picture
• Browse to find and insert
a new picture
CHANGE SLIDE
LAYOUT
Go to Home Menu
– click on Layout and select
between predefined layouts
RESTRUCTURING & INTEGRATION COSTS M A I N LY N O N C A S H R E L AT E D I N Q 4
Q4
Write-down, intangible assets SEK 170 M
Other restructuring and integration costs SEK 151 M
Total SEK 321 M
Reported FY 2016 restructuring costs SEK 1,313 M
15

BREAKER PAGE /
DIVIDER
The breaker page can be used
to split up your presentation in
sections, and more.
CHANGE PICTURE
• Right click on the picture
• Choose Change picture
• Browse to find and insert
a new picture
CHANGE SLIDE
LAYOUT
Go to Home Menu
– click on Layout and select
between predefined layouts
FX EFFECTS N E G AT I V E E X C H A N G E R AT E E F F E C T S I N Q 4
Negative effects in the quarter
• Exchange-rate effects had a
negative impact of SEK 20 M on
EBITA* in the quarter, of which
transaction effects accounted for
SEK -14 M and translation effects for
SEK -6 M
Positive full year effects
• Currency transaction effects had a
positive impact of approximately
SEK 106 M (273) on the Group’s
2016 earnings
Outlook transaction effects FY17
• Approximately SEK 200 M on the
Group’s earnings
* Before restructuring, acquisition and integration costs
M SEK
T ra ns a c t io n
e f f e c t
T ra ns la t io n
e f f e c t T o t a l
Gro ss P ro fit - 14 96 82
EB ITA * - 14 - 6 - 20
EB IT - 14 - 12 - 26
16

BREAKER PAGE /
DIVIDER
The breaker page can be used
to split up your presentation in
sections, and more.
CHANGE PICTURE
• Right click on the picture
• Choose Change picture
• Browse to find and insert
a new picture
CHANGE SLIDE
LAYOUT
Go to Home Menu
– click on Layout and select
between predefined layouts Balance Sheet

BREAKER PAGE /
DIVIDER
The breaker page can be used
to split up your presentation in
sections, and more.
CHANGE PICTURE
• Right click on the picture
• Choose Change picture
• Browse to find and insert
a new picture
CHANGE SLIDE
LAYOUT
Go to Home Menu
– click on Layout and select
between predefined layouts
A s s e t s ,
M SEK
2 0 16
3 1- D e c
2015
31-D ec
Intangible assets 3 2 0 0 4 30 543
Tangible f ixed assets 4 3 13 4 699
F inanc ial f ixed assets 1 3 2 9 1 374
Invento ry 5 4 3 1 5 409
A cco unts receivable 8 15 9 7 470
Other current receivables 2 2 9 5 2 272
C ash and cash equivalents 1 6 8 0 1 468
T o t a l a s s e t s 5 5 2 11 5 3 2 3 5
S h a re ho ld e rs ' e q u it y & l ia b il it ie s ,
M SEK
2 0 16
3 1- D e c
2015
31-D ec
Shareho lders ' equity 2 0 9 16 19 593
P ens io n pro v is io n 3 3 6 8 3 052
Other interes t bearing liabilit ies 2 1 7 0 1 21 283
Other pro v is io ns 1 8 5 6 2 243
A cco unts payable 2 2 0 1 1 986
Other no n interets -bearing liabilit ies 5 16 9 5 078
T o t a l e qu it y & l ia b il it ie s 5 5 2 11 5 3 2 3 5
BALANCE SHEET F O C U S O N N E T D E B T D E V E L O P M E N T
• Net debt development
• Adjusted change in net debt for the period
decreased to SEK 1,359 M
• Net debt to equity ratio
• Decrease 4.9 pp to 111.8 %
• Net debt to EBITDA before restructuring
• Leveraging from 3.89 to 3.88 for the period
C ha nge in ne t de b t ,
m SEK
2 0 16
3 1- D e c
2015
31-D ec
C hange in net debt 5 2 1 326
C urrency effec t - 1 3 8 8 - 581
A cquis it io ns /D ives tm ents - 2 12 261
A ctuarial gains / lo sses pens io ns , gro ss - 2 8 0 - 23
A djus t e d c ha nge in ne t de b t - 1 3 5 9 - 17
N et debt to equity rat io 111,8 % 116,7%
N et debt to EB ITD A befo re res truc turing 3 ,8 8 3,89
18

BREAKER PAGE /
DIVIDER
The breaker page can be used
to split up your presentation in
sections, and more.
CHANGE PICTURE
• Right click on the picture
• Choose Change picture
• Browse to find and insert
a new picture
CHANGE SLIDE
LAYOUT
Go to Home Menu
– click on Layout and select
between predefined layouts Cash Flow
BREAKER PAGE /
DIVIDER
The breaker page can be used
to split up your presentation in
sections, and more.
CHANGE PICTURE
• Right click on the picture
• Choose Change picture
• Browse to find and insert
a new picture
CHANGE SLIDE
LAYOUT
Go to Home Menu
– click on Layout and select
between predefined layouts
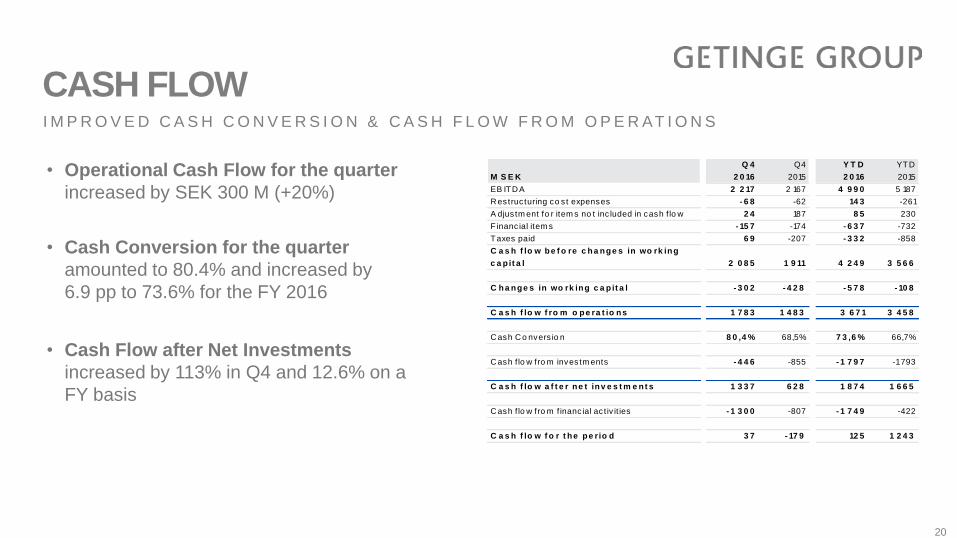
CASH FLOW I M P R O V E D C A S H C O N V E R S I O N & C A S H F L O W F R O M O P E R AT I O N S
• Operational Cash Flow for the quarter
increased by SEK 300 M (+20%)
• Cash Conversion for the quarter
amounted to 80.4% and increased by
6.9 pp to 73.6% for the FY 2016
• Cash Flow after Net Investments
increased by 113% in Q4 and 12.6% on a
FY basis
M S E K
Q 4
2 0 16
Q4
2015
Y T D
2 0 16
YTD
2015
EB ITD A 2 2 17 2 167 4 9 9 0 5 187
R estruc turing co s t expenses - 6 8 -62 14 3 -261
A djus tm ent fo r item s no t inc luded in cash f lo w 2 4 187 8 5 230
F inanc ial item s - 15 7 -174 - 6 3 7 -732
Taxes paid 6 9 -207 - 3 3 2 -858
C a s h f lo w be f o re c ha nge s in wo rk ing
c a p it a l 2 0 8 5 1 9 11 4 2 4 9 3 5 6 6
C ha nge s in wo rk ing c a p it a l - 3 0 2 - 4 2 8 - 5 7 8 - 10 8
C a s h f lo w f ro m o pe ra t io ns 1 7 8 3 1 4 8 3 3 6 7 1 3 4 5 8
C ash C o nvers io n 8 0 ,4 % 68,5% 7 3 ,6 % 66,7%
C ash f lo w fro m inves tm ents - 4 4 6 -855 - 1 7 9 7 -1 793
C a s h f lo w a f t e r ne t inv e s t m e nt s 1 3 3 7 6 2 8 1 8 7 4 1 6 6 5
C ash f lo w fro m f inanc ial ac t iv it ies - 1 3 0 0 -807 - 1 7 4 9 -422
C a s h f lo w f o r t he pe rio d 3 7 - 17 9 12 5 1 2 4 3
20

BREAKER PAGE /
DIVIDER
The breaker page can be used
to split up your presentation in
sections, and more.
CHANGE PICTURE
• Right click on the picture
• Choose Change picture
• Browse to find and insert
a new picture
CHANGE SLIDE
LAYOUT
Go to Home Menu
– click on Layout and select
between predefined layouts OUTLOOK
J O A C I M L I N D O F F, C E O

BREAKER PAGE /
DIVIDER
The breaker page can be used
to split up your presentation in
sections, and more.
CHANGE PICTURE
• Right click on the picture
• Choose Change picture
• Browse to find and insert
a new picture
CHANGE SLIDE
LAYOUT
Go to Home Menu
– click on Layout and select
between predefined layouts
• We expect slight growth in organic net sales in 2017
• Currency transaction effects FY 2017 are expected to have a positive impact of
approximately SEK 200 M on the Group’s earnings
• The financial consequences of the Consent Decree with the FDA, excluding costs for
the remediation program, are expected to have a negative impact of approximately
SEK 50 M on the Group’s 2017 operating profit
OUTLOOK G E T I N G E G R O U P 2 0 1 6
22

BREAKER PAGE /
DIVIDER
The breaker page can be used
to split up your presentation in
sections, and more.
CHANGE PICTURE
• Right click on the picture
• Choose Change picture
• Browse to find and insert
a new picture
CHANGE SLIDE
LAYOUT
Go to Home Menu
– click on Layout and select
between predefined layouts SUMMARY

BREAKER PAGE /
DIVIDER
The breaker page can be used
to split up your presentation in
sections, and more.
CHANGE PICTURE
• Right click on the picture
• Choose Change picture
• Browse to find and insert
a new picture
CHANGE SLIDE
LAYOUT
Go to Home Menu
– click on Layout and select
between predefined layouts Q&A

BREAKER PAGE /
DIVIDER
The breaker page can be used
to split up your presentation in
sections, and more.
CHANGE PICTURE
• Right click on the picture
• Choose Change picture
• Browse to find and insert
a new picture
CHANGE SLIDE
LAYOUT
Go to Home Menu
– click on Layout and select
between predefined layouts THANK YOU
BREAKER PAGE /
DIVIDER
The breaker page can be used
to split up your presentation in
sections, and more.
CHANGE PICTURE
• Right click on the picture
• Choose Change picture
• Browse to find and insert
a new picture
CHANGE SLIDE
LAYOUT
Go to Home Menu
– click on Layout and select
between predefined layouts
FORWARD LOOKING INFORMATION
This document contains forward-looking information based on the current expectations
of the Getinge Group’s management. Although management deems that the
expectations presented by such forward-looking information are reasonable, no
guarantee can be given that these expectations will prove correct. Accordingly, the
actual future outcome could vary considerably compared with what is stated in the
forward-looking information, due to such factors as changed conditions regarding
business cycles, market and competition, changes in legal requirements and other
political measures, and fluctuations in exchange rates.