Embed Size (px)
Citation preview

Prof. Tajana Šimunić Rosing
Dept. of Computer Science
System Energy Efficiency Lab
seelab.ucsd.edu

Energy efficiency at global scale NSF GreenLight & IRNC: TransLight/StarLight
2.8MW Fuel Cell Power Plant , UCSD
Wind from NREL, 2MW Solar @UCSD

Key issues for distributed
renewable-powered datacenters Green energy availability varies dramatically
Instantaneous use leads to significant energy efficiency losses -> prediction
Datacenters energy needs are higher than green energy availability
Brown energy needs to be present to both supplement green and as
“insurance” to meet performance constraints
Improvements in computation & networking infrastructure energy efficiency are
necessary (power, thermal and cooling management)
Datacenter computing requires consistent performance
Infrastructure that monitors and manages computation in datacenters has to be
aware of performance metrics – guaranteeing QoS is key!
Service response times are around 100ms, Max 10% batch job throughput hit
Fast network connections are critical
Telecom infrastructure up to 40% of the overall IT energy cost [SMART 2020]
Energy costs are skyrocketing:; e.g. Telecom Italia is the 2nd largest electricity
consumer in Italy [INTELEC 2007]

Datacenter energy efficiency
Barroso & Hölzle, 2009
4

Energy efficiency of the infrastructure
Dynamic thermal management (DTM) • Workload scheduling:
• Machine learning for dynamic
adaptation
• Proactive thermal management
• Reduces thermal hot spots by average
80% with no performance overhead
• Cooling aware management
• Savings of 70% in cooling subsystem
Dynamic power management (DPM) • HW level: adaptive power gating gives
40% energy savings with no perf. impact
• SW level: 92% reduction in performance
variability with DVFS
• Optimal DPM for a class of workloads
• Machine learning to adapt
• Measured energy savings of 70%
• VM management
NSF Project GreenLight • Green cyber-infrastructure in
energy-efficient mobile facilities
• Closed-loop power and thermal
management
5

HW level: TAP -
Token-based Adaptive Power gating
Goal: Power gate cores on
L2 and L3 cache misses with
no performance hit by
effectively utilizing a token
based mechanism
PPGS: Programmable Power Gating Switch
Variable wakeup latency and peak current
Leakage reduction does not depend on wakeup time
Token Controller manages PPGS wakeup modes
Adapts to system utilization
More idle cores relax constraints
Manages peak current and voltage swing constraints Jointly with: Andrew Kahng, UCSD & GSRC

TAP: Tokens In Flight
Jointly with: Andrew Kahng, UCSD & GSRC

Energy Savings
TAP: Experimental Results We run SPEC benchmarks within M5 with McPat for 32nm technology
node per ITRIS 2010 data with TAP implemented on the following cores: One In-Order (IO) core: Atom+@2GHz
Three Out Of Order (O3) cores: ARM9@2GHz with 2 issue, EV6@3GHz:
with 6 issue & EV8@3GHz with 8 issue
Results:
IO vs. O3 cores spend up to 89% vs. 72% of time stalling for memory
IO vs. O3 can power gate 74% of run time for lbm vs. 60% for mcf
IO vs. O3 can save up to 42% energy for lbm vs. 27% for mcf
Jointly with: Andrew Kahng, UCSD & GSRC

P-State
requests
OS/HW interface
Ondemand (Linux)
OSPM
Platform
Utilization
Our approach
P-State
requests
Platform
Scalability factor (SF),
Instruction execution
rate
OSPM
Application
Performance target set
• Guarantees meeting performance target
• Runs at the lowest frequency while
meeting required performance targets
• Does not consider performance
constraints
• Actual performance can vary
• Does not consider characteristics of
application & cannot minimize frequency
OS level: Meeting performance
targets with minimal cost
10
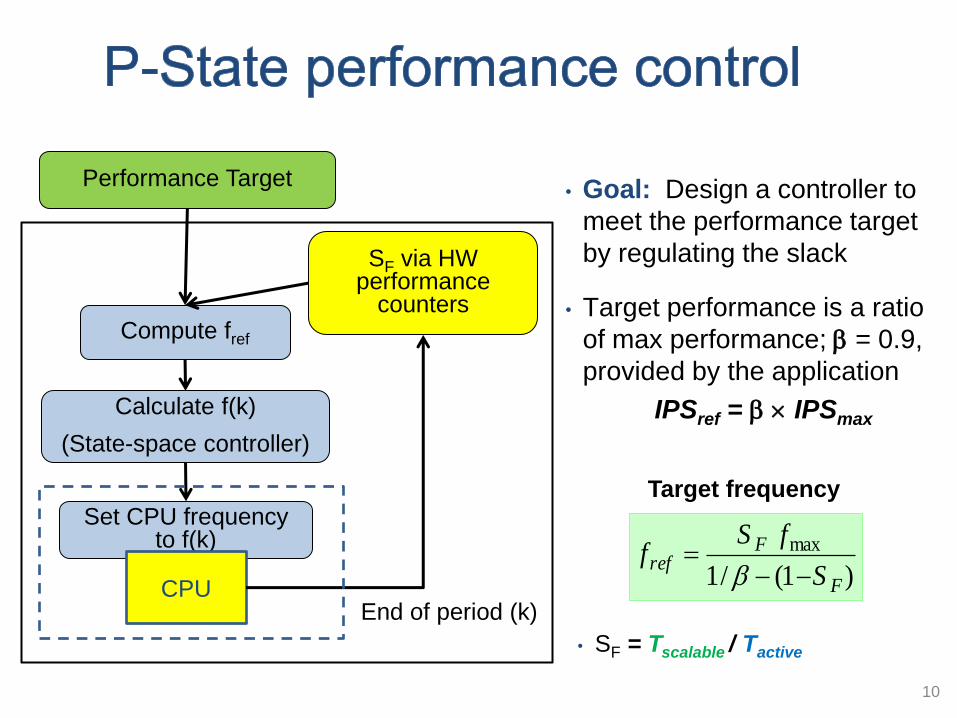
• Goal: Design a controller to
meet the performance target
by regulating the slack
• Target performance is a ratio
of max performance; = 0.9,
provided by the application
IPSref = IPSmax
Performance Target
Compute fref
Set CPU frequency to f(k)
Calculate f(k)
(State-space controller)
SF via HW performance
counters
CPU End of period (k)
)1(/1
max
F
Fref
S
fSf
Target frequency
• SF = Tscalable / Tactive

11
OS Policy: SpecWeb with 2000 connections
High performance
variations
Our Policy: SpecWeb with 2000 connections
Performance variations are
minimized

12 12
• Our technique is able to meet the performance target for different workload
combinations running on multiple sockets
• The reduction in average standard deviation from target performance over
other policies reaches 92% with average power reduction of 17%
FFPA policy: f = ceil ( fmax )
Implementation in Linux kernel 2.6.33.2 using SPEC benchmarks
Experiments are conducted on a Westmere processor with two 6 core CPU
sockets capable of 6 operating frequencies: from 1.6, to 2.267 GHz

OS level DPM:
DPM: Workloads - Idle State
0.0001
0.001
0.01
0.1
1
0.01 0.1 1 10
Interarrival Time (s)
WWW Trace
Experimental
Exponential
Pareto
0.0001
0.001
0.01
0.1
1
0.01 0.1 1 10
Interarrival Time (s)
Telnet Trace
Experimental
Exponent ial
Pareto
b
user taE 1
Pareto Distribution:
0.0001
0.001
0.01
0.1
1
1 10 100 1000
Ta
il d
istr
ibu
tio
n
Exponential
Pareto
Experimental
Storage Trace
13
Network Traces WWW – left; Messaging – right

DPM: TISMDP model
Idle
departure
S,Q=1 S,Qmax . . .
arrival
arrival
Decision
uniform
S,Q=0
no arrival
A,Qmax A,Q=1 A,Q=2 . . . arrival
general Assumptions:
general distribution governs the first request arrival
exponential distribution represents arrivals after the first arrival
user, device and queue are stationary
Obtain globally optimal policy using linear programming
Measurements within 11% of ideal oracle policy factor of 2.4 lower than always-on factor of 1.7 lower than default time-out 14

Online Learning for Power Management
Selects the best performing
expert for managing power
Selected expert manages
power
for the operative period
Evaluates performance of all
the experts
……….. EXP 1
Controller
Device
EXP 2 EXP 3 EXP n
EXP y :Dormant Experts EXP y :Operational Expert
Measured large energy savings – up to 70% per device
Experts control sleep states and voltage/freq. settings
Converges to the best performing expert at TNO /)(ln

Adaptive Cooling &
Thermal Management
Resource manager Static: Fixed allocation (ILP)
Dynamic: Dependent on the policy
Inputs:
• Workload – collected at a data center
• Floorplan, temperature (for dynamic policies)
Power Manager DPM, DVS
Thermal Simulator HotSpot [Skadron, ISCA’03]
Inputs:
• Power trace for each unit
• Floorplan, package and die
properties (Niagara-1)
Transient Temp.
Response for Each Unit 16
Evaluation framework

Load balancing vs.
optimal policies
Energy or performance-aware methods are not always
sufficient to manage temperature.
0%
20%
40%
60%
80%
100%
Load Balancing Energy-Aware Optimization
Thermally-Aware Optimization
>85 C
[80,85] C
[75,80) C
<75 C% T
ime S
pen
t at
Vari
ou
s T
em
pera
ture
Ran
ges
17
Dynamic Policies: Thermal Hot Spots
0
5
10
15
20
25
30
A B C D AVG
Ho
t S
po
ts (
% >
85
C)
.
Workloads
Default
Migration
DPM
DVS&DPM
Adapt-Rand
OL
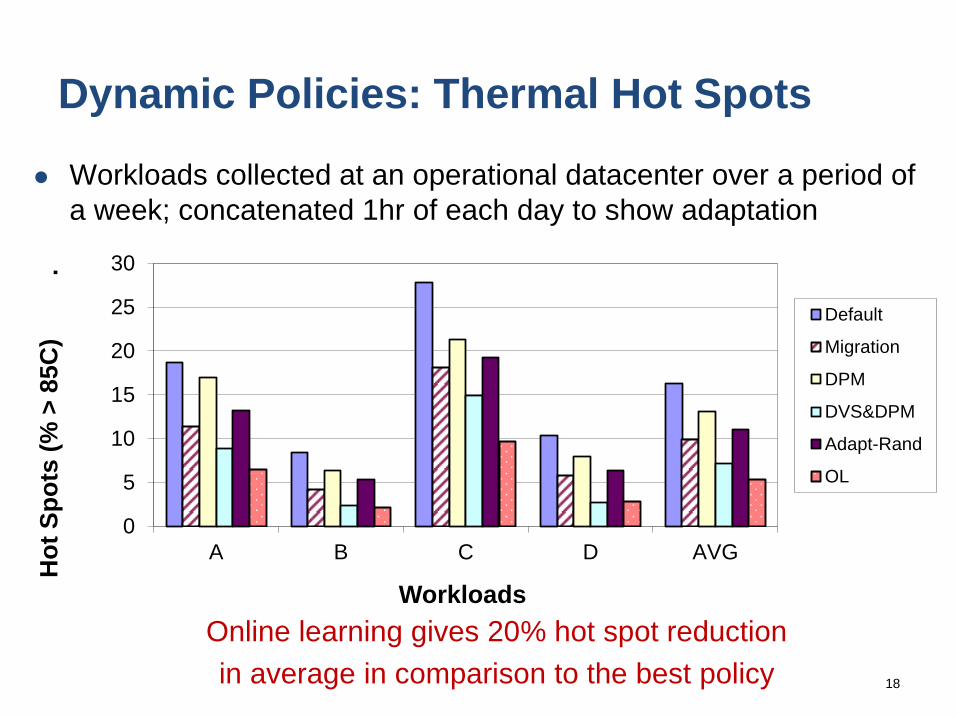
Workloads collected at an operational datacenter over a period of
a week; concatenated 1hr of each day to show adaptation
Online learning gives 20% hot spot reduction
in average in comparison to the best policy 18

19
Reactive vs. Proactive Management
Reactive
70
75
80
85
90
Time
Te
mp
era
ture
(C
) .

20
Reactive
e.g., DVFS,
fetch-gating,
workload migration,
…
Proactive
70
75
80
85
90
Time
Te
mp
era
ture
(C
) .
70
75
80
85
90
Time
Te
mp
era
ture
(C
) .
Forecast
Reactive vs. Proactive Management

21
Reactive
e.g., DVFS,
fetch-gating,
workload migration,
…
Proactive
Reduce and balance temperature
Two techniques: on chip fast technique, and longer time horizon
70
75
80
85
90
Time
Te
mp
era
ture
(C
) .
70
75
80
85
90
Time
Te
mp
era
ture
(C
) .
T after proactive
management
Reactive vs. Proactive Management
Forecast

Proactive vs. Reactive: Hot Spots
Proactive Balancing (PTB) achieves similar hot spot reduction to P-DVS
while improving performance by ~8%
PTB reduces hot spots 80% over default load balancing (DLB)
0.5
0.6
0.7
0.8
0.9
1.0
0
5
10
15
20
25
30
35
40
DLB R-Mig P-Mig R-DVS P-DVS PTB
Pe
rfo
rma
nc
e
%
Ho
t S
po
ts >
Th
igh
Web-med
Web-high
Web&DB
Mplayer&Web
AVG
Avg Perf (Right Axis)
Temperature Data from
Thermal Sensors
Predictor
(ARMA)
Periodic ARMA
Model Validation
&
Model Update
Temperature at time (tcurrent + tn)
for all cores
SCHEDULER
Temperature-Aware
Allocation on Cores

Integrating energy, temperature and
cooling and management Fan control is done jointly with job
and memory scheduling
state of the art fan control
operates independently from
workload scheduling
Controller decides the following
on each tick:
CPU power distribution
DIMM power distribution
Desired temperature to control
fan speed
Actuators: CPU, memory & fan
actuators implement controller’s
decisions independently
Sensor input to controller:
temperature, power, fan speed
Power, thermal and
fan speed sensors
CPU
CPU
Thread
migration
Page
Management
for DIMM
clustering

Average cooling savings of 70% relative to state-of-the-art
Combined Energy Thermal & Cooling,
CETC Management Results
Tajana Simunic Rosing, UCSD
CETC: Our policy
DLB: Dynamic load balancing (baseline)
NFMO: Only page migrations allowed
NMM: No memory clustering
NCM: No CPU scheduling optimizations
Intel Xeon Dual Socket
Quad core Server; with
state-of-the-art PI fan
controller
CETC performance overhead < 0.2%
CETC page migration rate < 5 pages/sec ->
negligible overhead & high stability
Local
ambient
Temp.
#
DIMM
CETC
%
NFMO
%
NMM
%
NCM
%
DLB
%
45 oC 8 0.175 0.184 0.093 0.102 0
35 OC 8 0.115 0.120 0.069 0.100 0
45 oC 16 0.175 0.187 0.109 0.102 0
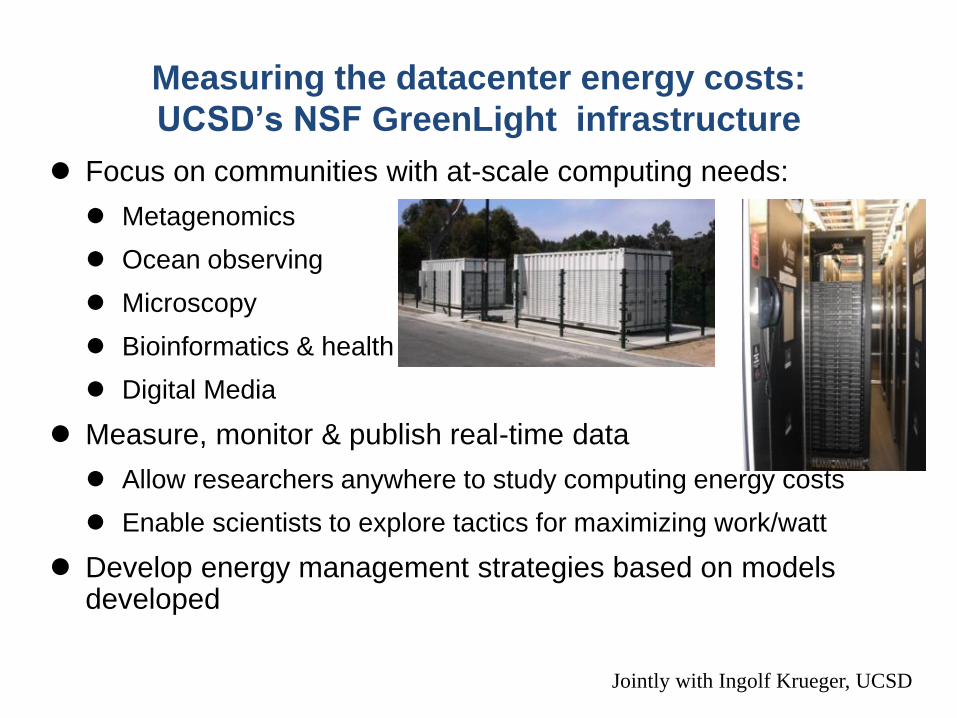
Measuring the datacenter energy costs:
UCSD’s NSF GreenLight infrastructure
Focus on communities with at-scale computing needs:
Metagenomics
Ocean observing
Microscopy
Bioinformatics & health
Digital Media
Measure, monitor & publish real-time data
Allow researchers anywhere to study computing energy costs
Enable scientists to explore tactics for maximizing work/watt
Develop energy management strategies based on models developed
Jointly with Ingolf Krueger, UCSD

NSF GreenLight:
Dashboard & History plots
Multiple sensor data: temperature, fan speed, liquid flow rate & temp, power
Use measurements to develop models needed for energy management 26

GMVQ VM Power Cost Prediction
• Goal: Estimate how much a VM consumes and predict what the cost would
be if it migrates to another machine
70
W
Power clusters
CPU utilization is not enough!
Tajana Simunic Rosing, UCSD
• Approach: Gaussian Mixture Vector Quantization (GMVQ) to fit a GMM to the
training data
GMVQ is 3x better than regression
3x
27 NSF FlashGordon: Design of an energy-efficient supercomputer

Energy management with virtualization
CPU0 CPU1 NW CPU2 CPU
n HD
Hypervisor
Guest n
I/O CPUs
Hardware
I/O Intensive? CPU Intensive?
Guest 1 Guest 2
Apps
OS
Apps
OS
Apps
OS
Scheduler
Workload
Characterization
VCPU1 VCPU2
wMPC
wIPC
util
wMPC
wIPC
util
vMPC
vIPC
vutil
vMPC
vIPC
vutil
nMPC
nIPC
nutil
VM1 VM2
wMPC
wIPC
util
wMPC
wIPC
util
VCPU1 VCPU2
VGNODE
nMPC vMPCVM
nIPC vIPCVM
nutil vutilVM
vMPC wMPCVCPU
vIPC wIPCVCPU
vutil utilVCPU
vGreen
• Scheduling • Co-locate batch VMs with orthogonal characteristics
• Management policies • Based on CPU/mem metrics maintained per guest
• Measured energy
savings of 35% with
speedup of 40%

vGreen++
Batch Jobs:
•MIPS driven
Services:
•Latency sensitive
Maximize qMIPS/Watt
q QoS ratio < 1
MIPS Batch job throughput
Watt Power consumption
vgnodes
vgserv
Tajana Simunic Rosing
Unmodified Xen: RUBIS w batch job
Poor
SLA!
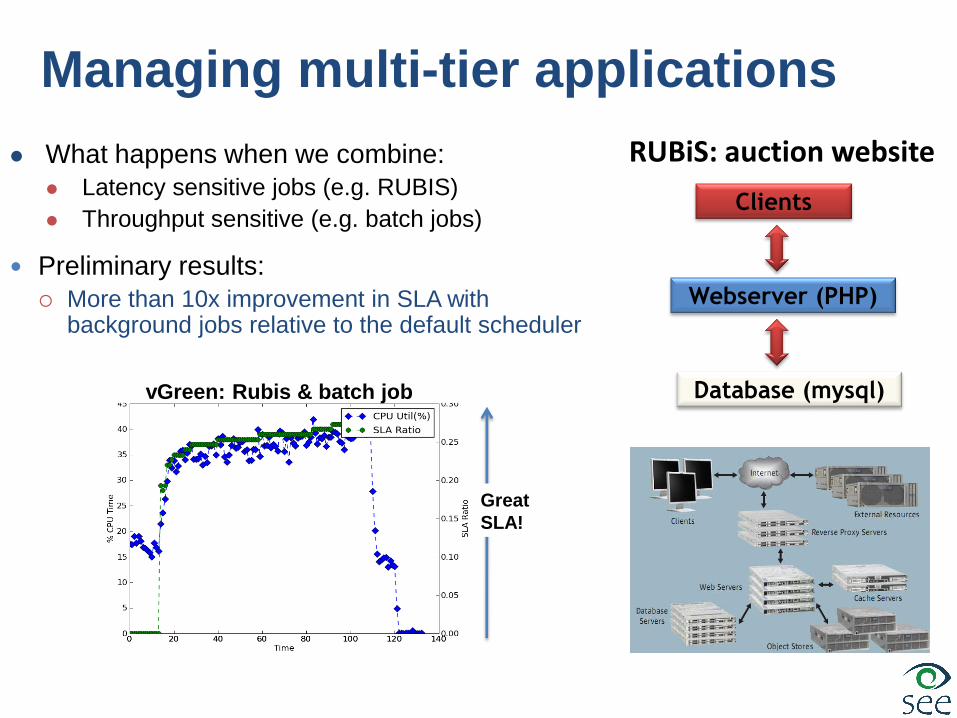
vGreen: Rubis & batch job
Great
SLA!
Managing multi-tier applications
RUBiS: auction website
Clients
Webserver (PHP)
Database (mysql)
Tajana Simunic Rosing, UCSD
What happens when we combine:
Latency sensitive jobs (e.g. RUBIS)
Throughput sensitive (e.g. batch jobs)
Preliminary results:
More than 10x improvement in SLA with background jobs relative to the default scheduler

State of the art: Selective Consolidation (tChar): vGreen
Capping (tCap): Cap the CPU allotment to bVM to mitigate interference effects (Padala et al, EuroSys’09, Nathuji et al, EuroSys’10)
Controller: Dynamically control the virtual CPU allocation of the service VM to
maximize MIPS of batch job while meeting SLA
Policies compared
Virtual CPU
allocation of
service VM
changes based
on the level of
interference from
the batch VM

Batch Job Throughput T
hro
ugh
put
Our controller is within 7% of baseline;
CPU capping gets on average 25% lower throughput Baseline: running services and batch jobs on separate servers

Use a controller to manage virtual CPUs dynamically Maximize CPUs of various batch jobs while meeting Rubis SLAs
Energy Efficiency Improvements
• 70% more efficient than running service & batch VMs separately
while within 7% of maximum batch job throughput
• 35% more efficient than the ideal version of state of the art

Green Energy Prediction and VM Scheduling
• Data from solar panels at UCSD
• State of the art: exponential weighted
average
• EWMA: 32.6 % error
• Extended eEWMA: 23.4% error
• Our algorithm:
• WCMA: less than 9.6% error
• Data gathered from a wind farm in
Lake Benton, available by NREL
• State-of-the-art: • Integrated predictor: 48.2% error
• Our algorithm: 21.2% error • Combination of a weighted nearest-
neighbor (NN) tables and wind power
curve models
Predict green energy availability for the next 30min window
Schedule additional MapReduce jobs accordingly; they take max 30mins

Benefits of Green Energy Prediction
0
0.2
0.4
0.6
0.8
1
job completion time
No
rmalized
Jo
b
Co
mle
tio
n T
ime
w/o GE instantaneou prediction
• Prediction has 22% faster job
completion time vs. default
• On average, 5x fewer batch jobs need
to be terminated when using GE
prediction vs. instantaneous usage
0
0.2
0.4
0.6
0.8
1
Solar GE Efficiency Wind GE Efficiency Combined GEEfficiency
No
rmalized
Qu
an
titi
es
instantaneous prediction
• Prediction has 93% GE Efficiency • ratio of green energy consumed for useful
work vs. total green energy available
0
0.2
0.4
0.6
Solar GE Job % Wind GE Job % Combined GE Job %
No
rmalized
Qu
an
titi
es
instantaneous prediction
• Prediction has 38% more jobs completed
vs. instantaneous GE usage
• GE Job %: ratio of jobs completed with
GE over all completed jobs.
Experimental setup:
• Schedule additional MapReduce jobs
depending on green energy availability
• Mix services and batch jobs
• Rubis with 100ms 90th%ile SLA
• MapReduce with max 10%
throughput reduction
• Run on Intel Xeon cluster (250W/server)

How about networking?
Increase the energy efficiency of backbone network
Shutting down the idle network elements [SIGCOMM10]
Ensure connectivity is not affected when they are shut down
Adjusting the number of active line cards [INFOCOM08]
Line cards consume a large portion of the router power
Adjust bandwidth accordingly
Dynamic software solutions
Energy aware routing [INFOCOM09]
Select the energy efficient path and adjust bandwidth accordingly
[SIGCOMM10] W. Fisher, M. Suchara, J. Rexford. Greening backbone networks: reducing energy consumption by shutting off cables in bundled links. SIGCOMM, 2010. [INFOCOM08] J. Chabarek, J. Sommers, P. Barford, C. Estan, D. Tsiang, and S.Wright, Power awareness in network design and routing. INFOCOM, 2008. [INFOCOM09] K. Kant. Power control of high speed network interconnects in data centers. INFOCOM, 2009.

Green-energy aware routing
Shutting down nodes or links affects performance
May decrease availability and connection speed
Instead, we show the effects of energy proportional
hardware on energy efficiency
Green energy is highly variable -> use prediction
Improves the reliability
Use of dynamic routing policies
Brown and/or green energy aware policies
Decreases the brown energy use significantly

Load Balancing Across Data Centers
DC#
1
DC#
2
DC#
n
Controller Send available
resource profile to
controller
DC#
1
DC#
2
DC#
n
Controller Send data transfer
information to each data
center
1 2
{C1 ,M1} {C2 ,M2}
{Cn ,Mn}
Each data center i gets a set of numbers {Nij}
where:
Nij = #VMs that CAN be sent from data center i to
j
{N1j} {N2j} {Nnj}
Each data center i sends a set of tuples {Ci,
Mi}
Ci = #CPU cores available in center i
Mi = Amount memory available in center i 3
Job#1 Job#
2
Job#
m
DC Controller Check active MR
jobs to determine
how many task
can be sent in
real {n1} {n2}
{nm}
Each active MR job j sends a number to DC
controller
nj = # subtasks that Job j can transfer
DC#
1
DC#
2
DC#
n
Controller Send data transfer
information to the
main controller
4
{T1j} {T2j} {Tnj}
Each data center i sends a set of numbers {Tij}
where:
Tij = #VMs that WILL be sent from data center i to
j

Based on typical network characteristics [IEEE10]
Routers, hubs, storage, computation elements
Focus is on routers
Large portion of the power is consumed by routers
Backbone Network Model
Esnet Backbone network topology map Typical router
[IEEE10] Y.Zhang, P.Chowdhury, M.Tornatore, B.Mukherjee. Energy Efficiency in Telecom
Optical Networks. Communications Surveys & Tutorials, IEEE , vol.12, no.4, pp.441-458,
Fourth Quarter 2010
39

Network Power Model
Optical links have a fixed cost
A function of distance between amplifiers
Router energy cost:
Linear model based on bandwidth utilization [NET09]
Evaluate energy proportional routers as well
0
300
600
900
1200
1500
1800
0 100 200 300 400
Po
wer
(W
)
Bandwidth (Gbit/s)
non-proportional
smooth proportional
step function proportional
ideally proportional
[NET09] P. Mahadevan, P. Sharma, S. Banerjee, and P. Ranganathan. A Power
Benchmarking Framework for Network Devices. Networking , 2009.
Non-
proportional
State-of-the-art router; 4x100
Gbps
Step function On/off line cards scheme
Smooth Smoot out step function line
Ideal Best case linear power curve

OSCARS vs. Energy Aware Routing On-demand Secure and Advanced Reservation System
(OSCARS; by ESnet) Online path computation
Constructs virtual circuits with required bandwidth
Improves performance substantially
Works well with systems where the main goal is performance Energy consumption is not a constraint
Solution: Energy-aware dynamic routing is needed to account for both performance and energy consumption

Routing Policies
Constructing a path Shortest Path Routing (SPR)
Based on Dijkstra's algorithm
Green Energy Aware Routing (GEAR)
Based on green energy availability on the nodes
Available green energy is estimated using prediction
Chooses the path with the least brown energy need
N1 N2
SPR Path1
Path2 SPR selects Path1 in every case as it is
shorter than Path2, between N1 and N2
• There is no other criteria (as in
OSCARS)
N1 N2
Path1
Path2
GEAR
GEAR does not always select the same
path between two nodes. It may select
Path2, even if it is longer, as its brown
energy need may be less

Bandwidth adjustment • All bandwidth policy (AB)
– Allocates all the bandwidth available on a path
– Results in fast transfer times, but decreases availability
• Necessary Bandwidth Policy (NB)
– Allocates some portion of the bandwidth so that the transfer finishes
before a specified deadline (100 sec for our experiments)
– Results in slower transfer times, compared to AB, but increases the
network availability
N1 N2 AB N1
N2
Right after the transfer
N1 N2 N
B
N1 N2
Availability
decreases
during the
transfer
Network
availability does
not generally
change, but
available
bandwidth
changes

Tajana Simunic Rosing
Experimental setup & validation Globally distributed datacenters
Modeled after Esnet; 100Gbps per link
5 datacenters, 12 routers
10% BW for background traffic
Solar traces from UCSD
Wind traces from NREL
Simulator estimation error <8%
Green energy supply is ~80% of the energy need per router, 1.6 kW, where available:
Jobs run in vGreen VMs on Nehalem servers in datacenter container Rubis used for services with 100ms 90th%ile response time constraint
MapReduce used for batch jobs with 10% max job completion time reduction (max 5 cores on Nehalem server)
VM migration enabled
Location Type Location Type Location Type
Chicago Wind New York Wind San Francisco Solar & Wind
Atlanta Solar San Diego Solar Denver -
Kansas - El Paso Solar Houston Solar
Nashville Wind Cleveland Wind Washington DC -

Load Balancing Effects
Without load balancing:
Average MapReduce job completion time is 22.8 min
With global datacenter load balancing: Metric AB NB Metric AB NB
Ave. MR job completion (min) 17.5 16.8 TotPave 85% 83%
Ave. MR task completion (min) 4.22 4.25 BWave 66 48
• TotPave: Average power consumption per router (ratio to peak power)
• BWave: Average bandwidth per link in Gbps
• 30% better job completion compared to w/o load balancing
• Necessary Bandwidth (NB) leads to 1.5x more bandwidth – Can be used for additional transfers
– Power consumption is similar to AB due to high idle power
– 34% of the tasks are executed in a remote center, 5% higher than AB

Changing the bandwidth
75
77
79
81
83
85
15
17
19
21
23
25
0 20 40 60 80 100
Av
erag
e P
ow
er C
on
sum
pti
on
(%
pea
k)
MR
Jo
b C
om
p.
Tim
e (m
in)
BW (Gbps)
Job Comp. Time (min) 2x load
2x servers 4x load
4x servers Power/router (% peak)
• Power/performance does not change between 50-100 Gbps
• MapReduce completion time gets closer to no load
balancing case with decreasing bandwidth • Explains why load balancing is not common today with 10 Gbps links

Average Router Power
Advantages of GEAR are more pronounced with increasing router energy proportionality
Ideally proportional router + green energy + GEAR leaves routers consuming only 3% brown power
0102030405060708090
100A
B
NB
AB
NB
AB
NB
AB
NB
SP
R
GE
AR
SP
R
GE
AR
SP
R
GE
AR
SP
R
GE
AR
Non-Prop Ideal Prop SmoothProp
Step Func Non-Prp Ideal Prop SmoothProp
Step Func
w/o green w/ green
Pe
rce
nt
Pe
ak
Po
we
r
TotalPower BrownPower

Bandwidth Usage Efficiency
GEAR is better than SPR 2x with step function prop
2.5x with smooth prop
3x with ideal prop
GEAR + proportionality is better than non-proportional case 8x with step function prop
11x with smooth prop
31x with ideal prop
0102030405060708090
100A
B
NB
AB
NB
AB
NB
AB
NB
SP
R
GE
AR
SP
R
GE
AR
SP
R
GE
AR
SP
R
GE
AR
Non-Prop Ideal Prop SmoothProp
Step Func Non-Prp Ideal Prop SmoothProp
Step Func
w/o green w/ green
No
rma
lize
d P
erc
en
t V
alu
es
Average bandwidth utilization efficiency per brown energy

MapReduce Performance per Watt
GEAR is better than SPR by ~2x
GEAR + proportionality: 27x with ideal, 10x with
smooth & 7x with step proportionality
0102030405060708090
100
AB NB AB NB AB NB AB NB SPR GEAR SPR GEAR SPR GEAR SPR GEAR
Non-Prop Ideal Prop SmoothProp
Step Func Non-Prp Ideal Prop SmoothProp
Step Func
w/o green w/ green
No
rma
lize
d P
erc
en
t V
alu
es
Number of MapReduce tasks completed per network brown energy

Energy Management in
Large Scale Computing Systems
Designed management strategies that exploit workload characteristics and operate accross system layers Optimal and adaptive power management policies Efficient thermal and cooling management vGreen virtualized system:
Able to meet SLAs while improving energy efficiency >2x
NSF funding: MRI GreenLight, IRNC ProNet: TransLight/StarLight, FlashGordon, ERC
CIAN, Expedition:Variability, SHF: Cooling & Thermal Management
Leading a large center: Multiscale Systems Center funded by DARPA, DOD, & industry
Industry funding along with IP transfer: SRC, Microsoft, Google, Oracle, Intel, IBM, TI, Cisco, Qualcomm, etc. Graduated students have jobs in many of these companies
50 System Energy Efficiency Lab
seelab.ucsd.edu