Embed Size (px)
Citation preview

Priority pollutant behaviour in treatment and reuse systems for household wastewater.
Deliverable No: D5.2, Date: 21st July, 2008
Dissemination level: PU
Erica Donner1, Eva Eriksson2, Lian Scholes1, Mike Revitt1. 1 Urban Pollution Research Centre, Middlesex University, UK. 2 Department of Environmental Engineering, Technical University of Denmark, Denmark.
Source Control Options for Reducing Emissions of Priority Pollutants (ScorePP)
Sixth Framework Programme, Sub-Priority 1.1.6.3, Global Change and Ecosystems
Project no. 037036, www.scorepp.eu, Duration: 1 October 2006 – 30 September 2009

Priority pollutant behaviour in household wastewater.
Date submitted: 2008-08-11
File name: D5.2_Final_report[1].doc Page ii
Abstract
This report addresses the presence of priority pollutants (PPs) in greywater (laundry, bathroom [washing and bathing] and kitchen wastewater), yellow water (urine only), brown water (faeces only) and black water (combined toilet wastewater), and their potentials for removal by current and emerging treatment technologies. The emphasis is on greywater for which the limited existing literature database on PP occurrence has been supplemented by reference to a household products database. Although the reported levels of PPs are low in comparison to conventional pollutant concentrations, they should be removed to ensure that reuse is a viable option. The range of treatment techniques which have been employed are illustrated through the use of examples for each type of household wastewater. There is limited data on PP treatment efficiencies and therefore, their physico-chemical characteristics have been used to interpret removal potentials, with the predominant removal route for the majority of PPs predicted on this basis to be adsorption to the solid/sludge phase. Existing greywater treatment plants generally consist of several separate stages including, for example, a primary settling tank, a rotating biological contactor, secondary settling tank, sand filter and UV disinfection before returning the treated water for toilet flushing. A series of scenario analyses are described for assessing the impact of treated greywater reuse on both potable supply and the volume of wastewater reaching the wastewater treatment plant (WWTP). Selecting irrigation as the reuse option completely removes greywater from the combined wastewater flow whereas toilet flushing reduces the potable water demand but may not have a significant impact on the overall load of pollutants reaching the municipal wastewater treatment plant. This is due to the tendency for PPs to accumulate in the sludge fraction, which, in the absence of on-site sludge treatment, is generally flushed periodically to the central sewer system. To conclude this report, the risks and uncertainties associated with treating and reusing source separated household wastewaters are discussed.
Acknowledgement
The presented results have been obtained within the framework of the project ScorePP - “Source Control Options for Reducing Emissions of Priority Pollutants”, contract no. 037036, a project coordinated by Department of Environmental Engineering, Technical University of Denmark within the Energy, Environment and Sustainable Development section of the European Community’s Sixth Framework Programme for Research, Technological Development and Demonstration.
Deliverable number: D5.2
Deliverable title: Priority pollutant behaviour in treatment and reuse systems for household wastewater.
Authors: Erica Donner, Eva Eriksson, Lian Scholes, Mike Revitt.
Review & Assessment: Peter Vanrolleghem
Date submitted to project coordinator: 2008-07-21
Approved by (Work package leader) : 2008-07-21

Priority pollutant behaviour in household wastewater.
Date submitted: 2008-08-11
File name: D5.2_Final_report[1].doc Page iii
Table of Contents ScorePP priority pollutants in household wastewater fractions. .................................................................. 1
1. Introduction .......................................................................................................................................... 1
2. Household wastewater streams ............................................................................................................ 3
2.1 Greywater.................................................................................................................................... 3
2.2 Yellow water............................................................................................................................... 3
2.3 Brownwater................................................................................................................................. 3
2.4 Blackwater .................................................................................................................................. 3
2.5 Kitchen compost ......................................................................................................................... 4
3. Characteristics and composition of household wastewater streams..................................................... 5
3.1 Greywater.................................................................................................................................... 6
3.2 Yellow water............................................................................................................................... 6
3.3 Brownwater................................................................................................................................. 6
3.4 Blackwater .................................................................................................................................. 6
4. Household wastewater flows and water use statistics.......................................................................... 6
5. Priority Pollutants in household wastewaters....................................................................................... 6
5.1 Primary data (i.e. measured values reported in the literature) .................................................... 6
5.1.1 Priority pollutants in greywater .............................................................................................. 6
5.1.2 Priority pollutants in urine (yellow water).............................................................................. 6
5.1.3 Priority pollutants in faeces (brownwater) ............................................................................. 6
5.1.4 Priority pollutants in blackwater............................................................................................. 6
5.2 Secondary data on priority pollutants ......................................................................................... 6
6. Household wastewater reuse and recycling options............................................................................. 6
7. Current status of household wastewater source separation and recycling............................................ 6
8. Treatment options – current and emerging........................................................................................... 6
8.1 Greywater (and blackwater) treatment........................................................................................ 6
8.2 Yellow water treatment............................................................................................................... 6
8.3 Brownwater treatment................................................................................................................. 6
9 Priority pollutant treatment efficiency.................................................................................................. 6
9.1 Treatment efficiency of priority pollutants in greywater ............................................................ 6
9.2 Treatment efficiency of PPs in urine (yellow water).................................................................. 6
10 Danish greywater treatment plant case studies............................................................................... 6
10.1 Greywater pilot plants in Denmark............................................................................................ 6
10.2 Greywater treatment and recycling at Nordhavnsgården, Copenhagen.....................................6
10.2.1 Greywater metal dynamics at the Nordhavnsgården treatment plant................................. 6
Priority pollutant behaviour in household wastewater.
Date submitted: 2008-08-11
File name: D5.2_Final_report[1].doc Page iv
11 Greywater treatment scenario analyses ........................................................................................... 6
11.1 Dynamics of organic pollutants in greywater treatment systems ..................................................... 6
11.2 Dynamics of metals and their compounds in greywater treatment systems .............................. 6
12. Risks and uncertainties associated with the reuse of household wastewater ................................. 6
13. Conclusions .................................................................................................................................... 6

Priority pollutant behaviour in household wastewater.
Date submitted: 2008-08-11
File name: D5.2_Final_report[1].doc Page 1
1. Introduction Domestic wastewater produced in the urban areas of relatively developed countries is typically removed from the source as a single combined wastewater stream and transported by underground pipeline to a centralised municipal sewage treatment plant. On reaching the treatment plant the combined sewage stream generally includes kitchen, laundry and bathroom wastewater from households, institutions, and commercial establishments, together with some industrial wastewater (which may or may not be pre-treated) and probably some stormwater and groundwater as well. Although these centralised large-scale urban wastewater treatment systems offer economic benefits due to their scale of operation, they also require extensive water transportation and considerable supporting infrastructure and do not easily facilitate the reuse of less polluted wastewater components (e.g. greywater).
In recent years support for a more decentralised approach to wastewater treatment has been growing. There are many likely benefits associated with the strategic decentralisation of wastewater treatment, including reduced infrastructure needs and transport costs; greater source control of pollutants; increased opportunities for water reuse and recycling; increased opportunities for the optimal application of advanced technologies; and enhanced potential for energy recovery (Lens et al., 2001; Atkinson, 2005; Tettenborn et al., 2007). Furthermore, by segregating intended use applications and associated water quality criteria, communities could use advanced technologies to design tailor-made treatment and control of their water resources (Atkinson, 2005). Smaller quantities of water could be treated only to the standards necessary for their intended use and multiple pass systems (meaning systems incorporating water recycling) could increasingly be implemented to reduce the demand on potable water resources.
With burgeoning population growth, widespread rural to urban migration, and the foreseeable consequences of climate change continuing to increase the pressure on potable water supplies, interest in the reuse/recycling of wastewater is increasing in many regions of the world. Nevertheless, progress in this field is as yet relatively modest, and it is essential that the risks associated with water reuse and recycling are properly assessed to ensure that the implementation of such schemes does not prove detrimental to public health or the environment. This report addresses the potential reuse and recycling of household wastewater, including grey-, yellow-, brown- and black-water, for both indoor and outdoor reuse options (e.g. toilet flushing, laundry washing, garden irrigation etc.). Particular emphasis is given to the possible presence of the Water Framework Directive (WFD) Priority Substances (PSs) in household wastewater, and to the likely effectiveness of available treatment systems for dealing with these pollutants. Please note that for the purposes of this report, the WFD list has been expanded and the focus is on 67 ‘Priority Pollutants’ selected for detailed study by the ScorePP project consortium (Steen Mikkelsen, 2007). The selected PPs are presented in Table 1, together with their CAS numbers.

Priority pollutant behaviour in household wastewater.
Date submitted: 2008-08-11
File name: D5.2_Final_report[1].doc Page 2
Table 1 ScorePP Priority Pollutants investigated in this report
Substance CAS No. Substance CAS No. Benzene and PAHs Triazines Benzene 71-43-2 Simazine 122-34-9 Naphthalene 91-20-3 Atrazine 1912-24-9 Anthracene 120-12-7 Fluoranthene 206-44-0 Organophosphate esters Benzo(a)pyrene 50-32-8 Chlorfenvinphos 470-90-6 Benzo(g,h,i)perylene 191-24-2 Chlorpyrifos 2921-88-2 Indeno(1,2,3-cd)pyrene 193-39-5 Benzo(k)fluoranthene 207-08-9 Other pesticides Benzo(b)fluoranthene 205-99-2 alpha-endosulphan 959-98-8 Endosulphan thiosulphate 115-29-7 Chlorinated aliphatics Hexachlorobutadiene 87-68-3 Methylene chloride 75-09-2 Trifluralin 1582-09-8 Chloroform 67-66-3 Endrin 72-20-8 Carbon tetrachloride 56-23-5 Dieldrin 60-57-1 Ethylene chloride 107-06-2 Isodrin 465-73-6 C10-C13 chloroalkane 85535-84-8 Aldrin 309-00-2 Chlorinated alkenes Anilides Trichloroethylene 79-01-6 Alachlor 15972-60-8 Tetrachloroethylene 127-18-4 Organometallic compounds Chlorobenzenes Tributyl cation 36642-28-4 1,2,4-trichlorobenzene 120-82-1 Tributyltin compounds 688-73-3 Trichlorobenzenes 12002-48-1 Tributyltin chloride 1461-22-9 Pentachlorobenzene 608-93-5 Tributyltin methacrylate 2155-70-6 Hexachlorobenzene 118-74-1 Bis(tributyltin) oxide 56-35-9 Tetra-N-Butyltin 1461-25-2 Phenols Tetramethyl lead 75-74-1 Pentachlorophenol 608-93-5 Ethyltrimethyllead 1762-26-1 Octylphenols 1806-26-4 Diethyldimethyllead 1762-27-2 para-tert-octylphenol 140-66-9 Methyltriethyllead 1762-28-3 Nonylphenols 25154-52-3 Tetraethyl lead 78-00-2 4-para-nonylphenol 104-40-5 Methylmercury 22967-92-6 Dimethylmercury 593-74-8 Hexachlorocyclohexanes Diethylmercury 627-44-1 Hexachlorocyclohexane 608-73-1 Phenylmercuric acetate 62-38-4 Lindane 58-89-9 Inorganic metal compounds DDT and metabolites Cadmium 7440-43-9 para-para-DDT 50-29-3 Lead 7439-92-1 ortho-para-DDT 789-02-6 Lead acetate 301-04-02 DDD 72-54-8 Mercury 7439-97-6 DDE 72-55-9 Nickel 7440-02-0 Phenyl-urea herbicides Other Diuron 330-54-1 DEHP 117-81-7 Isoproturon 34123-59-6 Pentabromodiphenylether 32534-81-9

Priority pollutant behaviour in household wastewater.
Date submitted: 2008-08-11
File name: D5.2_Final_report[1].doc Page 3
2. Household wastewater streams Although household wastewater has typically been combined and transported as a single waste stream, there is considerable variation in the pollutant and pathogen content of wastewater derived from different activities within the home (e.g. toilet flushing, dish washing, bathing etc.). Thus in considering the possibilities for greater source control as well as safe domestic wastewater reuse it is useful to distinguish between the different household wastewater streams and their characteristic composition, in order to better determine the reuse/recycling potential of each separate fraction and the likely suitability of available treatment technologies.
Household wastewater can be divided into ‘greywater’, ‘yellow water’, ‘blackwater’ and ‘brownwater’ according to the following descriptions:
2.1 Greywater The simplest definition of ‘greywater’ (or ‘sullage’) is that it includes domestic wastewater from all sources except toilets, bidets and urinals. As such, greywater includes the wastewater generated from washing, bathing and cleaning activities in the laundry and bathroom, as well as wastewater from the kitchen. However, greywater definitions vary in terms of inclusiveness, with some authors including kitchen wastewater in this stream and others excluding it. The reason for this is that kitchen wastewater generally has a relatively high organic pollutant loading in comparison to other greywater sources and hence is likely to require more extensive treatment. It is also important to note that when this broader definition is used and kitchen wastewater is included, mulched waste from kitchen disposal units (i.e. sink grinders for disposal of compostable matter) may also be included in the wastewater stream in addition to the wastewater from kitchen sinks and dishwashers. Considering all of the sources contributing to the greywater waste stream in an average household, approximately 55 % of greywater produced is generated in the bathroom, 35 % in the laundry, and 10 % in the kitchen (EPA Victoria, 2006). The proportional distribution between these wastewater fractions may vary according to location however, due to differences in the adoption of water saving devices, and the habits and behaviour of the local people.
2.2 Yellow water
The term ‘yellow water’ is used to denote water contaminated by urine. For example, this could refer to wastewater derived from specially designed toilets that allow urine separation and/or wastewater derived from urinals.
2.3 Brownwater
The term ‘brownwater’ refers to wastewater contaminated by faeces but not urine. As is the case for yellow water, this would typically be derived from specially designed toilets that separate the solid and liquid waste streams.
2.4 Blackwater
‘Blackwater’ is wastewater contaminated by both faeces and urine. This term is also commonly used to refer to combined household wastewater including greywater from all sources, as well as wastewater contaminated by sewage from toilets, urinals, and bidets.

Priority pollutant behaviour in household wastewater.
Date submitted: 2008-08-11
File name: D5.2_Final_report[1].doc Page 4
2.5 Kitchen compost
‘Kitchen compost’ refers to the solid biodegradable organic waste generated from food preparation activities in the kitchen. Throughout Europe, the majority of this waste fraction is either collected for composting and recycling as a soil conditioner, or it enters the combined municipal solid waste stream and is land filled or incinerated. However, in some cases this waste matter may be put through a kitchen compost grinder that macerates the material into smaller fragments which are then washed down the sink into the municipal wastewater system. This type of wastewater has not been dealt with in detail in this report as sustainable waste management approaches in Europe appear to favour the composting of this material instead. Nevertheless, some discussion of the relevance of this practice to source control will be made later in the report.
Priority pollutant behaviour in household wastewater.
Date submitted: 2008-08-11
File name: D5.2_Final_report[1].doc Page 5
3. Characteristics and composition of household wastewater streams A thorough investigation of the literature has revealed a significant lack of data pertaining to the nature of individual waste streams comprising household wastewater. Of the four wastewater streams identified in the previous section, greywater has received the most attention, but even for this waste stream previous research has generally been concentrated on a relatively small set of conventional monitoring parameters (e.g. Biological Oxygen Demand (BOD), Total Suspended Solids (TSS), and nutrients). Coupled to this lack of data is the tendency for household wastewater to be highly variable in composition, being heavily dependent on the dynamics and behaviour of each buildings’ occupants, in terms of their age distribution, lifestyle and water usage patterns. One thing that is certain, however, is that household wastewater can carry a wide range of pollutants, from particles of dirt, food, and lint, to inorganic and organic chemical pollutants, and a variety of pathogenic microorganisms. Unfortunately, it is only relatively recently that the xenobiotic content of household wastewater has begun to attract attention, and the presence and behaviour of the WFD priority pollutants in these waste streams is hence almost entirely unexplored.
As an introduction to this report, some of the likely sources of physical and chemical pollutants from different household plumbing fixtures are identified in Table 2, followed by summary data from previous studies indicating the general composition of the different household wastewater streams (Tables 3 – 6). It should also be noted that the potable water supply used for washing, drinking, flushing and other household activities may also be a potential source of pollutants, particularly if towns and cities are located downstream of other urban areas and wastewater treatment plants, as most water treatment technology currently in use has not been designed to remove micropollutants from the potable water supply. Furthermore, both plastic and metal piping materials used to transport water may also contribute to the pollutant load.

Priority pollutant behaviour in household wastewater.
Date submitted: 2008-08-11
File name: D5.2_Final_report[1].doc Page 6
Table 2: Likely sources of pollutants in wastewater derived from different household sources
Source of wastewater Likely sources of physical and chemical pollutants
Kitchen sink Compostable household waste (if food waste disposer installed in sink), fats, oils, salt, flavours, preservatives, nutrients, soil, food particles, biocide residues, detergents, soaps, and other cleaning agents.
Dishwasher Fats, oils, flavours, preservatives, detergents, soaps, salt, nutrients, food particles, oils and grease, cleaning agents (resulting wastewater can be very alkaline).
Laundry tub/ washing machine
Hair, soil, detergents, washing powders, soap, salt, softeners, bleach, dyes, cleaning agents, preservatives, oil and grease, personal care products, perfumes, faecal/urine contamination, clothing materials and fibres, sediment, organic material unwanted substances (laundry tub), (wash cycle water very alkaline).
Hand basin Soap, shampoo, detergents, preservatives, hair dyes, toothpaste, other personal care products, hair, soil, sediments, organic matter, faecal/urine contamination, cleaning agents
Shower Soap, shampoo, hair dyes, toothpaste, other personal care products, preservatives, soil, sediments, organic matter, hair, faecal/urine contamination, cleaning agents
Bathtub Soap, shampoo, hair dyes, other personal care products, preservatives, soil, sediments, organic matter, hair, faecal/urine contamination, cleaning agents
Toilet Faeces, urine, toilet paper, bleach, cleaning agents, preservatives, unwanted substances disposed of incorrectly (e.g. pharmaceuticals).
Bidet Faeces, urine, bleach, cleaning agents.
Urinal Urine, cleaning agents, faecal contamination.
3.1 Greywater
The physico-chemical characteristics and flow dynamics of greywater are highly variable. This is particularly evident when looking at large scale data where the activities within single households have proportionally greater impacts on greywater composition and properties (Avery et al., 2006). Depending on the activity of the inhabitants, the chemical composition of greywater may vary significantly throughout the day. Greywater typically contains a wide range of pollutants, including: body fats, hair, urine and blood; numerous chemical contaminants derived from cosmetics, hair dyes, personal care products, bleaches, disinfectants, detergents and other cleaning agents; and pathogens such as bacteria, protozoa, viruses and parasites. The specific source of greywater within the home also has a large effect on the pathogen content and type of chemical contaminants present in the water (as indicated in Table 2). For example, the greywater derived from the rinse cycle of a washing machine will be considerably less polluted than most other household wastewater. This is because the clothes should be relatively clean by this stage of the wash and the chemical content derived from cleaning products and softening agents should also be lower. At the other extreme, kitchen derived greywater can include high contents of fats and oils, as well as easily degradable organic compounds that can result in high BOD and primary

Priority pollutant behaviour in household wastewater.
Date submitted: 2008-08-11
File name: D5.2_Final_report[1].doc Page 7
pollution potential. As greywater commonly contains high concentrations of easily degradable organic material, such as the residues from soap and detergents, untreated greywater can rapidly turn anaerobic and malodorous. Some summary characteristics for greywater derived from different household sources are presented in Table 3.
Table 3: General characteristics of greywater from different household sources
Chemical/physical property Bathroom1 Laundry2 Kitchen3 Mixed household4
Temperature (ºC) 18.3 – 31.1 28 – 32 27 – 38 18 – 38
TSS (mg L-1) 7 – 207 120 – 280 235 – 720
Electrical conductivity (µS cm-1) 82 – 1890 190 – 1400 No data 360 – 520
pH 6.4 – 8.6 8.1 – 10 6.3 – 7.4 5 – 8.7
BOD5 (mg L-1) 18 – 550 48 – 380 1040 – 1460 41 – 85
BOD7 (mg L-1) 26 – 300 No data 16 – 47 350 – 500
COD (mg L-1) 46 – 633 725 936 – 1380 495 – 623
Tot-N (mg L-1) 3.2 – 46.4 6 – 21 40 – 74 0.6 – 11
Tot-P (mg L-1) 0.11 – 4.2 0.062 – 57 68 – 74 0.6 – 27.3
Alkalinity (mg L-1) 5.4 – 13.5 83 –200 (CaCO3) 20 –340 (CaCO3)
Chloride (mg L-1) 9.0 – 88 9 – 88 No data 3.1 – 33.4
Sulphate (mg L-1) 52 – 97 No data No data 7.9 – 160
1 Bathroom: Almeida et al., 1999; Burrows et al., 1991; Christova-Boel et al., 1996; Eriksson et al., 2002; Laak, 1974; Ledin et al., 2002; Ledin et al., 2006; Nolde, 1999; Siegrist et al., 1976; Surendran and Wheatley, 1998.
2 Laundry: Siegrist et al., 1976; Almeida et al., 1999; Christova-Boel et al., 1996; Surendran and Wheatley, 1998; Hargelius et al., 1995; Laak, 1974.
3Kitchen: Siegrist et al., 1976; Günther, 2000; Shin et al., 1998; Surendran and Wheatley, 1998; Almeida et al., 1999; Laak, 1974.
4Mixed: Palmquist and Hanæus, 2005; Casanova et al., 2001a; 2001b; Gerba et al., 1995; Hypes, 1974; Santala et al., 1998; Rose et al., 1991; Sheikh, 1993; Jeppsen, 1993.
3.2 Yellow water
Urine diverting toilet systems are as yet relatively uncommon and hence there are only very limited data available relating to the composition of yellow water. Furthermore the amount of water used for flushing can differ quite significantly, resulting in a range of dilution factors and hence varying degrees of urine concentration. Waterless urinals and vacuum flush systems have also been designed. In view of these facts, and the likelihood that urine treatment for both pollutant removal and nutrient/energy recovery will be most effective when the urine is relatively undiluted, data collection has been focussed on undiluted urine. Some general characteristics of urine are presented in Table 4.

Priority pollutant behaviour in household wastewater.
Date submitted: 2008-08-11
File name: D5.2_Final_report[1].doc Page 8
Table 4 Typical composition of fresh and stored urine *
Chemical property Units Fresh urine1 Stored urine2
Total Nitrogen g N m-3 9 200 9 200
Total Ammonia g N m-3 480 8 100
Urea g N m-3 7 700 0
Phosphate (95 – 100% of Total P) g P m-3 740 540
Calcium g m-3 190 0
Magnesium g m-3 100 0
Potassium g m-3 2 200 2 200
Total Carbonate g C m-3 0 3 200
Sulphate (~ 90 % of Total S) g SO4 m-3 1 500 1 500
Chloride g m-3 3 800 3 800
Sodium g m-3 2 600 2 600
pH - 6.2 9.1
Alkalinity mM 22 490
COD g O2 m-3 10 000 10 000
Volume l 1.25 1.25
* Note that the values are based on a volume of 1.25 l which is the average amount produced per person per day.
1 Concentrations according to CIBA Geigy, 1977 (cited in Tettenborn et al., 2007).
2 Concentrations according to Udert, 2002 (cited in Tettenborn et al., 2007).
Daily average urine production is approximately 1.25 – 1.5 l person-1 day-1 (CIBA Geigy, 1977; Roempp, 1997; both cited in Tettenborn et al., 2007). The chemical composition and nutrient contents of urine are recognised to vary throughout the day, with early morning urine generally more concentrated than urine produced later in the day (Tettenborn et al., 2007). It should also be noted that much of the data relating to urine pollutant composition presented in later sections are derived from medical studies which are generally based on 24-hour composite samples. In contrast, yellow water from pilot studies have lower nutrient and pollutant contents as the occupants are not actually resident in the building and early morning urine will not be collected. Organic contaminants may be present in urine either in the dissolved phase or as precipitates, with Höglund (2001) reporting that the concentration of organics is generally higher in the sedimented fraction of stored urine than in the dissolved fraction.
3.3 Brownwater
As noted in the previous section, toilet systems with source separation of faeces and urine are still quite uncommon, and data specific to brownwater flows are, as a result, very limited. Research by Vinnerås and Jönsson (2002), investigating faecal separation for nutrient management and recovery, showed that extraction of nutrients from faeces to flushwater can occur relatively rapidly. This indicates that source separation of faecal material will be most successful if flushwater additions are minimised as far as

Priority pollutant behaviour in household wastewater.
Date submitted: 2008-08-11
File name: D5.2_Final_report[1].doc Page 9
possible and separation is performed locally (preferably at the household level). This would also ensure that the nutrient content and fertiliser potential of composted faecal material is preserved. Data collection for PP contents in this research has thus been focussed predominantly on undiluted faecal matter, although some measurements, such as the general characteristics presented in Table 5, relate to the composition expected after transport and separation in a source separated sewage system.
Table 5 Composition of faeces*
Wastewater parameter
Units Gebers1
(Faeces + toilet paper)
Ekoporten2
(Faeces only)
Proposed Swedish design values3
URWARE model parameter4
Total solids g pe-1 day-1 50.9 35 30.1 30.1
Volatile solids g pe-1 day-1 44.5 23.9
CODtotal g pe-1 day-1 4.57 37.4
BOD7 g pe-1 day-1 3.35 22.6
Ntotal g pe-1 day-1 1.95 1.76 1.5 1.5
Ptotal g pe-1 day-1 0.69 0.60 0.50 0.5
Stotal g pe-1 day-1 0.21 0.162
K total g pe-1 day-1 0.76 1.5 1.0 0.9
* Values relate to the composition expected after transport and separation in a source separated sewage system. Note also that pe-1 day-1 means the excretion from one person during one full day (i.e. 24 hours).
1 Andersson and Jenssen, 2002
2 Weglin and Vinnerås, 2000
3 Vinnerås et al., 2006; and Vinnerås, 2002
4 Jönsson et al., 2005.
Approximately 30 – 45 kg wet weight of faeces (corresponding to 10-15 kg of dry matter) is produced per person per year, with the amount of excreted faeces depending largely on the composition of the food consumed (Vinnerås and Jönsson, 2002). Kujawa-Roeleveld et al. (2003) reported that, on average, people pass faeces once a day, with an average mass of 138 g.
3.4 Blackwater
Source separation of blackwater has also not been widely practiced to date, and data availability is thus restricted to a small number of pilot plants. Table 6 gives some summary characteristics of blackwater from a recent study (based on toilet waste from flush toilets containing faeces, urine, toilet paper, and flush water).

Priority pollutant behaviour in household wastewater.
Date submitted: 2008-08-11
File name: D5.2_Final_report[1].doc Page 10
Table 6 Composition of blackwater* (Palmquist and Hanæus, 2005)
Wastewater parameter Units Average
(Standard deviation)
Range
Q m3 h-1 0.17 (0.01) 0.16 – 0.18
Total phosphorus mg L-1 42.7 (19) 21 – 58
Total Nitrogen mg L-1 150 (26) 130 – 180
BOD7 mg L-1 1037 (545) 410 – 1400
CODCr mg L-1 2260 (1268) 806 – 3138
Total Solids mg L-1 3180 (2000) 920 – 4320
VS mg L-1 2560 (1900) 420 – 3660
pH - 8.94 (0.1) 8.87 – 9.08
* Blackwater sourced from 44 small houses with a population of 141 people (92 adults and 49 children), n = 3.

Priority pollutant behaviour in household wastewater.
Date submitted: 2008-08-11
File name: D5.2_Final_report[1].doc Page 11
4. Household wastewater flows and water use statistics The total household waste load is comprised of multiple component fractions as indicated in the previous sections. These different fractions, including greywater, urine, faeces and toilet paper, as well as biodegradable and other solid waste, contribute varying volumes and loads to the total waste stream. For example, in a study focused on a Swedish housing association community with separate waste flows, it was found that greywater provided 98 % of the total wet mass, compared with only 1.6% from urine and 0.2% from faeces and toilet paper (Figure 1) (Palmquist, 2004). Figure 1 also demonstrates the variation in nutrient and contaminant load contributions from the different wastewater streams. Thus, despite greywater comprising the largest volume of domestic wastewater, its nitrogen (N) content was found to be relatively low (around 9 % of total household wastewater N) whereas urine contained 71 % of the total N load despite comprising only 1.6 % of the total wet mass. On the other hand, the same study found that the phosphorous (P) load was relatively equally divided between the urine, greywater, and faeces/toilet paper waste fractions. These examples clearly indicate the typical variation in pollutant loads between different household wastewater fractions. However, it is also important to recognise that the proportional contribution of the various wastewater flows to the total pollutant loads is highly dependent on the behaviour of the household inhabitants. For example, Otterpohl et al. (2002) reported that a German education campaign that provided information about the environmental effects of excess P and the benefits of low P washing powders met with a very co-operative and positive response from household residents connected to a greywater pilot plant. Choice of plumbing fixtures (e.g. dual flushing toilets or vacuum toilets rather than older style single flush toilets) can also have a large impact on the concentration and volume of waste flows, further indicating the importance of householders’ consumer choices in influencing the subsequent wastewater flows and pollutant loads emanating from their home.
0%
20%
40%
60%
80%
100%
Wetmass
BOD COD N P Ni Pb Cd Hg Sn
Urine Greywater Feaces + toilet paper Biodegradable solid waste
Figure 1: Relative contribution of household waste fractions to total pollutant loads (based on Palmquist, 2004)

Priority pollutant behaviour in household wastewater.
Date submitted: 2008-08-11
File name: D5.2_Final_report[1].doc Page 12
As domestic water supplies, consumption and wastewater flows may differ considerably depending on the locality, a range of water use statistics for two contrasting European member states, Denmark and Italy, are presented below. These 2 countries differ markedly in climate and geography, domestic water availability and consumption.
Current estimates indicate that Danish households use approximately 43% of the national water resources (DANVA, 2007). While this clearly demonstrates that households use a large proportion of the available water resources, it is also evident that Denmark is not a particularly ‘water-stressed’ nation. By contrast, there are parts of Italy (e.g. the regions of Calabria, Sicily and Sardinia) that experience a substantially hotter, drier climate and are considerably water-stressed. For example, recent data from the Italian Department of Statistics (ISTAT, 2004) indicated that only 82.3 % of the total population have sufficient water supply. Of the remaining 17.7 %, 8.7 % have insufficient supply during one quarter of the year, and 9 % have insufficient supply during two or more quarters of the year. Statistics comparing the volume of water pumped through the supply network with the amount consumed by end-users suggest that water losses due to leakages in the supply network systems are compounding the problem of water shortages. For water-stressed nations such as this, the potential for source separated treatment and reuse systems to relieve some of the pressure on water resources is clear.
33%
Laundry
Personal hygiene
Others
Toilet flushing
Cleaning and washing up
Food and drink
Figure 2: Water use distribution in Danish households (Kjellerup and Hansen, 1994)
In Denmark the average per capita water use is considered to be very low, with the average resident using 119 l d-1 (DANVA, 2007). Of this, about 35-37% is used for personal hygiene (showers, hand-basins and baths), 20-27% for toilet flushing, 17-25% in kitchens, 13-15% for laundry purposes, and 5-7 % for other uses including irrigation (Kjellerup and Hansen, 1994). A graphical representation showing the contribution of major categories of water use in Danish households is given in Figure 2. In comparison with Denmark, water use in Italy is much greater, with the most recent national statistics reporting an average domestic per capita water use of 201 l p-1 d-1 (ISTAT, 2004). The differences between these 2 countries are probably due partly to climatic differences (i.e. greater use of potable water for garden irrigation in Italy), and partly to differences in the design of household appliances and plumbing fixtures.

Priority pollutant behaviour in household wastewater.
Date submitted: 2008-08-11
File name: D5.2_Final_report[1].doc Page 13
For example, in Denmark a strategy of increasing public education about water use efficiency and the installation of water saving faucets and low flushing toilets in newly constructed and refurbished housing has evidently resulted in a considerable decrease in domestic water consumption (Kjellerup and Hansen, 1994). On the basis of research which indicated that an information campaign had reduced water consumption by approximately 10%; water saving faucets by 15%; low flushing toilets by 10%; and greywater utilisation for toilet flushing by an additional 10%, Kjellerup and Hansen (1994) advocated using a combination of information campaigns, together with the more widespread application of water saving appliances and water reuse systems. Implementation of all these measures could reduce the potable water consumed by 45 %. This strategy has since been (partly) adopted in Denmark, with the first three measures being implemented in newly constructed and refurbished housing. By 1992 this had yielded a reduction of 41% of water consumption compared with consumption before 1980 (Kjellerup and Hansen, 1994). The greater adoption of such measures in Italy would also be expected to reduce water consumption there. For instance, a demonstration project (AQUASAVE) in the Italian city of Bologna using a pilot greywater/rainwater recycling system and incorporating the use of water saving appliances in bathrooms, kitchens and laundries was able to demonstrate significant water savings, with average water use reduced to 74 l p-1 d-1 (based on 22 residents in 8 apartments) (ENEA, 2001). At this site, 33 % of water was used for personal hygiene activities, 23 % for toilet flushing, 12 % for dishwashing machines and clothes washing machines, 4 % for drinking water and food preparation water, and 28 % for various other uses such as bidets, kitchen sink uses etc.

Priority pollutant behaviour in household wastewater.
Date submitted: 2008-08-11
File name: D5.2_Final_report[1].doc Page 14
5. Priority Pollutants in household wastewaters The concentrations of PPs in source-separated wastewater and also recycled wastewater are dependent on numerous factors, including the chemical inputs to the water during use, the composition of the original potable water source, the effects of transport and separation, and the type of treatment used in processing the wastewater. Unfortunately, as mentioned in the previous section there is a serious lack of data relating to the individual component waste streams comprising household wastewater. There is also a lack of data pertaining to the contents of most household products, and other sources of potential household wastewater pollutants. Data relating specifically to the presence and behaviour of PPs in household wastewater streams are hence also relatively scarce and incomprehensive.
The approach taken for this report has been to initially collect all available published data detailing actual measurements of PPs in household wastewater streams and in major components of relevant waste streams (e.g. in urine and faeces). This information is presented in Section 5.1. As these data are in most cases quite limited, further indirect sources of information indicative of the likely presence of PPs in household wastewater have also been consulted. These sources included the US NIH Household Products Database, and the table of major PP uses produced for Task 4.1 of the ScorePP project. A summary of the information from these secondary data sources and a discussion regarding the implications for PP presence in household wastewaters is presented in Section 5.2.
5.1 Primary data (i.e. measured values reported in the literature)
Following an extensive search of the literature covering the period from 1974 to the present, all data showing the presence or concentration of PPs in each of the separate household wastewater streams (or stream components) is presented in Tables 7 – 10 and discussed in Sections 5.1.1 to 5.1.4. Please note that due to particularly severe data gaps for yellow water and brownwater, the literature search has been concentrated on PP contents in urine and faeces rather than the whole waste stream.
5.1.1 Priority pollutants in greywater
There are major knowledge gaps concerning the characteristics of greywater and the range and concentrations of pollutants that may be present (Ledin et al., 2006). Particularly lacking are studies investigating the presence of xenobiotic organic compounds (XOCs) and their toxicity in greywater. The information in Table 7 indicates that at least half of the PPs have probably never been analysed in greywater, for although it is possible that some may have been measured but not detected and thus not reported, familiarity with this research area lends confidence to the assumption that many of these compounds have never been screened for in source separated wastewaters. Ledin et al. (2006) highlighted the urgent need for broad, well-defined monitoring programmes to fill this knowledge gap, following an earlier study in which they identified nine hundred compounds and compound groups potentially present in Danish greywater owing to their presence in typical laundry and bathroom products (Eriksson et al., 2003). An initial screening of bathroom greywater confirmed the presence of almost 200 such XOCs, including surfactants, emulsifiers, fragrances, flavours, preservatives, antioxidants, softeners, plasticisers, UV-filters, and solvents (Eriksson et al., 2003), so it is clear that a good many chemical pollutants are likely to be found in greywater. These may be sourced either directly from household products, from materials used in the water transport systems themselves, or from contamination of peoples’ skin or clothing during activities such as mechanical work, gardening, household maintenance etc.
In Table 7, PP data from 6 different greywater treatment and recycling systems in Denmark and Sweden are presented. This is apparently all of the available data relating to PP contents in greywater. The data,

Priority pollutant behaviour in household wastewater.
Date submitted: 2008-08-11
File name: D5.2_Final_report[1].doc Page 15
although limited, show that many of the PPs measured were found to be below detection limit in these systems. Nevertheless, some interesting results showing the presence of PPs were recorded. For example, in the BO90 treatment plant levels of chloroform of up to 250 ug l-1 were recorded in influent greywater. Further investigation indicated this to be related to the use of household bleach (Ledin et al., 2006), as chloroform is produced through the haloform reaction of chlorine (contained in bleach) with organic matter (Ivahnenko and Zogorski, 2006). As volatilisation is expected to be an important process affecting environmental partitioning and fate (based upon a Henry's Law constant of 3.7×10⁻³ atm-m3/mole) the presence of harmful aerosols such as chloroform in the bathroom during toilet flushing should be considered when the risks of greywater re-use are being assessed. Chloroform has tested positively for both carcinogenicity and mutagenicity (TOXNET, 2007), indicating that inhalation could seriously affect human health.
Octylphenols (OPs) and nonylphenols (NPs) were also detected at most of the treatment facilities, with the highest recorded value being 5.95 ug l-1 for 4-NP at the Vibyåsen treatment plant in Sweden. As NP and OP use in both countries has been banned and phased out, this would initially appear to be a surprising result, particularly as NPs were present in the influent water at all 6 treatment plants tested. However, recent research has shown that these substances are frequently present in imported textiles, which can then act as an emission source during washing (Höök, 2007; Testfakta, 2007).
DEHP was also consistently found in the influent greywater of all tested treatment plants, at values ranging from 7.5 to 160 ug l-1. As DEHP is used as a plasticiser in PVC applications it is possible that this is sourced from PVC plumbing fixtures. DEHP is also indicated in the United States National Institute of Health Household Products Database (NIH HPD) (http://householdproducts.nlm.nih.gov) as an ingredient in lacquer for personal use. It is unclear whether this indicates hair spray or not, as it is listed under both ‘Personal Care/Use’ and ‘Home Products-Finishing Spray’. However, if it is used in hair sprays this could be an important source of DEHP to greywater and would help explain the recorded values. Personal care products are unfortunately not well represented within the NIH HPD and there is no equivalent European database at present so it is not clear whether this is a common use.
Pentabromodiphenylether (PBDE) was measured and detected in 2 Swedish treatment plants. The highest recorded concentration was 0.76 µg l-1. The use of penta- and octa- BDEs has been restricted in the EU since 2003 (Directive 2003/11/EC: Annex 1, Issues 44 and 45) and the use of PBDEs in new electrical and electronic equipment has been banned since July 2006 (Directive 2002/95/EC). However, these substances are likely to persist in households for many years to come due to previous extensive use in a broad range of products with extended service life such as computer casings, electrical cords, car interiors, clothing, furniture, upholstery, and construction materials.
Tributyltin (TBT) was also present in greywater at the Vibyåsen and Gebers treatment plants. Although the use of TBT biocides (formerly the major use) in all applications should have ceased throughout Europe (Biocides Directive, 98/8/EC), it has previously been reported as occurring in products including tile adhesives and bath caulk (US NIH HPD, 2007). Slow ongoing release from previous applications such as these could thus explain the presence of TBT in greywater. It is also possible that imported items continue to be a source of TBT, which is known to have been used for its antifungal and biocidal properties in laundry sanitisers, hard surface disinfectants, and in textiles. Contaminated clothing/skin of industrial workers or shipyard workers may also still act as a possible source of TBT to greywater as this substance was previously extremely widely used as an anti-fouling agent.

Priority pollutant behaviour in household wastewater.
Date submitted: 2008-08-11
File name: D5.2_Final_report[1].doc Page 16
The concentrations of metals (Cd, Pb, Hg, Ni) in the influent greywaters were not particularly high in comparison with other wastewater (based on data from Henze et al., 1996). The presence of these metals in greywater is attributable to a wide range of sources, including piping and plumbing materials, metal alloyed fixtures such as taps and sinks, and the use of dental amalgam (Hg) etc.
Please see Appendix A for further information on PP uses.

Priority pollutant behaviour in household wastewater.
Date submitted: 2008-08-11
File name: D5.2_Final_report[1].doc Page 17
Table 7 Summary of available data relating to the presence and concentration of PPs in greywater (all values in µg l-1)
Substance name Nordhavnsgården, Denmark1
BO90, Denmark2 Gals Klint Campingsite,
Denmark3
Vestbadet I/S, Denmark4
Vibyåsen, Sweden5 Gebers, Sweden6
Benzene and PAHs Benzene <1.9 Naphthalene <4.5 0.036 (0.029-0.042) Anthracene 0.032 (0.023-0.041) Fluoranthene 0.03 0.034 (0.033-0.035) Benzo(a)pyrene 0.03 (0.02-0.04) <0.01 Benzo(g,h,i)perylene nd-0.04 <0.01 Indeno(1,2,3-cd)pyrene <0.01 Benzo(k)fluoranthene <0.01 Benzo(b)fluoranthene <0.01 Chlorinated aliphatics Methylene chloride <1 <1.0 Chloroform <0.03 (<0.1) <0.1-250 Carbon tetrachloride <0.02 (<0.1) <0.1-1 Ethylene chloride <0.1 <0.5 Chlorinated alkenes Trichloroethylene <0.02 <0.1 <0.050 Tetrachloroethylene <0.02 <0.1 <0.050 Phenols Pentachlorophenol <0.05 < 0.02-0.04 <0.050 <0.05 Octylphenols <0.5 <0.25 <0.1 <0.5 para-tert-octylphenol 0.2 0.11 (0.08-0.16) 0.10 (0.07-0.15) Nonylphenols 0.5-0.6 0.5 0.76 0.9 4-para-nonylphenol 3.8 (2.82-5.95) 0.76 (0.56-1.1) Organometallic compounds Tributyl cation 0.248 (0.209-0.287) 0.004 (0.002-0.006)

Priority pollutant behaviour in household wastewater.
Date submitted: 2008-08-11
File name: D5.2_Final_report[1].doc Page 18
Table 7 cont’d.
Substance name Nordhavnsgården, Denmark1
BO90, Denmark2 Gals Klint Campingsite,
Denmark3
Vestbadet I/S, Denmark4
Vibyåsen, Sweden5
Gebers, Sweden6
Inorganic metal compounds
Cadmium 0.056-0.116 0.056-0.66 2.5 <0.1 0.10 (0.06-0.16) Lead 0.614-0.817 1.1-6.9 1.8 <2 2.52 (2.14-3.14) Mercury 0.125-0.257 0.006-0.25 <0.05 0.13 0.022 Nickel 2.03-2.24 3.86-10.2 1.3 1.5 11.0 (4.45-28.1) Other DEHP 15-16 9.8-39 14 28 57.6 (8.4-160) 15.2 (7.5-20) Pentabromodiphenylether 0.33 (0.17-0.76) 0.011 (0.0048-0.018)
1Andersson and Dalsgaard (2004) 2Ledin et al. (2006), Eriksson and Ledin (2003), Larsen NJ (2006) 3Nielsen and Pettersen (2005) 4Andersson and Dalsgaard (2004) 5Palmquist (2004) 6Palmquist (2004), Palmquist and Jönsson (2003)
Priority pollutant behaviour in household wastewater.
Date submitted: 2008-08-11
File name: D5.2_Final_report[1].doc Page 19
5.1.2 Priority pollutants in urine (yellow water)
As stated earlier, very little research has been carried out regarding the presence of xenobiotic pollutants in yellow water. On the other hand, some medically related research has been conducted to investigate the presence of xenobiotics such as pesticides in undiluted urine, and this literature has been thoroughly reviewed in the search for information on PPs. All relevant data relating to the presence of PPs in undiluted urine are presented in Table 8, which shows that less than half of the PPs have reportedly been measured in urine. As current research in the area of yellow water recycling for nutrient recovery indicates that the less diluted this wastestream, the better for storage and treatment, this information is very relevant to yellow water treatment and reuse. However it is not easy to draw conclusions from these results, as the experimental conditions have varied. In some cases, people have been deliberately exposed to chemicals in order to investigate their metabolism in the human body, whilst other studies are focussed specifically on exposed workers. Diet and habits such as smoking can also affect the concentrations of pollutants (e.g. PAHs) in urine.
Many of the reported studies have focussed on the presence of pesticides in urine, and these substances were generally all detectable. In cases where people had not been specifically exposed, this is most probably due to the presence of pesticide residues in food. The majority of the listed pesticides are now banned in Europe, meaning that household wastewater sources should exhibit a pattern of decreasing emissions for these PPs, although the contamination of food by recalcitrant organic pesticides remaining in the soil may still occur to some extent.
In general, it can be seen that input of PPs into the human body generally leads to excretion, either in the form of the original substance or as a metabolite. The processes are complex and hence difficult to generalise about. Table 8 clearly shows that many metabolites may be formed as these substances pass through the body, with PPs thus not necessarily being fully degraded but transformed. Xenobiotic substances that are ingested or inhaled are either adsorbed and accumulated, or blocked by the intestinal tract and concentrated for excretion in the urine, indicating that the majority of dissolved micropollutants (and hence PPs) are likely to be mainly excreted via this pathway (Maurer et al., 2006). It is therefore clear that urine is a likely source of some PPs and their metabolites, particularly those compounds and metals which may be ingested together with food or inhaled.

Priority pollutant behaviour in household wastewater.
Date submitted: 2008-08-11
File name: D5.2_Final_report[1].doc Page 20
Table 8 Summary of available data relating to the presence and concentration of PPs in urine (all values are in µg l-1).
Pollutant name Min Mean Median Max No. of humans No. of samples Metabolite Reference Benzene and PAHs Benzene 1.4 25.6 4.0 162.5 8 Alkalde et al., 2004 Benzene 0.2 0.4 0.4 1.0 12 smokers Hung et al., 1998 Benzene 0.1 0.2 0.2 0.3 11 non-smokers Hung et al., 1998 Benzene 0.2 0.43 0.4 1.2 36 smokers Skender et al., 2004 Benzene 0.0 0.1 0.1 0.2 36 non-smokers Skender et al., 2004 Benzene <5 26.0 64.0 14 trans,trans-muconic acid Lee et al., 2005 Benzene 13.0 75.0 222.0 21 trans,trans-muconic acid Lee et al., 2005 Benzene 41.0 150.0 432.0 26 trans,trans-muconic acid Lee et al., 2005 Naphthalene 4.0 16.0 49.0 13 15 b-Naphthylsulphate Andreoli et al., 1999 Naphthalene 0.0 62.0 83.0 13 15 b-Naphthylglucuronide Andreoli et al., 1999 Naphthalene 6.0 58.0 89.0 13 15 a-Naphthylglucuronide Andreoli et al., 1999 Naphthalene 14.0 30.0 121.0 13 15 b-Naphthylsulphate Andreoli et al., 1999 Naphthalene 13.0 86.0 147.0 13 15 b-Naphthylglucuronide Andreoli et al., 1999 Naphthalene 21.0 84.0 448.0 13 15 a-Naphthylglucuronide Andreoli et al., 1999 Benzo(a)pyrene 2.5 10.5 25 135 Hara et al., 1997 PAH <0.006 0.0 0.0 19 3-hydroxybenzo[a]pyrene Gundel and Angerer, 2000 PAH 0.4 0.2 19 3-hydroxybenz[a]anthracene Gundel and Angerer, 2000 PAH 1.7 14.3 51.1 22 non-smokers 2-naphthol Jacob et al., 2007 PAH <LOD 1.0 4.6 22 non-smokers 1-hydroxyfluorene Jacob et al., 2007 PAH 0.2 1.6 6.6 22 non-smokers 2-hydroxyfluorene Jacob et al., 2007 PAH 0.0 0.3 1.3 22 non-smokers 1-hydroxyphenanthrene Jacob et al., 2007 PAH 0.0 0.2 0.7 22 non-smokers 2-hydroxyphenanthrene Jacob et al., 2007 PAH 0.1 0.5 2.1 22 non-smokers 3-+4-hydroxyphenanthrene Jacob et al., 2007 PAH 0.0 0.3 2.0 22 non-smokers 1-hydroxypyrene Jacob et al., 2007 PAH <LOD 2.4 17.5 21 smokers 2-naphthol Jacob et al., 2007 PAH <LOD <LOD <LOD 21 smokers 1-hydroxyfluorene Jacob et al., 2007 PAH <LOD 0.1 0.3 21 smokers 2-hydroxyfluorene Jacob et al., 2007 PAH <LOD 0.1 0.5 21 smokers 1-hydroxyphenanthrene Jacob et al., 2007 PAH <LOD 0.0 0.2 21 smokers 2-hydroxyphenanthrene Jacob et al., 2007 PAH <LOD 0.1 0.2 21 smokers 3-+4-hydroxyphenanthrene Jacob et al., 2007 PAH <LOD 0.1 0.2 21 smokers 1-hydroxypyrene Jacob et al., 2007

Priority pollutant behaviour in household wastewater.
Date submitted: 2008-08-11
File name: D5.2_Final_report[1].doc Page 21
Table 8 cont’d.
Pollutant name Min Mean Median Max No. of humans No. of samples Metabolite Reference Chlorinated aliphatics Chloroform 0.008 0.127 3 21 Polkowska et al., 2003 Chloroform <0.001 8.183 17 Polkowska et al., 2003 Carbon tetrachloride <0.001 0.018 17 Polkowska et al., 2003 Chlorinated alkenes Trichloroethylene 0.0 0.1 0.1 0.7 120 Poli et al., 2005 Trichloroethylene 0.3 0.6 1.9 44 Poli et al., 2005 Tetrachloroethylene 0.0 0.4 0.2 3.6 120 Poli et al., 2005 Tetrachloroethylene 9.3 5 Poli et al., 2005 Chlorobenzenes Hexachlorobenzene Detected Pentachlorophenol To-Figueras et al., 2000 Phenols Pentachlorophenol 0.1 0.9 0.5 3.6 38 Thompson and Treble, 1996 Pentachlorophenol 0.5 1.6 1.3 9.1 87 Thompson and Treble, 1996 Pentachlorophenol 1.5 14.7 334 Bartels et al., 1999 para-tert-octylphenol <0.04 6 Kawaguchi et al., 2007 para-tert-octylphenol <0.04 0.1 0.1 0.2 6 Kawaguchi et al., 2007 para-tert-octylphenol <0.3 10 13 Inoue et al., 2003 para-tert-octylphenol <0.3 10 13 beta-Glucuronidase Inoue et al., 2003 Nonylphenols <0.3 110.9 10 13 beta-Glucuronidase Inoue et al., 2003 4-para-nonylphenol <2.9 215 2260 20 20 Mao et al., 2004 4-para-nonylphenol <0.44 6 Kawaguchi et al., 2007 4-para-nonylphenol 0.6 1.4 1.5 2.0 6 Kawaguchi et al., 2007 4-para-nonylphenol <0.3 10 13 Inoue et al., 2003 Hexachlorocyclohexanes Hexachlorocyclohexane 0.5 1.8 125 Total HCH Hura et al., 1999 Lindane 0.4 1.0 125 Hura et al., 1999

Priority pollutant behaviour in household wastewater.
Date submitted: 2008-08-11
File name: D5.2_Final_report[1].doc Page 22
Table 8 cont’d.
Pollutant name Min Mean Median Max No. of humans No. of samples Metabolite Reference Anilides Alachlor Detected Biagini et al., 1995 DDT and metabolites para-para-DDT 3.2 10.3 125 DDT-total Hura et al., 1999 DDE <0.1 1.2 5 Luo et al., 1997 DDE 1.6 7.3 125 Hura et al., 1999 Phenyl-urea herbicides Diuron Detected Pozzebon et al 2003 Triazines
Simazine <10 10.0 20.0 17 Mendaš et al., 2000 Organophosphate esters Chlorpyrifos 21.2 97.0 54 dimethylphosphate Heudorf et al., 2006 Chlorpyrifos 18.7 145.0 54 dimethylthiophosphate Heudorf et al., 2006 Chlorpyrifos 1.1 6.0 54 dimethyldithiophosphate Heudorf et al., 2006 Chlorpyrifos 3.5 12.0 54 diethylphosphate Heudorf et al., 2006 Chlorpyrifos <1 7.0 54 diethylthiophosphate Heudorf et al., 2006 Chlorpyrifos <1 <1 54 diethyldithiophosphate Heudorf et al., 2006 Chlorpyrifos 16.1 751.0 1149 dimethylphosphate Heudorf et al., 2006 Chlorpyrifos 15.2 1668.0 1149 dimethylthiophosphate Heudorf et al., 2006 Chlorpyrifos <1 288.0 1149 dimethyldithiophosphate Heudorf et al., 2006 Chlorpyrifos 2.6 170.7 1149 diethylphosphate Heudorf et al., 2006 Chlorpyrifos <1 82.8 1149 diethylthiophosphate Heudorf et al., 2006 Chlorpyrifos <1 19.3 1149 diethyldithiophosphate Heudorf et al., 2006 Chlorpyrifos 14.0 660 363 dimethylphosphate Heudorf et al., 2006 Chlorpyrifos 8.3 505 363 dimethylthiophosphate Heudorf et al., 2006 Chlorpyrifos <1 71.5 363 dimethyldithiophosphate Heudorf et al., 2006 Chlorpyrifos 3.8 41.7 363 diethylphosphate Heudorf et al., 2006 Chlorpyrifos <1 5304 363 diethylthiophosphate Heudorf et al., 2006 Chlorpyrifos <1 1.6 363 diethyldithiophosphate Heudorf et al., 2006

Priority pollutant behaviour in household wastewater.
Date submitted: 2008-08-11
File name: D5.2_Final_report[1].doc Page 23
Table 8 cont’d.
Pollutant name Min Mean Median Max No. humans No. samples Metabolite Reference Chlorpyrifos 4.0 6.8 8.0 TCPy Hore et al., 2006 Chlorpyrifos Detected 1,3,5-trichloro-2-pyridinol Hernandez et al., 2002 Chlorpyrifos 218.6 6 3,5,6,-trichloro-pyridinol (TCP). Meuling et al., 2005 Chlorpyrifos 0.3 2.1 9.0 322 TCPy Meeker et al., 2006 Chlorpyrifos 0.6 2.7 13.1 322 1-napththol Meeker et al., 2006 Other pesticides alpha-endosulphan 1.8 3.9 10 Arrebola et al., 1999 alpha-endosulphan 1.1 1 Arrebola et al., 1999 Endosulphan thiosulphate 0.5 1.0 10 beta-endosulfan Arrebola et al., 1999 Endosulphan thiosulphate 1.3 1 beta-endosulfan Arrebola et al., 1999 Trifluralin Detected Semchuk et al., 2003 Organometallic cmpds. Tetraethyl lead 18.1 111.9 238.5 15 total lead Vural and Duydu 1995 Tetraethyl lead 4.1 50.2 180.0 15 inorganic lead Vural and Duydu 1995 Tetraethyl lead 3.4 6.6 12.6 15 total lead Vural and Duydu 1995 Tetraethyl lead 2.0 4.8 10.5 15 inorganic lead Vural and Duydu 1995 Other DEHP 12.8 84.3 85.5 164.0 19 Mono-(2-ethyl-5-
carboxypentyl)phthalate Preuss et al., 2005
DEHP 6.3 41.2 36.6 87.7 19 mono-[2-(carboxymethyl) hexyl]phthalate
Preuss et al., 2005
DEHP 7.9 52.1 47.5 96.1 19 mono-(2-ethyl-5-hydroxyhexyl)phthalate
Preuss et al., 2005
DEHP 8.1 41.3 39.7 72.5 19 mono-(2-ethyl-5-oxohexyl)phthalate Preuss et al., 2005 DEHP 3.7 14.0 9.8 49.9 19 Mono-(2-ethylhexyl)phthalate Preuss et al., 2005 DEHP 56.1+/-13.5 52.0 28 2-ethylhexanoic acid, Wahl et al 2001 DEHP 104.8+/-80.6 77.0 28 2-ethyl-3-hydroxyhexanoic acid Wahl et al 2001 DEHP 482.2+/-389.5 336.0 28 2-ethyl-3-oxohexanoic acid Wahl et al 2001 DEHP Detected 28 Wahl et al 2001 DEHP Detected 2-ethyl-3-carboxypropylphthalic acid Weidenhoffer et al., 1996 DEHP Detected di(2-ethylhexyl)phthalate
glucuronide Peck and Albro 1982
Priority pollutant behaviour in household wastewater.
Date submitted: 2008-08-11
File name: D5.2_Final_report[1].doc Page 24
Table 8 cont’d.
Pollutant name Min Mean Median Max No. of humans
No. of samples Metabolite Reference
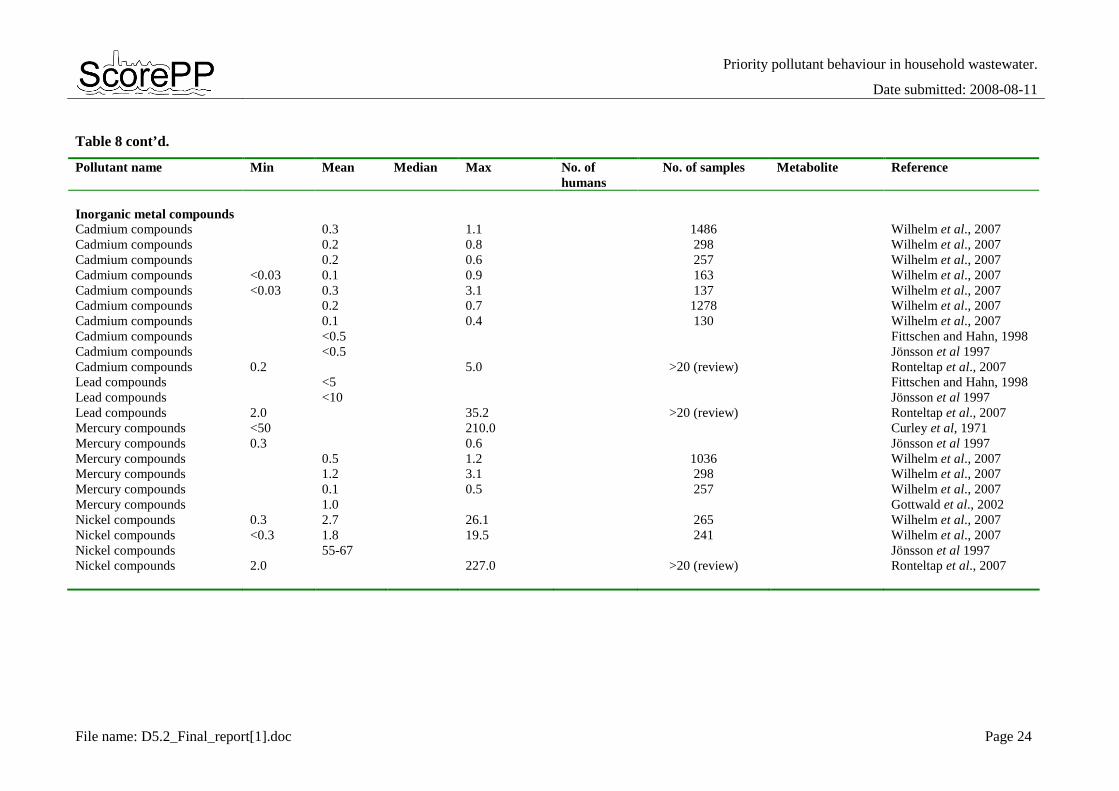
Inorganic metal compounds Cadmium compounds 0.3 1.1 1486 Wilhelm et al., 2007 Cadmium compounds 0.2 0.8 298 Wilhelm et al., 2007 Cadmium compounds 0.2 0.6 257 Wilhelm et al., 2007 Cadmium compounds <0.03 0.1 0.9 163 Wilhelm et al., 2007 Cadmium compounds <0.03 0.3 3.1 137 Wilhelm et al., 2007 Cadmium compounds 0.2 0.7 1278 Wilhelm et al., 2007 Cadmium compounds 0.1 0.4 130 Wilhelm et al., 2007 Cadmium compounds <0.5 Fittschen and Hahn, 1998 Cadmium compounds <0.5 Jönsson et al 1997 Cadmium compounds 0.2 5.0 >20 (review) Ronteltap et al., 2007 Lead compounds <5 Fittschen and Hahn, 1998 Lead compounds <10 Jönsson et al 1997 Lead compounds 2.0 35.2 >20 (review) Ronteltap et al., 2007 Mercury compounds <50 210.0 Curley et al, 1971 Mercury compounds 0.3 0.6 Jönsson et al 1997 Mercury compounds 0.5 1.2 1036 Wilhelm et al., 2007 Mercury compounds 1.2 3.1 298 Wilhelm et al., 2007 Mercury compounds 0.1 0.5 257 Wilhelm et al., 2007 Mercury compounds 1.0 Gottwald et al., 2002 Nickel compounds 0.3 2.7 26.1 265 Wilhelm et al., 2007 Nickel compounds <0.3 1.8 19.5 241 Wilhelm et al., 2007 Nickel compounds 55-67 Jönsson et al 1997 Nickel compounds 2.0 227.0 >20 (review) Ronteltap et al., 2007

Priority pollutant behaviour in household wastewater.
Date submitted: 2008-08-11
File name: D5.2_Final_report[1].doc Page 25
5.1.3 Priority pollutants in faeces (brownwater)
There have been very few investigations into the presence of PPs in faeces. The reported information in Table 9 shows that only 8 of the 67 PPs have been measured in faeces, and of these eight substances, four were metals and one was an organometallic compound (methylmercury). Research has shown that on average, more than 90 % of ingested heavy metals are excreted via the faeces (Vahter et al., 1991). This has implications for the composting and recycling of faecal waste materials to land, as agricultural use cannot be permitted if addition of these materials will cause soil guideline metal limits to be exceeded. Comparison of the EU soil quality criteria metal limits and the values reported in Table 9 is complicated by the different reporting units used but it is nevertheless apparent that faecal metal contents do in some cases (for Cd and Hg but not Pb and Ni) exceed the relevant soil guideline limit values. The limits are 0.5 mg/kg for Cd, 40 mg/kg for Pb, 0.1 m/kg for Hg, and 30 mg/kg for Ni (EU, 2003). It should also be noted that some countries such as The Netherlands and Sweden choose to set their values even lower than the EU guideline values.
The EC Directive most pertinent to the agricultural use of biosolids is Directive 86/278/EEC (CEC, 1986), which was adopted in order to “regulate the use of sewage sludge in agriculture in such a way as to prevent harmful effects on soil, vegetation, animals and man”. This Directive established concentration limits for a number of metals that are typically present within biosolids materials. The concentration limits are effectively ceiling limits, meaning that if biosolids exceed the metal concentration limit for any of the listed metals they are not permitted for land application. Annual loading rate limits for individual metals are also given. These are based partly on soil pH. In most cases the central government of the member state is responsible for developing policies and guidelines to implement the Directive. Regional or local authorities often play a supervisory role. Many of the national regulations are more conservative than the EC Directive in relation to specific metals, with Belgium-Flanders, Denmark, Finland, The Netherlands and Sweden all having lower sludge metal concentration limits than those specified in the Directive. Limit values may be as much as 25 times lower in national guidelines than in the EC Directive. For example, the limit for Cd in the Danish legislation is 0.8mg/kg dry matter as compared to 20-40 mg/kg of dry matter in the Directive (EC, 2003).

Priority pollutant behaviour in household wastewater.
Date submitted: 2008-08-11
File name: D5.2_Final_report[1].doc Page 26
Table 9 Summary of available data relating to the presence and concentration of PPs in faeces.
Pollutant name Units Min Mean Median Max No. of humans No. of samples Reference Benzene and PAHs Benzo(a)pyrene µg person-1 <0.1 5.6-13% 8 Hecht et al., 1979 Chlorobenzenes Hexachlorobenzene ng g-1 (dry weight) 2.2 9.4 3.7 33.6 7 "3 days" Schlummer et al., 1998 Hexachlorobenzene ng g-1 117 28 women pooled 24-h sample To-Figueras et al., 2000 Hexachlorobenzene ng g-1 708 25 men pooled 24-h sample To-Figueras et al., 2000 Organometallic compounds Methylmercury ng/ wet weight 3.02 7.55 7.22 12.29 4 2 per person; 8 in total Ishihara (2000) Inorganic metal compounds Cadmium µg day-1 1.5 10.4 52.9 34 Vahter et al., 1996 Cadmium µg day-1 3.0 22.3 211.8 17 Vahter et al., 1996 Cadmium ppm in dry matter 0.2 Schouw et al., 2002 Cadmium ppm in dry matter 0.3 Schouw et al., 2002 and
references therein Cadmium mg person-1 day-1 0.0 Chino et al., 1991 Cadmium µg person-1 week-1 5.5 8.4 8.7 12.0 15 Vahter et al., 1991 Cadmium mg kg-1 dry matter 0.6 Vinnerås (2002) Lead µg person-1 week-1 10.0 23.0 21.0 40.0 15 Vahter et al., 1991 Lead ppm in dry matter 6.8 Schouw et al., 2002 and
references therein Lead ppm in dry matter 4.4 Schouw et al., 2002 Lead mg day-1 0.2 10 20 Kies and Ip (1991) Lead mg person-1 day-1 0.1 Chino et al., 1991 Lead mg kg-1 dry matter 1.3 Vinnerås (2002) Mercury µg g-1 dry weight 0.07 4.48 1.90 36.00 4 45 Engqvist et al., 1998 Mercury µg g-1 dry weight 0.08 1.49 0.94 4.00 7 Engqvist et al., 1998 Mercury µg kg-1 dry weight <19.1 542 441298 10 (pre- and post-
amalgam removal) Björkman et al., 1997

Priority pollutant behaviour in household wastewater.
Date submitted: 2008-08-11
File name: D5.2_Final_report[1].doc Page 27
Table 9 cont’d.
Pollutant name Units Min Mean Median Max No. of humans No. of samples Reference Mercury µg kg-1 dry weight <17,1 46.1 80.2 10 (control group) Björkman et al., 1997 Mercury mg kg-1 dm 0.3 Vinnerås (2002) Mercury ng (wet weight) 10.63 42.17 50.65 64.19 4 2 per person; total 8 Ishihara (2000) Nickel ppm in dry matter 4.9 Schouw et al., 2002 Nickel ppm in dry matter 3.9 Schouw et al., 2002 and
references therein Nickel mg p-1 d-1 0.2 4 12 Chino et al., 1991 Nickel mg kg-1 dry matter 8.1 Vinnerås (2002)
Other DEHP % of total excretion
of DEHP 10 Peck and Albro (1982)

Priority pollutant behaviour in household wastewater.
Date submitted: 2008-08-11
File name: D5.2_Final_report[1].doc Page 28
5.1.4 Priority pollutants in blackwater
There is very limited data available to inform discussions regarding the presence of PPs in this wastewater stream. Only two studies measuring PPs in blackwater have been identified (Vinnerås, 2002; Palmquist and Hanæus, 2005). Both studies included measurements of Cd, Pb, Hg, and Ni, and some data were also available for PAHs, OP, NP, DEHP, pentabromodiphenylether and TBT (Table 10). All PAHs were recorded as below the detection limit, although the sum of 16 PAHs gave a mean value of 0.3 µg l-1 and a maximum value of 0.9 µg l-1. All metals were quantifiable, with Ni and Pb concentrations consistently higher than Cd and Hg in both studies. As blackwater is also likely to include chemicals derived from toilet cleaning products and plumbing fixtures it is not necessarily the case that all pollutants recorded in this water are derived from human waste. Furthermore, as source separated blackwater systems are relatively uncommon and may differ in their flush volumes etc. it is important to note that this waste stream may be quite variable in pollutant composition.

Priority pollutant behaviour in household wastewater.
Date submitted: 2008-08-11
File name: D5.2_Final_report[1].doc Page 29
Table 10 Summary of available data relating to the presence and concentration of PPs in blackwater*
Pollutant name Units Min Mean Median Max No. of humans No. of samples Reference Benzene and PAHs Naphthalene µg L-1 <0.10 <0.10 3 Palmquist & Hanaeus (2005) Anthracene µg L-1 <0.01 <0.01 3 Palmquist & Hanaeus (2005) Fluoranthene µg L-1 <0.01 0.0 3 Palmquist & Hanaeus (2005) Benzo(a)pyrene µg L-1 <0.01 <0.01 3 Palmquist & Hanaeus (2005) Benzo(g,h,i)perylene µg L-1 <0.03 <0.03 3 Palmquist & Hanaeus (2005) Indeno(1,2,3-cd)pyrene µg L-1 <0.03 <0.03 3 Palmquist & Hanaeus (2005) Benzo(k)fluoranthene µg L-1 <0.01 <0.01 3 Palmquist & Hanaeus (2005) Benzo(b)fluoranthene µg L-1 <0.01 <0.01 3 Palmquist & Hanaeus (2005) Sum of 16 PAHs µg L-1 0.0 0.3 0.9 3 Palmquist & Hanaeus (2005) Endocrine disruptors DEHP µg L-1 <0.1 4.4 3 Palmquist & Hanaeus (2005) 4-para-nonylphenol µg L-1 2.3 4 5 3 Palmquist & Hanaeus (2005) para-tert-octylphenol µg L-1 0.1 0.2 0.3 3 Palmquist & Hanaeus (2005) Pentabromobiphenylether µg L-1 0.1 0.1 0.1 3 (PentaBDE) Palmquist & Hanaeus (2005) Pentabromobiphenylether µg L-1 0.1 0.1 0.1 3 (PentaBDE 99) Palmquist & Hanaeus (2005) Pentabromobiphenylether µg L-1 0.0 0.0 0.0 3 (PentaBDE 100) Palmquist & Hanaeus (2005) Organometallic compounds Tributyltin cation µg L-1 <1.0 3.8 3 Palmquist & Hanaeus (2005) Inorganic metal compounds Cadmium µg L-1 0.17 0.40 0.51 3 Palmquist & Hanaeus (2005) Cadmium mg kg-1 dry matter 0.5 Vinnerås (2002) Lead µg L-1 0.7 2.3 3.7 3 Palmquist & Hanaeus (2005) Lead mg kg-1 dry matter 36.5 Vinnerås (2002) Mercury µg L-1 0.13 0.7 1.0 3 Palmquist & Hanaeus (2005) Mercury mg kg-1 dry matter 0.2 Vinnerås (2002) Nickel µg L-1 5.76 9.2 12.1 3 Palmquist & Hanaeus (2005) Nickel mg kg-1 dry matter 8.7 Vinnerås (2002)
* Blackwater referred to in Palmquist and Hanaeus (2005) is the outlet flow from low-flushing toilets, whereas that referred to in Vinnerås (2002) is faeces + toilet paper.

Priority pollutant behaviour in household wastewater.
Date submitted: 2008-08-11
File name: D5.2_Final_report[1].doc Page 30
5.2 Secondary data on priority pollutants
Due to the limited data availability for PPs in source separated household wastewater, indirect sources of information indicating likely household sources of PPs have also been consulted. In Tables 11 and 12, all available information from the US NIH HPD relating to the presence of PPs in household products is collated. The database contains information about the ingredients of a wide variety of household products, including products for cars, hobbies and crafts, home maintenance, gardening, pest control, indoor use, and pet care. It should be noted however, that some categories of products which are of particular relevance to household wastewater pollution (e.g. personal care products) are not well represented in this database. Furthermore, the database is focused specifically on products for sale on the US market, and not all of these will be available in Europe. At the same time, other products containing PPs may be on the market in Europe but not included in the database. Nevertheless, the HPD does contain some useful information indicating the types of products that the listed PPs have typically been used in. The database was initially compiled in 1995 with the aim of including the most popular brands of selected products. The products to be included have generally been selected according to market share and shelf presence in retail stores. The information in the database comes from the labels on the products, and from the manufacturers' Material Safety Data Sheets (MSDS) and should be relatively up to date, as the database is updated at least twice a year. However, a lag time may occur between the time when a product label or MSDS is changed and the time when the information in the database is updated. This is important to note given that many of the PPs of interest in the ScorePP project may already be subject to phasing out or increasingly restricted use in Europe as well as in the USA.
It is clear from Table 11 that the majority of PPs (48 of the 67, i.e. 71 %) do not appear in the HPD, indicating that their use in the type of household products covered by the database is, at the most, very minor. On the other hand, Table 12 shows that some PPs occur as ingredients in a relatively wide variety of products. A major usage group for the PPs appearing in the database appears to be as solvent based products. For example, benzene, methylene chloride, chloroform, carbon tetrachloride, trichloroethylene, and tetrachloroethylene are shown to be used in various home and automobile cleaning and degreasing products, adhesive removers, paint/varnish removers, and fabric and textile cleaners. The other major PP usage group indicated in the database is that of the biocides, with naphthalene, diuron, alachlor, simazine, atrazine, chlorpyrifos, and trifluralin all recorded as present in household pesticides, herbicides, insecticides, algacides etc.
In addition to the HPD, the detailed list of PP uses prepared for Task 4.1 of the ScorePP project was also consulted and a shortened version is appended to this report (Appendix A). In this edited list, the majority of uses have been included, but those that were obviously far removed from household applications (e.g. use in nuclear reactor fuel rods) have been omitted. In most cases, uses of PPs as captive intermediates or catalysts in chemical syntheses have also not been included, for although it is possible that people working in these industries may bring home contaminated clothing for washing, for example, this is likely to be highly irregular in occurrence and thus not a major source of PPs to the average households’ wastewater. On the other hand, some uses that are now obsolete or banned have still been included (although it is indicated that the use is no longer widespread). This is because it is relatively common for people to retain out of date household chemicals such as pesticides and herbicides. Hence, even though some products may be removed from the market (like many of the biocides included on the WFD priority substances list) it is still possible for them to be

Priority pollutant behaviour in household wastewater.
Date submitted: 2008-08-11
File name: D5.2_Final_report[1].doc Page 31
in use, as some people may not hear of the ban or adhere to it. Thus, these uses are still considered to be potential sources of PPs from households and have been included in Appendix A.
Returning to Table 11, it is apparent that many of the PPs not listed in the database are indeed those which are already subject to restricted use. This includes a number of the pesticides (e.g. hexachlorocyclohexane, lindane, DDT and its metabolites, isoproturon, chlorfenvinphos, endosulphan, endrin, dieldrin, isodrin, and aldrin). The majority of PAHs (which are mostly listed in Task 4.1 as having no known industrial application but which are common by-products of incomplete combustion) are also not represented. Yet, on the other hand, some of the substances not appearing in the HPD are known to be present in household wastewaters. Take, for example, NPs and OPs. These are not listed as ingredients in any household products, and are also increasingly being banned throughout Europe. Nevertheless, as discussed in Section 5.1.1 they still appear in influent and effluent wastewaters throughout Europe, with goods such as imported textile items identified as ongoing sources of these pollutants (Höök, 2007; Testfakta, 2007). This serves to emphasise the complex processes leading to the presence of PPs in household wastewater, and to indicate how difficult it can be to practice complete source control. As a final point, it is noted that although Ni does not appear as an ingredient in many household products in the HPD, it is in fact used in an extremely wide range of household items, particularly in the form of nickel alloys. This is highly evident from the table of PP uses presented in Appendix A, where it can be seen that Ni alloys are used in a wide range of household appliances, and to coat items as diverse as cutlery, jewellery, and taps.

Priority pollutant behaviour in household wastewater.
Date submitted: 2008-08-11
File name: D5.2_Final_report[1].doc Page 32
Table 11 PPs for which there are currently no records in the US NIH Household Products Database (http://hpd.nlm.nih.gov/index.htm, last accessed 9.12.07)
Pollutant Name CAS No. Pollutant Name CAS No. Pollutant Name CAS No.
Anthracene 120-12-7 para-para-DDT 50-29-3 Pentabromodiphenylether 32534-81-9 Fluoranthene 206-44-0 ortho-para-DDT 789-02-6 Tributyl cation 36642-28-4 Benzo(a)pyrene 50-32-8 DDD 72-54-8 Tributyltin compounds 688-73-3 Benzo(g,h,i)perylene 191-24-2 DDE 72-55-9 Tributyltin chloride 1461-22-9 Indeno(1,2,3-cd)pyrene 193-39-5 Isoproturon 34123-59-6 Tributyltin methacrylate 2155-70-6 Benzo(k)fluoranthene 207-08-9 Chlorfenvinphos 470-90-6 Tetra-N-Butyltin 1461-25-2 Benzo(b)fluoranthene 205-99-2 alpha-endosulphan 959-98-8 Tetramethyl lead 75-74-1 Ethylene chloride 107-06-2 Endosulphan thiosulphate 115-29-7 Ethyltrimethyllead 1762-26-1 C10-C13 chloroalkane 85535-84-8 Hexachlorobutadiene 87-68-3 Diethyldimethyllead 1762-27-2 1,2,4-trichlorobenzene 120-82-1 Endrin 72-20-8 Methyltriethyllead 1762-28-3 Trichlorobenzenes 12002-48-1 Dieldrin 60-57-1 Tetraethyl lead 78-00-2 Pentachlorobenzene 608-93-5 Isodrin 465-73-6 Methylmercury 22967-92-6 Hexachlorobenzene 118-74-1 Aldrin 309-00-2 Dimethylmercury 593-74-8 Pentachlorophenol 608-93-5 Octylphenols 1806-26-4 Diethylmercury 627-44-1 Hexachlorocyclohexane 608-73-1 para-tert-octylphenol 140-66-9 Phenylmercuric acetate 62-38-4 Lindane 58-89-9 4-para-nonylphenol 104-40-5 Lead acetate 301-04-02

Priority pollutant behaviour in household wastewater.
Date submitted: 2008-08-11
File name: D5.2_Final_report[1].doc Page 33
Table 12 Records of PPs in household products from the US NIH Household Products Database (http://hpd.nlm.nih.gov/index.htm, last accessed 9.12.07).
Chemical ID Brand Category Form Content (%) Benzene Champion Sprayon Flush Off Degreaser Auto products Aerosol <1 71-43-2 Parks Adhesive Remover Hobby/Craft Liquid Howard Restor-A-Finish Home inside Liquid <.01 Glidden Ultra Hide Alkyd Semi Gloss Interior, Deep Tint Base Home maintenance Liquid 0.1-1.0 Glidden Ultra Hide Alkyd Semi Gloss Interior, Intermediate Tint Base Home maintenance Liquid 0.1-1.0 Naphthalene STP Fuel Injector/Carburetor Cleaner Auto products Liquid 0-2 91-20-3 STP Gas Treatment Auto products Liquid 1-2 STP Octane Performance Booster Auto products Liquid 1-2 STP Oxygenated Gas Treatment Auto products Liquid 0-3 STP Super Concentrated Fuel Injector Cleaner Auto products Liquid 0-2 STP Gas Treatment Auto products Liquid 0-2 STP Super Concentrated Fuel Injector Cleaner Auto products Liquid 0-2 STP Complete Fuel System Cleaner Auto products Liquid 21-42 Dupli-Color High Heat Paint with Ceramic, White Auto products Aerosol 0.4 Dupli-Color High Heat Paint with Ceramic, Orange Auto products Aerosol 0.3 Mercury Marine Premium Plus 2-Cycle TC-W3 Outboard Oil Auto products Liquid 0.03-0.04 STP Fuel Injector/Carburetor Cleaner Auto products Liquid 0-2 STP Gas Treatment Auto products Liquid 0-2 STP Octane Performance Booster Auto products Liquid 0-2 STP Oxygenated Gas Treatment Auto products Liquid 1-2 STP Super Concentrated Intake Valve Cleaner Auto products Liquid 0-2 STP Fuel Injector/Carburetor Cleaner Auto products Liquid 0-2 STP Fuel Injector and Carburetor Treatment 12 Fl. Oz. Auto products Liquid 0-2 Dupli-Color High Heat Paint with Ceramic, Black Auto products Aerosol 0.4 Dupli-Color High Heat Paint with Ceramic, Red Auto products Aerosol 0.4 Dupli-Color Primer Sealer, Gray Auto products Aerosol 0.1 Sherwin-Williams Zinc Clad 5 Organic Zinc Rich Primer Home maintenance Liquid 2 Sherwin-Williams Armorseal Floor Plex 7100 WB Epoxy Floor Coating (Part A), White Home maintenance Liquid 0.5 Sherwin-Williams All Surface Enamel Oil Base Primer, White Primer Home maintenance Liquid 0.3 Spectracide Brush Killer Concentrate Landscaping/Yard Liquid 0.7 Repel Pet and Stray Repellent Pesticides Powder 16.0 Bonide Mosquito Beater Granules Pesticides Granules 4.50 Bonide Shotgun Rabbit & Dog Repellent Pesticides Powder Monsanto Lasso Herbicide (agricultural) Pesticides Liquid >0.09-<0.15 Quail Chotta Per Shrub Killer Pesticides Liquid 0.7

Priority pollutant behaviour in household wastewater.
Date submitted: 2008-08-11
File name: D5.2_Final_report[1].doc Page 34
Table 12 cont’d.
Chemical ID Brand Category Form Content (%) Methylene chloride Carb Medic Carb/Choke/Valve Cleaner Auto products Aerosol 40-50 75-09-2 Gumout Professional Non Flammable Brake Parts Cleaner Auto products Aerosol 5-30 Carb Medic Carburetor Choke and Valve Cleaner Auto products Liquid 60-70 Sprayway Industrial Gasket Remover No. 719 Auto products Aerosol 70-80 Lectra Motive Auto Care Auto products Aerosol 1-20 Anti-Seize Lubricant Auto products Aerosol 60-65 Carb Medic Carburetor Choke and Valve Cleaner Auto products Liquid 40-50 Champion Sprayon Degreasing Solvent Auto products Aerosol 70 - 75 ProsALL Prosolv Auto products Aerosol 70 - 75 Espree Tire Shine Auto products Aerosol 50 Radio Shack Rosin Flux Stripper Hobby/Craft Liquid 39.83 Champion Sprayon Paint Off Hobby/Craft Aerosol 80 - 85 Parks Adhesive Remover Hobby/Craft Liquid 65-70 Klean Strip Deep Down Stain Stripper Home maintenance Aerosol <60 Aqua Mix Sealer and Adhesive Remover Home maintenance Liquid Zinc It Electric Grade Lubricant Home maintenance Aerosol 32 Savogran Kutzit Paint & Varnish Remover Home maintenance Liquid >24 Parks Adhesive Remover Home maintenance Liquid 40-90 Klean Strip Graffiti Remover Home maintenance Aerosol 75-80 Savogran Strypeeze Paint/Varnish Remover Home maintenance Liquid >10 Parks Pro Liquid Paint Stripper Home maintenance Liquid 40-90 Paint & Varnish Remover No. 2600, Aerosol Home maintenance Aerosol Sprayway Vandalism Mark and Stain Remover No. 870 Home maintenance Aerosol 43 Monsanto Amplify Herbicide (agricultural) Pesticides Granules <16 Chloroform Parks Adhesive Remover Hobby/Craft Liquid 67-66-3 Carbon tetrachloride Trim/Detail Adhesive (Kit with Activator) Auto products Liquid 0.01-0.1 56-23-5 Parks Adhesive Remover Hobby/Craft Liquid Radio Shack Plastic Bonder Hobby/Craft Paste <0.05 Trichloroethylene Trouble Free Rust Buster Auto products Aerosol 79-01-6 Sprayway Industrial Cleanup Dry Cleaner No. 732 Auto products Aerosol 45-55 Sprayway Automotive Brake Parts Cleaner No. 706 Auto products Aerosol 45-55 Sprayway Gravel Guard No. 669 Auto products Aerosol <15.0 Sprayway Plastic Spray Clear Fixative No. 201 Hobby/Craft Aerosol 25-35

Priority pollutant behaviour in household wastewater.
Date submitted: 2008-08-11
File name: D5.2_Final_report[1].doc Page 35
Table 11 cont’d.
Chemical ID Brand Category Form Content (%) Trichloroethylene Sprayway Mirror Edge Sealant No. 209 Hobby/Craft Aerosol 25-35 79-01-6 Lectra Clean (Aerosol) Home inside Aerosol 90-99 Sprayway C-60 Solvent Cleaner and Degreaser No. 64 Home maintenance Aerosol 80-100 Sprayway Solvent Cleaner and Degreaser No. 63 Home maintenance Aerosol 80-100 Sprayway Toner Aide No. 208 Home Office Aerosol 10-20 Lectra Clean (Aerosol) Personal care/use Aerosol 90-99 Tetrachloroethylene Lectra Motive Auto Care Auto products Aerosol 70-100 127-18-4 Trouble Free Rust Buster Auto products Aerosol Gumout Professional Non Flammable Brake Parts Cleaner Auto products Aerosol 50-90 Champion Carburetor Cleaner Auto products Aerosol 15 - 20 Champion Sprayon Degreasing Solvent Auto products Aerosol 20 - 25 ProFree Anti Seize Lubricant Auto products Aerosol 45 - 50 ProsALL Prosolv Auto products Aerosol 20-25 Brakleen Brake Parts Cleaner Auto products Liquid >90 Lectra Motive Auto Care Auto products Aerosol >90 Brakleen Brake Parts Cleaner-Bulk Auto products Liquid >90 Sprayway Industrial Cleanup Dry Cleaner No. 732 Auto products Aerosol 45-55 Brakleen Brake Parts Cleaner Auto products Liquid 65-94 Liquid Wrench Supr Lubricant with Teflon Auto products Aerosol 65-80 Champion Sprayon Brake Parts Cleaner Auto products Aerosol <1 ProsALL Propen Non flammable Penetrating Oil Auto products Aerosol 60 - 65 Snap Wire Drier Auto products Aerosol 45-55 Espree Tire Shine Auto products Aerosol 30 Brakleen Brake Parts Cleaner Auto products Liquid >90 Sprayway Automotive Brake Parts Cleaner No. 706 Auto products Aerosol 45-55 Sprayway Industrial Fabric Protector No. 980 Auto products Aerosol 20-30 Pyroil Brake Parts Cleaner Auto products Aerosol 90-100 Aleenes Platinum Bond Patio & Garden Adhesive Hobby/Craft Liquid 70 ARAMCO Art and Crafts Goop, FP Goop Hobby/Craft Liquid Aleenes Platinum Bond 7800 Adhesive Hobby/Craft Liquid 70 Aleenes Platinum Bond Super Fabric Textile Adhesive Hobby/Craft Liquid 70 Hagerty Silversmiths Spray Polish Home inside Aerosol 30.5 Champion Spot It Gone Home inside Aerosol 20 - 25 Plumbers Goop Adhesive and Sealant Home maintenance Paste 67.5 Sprayway Vandalism Mark and Stain Remover No. 870 Home maintenance Aerosol 10 Champion Anti Seize Home maintenance Aerosol 45 – 50

Priority pollutant behaviour in household wastewater.
Date submitted: 2008-08-11
File name: D5.2_Final_report[1].doc Page 36
Table 11 cont’d.
Chemical ID Brand Category Form Content (%) Diuron Jungle No More Algae Tank Buddies Pet Care Tablet 0.67 000330-54-1 Alachlor Monsanto Bullet Herbicide (agricultural) Pesticides Liquid 25.4 15972-60-8 Monsanto Lasso Herbicide (agricultural) Pesticides Liquid 45.1 Monsanto Lariat Herbicide (agricultural) Pesticides Liquid 27.2 Simazine Algae Destroyer Liquid Pet Care Liquid 122-34-9 Algae Destroyer for Freshwater Aquariums Pet Care Tablet 3.5 Atrazine Scotts Bonus S Weed and Feed Landscaping/Yard Granules 1912-24-9 Scotts Bonus S Weed and Feed Landscaping/Yard Granules Scotts Bonus S Weed and Feed Landscaping/Yard Granules Vigoro Ultra Turf Weed & Feed with Atrazine Landscaping/Yard Granules 1.102 Miracle Gro Weed and Feed for St. Augustinegrass Lawns Landscaping/Yard Granules Scotts Bonus S Weed and Feed Landscaping/Yard Granules Vigoro Ultra Turf Centipede Weed & Feed, Landscaping/Yard Granules 1.102 Ortho Weed-B-Gon Spot Weed Killer for St. Augustine Lawns Ready-To-Use Granules Pesticides Granules 0.6 Monsanto Bullet Herbicide (agricultural) Pesticides Liquid 15.3 Surrender Tri-Cure Pesticides Liquid 27.0 Monsanto Lariat Herbicide (agricultural) Pesticides Liquid 15.5 Chlorpyrifos Bonide Termite & Carpenter Ant Dust Pesticides Powder 12.6 2921-88-2 Raid Ant Bait Pesticides Solid 0.03 Hot Shot Maxattrax Roach Bait Pesticides Solid 0.5 Ortho Dursban Lawn & Garden Insect Control Pesticides Granules 1 Home Defense Indoor & Outdoor Insect Killer Pesticides Pump spray 0.5 Ortho Home Care Pesticides Liquid 0.5 Ortho Dursban Lawn Insect Spray 1 Pesticides Liquid 4.38 Ortho Garden Care Pesticides Liquid 5.3 Raid Ant & Roach Killer Pesticides Pump spray 0.25 Real Kill Foaming Wasp/Hornet/Yellow Jacket Pesticides Aerosol 0.25 Spectracide Wasp & Hornet Killer II Pesticides Aerosol 0.25 Ortho Ant Stop Pesticides Powder 1 Home Defense Ortho Klor Soil Insect & Termite Killer Pesticides Liquid 12.6 Ortho Borer & Leaf Miner Spray 1 Pesticides Liquid 10.7 Ortho Dursban Ready-Spray Outdoor Flea & Tick Killer 1 Pesticides Liquid 4.38 Hot Shot Maxattrax Roach Bait Pesticides Tablet 0.5

Priority pollutant behaviour in household wastewater.
Date submitted: 2008-08-11
File name: D5.2_Final_report[1].doc Page 37
Table 11 cont’d.
Chemical ID Brand Category Form Percent Trifluralin Bonide Weed Preventer with Trifluralin Landscaping/Yard Granules 1.47 1582-09-8 Miracle Gro Garden Weed Preventer Pesticides Granules Miracle Gro Garden Weed Preventer and Plant Food Pesticides Granules Nonylphenol Loctite Extra Time Epoxy Hobby/Craft 2-part tube 10-15 25154-52-3 Loctite Quick Set Epoxy Home inside 2-part tube 3-5 Loctite Quickset Poxy Pouch Resin & Hardener Home inside Tube 3-5 Loctite Extra Time Epoxy Home inside 2-part tube 10-15 Ardex P-MC Hardener (Part A & B) (Ardex Moisture Control System) Home maintenance Fluid <=2.5 (Part A) Ardex S 2-K High Performance Two-Component Waterproofing Compound Home maintenance Fluid 10-25 (Hardener) Ardex S-MC Hardener (Part A & B) (Ardex Moisture Control System) Home maintenance Fluid <=2.5 (Part A) DEHP Lacquer Spraying, Clear, TT-L-58E Personal care/use Spray 117-81-7 bis(Tributyltin) oxide Red Devil Interior Wall/Wood Caulk Home maintenance Paste <0.05 56-35-9 Red Devil Glazing Compound Cartridge Home maintenance Caulk tube <0.05 Red Devil House & Home Sidewalk Crack Repair Home maintenance Paste <0.1 Red Devil House & Home Restore Premium Window & Door Caulk Home maintenance Tube <0.05 Red Devil PaintMaster Siliconized Acrylic 25 Year Caulk Home maintenance Caulk tube <0.05 Red Devil PaintMaster Advanced 230 Adhesive Caulk Home maintenance Caulk tube <0.05 Red Devil E Z Caulk Tub and Tile Home maintenance Tube <0.05 Red Devil Concrete/ Mortar Repair Home maintenance Paste <0.1 Red Devil Window, Door and Siding Caulk Home maintenance Paste <0.05 Red Devil House & Home Restore Tile Adhesive Home maintenance Tube <0.05 Red Devil House & Home Restore Premium Kitchen & Bath Caulk Home maintenance Tube <0.05 Red Devil House & Home Restore Driveway Crack Repair Home maintenance Tube <0.1 Red Devil PaintMaster Elastomeric 35 Year Acrylic Caulk Home maintenance Caulk tube <0.05 Red Devil 50 Year Urethane Acrylic Caulk Home maintenance Caulk tube <0.05 Cadmium Astro Gem Glazes, One Stroke Colors, Underglaze Hobby/Craft Aqueous slurry <0.1 7440-43-9 Quikrete Color-PAK, All Colors except Charcoal No. 1318 Home maintenance Powder Nickel Alnox (Standard) Electrical Joint Compound Home maintenance Grease 18-19.5 7440-02-0 Quikrete Color-PAK, All Colors except Charcoal No. 1318 Home maintenance Powder

Priority pollutant behaviour in household wastewater.
Date submitted: 2008-08-11
File name: D5.2_Final_report[1].doc Page 38
Table 11 cont’d.
Chemical ID Brand Category Form Percent Mercury Quikrete Color-PAK, All Colors except Charcoal No. 1318 Home maintenance Powder 7439-97-6 Lead Radio Shack 60/40 Rosin Core Solder Hobby/Craft Solid 7439-92-1 Radio Shack #25 No Clean Solder Hobby/Craft Solid Mayco Ceramic Glaze, Clear Hobby/Craft Liquid Radio Shack Lead Solder Hobby/Craft Solid Radio Shack Rosin Core Solder Hobby/Craft Solid 0-100 Quikrete Color-PAK, All Colors except Charcoal No. 1318 Home maintenance Powder

Priority pollutant behaviour in household wastewater.
Date submitted: 2008-08-11
File name: D5.2_Final_report[1].doc Page 39
6. Household wastewater reuse and recycling options With wastewater recycling typically adopting the concept of using water that is ‘fit for purpose’, the appropriate uses of recycled water depend on both the source of the wastewater and the type and extent of treatment it has undergone. Accordingly, this is a very complex field, encompassing multiple component wastewater streams, a wide range of possible treatment trains and system scales, and numerous reuse and recycling options. The choice of treatment and reuse is dependent on several factors including the volume of greywater to be processed; the contaminants likely to be present, their concentrations and associated health and environmental risks; the possibilities for reuse at the relevant location; and the site characteristics (e.g. soil type, depth to water table, groundwater levels).
The following applications have been proposed for the reuse of treated greywater/ combined household wastewater (Eriksson and Ledin, 2003; Ledin et al., 2006; Sydney Olympic Park Authority, 2006): � toilet and urinal flushing; � laundry use, clothes washing; � concrete production; � irrigation (by manual surface application, sub-soil trench, or sub-surface drip irrigation)
for crops, pasture, horticulture, public areas, parkland, playing fields, and residential gardens;
� infiltration (groundwater recharge); � car washing; � washing windows, brickwork and outdoor areas; � fire protection and fire fighting systems; � industrial uses (e.g. cooling water); � filling ornamental ponds, water features and fountains; � air conditioning cooling water.
It is generally held that recycled water should not be used for human consumption, drinking, showering or swimming, although some relatively water stressed nations (e.g. Singapore) have already begun to carry out planned potable reuse (DTI report, 2006). Nevertheless, other attempts to introduce planned potable reuse (e.g. in Toowoomba, Queensland, Australia; DTI report, 2006) have caused widespread public opposition and it is clear that, unless the water supply situation demands it, non-potable reuse remains preferable. Depending on the level of pollution in the influent water and the pollutant removal efficiency of the treatment employed, the recycled water/waste will be better suited to some reuse applications than to others. For example, if the treatment process results in a demineralised effluent product (e.g. following reverse osmosis) and an industrial facility using demineralised feed water is nearby, it would be preferable to use the water directly for this process, rather than to remineralise it for use in irrigation.
For yellow water and brownwater, reuse options are typically concentrated more on energy and nutrient recovery than on water recycling. For example, concentrated urine can provide a valuable source of nitrogen, phosphorus and potassium; whilst composted faeces can have value as a soil conditioner, containing substantial organic matter as well as the major plant nutrients and trace elements. Aside from nutrient recovery and recycling, other suggested reuse options for yellow water include reuse as toilet flush water, and even potable reuse, although this goal has apparently only been pursued for spacecraft to date, and is less likely to

Priority pollutant behaviour in household wastewater.
Date submitted: 2008-08-11
File name: D5.2_Final_report[1].doc Page 40
be an acceptable reuse option to most earth-based humans. In any case, for the benefits of urine and faecal matter recycling to be realised, it is important to ensure that the potential risks associated with pollutant content are properly assessed. This also highlights the importance of effective source control and treatment.

Priority pollutant behaviour in household wastewater.
Date submitted: 2008-08-11
File name: D5.2_Final_report[1].doc Page 41
7. Current status of household wastewater source separation and recycling
The past decade has seen some important changes in thinking among wastewater experts. Growing interest in more decentralised wastewater treatment has been coupled with a move towards the introduction of source separation (e.g. greywater/ yellow water/ brownwater separation) for more effective treatment of individual wastewater fractions, and an increasing interest in wastewater reuse and recycling. The impetus behind these movements is wide ranging, from recognition that centralised wastewater treatment systems are prohibitively expensive in some settings, to the application of the precautionary principle as a driver for encouraging the introduction of more sustainable waste management systems with better treatment efficiencies for potentially harmful micropollutants. This increasing interest in wastewater reuse and recycling has not been restricted to relatively water-stressed countries, but has been widespread, with sustainable development the major driving force throughout Europe (Ledin et al., 2006); limited water resources the major motivation in countries like the USA, Spain, Israel and Australia (Ledin et al., 2006); and high population density and pressure on water resources providing the stimulus in countries such as Japan (Ledin et al., 2006). Furthermore, water related national security issues can also play a role for countries like Singapore where a large proportion of water has hitherto been imported from neighbouring Malaysia (DTI report, 2006). And yet in spite of the increasing pressures on global water resources and the multiple motivations for wider application of source separation and water reuse and recycling technologies, the current level of adoption of relevant technologies and wastewater management systems is almost universally minimal. This is partly due to a lag in relevant policy development in the vast majority of nations, and partly due to financial reasons. The challenges of risk management and fear of litigation in the case of adverse human health impacts have probably also played a role in stalling the uptake of new technologies in this field.
The cost effectiveness of source separated treatment is difficult to assess as systems are typically quite varied and site specific. However, experience with pilot studies has indicated that financial benefits may not be easily realised, and this may also act as a disincentive to further investment in research and technology development. At the same time, government subsidies and fiscal incentives to encourage source separation have been slow to surface in most countries.
Avery (2006) notes that during the 1990s a number of in-situ tests were carried out on patented greywater recycling systems for individual houses and flats, but the tested systems generally did not perform consistently or satisfactorily over a prolonged period (based on conventional water quality parameters and pathogen contents). It was further suggested that the risks associated with the use of such systems may be unacceptable unless accorded a degree (and cost) of maintenance higher than most householders may be prepared to accept, indicating that greywater recycling is probably more effectively managed on a larger scale than the individual household. At the same time, analyses have shown that greywater recycling is not economically advantageous unless treated relatively close to the source as transport costs can quickly balance out water savings under current pricing systems. Based on Australian data and housing schemes, it has been suggested that communal greywater recycling systems designed to service clusters of 1200 to 12000 households are probably the most economically viable (Dimitriadis, 2005), although there are several examples of smaller community scale systems (e.g. apartment blocks) in Scandinavia that are operating

Priority pollutant behaviour in household wastewater.
Date submitted: 2008-08-11
File name: D5.2_Final_report[1].doc Page 42
satisfactorily (see Section 10). One point that must also be taken into account is the fact that consumers generally expect to pay less for recycled water. A study tour of Australian water recycling schemes showed that all providers were selling the reclaimed water at a lower cost than potable water, despite the fact that it was arguably more expensive to produce (up to 15 times as expensive as potable water for some blackwater recycling schemes inspected). Furthermore, all schemes seemed to need government grants or subsidies to be viable, with very few projects directing their pricing at full cost recovery (DTI report, 2006). The same study showed that despite the successful piloting of two in-building water recycling schemes (MBR treated and disinfected before reuse for toilet flushing) there was a general lack of enthusiasm by the Australian water industry for wider implementation of such schemes, largely due to the relatively high costs involved. Another problem is that the introduction of wastewater separation systems in buildings and areas currently served by combined sewers (i.e. retrofitting premises for dual water supplies) is not economically favourable. For example, Australian estimates indicate that the cost of retrofitting dual reticulation for recycled water is four times that of installing dual reticulation in a ‘new build’ (DTI report, 2006).
Another major barrier and important issue for policy makers and water supply companies is the risk management requirement for implementation of these systems; the perceived difficulties of which may also play a deterrent role in the introduction of source separated treatment. It must be recognised, for example, that dual reticulation systems require considerable effort in terms of ongoing monitoring and maintenance to ensure the safe functioning of the system, as cross connections or misuse could result in serious health risks. Consequently, case studies have shown that recycled water is generally treated to higher than necessary standards (i.e. higher than needed for flushwater) in order to minimise human health risks in the event of misconnections and/or accidental potable use (DTI report, 2006). This precautionary approach may help protect water supply companies and planners against litigation, but it also has considerable cost implications. As risk assessment and management is a major issue influencing the acceptability and application of household wastewater reuse and recycling, further information regarding the risks associated with source separation and treatment is included in Section 10.
In most nations, legislation focussed specifically on wastewater reuse and recycling is not yet well developed. Throughout Europe, the legislation is varied, with some countries (including the UK) providing no water quality targets and little guidance regarding the level of treatment required for reuse (Avery et al., 2006). Moreover the approach to the use of reclaimed water varies from country to country, and even within countries (e.g. for different states or local council areas). Where standards do exist, they focus primarily upon conventional water monitoring parameters such as microbial indicator organisms, organic content, turbidity/ suspended solids and pH, and do not specifically address PPs or other micropollutants. Nevertheless, discharge standards are likely to become increasingly stringent in future, and removal of micropollutants (including endocrine disrupting substances, heavy metals, pesticides, personal care products and pharmaceuticals) is likely to become of increasing concern for wastewater utilities and regulators. Thus, it is important to investigate the efficacy of source-separated treatment for emerging pollutants and non-standard parameters to ensure that treatments can be optimised for the maximum environmental benefit.
Although the uptake of source separated treatment and wastewater reuse and recycling has so far been relatively slow, the situation does look set to change. Steady progress has been made in the design of small-scale water recycling/reuse technologies and many of these systems are

Priority pollutant behaviour in household wastewater.
Date submitted: 2008-08-11
File name: D5.2_Final_report[1].doc Page 43
already available on the market (see Table 12 for some examples). Whilst these small 1-2 household systems are most likely to find application in relatively water stressed countries, larger scale systems using relatively high-tech solutions such as membrane technology are also becoming more common (DTI report, 2006; Melin et al., 2006). Drastic decreases in the cost of membranes and improvements in membrane performance have added momentum to the development of these systems. In fact, Cooper (2001) reported that total operating costs for membrane treatment techniques had dropped by 75 % since 1992. So, although further developments in technology configuration and user acceptance certainly still need to be made (Jeffrey and Temple, 1999), source separated treatment is increasingly feasible from the viewpoint of engineers.

Priority pollutant behaviour in household wastewater.
Date submitted: 2008-08-11
File name: D5.2_Final_report[1].doc Page 44
8. Treatment options – current and emerging Essentially, any technology or process that can be applied in wastewater treatment may also be relevant to source separated household wastewater, suggesting that a vast number of potential treatment options may already be available. Moreover, specialised treatments designed specifically for decentralised source separated wastewater treatment are increasingly being reported in the literature and with source separation still effectively in its infancy this trend is likely to continue. New techniques are increasingly focussed on non-standard parameter removal and/or nutrient recovery in preparation for wastewater reuse. As it is, wastewater recycling schemes are typically very site specific, with many systems still in the experimental/ pilot stage. Ideally, the treatment should be chosen to match the composition of the influent wastewater, and there is therefore no single solution or technology to suit all household wastewater recycling.
As is the case for most wastewater treatment, source separation is generally based on the combination of a series of treatment processes to provide a suitable ‘treatment train’ within the limitations of cost and scale. Numerous different treatment trains can potentially be constructed using the available technologies, and knowledge of the influent composition and characteristics is hence very important when designing the system. Unfortunately, as the previous sections have shown, there are currently serious knowledge gaps regarding the composition and micropollutant load of household wastewater streams, making it very difficult to determine or predict the most effective treatment systems for removing non-standard parameters such as PPs. These may, however, potentially be removed by a variety of established and emerging technologies, including biological wastewater treatment, adsorption on porous media, oxidation (including advanced oxidation) processes, and membrane separation. Higher levels of recycled water quality can be achieved with extended treatment trains, however increasing the complexity of treatment also increases material requirements and energy usage (i.e. costs) (Diaper, 2004). On the other hand, Diaper (2004) also noted that a greater degree of complexity generally decreases the maintenance requirements by allowing automation of maintenance operations such as the desludging of tanks to sewer.
In the following sections, examples of treatment processes and technologies applicable to household wastewater treatment will be summarised. Greywater and blackwater treatment options are considered together in Section 8.1 as the majority of technologies presented are potentially applicable to both waste streams. Indeed, many of the specific treatment trains registered for greywater use are also registered for blackwater treatment (see Table 12). Urine (yellow water) treatment and brownwater treatment are each considered separately (Sections 8.2 and 8.3) as these fractions have agricultural fertiliser potential and are thus generally the focus of more specialised treatment designed to enhance this potential. In addition to the information presented in the following sections the reader may wish to refer to Green and Ho (2005), in which 70 technologies relevant to greywater and blackwater treatment have been identified and classified (according to the relevant waste streams). These authors have also included a sub-classification based on major treatment methods including aerobic digestion, composting and vermicomposting, anaerobic digestion, sand/soil/peat filtration and constructed wetlands.

Priority pollutant behaviour in household wastewater.
Date submitted: 2008-08-11
File name: D5.2_Final_report[1].doc Page 45
8.1 Greywater (and blackwater) treatment
Although it is clear that adequate treatment is essential to ensure that the benefits of greywater/blackwater reuse can be realised without detriment to public and environmental health, there are currently major data gaps concerning the characteristics of these waste streams and the range and concentrations of pollutants that may be present (Ledin et al., 2006). This makes it difficult to select the safest/best treatment system and reuse option for any given situation, particularly as the composition and volume of greywater is apt to vary greatly. Nevertheless, research in this area has been growing and there are now numerous examples of relevant treatment systems currently operating around the world. These systems show a wide range of sophistication, from simple soil filter systems to high-tech membrane bioreactors (MBRs) and are all based on chemical, physical, and biological processes such as settling, flotation, filtration, adsorption, aeration, separation, evaporation, precipitation, anaerobic and/or aerobic digestion, composting, and disinfection (Green and Ho, 2005).
Technologies for greywater/ blackwater treatment are gradually becoming established, with a combination of biological and physical processes often the preferred option (Jefferson et al., 2001a). Small-scale treatment of wastewater with MBR systems coupled with local re-use has been practiced in Japan for some time and is increasingly being introduced throughout Europe, with sports stadiums, shopping complexes and office blocks as typical end users, especially in areas of water stress (Aquarec, 2004; Melin et al., 2006). MBR is thus emerging as a very favourable technology for both greywater and blackwater recycling and has been recognised as a likely market leader (Avery et al., 2006) particularly now that the cost of membranes is rapidly decreasing (Jeffrey and Temple, 1999). Biological aerated filters, rotating biological contactors and constructed wetlands are also frequently used (Avery et al., 2006; Wilderer, 2001) and many greywater pilot plants throughout Scandinavia have been based on these technologies (see Table 13). Meanwhile, treatment of wastewater by chains of lagoons/ponds/wetlands and reuse of the (sometimes chlorinated) effluent for restricted irrigation is a typical treatment and reuse cycle in Mediterranean countries with moderate treatment facilities (Aquarec, 2004). Other treatment options for black and greywater systems include composting and vermicomposting tanks; anaerobic digestion; and sand, soil and peat filters including chemical/sand filter hybrids (Green and Ho, 2005). To date, the most commonly used systems for blackwater treatment are anaerobic septic tanks with soil infiltration units (Green and Ho, 2005), but these are not suitable to all environments as they can contribute to problems such as eutrophication.
In Tables 12 and 13 a selection of greywater treatment trains of varying sizes are described. In Table 14 the component processes for these treatment systems are summarised. Whilst some of the technologies described are typically used in isolation, many of them can be combined for use in more complex treatment trains.

Priority pollutant behaviour in household wastewater.
Date submitted: 2008-08-11
File name: D5.2_Final_report[1].doc Page 46
Table 12 Greywater treatment trains – some small-scale examples designed for single households and certified for use in NSW, Australia by the NSW Department of Health (www.health.nsw.gov.au/public-health/ehb/general/wastewater/gts/index.html)*.
System name Source of greywater Household size Treatment process
Nubian Oasis DGTS Bathroom and laundry Max. 8 persons Solids separation (lint and other coarse material removed, automatic cleaning system) (Nubian Water Systems Pty Ltd) (not kitchen) Feed tank (separated greywater is aerated by direct injection of pressurised air) Treatment module incorporating filtration, adsorption, and biological treatment Treatment module is regularly backwashed, thereby sending contaminants to sewer UV disinfection Ozzi Kleen model GTS10 DGTS All domestic greywater Max. 10 persons Aeration treatment process with 3 main cycles: (Suncoast Waste Water Aeration cycle - aerated and oxygenated using air blower (allows establishment of activated sludge for biodegradation) Management) Settling cycle - Aeration ceases for 60 minutes, activated sludge settles out, clear effluent left on top Decanting cycle - Clear effluent decanted from top. Chlorination of decanting effluent, followed by storage to ensure sufficient chlorine contact time Aqua reviva DGTS Bathroom and laundry Max. 10 persons Collection cell - 700 L (New Water Pty Ltd) (not kitchen) Biological treatment cell - (includes media canisters, and inlet and outlet manifolds for managing treatment canister flow distribution rates) Bromine disinfection unit (BDU) Earthsafe Waterbank WB10 DGTS All domestic greywater Max. 10 persons Lint filter (Earthsafe Waterbank Pty Ltd) Raw water equilisation chamber - periodic aeration tank for mixing, and biodegradation through oxidation 400 L clarification chamber with 100 micron membrane filter UV disinfection - low pressure mercury lamp model TUV 36W AquaReuse DGTS All domestic greywater Max. 10 persons Buffer tank - delivers 25 litres of wastewater to the treatment filter beds every 45 minutes (AquaReuse Pty Ltd) Process rack - Comprises 4 identical process columns (approximately 15 hours retention time) Each process column consists of a stack of 4 gravity fed process cells and a storage cell Process cells are a mixture of filter cloths, peat and earthworms (biodegradation of organic matter) Treated effluent collected in storage cell at base UV disinfection Super Natural GTS All domestic greywater Max. 10 persons 2-stage bioreactor consisting of an upper trickle bed and lower collection chamber (Aqua Clarus Holdings Pty Ltd) During treatment in the bioreactor the liquid is recirculated to the top of the trickle bed. During recirculation part of the liquid is diverted to a membrane tank and pumped through a membrane filter UV disinfection (Solids collected in the base of the bioreactor are pumped to the sewer or to a subsoil vegetation cell outside the tank)

Priority pollutant behaviour in household wastewater.
Date submitted: 2008-08-11
File name: D5.2_Final_report[1].doc Page 47
Table 12 cont’d.
System name Source of greywater Household size Treatment process
Perpetual Water - Home DGTS Bathroom and laundry Sump - 100 L (Perpetual Water Australia Pty Ltd) (not kitchen) Pumped into settling tank - during transfer the greywater is dosed with aluminium sulfate (alum) to induce flocculation Settling process - Settling mode lasts 7 1/2 hours, greywater entering the sump is diverted to sewer during this time Settling tank is discharged by pumping the clear supernatant through 2 filters - 1. The Ballotini filter 2. The Active Adsorption Filter (AAF) Ballotini filter acts as coarse filter to protect AAF from contamination from any particles that didn't settle Daily backwashing – A valve in the bottom of the settling tank is opened and the settled flocs discharged to sewer The filtered water passes through a UV disinfection unit, and then a chlorine dosing unit and into the storage tank Note - sodium hypochlorite is also used in the process but details were not given as to where in the process this occurs
* DGTS = Domestic greywater treatment system.
All systems certified for reuse in toilet flushing, for cold water supply to washing machine, and for garden irrigation. Note that some of these systems are also suitable for blackwater.
All systems generally fitted with an overflow to the sewer, or with an approved land application system in unsewered areas.

Priority pollutant behaviour in household wastewater.
Date submitted: 2008-08-11
File name: D5.2_Final_report[1].doc Page 48
Table 13 Further examples of greywater treatment trains, including several community scale schemes.
Location Country Source of greywater Use No. of households Treatment process References Melbourne Australia Shower, bath Toilet flushing Pre-filter Christova-Boal et al. and/or laundry Mesh-filter (1996). Fine filter chlorination Melbourne Australia Shower, bath Irrigation Pre-filter Christova-Boal et al. and/or laundry Mesh-filter (1996). Fine filter Berlin Kreuzberg Denmark Showers, baths, Toilet flushing 70 persons 4-stage rotary biological contactor (RBC), Nolde (1999) basins RBC includes UV (UV dose 250-400 J m-2). Berlin Wedding Denmark Showers, baths Toilet flushing 1 (2 persons) 2-stage fluidized-bed reactor Nolde (1999) Ryesgade Denmark Bathroom Toilet flushing 18 Collection tank Overgaard Pedersen (2003) Biofilter (2*650l), Smith et al. (2001) Settling tank UV-filter (Danti 15 W) Baldersgade 20-22 Denmark Bathroom Toilet flushing 18 Equalizing tank Ledin et al (2006) Bio filter with gravel, Larsen (2006) Storage tank Pump Fine sieve Carbon filter UV (2*8 W) Light O3 Clean, 2x8W Nordhavnsgården Denmark Bathroom Toilet flushing 84 Sedimentation chamber Andersson & Dalsgaard 3 Rotating Bio Contactors (2004) Sedimentation chamber Sandfilter UV-filter Afd. 47 Virklund Denmark Bathroom Toilet flushing 24 Storage tank Overgaard Pedersen (2003) Biofilter (biobloc) 3*1m3, Smith et al. (2001) Clarification UV-treatment Aqua Cure 6W

Priority pollutant behaviour in household wastewater.
Date submitted: 2008-08-11
File name: D5.2_Final_report[1].doc Page 49
Table 13 cont’d.
Location Country Source of greywater Use No. of households
Treatment process References
LEV huset Denmark Bathroom Toilet flushing 6 Storage tank, Overgaard Pedersen (2003) Biofilter (biobloc 63m3), Smith et al. (2001) Clarification tanks, UV-treatment: Danti UV/15 WP, 15 W Afd. 42 Virklund Denmark Bathroom Toilet flushing 50 Biofilter 4 x 0.8 m3 Overgaard Pedersen (2003) Fine filter Smith et al. (2001) UV-radiation Hedehusene Denmark Domestic laundry Laundry 22 Biofilter 1,48 m3, Overgaard Pedersen (2003) Aeration pump 40l/min Smith et al. (2001) UV-radiation (60l/min, 39W) Folehaven Denmark Laundry Laundry/toilet 940 Settling tank Overgaard Pedersen (2003) Treatment tank, Smith et al. (2001) Treatment aquarium, Horticulture treatment, Sand filter BO90 Denmark Bathroom Toilet flushing 16 Sedimentation chamber, Eriksson & Ledin (2003) Aerated sandfilters (sand + other iron-based sorbents) Ledin et al (2006) (200 L, 40% porosity i.e. ~ 80 L H2O) Larsen (2006) Planned H2O2 treatment but this wasn't applied Gals Klint Campingsite Denmark Bathroom Toilet flushing Settling tank Nielsen & Pettersen (showers and basins) Inlet buffer tank (pumping station with buffer volume) (2005) Biological sandfilter Recycling buffer tank (storage tank for biologically treated greywater) Installation for disinfection (installation for dosing; hydrogen peroxide (35%)) Vestbadet I/S Denmark Shower rooms Toilet flushing Collection tank Andersson & Dalsgaard (Public gym) Double sand filter (serial 250 L; 350 kg sand/filter) (2004) Oxymat system for oxygen supply (Oxymat, type 20 LE, capacity 1,5 Nm³/h, oxygen 93%, pressure 5.0 bar) UV-light treatment (Sterilight SQ8 Gold), Reservoir Palma Beach Spain Baths and basins Toilet flushing 81 Nylon sock filter (0.3 mm mesh and 1 m 2 surface of filtration), March et al. (2004) Sedimentation Disinfection - Sodium hypochlorite

Priority pollutant behaviour in household wastewater.
Date submitted: 2008-08-11
File name: D5.2_Final_report[1].doc Page 50
Table 13 cont’d.
Location Country Source of greywater Use No. of households
Treatment process References
Technion campus 1 IS Light greywater Toilet flushing 48 Fine screen (FS) Friedler et al (2005) Equalisation basin (EB) Friedler & Hadari (2006) Rotating biological contactor (RBC) Sedimentation basin (SB) Pre-filtration storage tank (PFST) Sand filtration (SF) Disinfection Technion campus 2 IS Light greywater Toilet flushing 48 Fine screen (FS), Friedler et al. (2006) Equalisation basin (EB), Stand alone filtration unit (SFEB): gravity filter 0.1 m diameter, quartz sand (Sand - size 0, d10 0.63 mm, d60 0.78 mm, UC 1.24, porosity 0.36) Sand media in filter supported by a gravel layer (diameter 2.2 mm). Filtration rate 8.3 m h-1 (equivalent to 0.065 m3 h-1). Chlorination Technion campus 3 IS Light greywater Toilet flushing 48 Fine screen (FS), Friedler et al. (2006) Equalisation basin (EB), MBR with aeration basin (0.1 m3, hydraulic residence time 5-8 h). (2 modules of 4 parallel tubular polysulphone cross flow UF membranes) (BTU-P4V/02AE membranes, Berghoff GmbH; Germany; MWCO 100,000 Dalton, diameter 0.0115 m) Total membrane surface area 0.34 m2 (8 membranes). Chlorination Vibyåsen Sweden "Greywater" Outdoor pond 47 Sedimentation unit, Palmquist (2004) Biological treatment step (attached biofilm on Puracomb™), This is an open (outdoor) system draining into a small pond HIK Sweden Greywater, roof runoff Handwashing 765 persons Greywater pumped to a fascine together with roof runoff Dyck-Madsen et al (1999) Toilet flushing Seeps into Pond 1 Ponds Constructed bed (contains soil and lime) Pond no. 2 Constructed bed (contains soil and lime) Pond no. 3 Collection well Particle filter, UV-filter Storage tank

Priority pollutant behaviour in household wastewater.
Date submitted: 2008-08-11
File name: D5.2_Final_report[1].doc Page 51
Table 13 cont’d.
Location Country Source of greywater Use No. of households
Treatment process References
Ekskogen holiday Sweden Kitchens, bathrooms, Soil infiltration 269 Stone caisson Jacks et al (2000) village washing machines Soil infiltration Willow bed no. 5 Denmark Kitchens, bathrooms, Willow beds 1 Willow treatment beds (Surface area 960 m2) Stubsgaard (2001) washing machines GROW greywater UK Baths, handbasins, Toilet flushing 1 office block Pumped from storage tank via a filter to the treatment system Avery et al., 2006 recycling system showers (London); Gravity fed through a ‘mini-reedbed’ (series of parallel planted channels) www.wwuk.co.uk/grow.htm (2 sites: London; 17 Student flats (System incorporates both horizontal & vertical flow) Cranfield) (Cranfield) (Substrate: Optiroc (lightweight clay aggregate) & gravel Disinfection: 25W UV lamp, or chemical disinfection (Disinfection not included at London office block site) Millenium Dome, UK Handbasins Toilet flushing 120 m3 d-1 Biological aerated filter (BAF) Birks et al. (2004) London Urinal flushing (System includes nutrient dosing and foam suppression system) Thames Water, 2002 Mixed with treated rainwater & groundwater Hills et al. (2002) Ultrafiltratiom Reverse osmosis Sodium hydroochlorite dosing to maintain chlorine residual (Would not have met guidelines for toilet flush water after BAF only) (Concluded that a physical barrier method such as UF was also required)

Priority pollutant behaviour in household wastewater.
Date submitted: 2008-08-11
File name: D5.2_Final_report[1].doc Page 52
Table 14 Treatment components and process descriptions relevant to greywater and blackwater treatment.
Treatment type (process)
Description of treatment
Screening / Filtration � Many different types of filter are used in wastewater treatment. The choice of filter depends largely on the amount of water to be filtered, the type of contaminants present, and the intended reuse purpose. Pre-filters are often incorporated to increase the effectiveness of subsequent treatment steps, and to protect more delicate components later in the treatment train from damage.
� The mesh/pore size of filters varies greatly, from coarse stretch filters that remove large particles, lint and fibres, to membrane filters designed for microfiltration, ultrafiltration, nanofiltration, and reverse osmosis.
� Substrates sand as sand and soil are also frequently implemented as filter media in greywater treatment systems such as soil filters, reed beds, slow sand filters, and multi-media filters. The advantage of using these substrates for filtration is that sorption can also play a role in removing pollutants from the wastewater.
� Filters can be either gravity filters (for low volumes) or pressure filters (for relatively high flow rates).
Slow sand filters � Comprising shallow layers of stone, and gravel beneath a deep layer (i.e. 60 – 150 cm) of sand. Slow sand filters require regular cleaning and replacement of the top layer of media.
Multi-media filters � Filled with a variety of media in order of increasing size (e.g. fine sand, coarse sand, gravel, stone, and wood chips) to a total depth of approx. 1 m. Multi-media filters require less frequent cleaning than slow sand filters, although when maintenance is required all layers must be cleaned or replaced.
Vertical soil filter/ infiltration unit
� To be suitable for filtering, the soil should be deep, well drained and not too coarsely or too finely textured. If the natural soil is not suitable, a sand filter with a drainage layer in the bottom for collecting and discharging treated water can be constructed instead. The effluent would typically be distributed evenly over a subsurface disposal system. Vertical soil filters are often planted with reeds or other vegetation. If the water from the infiltration unit is collected for further treatment, reuse or released into a receiving water body, the terms sand filter trenches, biofilters or constructed wetlands are used.
Activated carbon filters � Activated carbon is a highly porous material with a very large surface area. Activated carbon can be produced
from a variety of carbonaceous source materials, and granular activated carbon (GAC) filters typically incorporate charcoal, cellulose, or ceramic filter media that must be cleaned or replaced regularly. The effluent is typically passed through a packed bed of GAC with a contact time of less than 30 minutes. Hydrophobic interactions are the dominant mechanism for removal of most organic compounds in activated carbon systems, although ion exchange reactions can also play a role in the removal of polar solutes.
Membrane Filtration � Membrane filtration systems are pressure driven systems based on the use of semi-permeable membranes. Options include microfiltration, ultrafiltration, nanofiltration and reverse osmosis. The major difference between these treatment types relates to the pore size of the membranes and hence the size of the molecules that can be retained.
� Membranes are often made of organic polymers, although new types of inorganic polymers as well as ceramic and metallic membranes are currently under development. A major contributor to the energy demand for these systems arises from membrane fouling, which blocks fluid flow across the membrane. Disposal of the concentrated retentate stream needs careful consideration, since this stream contains all pollutants removed during treatment.
Microfiltration � Microfiltration is a low-pressure cross-flow membrane process for separating colloidal and suspended particles. Membrane pore sizes typically range from 0.1 to 10 µm and can remove particles down to a molecular weight of 200000. Microfiltration can remove many microorganisms from wastewater but not viruses. Dissolved substances will also not be removed unless they are first adsorbed to particulate matter (e.g. activated carbon) or coagulated.
Ultrafiltration � Ultrafiltration is a selective fractionation process using a membrane pore size of approximately 0.01 µm and pressures up to 145 psi (10 bar). Many microorganisms can be removed by this process as well as some viruses. Suspended solids and solutes of molecular weight greater than 1000 are concentrated in the retentate, whilst the permeate typically contains low molecular weight organic solutes and salts.
Nanofiltration � Nanofiltration membrane filters have a pore size of around 0.001 µm and can remove suspended solids, most organic molecules, nearly all viruses, most natural organic matter, and a range of salts (i.e. divalent ions). The permeate typically contains monovalent ions and low molecular weight organic compounds.
Reverse osmosis � Reverse osmosis filters have a pore size of 0.0001 µm and can filter liquids on a molecular scale. Water is fed under pressure through a series of spiral-wound, polyamide membrane elements. The permeate is essentially demineralised water (even monovalent ions are removed) that is also free from bacteria and viruses. RO systems require large motors to overcome osmotic forces and requires pre-treatment to prevent blockage.
Physical / chemical treatment processes
� A range of physical and chemical treatment processes are applicable to greywater and blackwater treatment, including coagulation and flocculation, precipitation, sorption, sedimentation, and photolysis. Most of these processes are relevant to multiple treatment options rather than being actual treatment options themselves.
Coagulant addition / flocculation/ precipitation
� Metal salts such as aluminium sulfate or ferric chloride are commonly added in wastewater treatment. These salts hydrolyze and nucleate, forming precipitates of metal oxyhydroxides which adsorb dissolved contaminants and enhance removal of contaminant particles (such as clays and particulate organic matter) by increasing collision frequency and hence flocculation and settling.
Adsorption � Adsorption of pollutants to substrates such as organic and inorganic particulate matter or activated carbon is an important part of many treatment processes. For example, removal of particulate matter by sedimentation or filtering can also remove sorbed pollutants from the wastewater.

Priority pollutant behaviour in household wastewater.
Date submitted: 2008-08-11
File name: D5.2_Final_report[1].doc Page 53
Table 14 cont’d
Treatment type (process)
Description of treatment
Physical / chemical treatment cont’d
Sedimentation � Organic material and larger particles can be settled from wastewater using a sedimentation or settlement tank. Such tanks can also function as equalisation basins regulating the raw wastewater inflows and outflows to the following treatment stages, and moderating the quality and temperature of the wastewater. The tanks may also be self-cleaning with settled sludge automatically removed at intervals.
Photolysis � Direct exposure to UV-light (and hence sunlight) can initiate chemical reactions leading to the degradation of organic pollutants. In natural systems, photolysis is most relevant to the surface layers of water bodies, as the effects at depth are limited due to rapid attenuation of sunlight and light scattering by particulate matter present in the water column. Substances differ in their photodegradability, as represented by differences in the photo-degradation half-life.
Volatilisation � The process of volatilisation plays a role in numerous treatment options, ranging from general aeration due to the effects of wind on the surface layers of pond systems to deliberate steam stripping of volatile compounds. The amount of a substance that can be volatilised is dependent on its vapour pressure, as well as the local temperature and air flow conditions.
Pond and wetland systems
� Ponds, reedbeds and constructed wetlands are common components of greywater treatment trains. The number of ponds in the treatment chain and the type of flow can vary, as can the retention time. The size of constructed wetlands also varies from small rooftop systems such as the GROW system (http://www.wwuk.co.uk/grow.htm) to large-scale wetland systems serving whole community areas (e.g. WRAMS, Sydney Olympic Park).
� Reedbeds and constructed wetlands use a variety of substrates and vegetation types. The key functions of plants in treatment wetlands are thought to be provision of surface area for microbial degradation, generation of oxygen in the rhizosphere, and maintaining hydraulic conductivity (ref) although there is some debate regarding the importance of plants for pollutant removal in constructed wetlands (Avery et al., 2006)
Constructed wetlands � Constructed wetlands are specially designed waterbodies that can be used in the treatment and recycling of wastewater effluent. The term is used to refer to an area that is regularly saturated by surface and/or groundwater and hence hosts a prevalence of plant species adapted to saturated soil conditions. Any standing water is generally less than 1m deep. Wetlands support a significant biomass of benthic algae and macrophytic epiphytes or biofilm.
� Most constructed wetlands are horizontal flow systems with the influent being directed either through the substrate (sub-surface flow systems) or across the surface of the substrate (surface flow systems).
Lagoons or Pond systems
� Small, permanent water bodies which are constructed by excavating natural earth basins. They may be lined to prevent infiltration. Vegetation may be introduced to assist with the pollutant removal process.
Reed beds � An excavated void (lined to prevent seepage of wastewater to the environment) filled with gravel, soil or sand and planted with reeds. The water is delivered either over the surface of the system (vertical flow), or via a feeder trench at the front end of the system (horizontal flow). Many reed beds are sub-surface flow systems where the water flows below the bed surface, but some systems are designed for the water to flow above the surface, and treatment occurs much as it would do in a vegetated pond system.
Biological treatment
� Biological treatment methods are dependent on a range of microbially-mediated processes which result in the transformation, sorption, biodegradation, or mineralisation of wastewater pollutants. Both anaerobic and aerobic microorganisms (including bacteria, fungi, and actinomycetes) may play a role in these processes.
Trickling filters and biorotors
� These systems purify water by using attached biofilm in filters which are heavily loaded with water. A filter media with a large surface area and large pores is used. These systems are compact but cannot achieve the same level of removal efficiencies as soil filters and also create a sludge which needs to be dealt with.
Rotating biological contactors (RBCs)
� Rotating biological contactors consists of circular disks rotating through wastewater. The rotating action ensures aeration. A large biofilm surface area develops on the rotating disks, which is dependent on the continued transfer of oxygen and substrates. These systems range from extensive land systems to intensive and energy-demanding applications such as trickling filters and biorotors.
� In the case of staged biological reactors, separated basins in a series of independent cells are used. The treatment efficiency is dependent on the number of cells, (i.e. 2 - 4 cells can be used for BOD removal, whereas more than 6 may be needed for nitrification.
Activated sludge systems � In active sludge treatment, bacteria digest organic material in the wastewater, significantly reducing the organic material and hence BOD and COD. In the process, nitrogen, phosphorus, inorganic substances and pathogens are also reduced. The pathogen reduction is due to competition, digestion and sedimentation.
� It is noted that the typically low content of carbon and nutrients in greywater does not favour active sludge treatment (Ottosson, 2003).
Biological Aerated Filters
� These combine two process operations in one plant unit. A typical BAF system comprises a 2-3 metre deep bed of porous granular media with a grain size of 2-6mm. Process air is introduced through the floor of the unit. Biomass growth occurs on the granular media, with the high specific surface area of this media allowing a high concentration of attached biomass. After settling, the wastewater flows down through the bed. Both aerobic biological treatment and biomass separation take place, resulting in the removal of organic matter, solids filtration and nitrification.

Priority pollutant behaviour in household wastewater.
Date submitted: 2008-08-11
File name: D5.2_Final_report[1].doc Page 54
Table 14 cont’d
Treatment type (process)
Description of treatment
Biological treatment cont’d.
Membrane bioreactor (MBRs)
� A membrane bioreactor (MBR) combines the activated sludge process with a membrane separation process, thus providing both physical and biological treatment. The reactor is operated similarly to a conventional activated sludge process but without the need for secondary clarification and tertiary steps like sand filtration. Low-pressure membrane filtration, either microfiltration (MF) or ultrafiltration (UF), is used to separate effluent from activated sludge, with membrane panels inserted directly into the activated sludge aeration tank. This allows operation without a settlement stage (generally the most unreliable part of the AS process), eliminates a substantial amount of piping, and produces a disinfected effluent with no TSS which could thus be reused for a secondary purpose.
� Sufficient pre-treatment has to be installed to prevent clogging of the membranes by fibres, hairs, etc. Controlling membrane fouling is the key issue in the operation of an MBR. Severe membrane fouling occurs above a critical permeate flux or at too low aeration rate.
� MBR systems offer the option of independent selection of hydraulic retention time (HRT) and sludge retention time (SRT), which permits a more flexible control of operational parameters. High sludge concentrations in the bioreactor allow efficient treatment of high-strength wastewater, and the retention of activated sludge and long sludge age allows the development of specialised, slow-growing microorganisms able to remove low-biodegradable pollutants contained in wastewater, resulting in improved removal of recalcitrant compounds.
Conventional and Advanced Oxidation Processes/ Disinfection
� A range of oxidants including chlorine, chloramines, chlorine dioxide and ozone are used in water and wastewater treatment for disinfection purposes. These oxidants may also induce the transformation of organic compounds present in the aqueous streams to which they are applied.
� Disinfection is usually the last treatment process and is used to treat microorganisms rather than pollutants, but depends on the prior treatment processes for its efficiency. Although this report does not deal with the presence and removal of pathogenic microorganisms from wastewater, it is important to recognise that the effectiveness of the disinfection step is dependent on the effectiveness of pre-treatment to lower the BOD and suspended solids to produce a clear effluent that is low in organic matter (NSW Health, 2000). Furthermore, it is also possible for some disinfection processes (e.g. chlorination) to have an effect on the chemical content of the wastewater which in some cases could even lead to the formation of more toxic substances that may be cause for concern.
Chlorination � Traditionally the most common method for disinfection. When added to water, chlorine forms hydrochloric acid (HCl) and hypochlorous acid (HOCl). Under alkaline conditions HOCl (pKa = 7.5) dissociates to the hypochlorite anion (OCl-). Both HOCl and OCl- are strong oxidants. Pre-treatment is very important as organic material in wastewater may combine with the chlorine and reduce the amount available for disinfection. Byproducts may be a problem as chlorine can react with other substances in the water.
Chlorine dioxide
� Chlorine dioxide (ClO2) is a relatively stable free radical that can be used as an oxidant or disinfectant for wastewater treatment. Thought to have a lower tendency to produce chlorinated byproducts than chlorine.
Ozonation � Ozonation works in a manner similar to chlorine disinfection in that a reactive gas is introduced into the wastewater stream to chemically disinfect it. However, ozonation does not have the disadvantage of introducing chlorinated organic compounds into the wastewater stream.
� Ozone is a powerful oxidant. It can oxidize substrates either directly, or indirectly by producing hydroxyl radicals that react in turn with organic compounds, bicarbonate anions, bromide, etc. The direct and indirect pathways compete for oxidizable substrates. The activation barrier for direct oxidation of organics by aqueous ozone is much larger than that for oxidation by hydroxyl radicals, but the concentration of molecular ozone is much larger than that of the radicals. Because the production of hydroxyl radicals is facilitated at high pH, the hydroxyl radical-mediated oxidation pathways tend to dominate under those conditions, while direct oxidation with molecular ozone dominates under acidic conditions.
Chloramination � A form of disinfectant based on chlorine and ammonia. Provides a longer lasting residual in the distribution system compared to free chlorine.
Iodine � Used as a disinfectant. Fast-acting, less affected by organic material than chlorine, persists longer, and may be more effective at high pH.
Peracetic acid � A strong disinfectant with a wide spectrum of antimicrobial activity. Short contact time, small dependence on pH, no persistent toxic or mutagenic residuals or byproducts. Major disadvantage is increased organic content in effluent due to presence of acetic acid (i.e. increased potential for microbial regrowth) and relatively high cost.
UV treatment � UV radiation produced by a mercury arc lamp penetrates the cell wall of pathogenic microoganisms, affecting their genetic material and retarding their ability to reproduce. This treatment is effective for most viruses, spores and cysts and does not involve the use of hazardous chemicals like the chemical disinfectant treatments do.
Advanced Oxidation Processes (AOPs)
� These processes are mediated by free-radical reactions and include the application of ozone, hydrogen peroxide, and ultraviolet light, either individually or in combination. AOPs can break down a range of organic contaminants although complete conversion to CO2, H2O, etc. is not probable in most cases and some degradation products formed by these processes may also be hazardous. This treatment does have the advantage of being a destructive process however, rather than forming a concentrated pollutant phase.
References: Andersson and Dalsgaard (2004); Avery et al. (2006); Crittenden et al. (1999); DTI (2006); EcoSanRes (2005); Huang and Sedlak (2001); Huang et al. (2001); Jeffrey and Temple (1999); Kadlec and Knight (1996); Melin et al. (2006); Nghiem et al. (2005); NSW Health (2000); Ottosson (2003); Schaefer et al. (2003); Snyder et al. 2003; Ying et al. (2004).

Priority pollutant behaviour in household wastewater.
Date submitted: 2008-08-11
File name: D5.2_Final_report[1].doc Page 55
8.2 Yellow water treatment
Urine/yellow water treatment and recycling is not yet commonly practiced throughout Europe, however the idea is certainly growing in popularity and a recent increase in related research has been evident (e.g. Larsen et al., 2001; Wilsenach and van Loosdrecht, 2003; Peter-Fröhlich et al., 2004; Ronteltap et al., 2007; Tettenborn et al., 2007). This is because human urine, despite being a comparatively small waste stream in terms of volume, is the largest contributor of nutrients to household wastewater (contributing 80 - 90 % of the total nitrogen and 45-70 % of the phosphorus in combined wastewater) (Larsen and Gujer, 1996; Hanaeus et al., 1997; Wilsenach and van Loosdrecht, 2004; Wilsenach et al., 2005). Source separated treatment of yellow water with nutrient recovery could thus substantially reduce the eutrophying emissions from wastewater treatment plants, and this would certainly assist in meeting the water quality objectives set out within the EU Water Framework Directive. Reuse of nutrients recovered from urine could also facilitate the substitution of a considerable proportion of mineral fertiliser used for agricultural and horticultural purposes (Lundin et al., 2000), although it must be recognised that the efficiency and applicability of urine-derived nutrient reuse is highly dependent on the local situation, particularly with respect to factors such as the distance to agricultural land/gardens, type of agriculture/horticulture, existing availability of fertiliser, and transport and spreading costs (Hellstrom, 1999). Recent analyses indicate that yellow water recycling could partly replace the use of mineral fertiliser, which would be a significant contribution helping to reduce resource depletion and environmental impacts related to fertiliser production (Tidåker et al., 2007). Given these potential benefits and the obvious case for increasing the practice of urine separation and reuse, it is important to ensure that recycling of nutrients via effluent-derived fertiliser products does not introduce additional risks to the environment. For example, it is increasingly apparent that in addition to the large proportion of nutrients contained in urine, substantial loads of emerging micropollutants may also be present, such as synthetic hormones and pharmaceuticals and their metabolites (Udert et al., 2006). In a screening assay of 212 pharmaceuticals, Lienert et al. (2007) found that an average of 64% of each compound was excreted via urine. On the one hand, findings such as these raise potential concerns regarding the reuse of reclaimed nutrients derived from urine as these substances may be harmful to ecosystems and human health (Daughton and Ternes, 1999). However, on the other hand they highlight the potential benefits of source separated urine treatment, indicating that targeted treatment of this concentrated waste could potentially prevent a large proportion of undesirable substances from being mixed and diluted in combined wastewater from which removal of hazardous micropollutants may be less efficient and recovered fertiliser products hence relatively polluted. This potential for targeted micronutrient treatment and source control has been one of the major drivers behind the increase in yellow water research in recent years.
As indicated above, urine treatment is currently a developing area of research, and although some relatively standard treatment processes for nutrient recovery have emerged, many treatment techniques (and particularly those focused on micropollutant removal) are still in the laboratory demonstration or pilot stages. Nevertheless, a wide range of urine treatment processes and technologies have been suggested and/or trialed and many of these are summarised in Table 15. Due to the fact that urine typically has a relatively low pathogen content (this being derived largely from faecal contamination as urine from healthy humans is virtually sterile) the simplest methods suggested for reuse are simply to store the urine for approximately 6 months and/or to adjust the pH to kill the pathogens (Höglund and Stenström, 1999; Otterpohl et al., 2003). However, these simple options offer little potential to reduce micropollutant loads and numerous more advanced options for more targeted pollutant removal are also under development. Some of the most advanced processes for urine treatment have come from aerospace research where the emphasis has been on producing good quality water for potable reuse in spacecraft. This relatively advanced research is particularly relevant to pollutant removal processes, but it is also typically very high-tech and expensive.

Priority pollutant behaviour in household wastewater.
Date submitted: 2008-08-11
File name: D5.2_Final_report[1].doc Page 56
With the majority of current yellow water treatment systems still effectively ‘experimental’, most relevant reports and publications are based on the individual application and testing of potential treatment techniques and processes rather than the application of a complete treatment train. Common components of urine treatment systems can nevertheless be identified. For example, all urine treatment systems require the separate collection of urine and this is typically achieved by using either a urinal (which may or may not be waterless) or a specially designed ‘no-mix’ toilet (e.g. www.roevac.de). For an extensive list of ‘no-mix’ toilet systems see Green and Ho (2005). The ‘no-mix’ toilet is equipped with two bowls (one at the front for urine and one at the rear for faecal matter), which are connected to separate outlets leading into separate treatment systems. The urine (and any accompanying flush water) passes first to a storage tank, although a proportion of this flow is typically lost depending on the user behaviour and the construction of the toilet (Jönsson et al., 1999). Palm et al. (2002) estimate that 65 – 85 % of the urine produced will usually be collected in the storage tank. Generally speaking, the aim with yellow water treatment systems is to minimise the addition of flush water to the waste stream. This is because storage requirements, treatment costs, transport costs, and energy consumption for land application all increase with added volume. Moreover, treatment efficiency is likely to decline as the waste stream becomes less concentrated. Other factors that must be taken into account when planning urine treatment and reuse systems include the spontaneous changes that take place during the storage and transport of urine (e.g. urea hydrolysis, precipitation, volatilisation) and the changes in composition and characteristics that occur as a result (Udert et al., 2006). As can be seen from Table 15, a yellow water treatment train would be likely to incorporate a range of different processes for the accomplishment of different goals such as hygienisation (pathogen removal), volume reduction, stabilization, nutrient recovery/removal, and micropollutant removal.
Table 15 Treatment components and process descriptions relevant to yellow water treatment.
Treatment type (process) Description of treatment
Hygienisation � Urine from healthy individuals is sterile, however urine from unhealthy people may contain pathogenic organisms as well as prions. Faecal contamination can also occur hence hygienisation is an important part of urine treatment.
Storage � Source separated urine is generally stored locally for several months. Storage has beneficial effects on pathogens and prolonged urine storage is therefore an option for hygienisation. Storage time, temperature and pH can all influence the hygienisation process, with temperature apparently the most important parameter in this respect.
Sterilisation/Pasteurisation � There are many options for pasteurising or sterilising solutions (e.g. heat, pressure, UV etc.), however, none of these have been tested with urine.
Volume reduction � In the case of nutrient recovery and reuse, it is better to concentrate the nutrients for transportation and storage purposes, particularly as in comparison with commercial fertilisers the nutrient content in urine is small (N: 0.9 %, P: 0.06 %, K: 0.3 %).
Evaporation � There are many different approaches available for evaporative treatment of urine. These can be used to reduce the volume of urine which can be beneficial for transport and recycling to land, and can also be used to produce a clean water source from urine. Many of these have been developed from water extraction techniques used for long-term manned space flights.
� Options include: Vapour compression distillation, Thermoelectric integrated membrane evaporation systems (urine is pre-treated with ozone or UV and sulphuric acid then heated and pumped through hollow fibre membranes and exposed to reduced pressure causing evaporation), Air evaporation systems (pre-treated urine pumped through a particulate filter to a wick from which it evaporates due to heated air, leaving the solids behind); Lyophilisation (frozen urine sublimates under vacuum and is recovered to produce ice).
Freeze-thaw � By using freeze concentrators and freezing urine at sub zero temperatures it is possible to concentrate nutrients and other impurities into a fraction about 25 % of the original volume, however, this process is not as energy efficient as evaporative treatment technologies.
Reverse osmosis � Water under pressure is permeated through a membrane with very small pores. The major part of the salts and organic compounds (including micropollutants) is retained. This means that no separation between nutrients and micropollutants will occur via this process.

Priority pollutant behaviour in household wastewater.
Date submitted: 2008-08-11
File name: D5.2_Final_report[1].doc Page 57
Table 15 cont’d.
Treatment type (process)
Description of treatment
Stabilisation � Stabilisation of urine (and hence reduction of microbial contamination) can help prevent degradation of organic matter (thereby reducing odour), precipitation processes (thereby reducing problems with clogging pipes), and volatilisation of HN3 (thereby improving air quality during storage, transport and reuse).
Acidification � Acidification below pH 4 prevents urea hydrolysis and can have positive hygienisation effects due to its negative impact on pathogenic organisms, and can also have an impact on the contaminants present in urine (e.g. may inactivate pharmaceutically derived compounds).
Microfiltration � Microfiltration membrane pore size typically ranges from 0.1 to 10 micrometres (µm) with removal of particles down to a molecular weight of 200 000
Nitrification � Nitrification is a suitable method of lowering the pH of urine and causes a decrease in the amount of volatile NH3. Ammonia nitrate or nitrite is produced as a result. The process helps prevent nitrogen (i.e. nutrient) loss from the urine and produces a stable solution with no easily degradable substances. A side effect of this process is the elimination of readily biodegradable substrate.
P-recovery � Nutrient recovery is a major factor driving research into urine treatment and reuse because the composition of urine reflects the average plant nutrient requirement.
Struvite precipitation � The precipitation of struvite (magnesium ammonium phosphate, MgNH4PO4.6H2O) is a useful way of converting 2 of the major nutrients in urine (N and P) into a solid form that can be used as a slow release fertiliser. Furthermore, the pH of hydrolysed urine is optimal for struvite precipitation. The precipitation can be triggered either by the addition of Mg (usually in the form MgO, Mg(OH)2, MgCl2) or bittern (the Mg-rich brine from table salt production).
N-recovery � Nutrient recovery is a major factor driving research into urine treatment and reuse because the composition of urine reflects the average plant nutrient requirement.
Ion exchange � Zeolite (often clinoptilolite as it has a high affinity for ammonium) is added to a urine solution, and the N-loaded product is collected. This process can also be combined with struvite precipitation for further nutrient recovery.
Struvite � See description under P-recovery above.
NH3 stripping � Ammonia is stripped under vacuum and adsorbed in water under pressure. This results in a 10 % ammonia solution that is unstable at normal pressure and needs further processing.
Isobutylaldehyde + diurea � Addition of isobutyraldehyde to urea can result in the precipitation of isobutylaldehyde-diurea, which is a commercially available slow-release fertiliser. However the 1 % urea present in urine is apparently not high enough to make this a useful process in urine treatment although some experiments have been carried out.
Nutrient removal � Where water treatment for improved environmental quality rather than nutrient recovery is the goal, it can be desirable to remove N and P without recovering them.
Anammox � The anaerobic ammonium oxidation (Anammox) process has been studied in detail for urine treatment. This is a process designed to eliminate N independently of a carbon source. Ammonium oxidation (nitrite formation) is required as pre-treatment.
Micropollutant removal � Urine can contain a significant amount of micropollutants, including a wide variety of PPs as indicated in Table ? It is important to distinguish between techniques that are relevant to micropollutant elimination and those that are relevant to micropollutant separation, with separation processes primarily being based on membrane based technologies or precipitation, and removal processes based on oxidation or adsorption.
Activated carbon adsorption
� Although it is theoretically possible to remove micropollutants from urine by adsorption to active carbon or other adsorbents it is likely that the high COD in urine would strongly interfere with the adsorption process.
Electrodialysis � Ions are permeated through positively and negatively charged electrodialysis membranes and concentrated in a separate compartment. Investigations have shown that this process can be used to selectively extract the nutrients into a concentrated product stream while retaining micropollutants (pharmaceuticals) in the diluate.
Nanofiltration � Permeation through a dense membrane with nanopores to reject dissolved molecules. Small ions and uncharged molecules are permeated. The efficiency of the process micropollutant separation depends strongly on pH, indicating that electrostatic interactions with the membrane play an important role. For production of a urine-based fertiliser it is important for the micropollutants to be retained and for mineral salts to be permeated. To obtain high N recoveries, non-hydrolysed urine must be used.
Oxidation processes � Micropollutants can be oxidised with chlorine, chlorine dioxide, ozone, or OH radicals (advanced oxidation). Due to the high COD content of urine, oxidants reacting specifically with micropollutants are preferred. Ozonation is regarded as a suitable method for removing a wide range of micropollutants from urine.
References: Maurer et al., 2006; Hoglund et al., 2002a; Hoglund et al., 2002b; Wieland, 1994; Lind et al., 2001; Hellström, 1999; Johnston and Richards, 2003; Larsen et al., 2004; Pronk et al., 2006a, 2006b, 2006c; Tettenborn et al., 2007; Ban and Dave, 2004; Gulyas et al (2004)

Priority pollutant behaviour in household wastewater.
Date submitted: 2008-08-11
File name: D5.2_Final_report[1].doc Page 58
8.3 Brownwater treatment
The treatment of brownwater for reuse and recycling has not been widely practiced in Europe to date. Most early systems developed for brownwater treatment have been based on the use of composting toilets, usually with the aim of later recycling the composted material to land. In systems incorporating land-distribution of treated faecal matter it is important to ensure that the maximum nutrient content is retained in the final composted product and hence a common aim associated with brownwater treatment is to separate the solid part of the brownwater from any accompanying liquid (i.e. flush water or urine) as extraction of nutrients from the faeces to the liquid is rapid (Vinnerås and Jönsson, 2002a). The amount of liquid in the initial product prior to treatment is highly dependent on the collection method. For example, a dry composting toilet may receive urine as well as faeces but no flush water, whereas other more traditional toilet designs would introduce a large amount of flush water into the system. With regard to facilitating effective brownwater treatment, modern low-flush vacuum toilets hold considerable potential, and, as explained in the previous section ‘no-mix’ toilets incorporating separate collection bowls and drainage outlets for faeces and urine can also be used. Other technologies which may be used to separate brownwater solids and liquids include a machine called an Aquatron, which separates solids and liquids using a combination of a whirlpool effect, surface tension, and gravity (Vinnerås and Jönsson, 2002a and 200b). Filtration could also be used for separation, either by gravity or by using a dewatering gadget such as a filter press, vibration, or vacuum filtration (Vinnerås and Jönsson, 2002a). There is a dearth of research examining the removal of micropollutants from separated faecal material, but possible treatment methods following separation include drying, incinerating, pH amendment, composting or vermicomposting (Stubsgaard, 2001; Green and Ho, 2005).

Priority pollutant behaviour in household wastewater.
Date submitted: 2008-08-11
File name: D5.2_Final_report[1].doc Page 59
9 Priority pollutant treatment efficiency Given that the selected PPs have a wide range of physico-chemical properties (Holten-Lützhøft et al., 2007) they can also be expected to differ in terms of treatment removal potential. Thus, individual treatment technologies may be more suitable for the treatment of some PPs than others, and the most suitable combination of treatment technologies may also differ on a pollutant-by-pollutant basis. Unfortunately, at the present time, it is difficult to draw any firm conclusions regarding the efficiency of the various treatment options (either individually or in a train) for the majority of PPs. This is due both to the overwhelming lack of data on micropollutant treatment efficiency and the highly site-specific nature of most source separated wastewater treatment plants. A thorough review of the literature has shown that there is very little available information regarding the removal of non-standard parameters from source separated household wastewater. Instead, the majority of removal efficiency studies relate to treatment of combined wastewater at municipal sewage treatment plants and this is not necessarily relevant to treatment of PPs in separate household waste streams with very different properties. Nevertheless, by taking into consideration a range of relevant physico-chemical properties for the target PPs as well as their likely partitioning behaviour between relevant phases (e.g. solid, liquid, air), it is possible to make some initial predictions regarding the likely fate of PPs during selected treatment processes. These ideas are further developed in Section 11 in the form of a range of greywater treatment and recycling scenario analyses. Prior to this, in Sections 9.1 and 9.2, data relating to the treatment of PPs in greywater and yellow water respectively, are presented, along with further discussion of treatment related issues. Greywater and yellow water have been chosen as the primary focus for further discussion because there has been increasing interest in non-standard parameter removal from these two fractions in recent years (e.g. Ying et al., 2004; Nielsen and Pettersen, 2005; Pronk et al., 2007; Ronteltap et al., 2007), and the results of these studies, although not necessarily directly related to treatment of PPs are nevertheless of some interest in relation to micropollutant treatment efficiency.
9.1 Treatment efficiency of priority pollutants in greywater
Relevant data are presented in Tables 16 and 17. The majority of studies investigating treatment efficiencies within greywater have focussed on conventional parameters (such as major nutrients, suspended solids, BOD, COD, and pathogen contents) whereas only one published study (Nielsen and Pettersen, 2005) has actually reported the inlet and outlet concentrations of PPs. The other handful of studies investigating PPs in greywater have only addressed the presence of these substances in the water and not the efficiency of the treatment system. For the purposes of discussion, some of the data showing the effects of greywater treatment on selected conventional parameters have been presented in Table 16. The results show that removal efficiencies can vary considerably both within and between treatment plants, a pattern which is also likely to emerge for PPs given further research. In Table 16, treatment efficiency measured on the basis of BOD is shown to vary from 0 to 100 %, although overall, treatment appears to be highly effective in most cases. A similar range in efficiency is also demonstrated for COD. Suspended solids and TSS have also been included in this table. This is because many of the PPs have relatively high Kow values and are therefore likely to sorb to suspended particulate matter during treatment. To a large degree, this should settle out during later stages of treatment, thereby becoming part of the sludge fraction. The removal of TSS during treatment can thus be regarded as something of a surrogate for the potential removal of many PPs (i.e. those with high Kow values) which is useful knowledge in the absence of any specific PP treatment efficiency data. This idea of predicting partitioning behaviour and subsequent fate is further developed for the scenario analyses presented in Section 11.

Priority pollutant behaviour in household wastewater.
Date submitted: 2008-08-11
File name: D5.2_Final_report[1].doc Page 60
Table 16: Removal efficiencies (standard parameters) in indoor greywater treatment plants
Pollutant Inlet concentration
Outlet concentration
Inlet load
Outlet load
Removal (%) Reference
(µµµµg/L) (µµµµg/L) (µµµµg/s) (µµµµg/s) Min. Max.
BOD 99,000 56,000-60,000 39 43 Andersson & Dalsgaard (2004a) BOD 98,000-100,000 8,000-32,000 67 92 Andersson & Dalsgaard (2004a) BOD <2000-51,000 <2000-3100 >94 Overgaard Pedersen (2003) BOD5 66000 1700 97 Andersson & Dalsgaard (2004b) BOD5 46000 <1000 >98 Andersson & Dalsgaard (2004b) BOD5 18000-550000 <100-12000 78 100 Ledin et al., 2006 BOD5 140,000-200,000 <2000 >99 >99 Nielsen & et al Pettersen (2005) BOD7 50,000-250,000 <5,000 >90 >98 Nolde (1999) BOD7 70,000-300,000 <5,000 >93 >98 Nolde (1999) BOD7 36,000 1,500 96 Friedler et al. (2005); Friedler & Hadari (2006) BOD7 36000 500 99 Friedler et al. (2006) BOD7 36000 40,000 0 Friedler et al. (2006) BOD7 59,000 2,300 69,000 3,700 96 95 Friedler et al. (2005); Friedler & Hadari (2006) BODt 69000 1,100-62,000 10 Friedler et al. (2006) BODt 69000 1,100 98 Friedler et al. (2006) COD 200,000-210,000 140,000 30 33 Andersson & Dalsgaard (2004a) COD 171,000 78,000 54 March et al. (2004) CODCr 190000 22000 88 Andersson & Dalsgaard (2004b) CODCr 140000 14000 90 Andersson & Dalsgaard (2004b) CODCr 57000-940000 9200-110000 15 98 Ledin et al., 2006 CODCr 240,000-350,000 21,000-28,000 88 94 Nielsen & Pettersen (2005) CODCr <10,000-140,000 11,000-13,000 0 93 Overgaard Pedersen P (2003) CODd 110,000 22,700 108,000 48,000 64 56 Friedler et al. (2005); Friedler & Hadari (2006) CODd 108000 87,000 19 Friedler et al. (2006) CODd 108000 37,000 66 Friedler et al. (2006) CODt 158,000 40,000 211,000 47,000 75 78 Friedler et al. (2005); Friedler & Hadari (2006) CODt 211000 130,000 38 Friedler et al. (2006) CODt 211000 40,000 81 Friedler et al. (2006) SS 90000 3400 96 Andersson & Dalsgaard (2004a) SS 31000 2100 93 Andersson & Dalsgaard (2004a) SS 42,000-44,000 6,700-8,000 81 85 Andersson & Dalsgaard (2004a) SS 5000-26,000 <5000 81 Overgaard Pedersen (2003) SS 44,000 18,600 58 78 March et al. (2004) SS 11000-210000 <200-15000 16 99 Ledin et al. 2006 SS 9,200-84,000 <5000 46 94 Nielsen & Pettersen (2005) TSS 43,000 7900 92,000 13,000 82 86 Friedler & Hadari (2006); Friedler et al. (2005) TSS 92000 32,000 65 Friedler et al. (2006) TSS 92000 12,000 87 Friedler et al. (2006)

Priority pollutant behaviour in household wastewater.
Date submitted: 2008-08-11 Date submitted:
File name: D5.2_Final_report[1].doc Page 61
Table 17: Priority pollutant removal efficiencies in indoor greywater treatment plants
Pollutant
Inlet concentration
Outlet concentration
Removal (%) Reference
(µµµµg/L) (µµµµg/L) Min. Max. DEHP 14 <0.5-7.7 45 > 96 Nielsen & Pettersen (2005) Cd 2.5 <0.1 > 96 Nielsen & Pettersen (2005) Pb 1.8 <1 > 44 Nielsen & Pettersen (2005) Hg <0.05 <0.05-0.44 - x Nielsen & Pettersen (2005) Sn <25 <25 - Nielsen & Pettersen (2005) Ni 1.3 11-13 x x Nielsen & Pettersen (2005) Pentachlorophenol <0.05 <0.05 - Nielsen & Pettersen (2005) Nonylphenol-monoethoxylates 0.76 <0.10 > 87 Nielsen & Pettersen (2005) Nonylphenol-diethoxylates <0.2 <0.10 - Nielsen & Pettersen (2005) Nonylphenol-polyethoxylates <20 <20 - Nielsen & Pettersen (2005) Σ Nonylphenols 0.76 0.11 87 Nielsen & Pettersen (2005) Octylphenol <0.1 <0.1 - Nielsen & Pettersen (2005) Octylphenol-polyethoxylates <20 <20 - Nielsen & Pettersen (2005) Diethylphthalate 29 <0.2 > 99 Nielsen & Pettersen (2005) Trichloromethane <0.05 <0.05 - Nielsen & Pettersen (2005) 1,1,1-trichloroethane <0.05 <0.05 - Nielsen & Pettersen (2005) Tetrachloromethane <0.05 <0.05 - Nielsen & Pettersen (2005) Trichloroethylene <0.05 <0.05 - Nielsen & Pettersen (2005) Tetrachloroethylene <0.05 <0.05 - Nielsen & Pettersen (2005) 1,1,2-trichloroethane <0.2 <0.2 - Nielsen & Pettersen (2005) 1,2-dichloroethane <0.2 <0.2 - Nielsen & Pettersen (2005) 1,2-dichloropropane <0.1 <0.1 - Nielsen & Pettersen (2005) Dichloromethane <2 <2 - Nielsen & Pettersen (2005) trans-1,2-dichloroethylene <0.1 <0.1 - Nielsen & Pettersen (2005) cis-1,2-dichloroethylene <0.1 <0.1 - Nielsen & Pettersen (2005) 1,1-dichloroethane <0.1 <0.1 - Nielsen & Pettersen (2005)
x This indicates a situation where the outlet concentration was higher than the inlet concentration
The severe lack of data with respect to PP removal from greywater is clearly evident from Table 17 which shows data from the only study (Nielsen and Pettersen, 2005) reporting both inlet and outlet data for PPs. Moreover, as the majority of the measured PPs were below detection limit at both inlet and outlet in this treatment plant, it is not even possible to calculate removal efficiencies for the investigated treatment train. However, the results do show that DEHP was removed during treatment (with the measured efficiency ranging from 45 to > 96 %. Nonylphenols were also apparently removed via this treatment system (>87% removal), however, in the case of Ni and Hg, outlet concentrations were higher than those at the inlet. For Ni this could be due to leaching from stainless steel surfaces (e.g. from settling and storage tanks) throughout the treatment system, however there is no clear explanation for the higher Hg concentrations recorded at the system outlet. The investigated treatment plant is located at the Gals Klint Campsite in Denmark where treatment consists of a settling tank, inlet buffer tank, biological sandfilter, and hydrogen peroxide disinfection unit.
When considering the probable treatment efficiency of different systems it is important to consider that, as indicated in Section 3, the composition of greywater from different households and communities will differ depending on the householders’ habits (e.g. the choice of products they use, length of showers etc.) and the source of greywater within the home (e.g. kitchen only or bathroom + laundry etc.). This makes it very difficult to speculate about greywater treatment efficiency in the absence of substantial data. Nevertheless, some important factors that can potentially affect treatment efficiency in greywater have been identified, and these are summarised below.

Priority pollutant behaviour in household wastewater.
Date submitted: 2008-08-11 Date submitted:
File name: D5.2_Final_report[1].doc Page 62
� Treatment efficiency may differ, even within a single treatment plant, depending on the pollutant content of the greywater. For example, biological treatment of a given pollutant may be less effective at low concentrations, as the greater competition from other substrates may mean that the low concentration pollutant is less likely to be used as an energy source.
� Removal efficiency is also highly dependent on the overall wastewater composition. For example, if trace organic compounds are present in a matrix that is rich in natural organic matter and the wastewater is subjected to treatment by advanced oxidation processes, it is probable that the “bulk” organics rather than the trace species would be preferentially attacked. Degradation of the trace contaminants may still occur but would be less effective than it would be if the micropollutant was in a less complex matrix (Ying et al., 2004).
� Treatment results can also be dependent on ambient environmental conditions such as temperature. For example, operating temperature can significantly affect the functioning of biological treatment systems (Ying et al., 2004) and thus some technologies may not be applicable to all climates (Green and Ho, 2005). Temperature can also impact on other relevant treatment processes such as evaporation, sorption etc.
� It is also important to note that nutrient contents in greywater are generally relatively low, and in some cases nutrient feeding may be necessary in order to ensure the proper functioning of biological treatment systems (Jefferson et al., 2001b). For example, Avery et al. (2006) note that the C:N:P ratio of grey water is typically 1000:2.9:0.1, whereas the optimum ratio for biological treatment has been given as 100:5:1 (Gray, 2004).
� Treatment systems will not always be functioning at optimum treatment capacity. For example, biological treatment can be affected by periodically strong increases in pollutant loads or flows. This can potentially result in a wide range of treatment efficiencies, even for a single pollutant and treatment system.
� In membrane-based systems, membrane fouling can significantly affect treatment efficiency and control of fouling is therefore a key operating issue. Substantial pre-treatment is needed to prevent clogging of membranes by fibres, hairs, etc. Hydrodynamic conditions, membrane type and module configuration, and the presence of higher molecular weight compounds all play a role, with severe membrane fouling typically occurring above a critical permeate flux or at too low an aeration rate (Melin et al., 2006). Fouling also increases linearly with organic matter content (Nghiem et al., 2006).
� It should also be noted that with membrane processes, highly effective removal of micropollutants may initially be observed, but can in some instances be partly due to extensive adsorption to the membrane itself, and as such, misleading (Chang et al., 2003). Although there is little knowledge at present about the interaction between organic micropollutants and membrane surfaces, the results of Nghiem and Schaefer (2005) indicate that retention of these pollutants may be lower than expected if the compounds adsorb to the membrane and then diffuse through.
� An advantage of MBR technology is that the retention of activated sludge containing solids and macromolecules in combination with long sludge age extends the contact time of sludge and critical classes of substrates, thus allowing the development of specialised, slow-growing microorganisms that are able to remove low-biodegradable wastewater pollutants. This can lead to improved removal of recalcitrant compounds compared with conventional activated sludge treatment (Melin et al., 2006) and is also expected to improve the treatment of organic micropollutants used in the household (e.g. pharmaceuticals, detergents etc.) (Siegrist, 2003; Abergglen and Siegrist, 2006).
� Pollutant fate in land-based systems (e.g. vertical soil filters) depends on properties such as soil texture and structure, depth to the unsaturated zone, and wastewater volume. In the worst case scenario, wastewater may flow directly through deep pores to groundwater with little or no
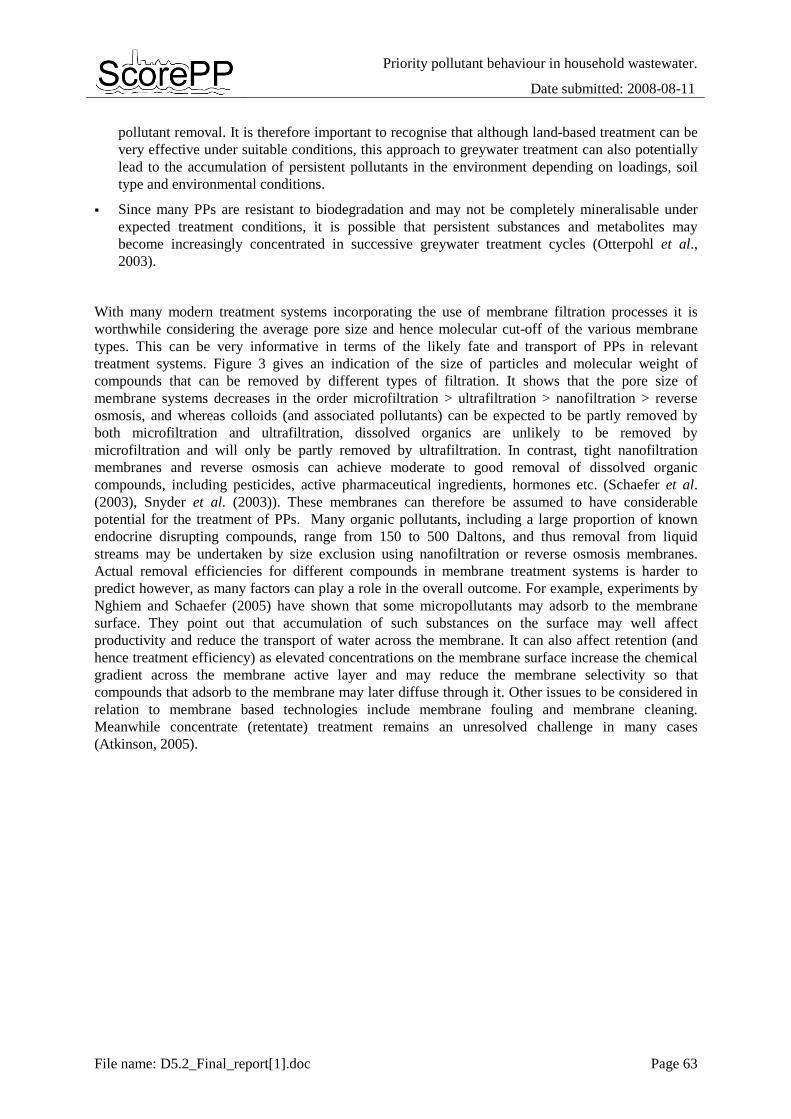
Priority pollutant behaviour in household wastewater.
Date submitted: 2008-08-11 Date submitted:
File name: D5.2_Final_report[1].doc Page 63
pollutant removal. It is therefore important to recognise that although land-based treatment can be very effective under suitable conditions, this approach to greywater treatment can also potentially lead to the accumulation of persistent pollutants in the environment depending on loadings, soil type and environmental conditions.
� Since many PPs are resistant to biodegradation and may not be completely mineralisable under expected treatment conditions, it is possible that persistent substances and metabolites may become increasingly concentrated in successive greywater treatment cycles (Otterpohl et al., 2003).
With many modern treatment systems incorporating the use of membrane filtration processes it is worthwhile considering the average pore size and hence molecular cut-off of the various membrane types. This can be very informative in terms of the likely fate and transport of PPs in relevant treatment systems. Figure 3 gives an indication of the size of particles and molecular weight of compounds that can be removed by different types of filtration. It shows that the pore size of membrane systems decreases in the order microfiltration > ultrafiltration > nanofiltration > reverse osmosis, and whereas colloids (and associated pollutants) can be expected to be partly removed by both microfiltration and ultrafiltration, dissolved organics are unlikely to be removed by microfiltration and will only be partly removed by ultrafiltration. In contrast, tight nanofiltration membranes and reverse osmosis can achieve moderate to good removal of dissolved organic compounds, including pesticides, active pharmaceutical ingredients, hormones etc. (Schaefer et al. (2003), Snyder et al. (2003)). These membranes can therefore be assumed to have considerable potential for the treatment of PPs. Many organic pollutants, including a large proportion of known endocrine disrupting compounds, range from 150 to 500 Daltons, and thus removal from liquid streams may be undertaken by size exclusion using nanofiltration or reverse osmosis membranes. Actual removal efficiencies for different compounds in membrane treatment systems is harder to predict however, as many factors can play a role in the overall outcome. For example, experiments by Nghiem and Schaefer (2005) have shown that some micropollutants may adsorb to the membrane surface. They point out that accumulation of such substances on the surface may well affect productivity and reduce the transport of water across the membrane. It can also affect retention (and hence treatment efficiency) as elevated concentrations on the membrane surface increase the chemical gradient across the membrane active layer and may reduce the membrane selectivity so that compounds that adsorb to the membrane may later diffuse through it. Other issues to be considered in relation to membrane based technologies include membrane fouling and membrane cleaning. Meanwhile concentrate (retentate) treatment remains an unresolved challenge in many cases (Atkinson, 2005).

Priority pollutant behaviour in household wastewater.
Date submitted: 2008-08-11 Date submitted:
File name: D5.2_Final_report[1].doc Page 64
Figure 3: Reproduced from Ottosson (2003).
9.2 Treatment efficiency of PPs in urine (yellow water)
As noted earlier, there is a general lack of data investigating PP treatment efficiency in urine/yellow water treatment systems. In fact, the only specific PP related treatment results identified for urine were for metals, these having been investigated for their potential to contaminate and even negate the use of urine-derived fertiliser products for agricultural purposes. Ronteltap et al. (2007) studied the behaviour of selected metals during the precipitation of struvite (magnesium ammonium phosphate) from metal spiked urine using a combination of practical experimental work and thermodynamic modelling and found that the processes (e.g. hydrolysis) occurring during urine collection and storage can have a substantial impact on metal solubility. Thermodynamic modelling revealed low or very low equilibrium solute concentrations for cadmium (Cd), nickel (Ni) and lead (Pb). The results also showed that whereas under unhydrolysed conditions, (i.e. pH 6 and no bicarbonate) Pb may partly precipitate as Pb phosphate, Cd and Ni would remain in solution. In hydrolysed (stored) urine (i.e. pH 9 and 170mM total carbonate), all metals could potentially precipitate as metal carbonates and hydroxides to reach equilibrium. Further experiments confirmed that Cd and Pb carbonate and hydroxide precipitate upon metal addition in stored urine with a reaction half-life of ca. 7 days, indicating that a normal storage period from several weeks to several months would be sufficient for precipitation of any elevated levels of Cd, and Pb. No precipitation behaviour was detected for Ni. Precipitated metals would accumulate in the ‘urine sludge’ which collects on the bottom of the storage tank and would be difficult to separate from precipitated phosphates, which could prevent the re-use of phosphate for fertiliser when metal concentrations were high. However, it is important to note that these experiments were carried out with spiked urine (added metal concentrations were 0, 200 and 500 mg l-1), and other results by these authors showed that the metal concentrations in struvite precipitated from normal stored urine were below the detection limits (i.e. 0.2 mg Cd l-1, 0.6 mg Ni l-1, 1.5 mg Pb l-1). Furthermore, comparison with commercial fertilisers and manures showed that specific metal concentrations (i.e. metal per unit of N or P) in urine are generally quite low and far below that of the commercial fertilisers investigated. Calculations also showed that metal elimination via struvite

Priority pollutant behaviour in household wastewater.
Date submitted: 2008-08-11 Date submitted:
File name: D5.2_Final_report[1].doc Page 65
precipitation should generally not exceed 0.9 mg Cd, 2.7 mg Ni and 6.8 mg Pb per g PO4 - P. These specific concentrations are significantly lower than the typical specific concentrations found in stored urine indicating that only a small fraction of the metals in urine are incorporated into the precipitated fertiliser product. Ronteltap et al. (2007) also studied the behaviour of (spiked) pharmaceuticals in urine and found that more than 98 % of the investigated hormones and pharmaceuticals remained in solution during struvite precipitation. Thus, struvite precipitation was shown to render a potential fertiliser product that was free from most organic micropollutants and contained only a fraction of the already low amounts of heavy metals in urine.
Although the previous focus of urine treatment research was predominantly related to nutrient recovery, there has recently been an increase in the number of studies investigating treatment removal efficiencies for emerging organic micropollutants such as pharmaceutical compounds, natural and synthetic hormones and other endocrine disrupting substances. Although these substances differ from the PPs which are the focus of this report, it is nevertheless interesting to further consider some of these results and the types of treatment systems that are being trialed. For example, Pronk et al. (2006) examined the use of different types of filtration membranes for separating a range of pharmaceutical and estrogenic compounds, and showed that the retention of both micropollutants and salts was affected by pH, with optimum retention of pollutants occurring around pH 5. Their results also showed that most of the N (urea and ammonia) was permeated, whereas phosphate and sulphate were almost completely retained in the concentrated retentate along with up to 92 % of the pollutant content. It was suggested that a precipitation step could be added to facilitate the greater retention of phosphate for recycling, although it was not known how much of organic pollutants would also be precipitated. Höglund et al. (2000) had found that the concentrations of bacteria and organic compounds in urine sludge were substantially higher than in the urine solution and Udert et al. (2006) noted that it is not yet clear whether micropollutants are degraded or substantially precipitated during urine storage. Nevertheless, the results of Ronteltap et al. (2007) described in the previous paragraph indicate that at least some organic pollutants (i.e. pharmaceuticals) are more likely to remain in solution.
A substantial pilot study investigating a range of potential pollutant removal processes for yellow water has also recently been completed in Germany (Tettenborn et al., 2007). At Hansaplatz in Hamburg, urine from a waterless urinal for males (used by approximately 100-200 people per day) was stored in an underground tank and collected twice monthly. It was then transported to a pilot plant at a municipal WWTP where the effects of treatment processes such as steam stripping, evaporation, crystallisation, precipitation, adsorption, UVC-radiation and ozonation were investigated. Tettenborn et al. (2007) also collected urine at an office building in Berlin where a combination of waterless urinals and separating vacuum toilets were installed (20 regular workers + visitors). Experiments were conducted to investigate the effects of various treatment methods (as indicated above) on both untreated stored urine (i.e. following complete urea hydrolysis and precipitation) and steam stripped N-depleted urine. In terms of xenobiotic removal these experiments indicated that UVC-radiation, ozone treatment, and crystallisation were technically feasible options that could be used in the elimination of pharmaceutical residues. For instance, with high dosages of UVC-light (~2 kWh/l) nearly all pharmaceutical residues in the urine could be reduced by more than 90 %. Moreover, all investigated micropollutants could be removed by ozonation at a dosage of 2.5 g O3/l. Steam stripping and evaporation may also potentially reduce the micropollutant content as a result of the constant thermal influence present during treatment with this process (Tettenborn et al., 2007). Furthermore, UVC-radiation and ozonation were more effective when the substrate was pre-treated by steam stripping, since competition from substances such as ammonium was reduced.

Priority pollutant behaviour in household wastewater.
Date submitted: 2008-08-11 Date submitted:
File name: D5.2_Final_report[1].doc Page 66
10 Danish greywater treatment plant case studies
Due to the high site specificity and pilot-scale nature of most source separated household wastewater treatment plants, it is very difficult to collect sufficient information to carry out a full cost-benefit analysis for these technologies in relation to PP source control, particularly given the lack of available information regarding PP treatment efficiency in these systems. Nevertheless, it is a very important aspect to consider and rather than omit discussion of this from the report, the approach has been taken of providing some case study examples specific to the treatment and reuse of greywater in Denmark. These examples have been selected due to the availability of relatively detailed information related to the ongoing operation and maintenance costs of 7 established pilot plants that have been operating for at least 6 years. Information such as average flows and energy consumption for these treatment plants are presented in Section 10.1, followed by a more recent analysis (2007) of one of the plants (Nordhavnsgården) in Section 10.2. Whilst it is recognised that the information cannot be generalised to all countries and climates etc, it is nevertheless of benefit to present some actual data on functioning pilot plants and their costs. Furthermore, the information from the pilot plant described in Section 10.2 is also used in the following section to inform a series of more general scenario analyses which investigate, on the basis of available information, the probable benefits of greywater recycling in terms of water savings and pollutant source control.
10.1 Greywater pilot plants in Denmark
In the period from 1991 to 2001, 35 greywater treatment pilot plants were established in Denmark (Smith et al., 2001). At ten of the pilot plants the treated greywater was reused for toilet flushing, and in 2002 seven of these ten plants were still operational. A follow-up study to evaluate the functioning of these seven plants showed that greywater production from the connected sources was not sufficient to cover the volume required for flush water (mean volume of 31 l person-1 d-1 of greywater produced, compared to mean volume of 35.4 l person-1 d-1 flush water required) and potable water thus had to be periodically added to the service tanks in order to keep the systems functioning (Overgaard Pedersen 2003). The reuse systems investigated used a combination of bathroom and/or laundry derived greywater (i.e. four plants used greywater from handbasins and showers; one used greywater from hand basins, showers and laundry; one used greywater sourced from laundry washing, and one used greywater of unspecified origins).
The operation and maintenance costs for the seven greywater pilot plants still functioning in 2002 ranged from 0.7 to 8.9 Є m-3 with electricity consumption ranging from 1.4 to 17.3 kWh m-3 (Overgaard Pedersen 2003). The corresponding water utility charges (including both potable water supply and wastewater removal and treatment costs) for consumers at the time ranged from 4 Є m-3 to over 10 Є m-3, with an average of 5.3 Є m-3 (DANVA, 2007). This general utility charge also incorporates the cost of 2.29 kWh m-3 energy consumption (0.46 kWh for drinking water and 1.83 kWh for wastewater). Disaggregated, the prices for potable water varied from 0.27 to 1.7 Є m-3 and the price for management of wastewater from 0.67 to 2 Є m-3, with the remainder of the price comprised of fees and taxes. The highest prices occurred in areas with limited water resources, such as the small Danish islands (DANVA, 2007). Based on these figures it can be seen that the energy consumption associated with greywater treatment at these pilot plants varied considerably, and ranged from being in the same order of magnitude or significantly higher than that required for wastewater treatment. Nevertheless, it seems probable that the pricing for municipal services such as water and wastewater are high enough in Denmark to sustain greywater utilisation, particularly in water challenged areas.

Priority pollutant behaviour in household wastewater.
Date submitted: 2008-08-11 Date submitted:
File name: D5.2_Final_report[1].doc Page 67
10.2 Greywater treatment and recycling at Nordhavnsgården, Copenhagen.
The Nordhavnsgården greywater treatment plant is situated in the basement of an apartment block in central Copenhagen and has been in operation since June 2001. The plant consists of a primary settling tank, rotating biological contactor, secondary settling tank, sand filter, UV disinfection unit, and service-water storage tank (see Figure 4). This treatment system design has proven to be one of the most popular designs for greywater treatment throughout Denmark and Germany. Eighty-four one-bedroom apartments (~117 inhabitants) are connected to this facility, which is fully automatic and self-cleaning, and treats 4 - 5 m3 per day (Andersson and Dalsgaard, 2004). Wastewater from hand basins, showers and bathtubs (i.e. personal hygiene greywater) is processed through the plant and reused onsite as toilet flush water, whereas wastewater from toilets and kitchen sinks (i.e. blackwater) is removed from the site via the sewage network and treated at one of Copenhagen’s two municipal sewage treatment plants. The Nordhavnsgården greywater treatment system requires 2-3 hours of maintenance each month, as well as an annual maintenance check of approximately 6-8 hours (Andersson and Dalsgaard, 2004).
A6
A2 A3 A4
Primary settling tank
Sand-filter
UV-filter Service water tank
A0
A1 A5
Multi-stage Rotating Biological Contactor
Secondary settling tank
A7
Figure 4. Diagram and photos illustrating components of the treatment train at the Nordhavnsgården greywater treatment plant.
In 2007, the greywater production at Nordhavnsgården was 57 l person-1 day-1. As the volume required for toilet flushing averages 62 l person-1 day-1, the volume of bathroom-derived greywater produced is not sufficient to cover the water requirements for toilet flushing, and an additional 5 l person-1 day-1 of potable water must be added to the service water tank to satisfy the daily requirement for flush water (Sørensen, 2007). Although this is not a problem in terms of the operation of the plant as the system is designed in such a way that potable water can always be added to the service water tank to ensure the

Priority pollutant behaviour in household wastewater.
Date submitted: 2008-08-11 Date submitted:
File name: D5.2_Final_report[1].doc Page 68
ongoing performance of the system in the case of a treatment plant failure. However, it does indicate that there is a potential for lower flush toilets to be of benefit in such systems and also has implications for the cost of water. This may differ in other treatment situations depending on the type of toilet and amount of flush water used. However, in the case of a system similar to Nordhavnsgården, if both greywater derived from personal hygiene activities in the bathroom as well as laundry greywater were processed through the plant this should be sufficient to completely replace the potable water currently used for toilet flushing.
10.2.1 Greywater metal dynamics at the Nordhavnsgården treatment plant
Influent and effluent greywater samples were taken at the Nordhavnsgården treatment plant during a one-week period (29 November – 5 December) in winter 2007 using acid washed equipment. The average hourly flow at the time of sampling was also recorded. The greywater samples were filtered through an 8 µm filter and acidified before analysis by Inductively Coupled Plasma – Optical Emission Spectroscopy (Varian Vista-MPX CCD Simultaneous ICP-OES). Linearity, precision, recovery and limit of quantification were all calculated in accordance with the relevant internal quality assurance and quality control procedures. Greywater metal loads were calculated based on the average measured concentrations and the recorded water flows, and normalised according to the number of inhabitants.
The greywater influent at Nordhavnsgården was found to contain Cd, Pb and Ni at concentrations in the same order of magnitude as those previously reported in the literature (Table 18). Mercury, however, was present at considerably higher concentrations than previously reported, reaching up to 36 µg/l in a one-hour composite sample (Table 18). This Hg presumably originates largely from the use of amalgam fillings in dentistry, (i.e., residents’ teeth). High Hg values (up to 23 µg/l) were also observed in the treated greywater. In general, the concentrations of metals varied by up to several orders of magnitude between sampling events, with lower influent concentrations generally recorded in the relatively high flow morning period, and the highest concentrations recorded during low flow events (Figure 5).
Table 18. Metal concentrations in greywater (µg/l)
This experimental study Greywater reviews WHO CQ WFD EQS-AA
Metal Inlet Outlet Eriksson et al. (2002)
This report (WHO, 2006)
(EU, 2006)
Cd 0.012-0.22 0.062-0.34 0.52-0.63 0.056-2.5 3 ≤0.08-0.25
Ni 5.1-27 1.8-12 <25 1.3-28 70 20
Pb 4.9-10 3.1-6.3 3-5 0.61-6.9 10 7.2
Hg 0.56-36 2.2-23 0.29 0.022-0.26 6 0.05
The levels for Cd, Ni and Pb in both inlet and outlet greywater at Nordhavnsgården all conform to the WHO drinking water guidelines (WHO, 2006), as do the concentration ranges previously reported in the literature (Table 18). In contrast, the high Hg levels at Nordhavnsgården considerably exceed these quality criteria at both inlet and outlet. Similarly, the treated Nordhavnsgården greywater meets the EU annual average EQS values for surface waters for both Pb and Ni, whereas the highest Hg concentrations substantially exceed the EQS standard (Table 18). The EQS comparison outcome for

Priority pollutant behaviour in household wastewater.
Date submitted: 2008-08-11 Date submitted:
File name: D5.2_Final_report[1].doc Page 69
Cd differed depending on the carbonate content of the samples. Similar overall trends can be seen when comparing the literature data with the EQS. Meeting the WFD-EQS indicates that greywater metal concentrations do not present a risk to surface waters. However, this does not mean that greywater effluent is suitable for discharge to surface waters, as factors such as pathogen content may constitute a greater risk than that of metal content.
The Nordhavnsgården treatment plant was found to remove between approximately a third and a half of the Pb (29%), Hg (35%), and Ni (56%), but removal of Cd was not statistically significant (T-test, p < 0.05). In comparison, a pilot greywater treatment and reuse system (for toilet flushing) at a campsite in Denmark consisting of a settling tank, biological sand-filter, buffer tank and disinfection unit, was found to remove both Pb (44%) and Cd (96%) from the aqueous phase, but not Hg or Ni (Nielsen and Pettersen, 2005). This is the only other identified study reporting both influent and effluent greywater metal concentrations and both of these systems rely largely on settling, biodegradation and disinfection. It is not clear why Ni should be removed by one system and not the other, although in the case of Hg it is possible that additional aeration caused by the Rotating Biological Contactors may have increased the removal of Hg from the system. Nevertheless, as no aeration occurs via diffusers in either treatment train, settling should probably be regarded as the most likely removal process. Greywater effluent Hg loads could be further decreased by air stripping, however, ongoing phasing out of ambient sources such as amalgam fillings may present a much more cost-effective option.
0.01
0.10
1.00
10.00
100.00
06:15-07:00 07:00-07:45 07:30-08:30 09:30-10:25 09:30-10:30 15:00-15:45 15:45-16:15 16:15-17:00
Con
c. (µ
g/l)
Cdin Cdout Niin Niout Pbin Pbout Hgin Hgout
Figure 5. Metal concentrations in influent and effluent greywater at the Nordhavnsgården treatment plant. The time intervals given on the x-axis indicate the times of sampling but are dispersed over a one week period.
Greywater metal concentrations at Nordhavnsgården were found to vary significantly between sampling times, reflecting the impact of residents’ behaviour on greywater metal loads. Calculated annual greywater metal contributions per inhabitant were <0.01 g of Cd, 0.21 g of Hg, 0.17 g of Ni and 0.12 g of Pb. These values are lower than the average loads per person per year entering Danish municipal wastewater treatment plants, but, aside from the value for Hg which is relatively high, they are in the same order of magnitude as has previously been observed for two Swedish greywater

Priority pollutant behaviour in household wastewater.
Date submitted: 2008-08-11 Date submitted:
File name: D5.2_Final_report[1].doc Page 70
systems (see Palmquist, 2004 in Table 19). In any case, the calculated annual metal loads from greywater are small in comparison with typical loads reported for municipal wastewaters, indicating that greywater is a relatively minor source of metals to combined wastewater systems.
Table 19 Annual metal loads in grey- and domestic wastewater per capita (g person-1 y-1)
Greywater Domestic/Municipal Wastewater (Henze et al., 1996)
Metal This study Palmquist (2004) Denmark Maximum
Cd 0.0015 0.0023-0.017 200-400 500-700
Ni 0.17 0.087-0.59 2000-4000 2000-4000
Pb 0.12 0.062-0.99 5000-10000 5000-10000
Hg 0.21 0.0004-0.0038 100-200 100-200

Priority pollutant behaviour in household wastewater.
Date submitted: 2008-08-11 Date submitted:
File name: D5.2_Final_report[1].doc Page 71
11 Greywater treatment scenario analyses Based on available information a range of scenario analyses have been conducted to investigate the potential impacts of more widespread deployment of household greywater treatment systems, with a particular emphasis on wastewater flow dynamics and the potential benefits (and/or shortcomings) in relation to micropollutant treatment efficiency and pollution control. Greywater has been chosen for further analysis as this is the household wastewater fraction most commonly recycled at present. As indicated in Section 2.1, the simplest definition of ‘greywater’ is that it includes domestic wastewater from all sources except toilets, bidets and urinals. However, greywater can be further defined to take account of the source location within the home (e.g. bathroom vs. kitchen), or even the specific source activity (e.g. showering vs. hand washing). This has been taken into account by including a range of scenarios (presented diagrammatically in Figure 6), which differ not only in terms of the type of treatment considered but also with respect to the type of greywater being treated. Scenarios incorporating greywater reuse for irrigation have also been included as these are very relevant greywater reuse options in water-stressed locations and/or regions with dry summers (e.g. eastern Europe (Abergglen and Siegrist, 2006)).
Input data to these scenario analyses have been based on Danish water use statistics reported by Kjellerup and Hansen (1994) and DANVA (2007), as well as monitoring data (2007) from the Nordhavnsgården greywater treatment plant in Copenhagen.
The following values have been used for the scenario analyses:
Danish potable water consumption: 119 l person-1 day-1 (DANVA, 2007) Proportion of water used in household bathrooms: 35-37 (36) % (Kjellerup and Hansen, 1994) Proportion of water used in laundries: 13-15 (14) % (Kjellerup and Hansen, 1994) Proportion of water used in kitchens: 17-25 (21) % (Kjellerup and Hansen, 1994) Proportion of water used for toilet flushing: 20-27 (23) % (Kjellerup and Hansen, 1994) Proportion of water used for irrigation: 5-7 (6) % (Kjellerup and Hansen, 1994) Proportion of municipal WWTP influent derived from households: 43 % (DANVA, 2007) Volume of sludge produced by greywater treatment: 0.5 l person-1 day-1 (Nordhavnsgården)
Scenario 1: No greywater reuse
This scenario represents the baseline condition most common in Europe at the present time. Greywater is not treated separately or recycled but discharged directly to the sewer and transported to a municipal wastewater treatment plant (WWTP). This means that 94 % of water used for domestic purposes (111.9 l person-1 day-1) is discharged directly to the sewer and 6 % is used for irrigation (7.1 l person-1 day-1).
Scenario 2: Greywater treatment option 1
Both bathroom and laundry greywater (but not kitchen greywater) are treated on-site (using a Nordhavnsgården type treatment plant) and reused for toilet flushing and laundry washing. Sludge from the treatment plant is periodically discharged to the sewer. On this basis, it is calculated that 59.5 l person-1 day-1 of greywater (50 % of the potable water used) is treated onsite. Of this volume, 27.4 l person-1 day-1 can be reused for toilet flushing before being released to the sewer, 16.7 l person-1 day-1
can be reused for laundry washing and then returned to the on-site treatment plant for re-processing, and the surplus of 18.4 l person-1 day-1 of treated greywater will be released to sewer. Overall, this

Priority pollutant behaviour in household wastewater.
Date submitted: 2008-08-11 Date submitted:
File name: D5.2_Final_report[1].doc Page 72
implies a potable water saving of 37.1 %, and a reduction in WWTP total influent volume of 6.4 %. Approximately 0.5 l person-1 day-1 of sludge would be periodically discharged to the sewer without further pre-treatment.
Scenario 3: Greywater treatment option 2
All greywater (bathroom, kitchen and laundry), representing 84.5 l person-1 day-1, is treated on-site using a Nordhavnsgården type treatment plant. The treated greywater is reused for toilet flushing (27.4 l person-1 day-1) with the remainder used for irrigation (57.1 l person-1 day-1, which is in excess of that reportedly used in Denmark). Sludge is periodically discharged to the sewer. This would reduce potable water use by 23 % and the total WWTP influent volume by 22 %. Approximately 0.5 l person-1 day-1 of sludge would be periodically discharged to the sewer.
Scenario 4: Greywater treatment option 3
All greywater (bathroom, kitchen and laundry) is treated using a land-based willow bed system followed by root zone infiltration. On this basis, it is calculated that 84.5 l person-1 day-1 would be treated and reused for irrigation/groundwater recharge. This would reduce the total WWTP influent volume by 32.5 % but potable water usage would remain the same. No sludge disposal is required under this scenario.
As this is a complex field encompassing a wide range of potential treatment trains and spatial scales, as well as numerous reuse options, it has not been feasible to consider all possible greywater treatment and reuse scenarios within the scope of this report. However, the results of the analyses presented above do provide a basic illustration of the possible range of carry-on effects of localised greywater treatment and reuse on broader-scale wastewater flows. For example, it is evident that a considerable volume reduction in terms of total WWTP influent can potentially be achieved. This would also lead to less dilution of combined WWTP influent and hence more concentrated wastewater (potentially resulting in greater WWTP efficiency). Furthermore, it can be seen that some reuse options, such as irrigation, completely remove the volume of treated/ reused water from the combined wastewater flow destined for the municipal WWTP, whereas other reuse options such as toilet flushing merely divert the water temporarily, thereby reducing the demand on potable water and the immediate volume of wastewater discharged to the WWTP, but not necessarily having a significant impact on the overall load of pollutants. Thus, by examining a relatively small number of greywater treatment scenarios it has been shown that there are a range of different benefits which can be achieved both with regard to potable water demand and treatment volume arriving at the WWTP.

Priority pollutant behaviour in household wastewater.
Date submitted: 2008-08-11 Date submitted:
File name: D5.2_Final_report[1].doc Page 73
Daily potable
water use119 l/p/d
Toilet27.4 l/p/d
Irrigation7.1 l/p/d
Bathroom42.8 l/p/d
Laundry16.7 l/p/d
Kitchen25.0 l/p/d
Irrigation0 l/p/d
Laundry0 l/p/d
Toilet0 l/p/d
Surplus0 l/p/d
Scenario 1
Potable H 2O saving = 0 l/p/dWWTP influent reduction = 0 %
Municipal WastewaterTreatment
Plant111.9 l/p/d
GreywaterTreatment
Plant0 l/p/d
Daily potable
water use119 l/p/d
Toilet0 l/p/d
Irrigation0 l/p/d
Bathroom42.8 l/p/d
Laundry16.7 l/p/d
Kitchen25.0 l/p/d
Irrigation7.1 l/p/d
Laundry0 l/p/d
Toilet27.4 l/p/d
Surplus50 l/p/d
Scenario 2
Potable H 2O saving = 34.5 l/p/d (29 %)WWTP influent reduction = 13 %
Municipal WastewaterTreatment
Plant77.4 l/p/d
GreywaterTreatment
Plant84.5 l/p/d
Sludge
Figure 6. Diagrammatic representations of the 4 greywater treatment and reuse scenarios investigated

Priority pollutant behaviour in household wastewater.
Date submitted: 2008-08-11 Date submitted:
File name: D5.2_Final_report[1].doc Page 74
Daily potable
water use119 l/p/d
Toilet0 l/p/d
Irrigation7.1 l/p/d
Bathroom42.8 l/p/d
Laundry16.7 l/p/d
Kitchen25.0 l/p/d
Irrigation0 l/p/d
Laundry16.7 l/p/d
Toilet27.4 l/p/d
Surplus15.4 l/p/d
Scenario 3
Potable H 2O saving = 44.1 l/p/d (37 %)WWTP influent reduction = 17 %
Municipal WastewaterTreatment
Plant67.8 l/p/d
GreywaterTreatment
Plant59.5 l/p/d
Sludge
Daily potable
water use119 l/p/d
Toilet27.4 l/p/d
Irrigation7.1 l/p/d
Bathroom42.8 l/p/d
Laundry16.7 l/p/d
Kitchen25.0 l/p/d
Irrigation0 l/p/d
Laundry0 l/p/d
Toilet0 l/p/d
Surplus0 l/p/d
Scenario 4
Potable H 2O saving = 0 l/p/d (0 %)WWTP influent reduction = 32.5 %
Municipal WastewaterTreatment
Plant27.4 l/p/d
GreywaterTreatment
(Willow bed)84.5 l/p/d
Figure 6 cont’d. Diagrammatic representations of the 4 greywater treatment and reuse scenarios investigated

Priority pollutant behaviour in household wastewater.
Date submitted: 2008-08-11 Date submitted:
File name: D5.2_Final_report[1].doc Page 75
11.1 Dynamics of organic pollutants in greywater treatment systems
In addition to the wastewater flow calculations presented above, modelling applications within the EPI Suite v3.20 (US EPA, 2007) were used to predict the likely environmental partitioning and fate of selected organic PPs in both an aquatic (river/lake) environment (Mackay Level III Fugacity model) and in a conventional activated sludge sewage treatment plant (STPWIN). Although it would be preferable to be able to use models tailored specifically to match greywater composition and treatment conditions, in the absence of suitable models these results do provide some insight into the potential partitioning behaviour of PPs in both soil/wetland based greywater treatment systems and other more conventional on-site treatment plants. In addition, biodegradation data were sourced from a recently compiled database that collates a range of physico-chemical properties for the WFD PPs (Holten Lützhøft et al., 2007).
The results derived from environmental partitioning and fate modelling are presented in Table 20. Both the 3rd level fugacity modelling results and sewage treatment plant modelling results indicate that the majority of substances investigated (i.e. 29 of 33) are likely to partition predominantly to the solid/sludge phase. Only benzene, chloroform, ethylene chloride, and dichloromethane were predicted to differ from this trend, with 7 – 18 % partitioning to the solid phase and the remainder being relatively equally split between the aqueous and gaseous phases. STPWIN results for these 4 compounds predicted volatilisation to be the most important process governing their removal during conventional sewage treatment, with adsorption to sludge only providing a minor contribution.
The relevant biodegradation data are also summarised in Table 20 and indicate that many of the substances are likely to be persistent in the environment. In some cases multiple results are available for a single substance, often resulting in a broad range of reported values. Thus, one third of the pollutants in Table 20 are listed as ‘P-R’ indicating that reported results ranged from persistent to readily biodegradable. This can be attributed largely to variations in experimental conditions as results from both field and laboratory studies have been included.
As biodegradation processes in a Nordhavnsgården style treatment plant are localised to the Rotating Biological Contactor unit and the hydraulic retention time is relatively short (approximately 24 hours), only readily biodegradable substances are likely to be efficiently removed through biodegradation in this type of treatment plant. Of course, it is important to note that biodegradation efficiency will differ according to the particular treatment system and the characteristics of the biofilm/sludge. For instance, in activated sludge or MBR treatment systems removal of hard-to-degrade PPs should be greater in systems which maximize the sludge retention time. Nevertheless, taken together, the biodegradation data presented above support the suggestion that bioprocesses will play a lesser role than that of phase distribution and related processes such as sorption and volatilisation in determining the fate of PPs during greywater treatment. This hypothesis was also supported by STPWIN predictions which indicated that the role of biodegradation as a PP removal process during activated sludge treatment was much smaller than that of sludge adsorption (results not shown).

Priority pollutant behaviour in household wastewater.
Date submitted: 2008-08-11 Date submitted:
File name: D5.2_Final_report[1].doc Page 76
Table 20 Phase distribution modelling results (EPI Suite v3.20, US EPA, 2007) and biodegradability data (Holten Lützhøft et al., 2007) for selected PSs.
Substance name CAS no.
STPWIN: Percentage
adsorbed to sludge (Total % removed)
Level III fugacity model: Phase distribution (%)
Biodegradation2
Air Water Solid phase1 Aerobic Anaerobic Alachlor 15972-60-8 13.3 (13.5) 0.0 10.2 89.7 P Anthracene 120-12-7 52.5 (54.2) 0.2 9.7 90.1 P-R P Atrazine 1912-24-9 3.3 (3.5) 0.0 13.7 86.2 P Benzene 71-43-2 1.1 (68.9) 37.6 48.1 14.3 P-R P Benzo(a)pyrene 50-32-8 91.9 (92.6) 0.0 2.5 97.5 P-R P Benzo(b)fluoranthene 205-99-2 90.2 (90.9) 0.1 3.6 96.2 P-I Benzo(g,h,i)perylene 191-24-2 92.8 (93.6) 0.0 1.8 98.2 P-R Benzo(k)fluoranthene 207-08-9 91.8 (92.6) 0.0 2.6 97.4 P-I Chlorfenvinphos 470-90-6 21.9 (22.2) 0.0 10.7 89.3 P-R Chloroform 67-66-3 1.1 (59.8) 42.8 43.2 14.0 P-R R Chlorpyrifos 2921-88-2 75.7 (76.4) 0.0 4.5 95.5 P-R DEHP 117-81-7 93.2 (94.0) 0.3 3.8 95.9 P-R P Diuron 330-54-1 3.6 (3.7) 0.0 14.6 85.5 P-I P Endosulfan 115-29-7 22.4 (25.2) 0.3 5.0 94.7 P Ethylene chloride 107-06-2 1.4 (34.0) 37.0 44.5 18.4 P-R P-R Fluoranthene 206-44-0 81.4 (82.2) 0.4 7.6 92.1 P-R P Hexachlorobenzene 118-74-1 88.0 (91.1) 0.5 1.3 98.1 P-I R Hexachlorobutadiene 87-68-3 51.9 (88.9) 2.7 3.5 93.8 R R Hexachlorocyclohexane 608-73-1 36.4 (37.0) 0.6 6.1 93.2 P-R P-R Isoproturon 34123-59-6 4.6 (4.7) 0.0 13.4 86.6 Dichloromethane 75-09-2 1.0 (56.9) 46.0 47.1 7.0 Naphthalene 91-20-3 8.3 (23.6) 1.0 12.8 86.2 P-I P-R 4-nonylphenol 104-40-5 90.0 (90.8) 0.3 9.5 90.3 I para-tert-octylphenol 140-66-9 84.0 (84.8) 0.2 9.1 90.8 P P Pentabromodiphenylether 32534-81-9 93.0 (93.8) 0.2 0.9 98.9 P Pentachlorobenzene 608-93-5 79.5 (83.6) 1.0 2.2 96.7 P R Pentachlorophenol 87-86-5 80.5 (81.2) 0.0 2.8 97.2 P-I P-R Simazine 122-34-9 2.4 (2.5) 0.0 19.6 80.4 P-I Tributyltin cation 36643-28-4 74.6 (97.3) 0.4 6.0 93.6 P-I 1,2,4-trichlorobenzene 120-82-1 26.4 (53.1) 4.0 7.3 88.8 P-I P Trifluralin 1582-09-8 84.9 (86.0) 0.1 2.6 97.3 P-I R Indeno(1,2,3-cd)pyrene 193-39-5 92.9 (93.7) 0.0 1.7 98.2 P-I C10-13-chloroalkanes 85535-84-8 59.2 (98.2) 2.8 11.0 86.2 P
1 Solid phase = soil and sediment; 2 P = persistent (<20%), I = inherent persistence (20% – 70%), R = readily biodegradable (>70%)
On the basis of the environmental fate and partitioning data presented, it is possible to draw some general conclusions regarding the likely effects of greywater treatment on larger scale pollutant dynamics. Firstly, it is important to note that the majority of technology-based greywater treatment systems incorporate the use of one or more settling tanks, and sludge is thus produced as part of the treatment process. Furthermore, the majority of greywater treatment systems do not include separate sludge treatment but rely instead on the periodic discharge of sludge via the sewer to a WWTP for further processing and disposal. The modelling results indicate that the vast majority of PPs (with the exception of the most volatile compounds) will predominantly partition to the solid phase and thus remain in the sludge fraction after treatment. Because this sludge is typically purged to a WWTP, the advantage of greywater treatment and reuse from a PP source control perspective remains questionable and automated greywater treatment technologies cannot be seen as highly effective barriers for the removal of household pollutants. In contrast, systems based on the reuse of greywater for garden irrigation or infiltration may well result in lower pollutant loads going to sewer, but care needs to be taken to ensure that unacceptable environmental pollution does not occur due to the release of hazardous substances that are not readily biodegradable in the soil environment. Whilst sludge production and disposal is less relevant for land based treatment systems such as soil filters/wetlands

Priority pollutant behaviour in household wastewater.
Date submitted: 2008-08-11 Date submitted:
File name: D5.2_Final_report[1].doc Page 77
etc. these systems do present a solid phase to which many pollutants will preferentially partition, with the consequence that these treatment systems may act as pollutant sinks which subsequently become long-term sources of these pollutants in the environment. Together, these results indicate that additional source control measures focused on decreasing the PP content of domestic greywater (e.g. green labeling, green procurement, information campaigns, substance substitution, and regulatory controls) continue to be of importance, and should be given further attention in order to minimise the release of PPs from household sources.
11.2 Dynamics of metals and their compounds in greywater treatment systems
Using pH measurements and dissolved oxygen concentrations from the Nordhavnsgården greywater samples as input-data, potentially stable (equilibrium) greywater metal species were identified using ‘Pourbaix’ diagrams (potential/pH diagram) (Campbell and Whiteker, 1969). An environmental fate model (Mackay Level III Fugacity model (US EPA, 2007)) was then applied to estimate the likely distribution of the dominant metal species between the air, water and solid phases, and a geochemical modelling tool (PHREEQC (Parkhurst and Appelo, 2007)) was used to determine whether any of the metals may be oversaturated and thus precipitate during greywater treatment and/or reuse. The reuse scenarios considered were toilet flushing, irrigation, and laundry washing. An input pH of 7.5 and temperature of 25°C were used for the toilet flushing and irrigation modelling scenarios, and a pH of 11 and temperature of 60°C for the laundry washing scenario.
Fugacity modelling (Table 21) showed that the oxide and hydroxide species investigated would predominantly be adsorbed to the solid phase (e.g. soil, sediment, sludge). These results suggest that the removal of metals in onsite treatment plants may be largely associated with sorption and settling, indicating that the major risks associated with the presence of metals in greywater are probably related to the issue of sludge disposal. As described in the previous section, in many cases greywater treatment sludge is discharged directly to sewer, in which case the risk to the environment should not differ from that associated with conventional wastewater treatment systems where the greywater treatment step is not included. This also indicates that greywater treatment probably does not act as a significant source control barrier for metals. Furthermore, in systems where the sludge disposal route is not to sewer (e.g. land disposal), the metal load of the greywater sludge fraction requires further attention, to ensure that soil guideline limits are not exceeded and that home grown food crops are not compromised by increasing metal contents. Soil texture, depth to groundwater, and effluent pH should also be carefully considered to ensure that the environment is adequately protected. Similar considerations are necessary when greywater effluent is to be reused for irrigation purposes.
Table 21 Phase distribution in percentage (%) based on a level III fugacity model [7].
CHEMICAL ID CAS NUMBER
AIR WATER SOLID PHASE*
Cadmium dihydroxide (Cd(OH)2) 21041-95-2 <1 39 61 Nickel dihydroxide (Ni(OH)2) 12054-48-7 <1 39 61 Nickel oxide (Ni3O4) 12137-09-6 <1 46 54 Lead hydroxide (Pb(OH)+) - <1 46 54 Lead dihydroxide (Pb(OH)2) 19783-14-3 <1 46 54 Mercuric oxide (HgO) 21908-53-2 <1 32 67
*Solid phase = soil and sediment

Priority pollutant behaviour in household wastewater.
Date submitted: 2008-08-11 Date submitted:
File name: D5.2_Final_report[1].doc Page 78
Modelling with PHREEQC revealed that the Nordhavnsgården influent was oversaturated with Fe and Al when based on the PHREEQC Saturation Index (SI). These greywater influents were not, however, oversaturated with respect to Pb and Cd; whilst Hg and Ni could not be modelled due to a lack of PHREEQC input parameters for these metals. PHREEQC was also used to investigate several different reuse scenarios using the Nordhavnsgården effluent data. These scenarios were based on the assumption that effluent destined for toilet flushing or irrigation would not undergo any notable changes in pH or temperature, whereas effluent used in the first wash cycle of a laundry machine would undergo a considerable increase in both pH and temperature. An input pH of 7.5 and temperature of 25°C were used for the toilet flushing and irrigation modelling scenarios, and a pH of 11 and temperature of 60°C for the laundry washing scenario. Modelling of these scenarios showed that Al, Fe, K and S would be oversaturated in the toilet-flushing/irrigation scenario, whereas Pb, Al, Ca, Fe, Mg, and Mn would be oversaturated in the laundry scenario. These results indicate that the presence of the PP metals in greywater is unlikely to present any major obstacles for greywater reuse for toilet flushing. Moreover, although reuse for laundry washing may yield oversaturation of Pb minerals which may adhere to clothing, this is unlikely to lead to a significant increase in human exposure at the measured concentrations.

Priority pollutant behaviour in household wastewater.
Date submitted: 2008-08-11 Date submitted:
File name: D5.2_Final_report[1].doc Page 79
12. Risks and uncertainties associated with the reuse and recycling of household wastewaters
Despite the large range of potential chemical contaminants in source separated household wastewaters, it is nevertheless the presence of pathogenic microorganisms that remains of greatest concern for human health (NSW Health, 2000). All of the investigated household wastewater streams can contain a broad range of pathogenic microorganisms (largely due to faecal contamination), and pathogen levels must be reduced during treatment to safe and acceptable levels so that exposure to recycled water does not pose an unacceptable health risk. The disinfection of recycled water is extremely important, and depends largely on earlier treatment steps for its effectiveness. For example, Ottosson (2003) has identified several examples where UV disinfection was unsatisfactory due to the amount of suspended solids remaining in the water at the disinfection stage. As documented throughout this report, a diverse range of chemicals, including PPs, may also be present in household wastewaters, but these are less likely to cause severe human health risks than pathogenic microorganisms, particularly if the recycled water is used for non-potable purposes and pre-treatment is relatively effective. It must also be recognized that although PPs are of concern for their generally hazardous nature, a wide range of other organic and inorganic contaminants may also be present in household wastewaters, including PCBs, linear alkylbenzene sulphonates (LASs), active pharmaceutical ingredients, and natural and synthetic estrogens (Ying et al., 2004). It is thus highly probable that the PPs which are the focus of this report may not always be of the greatest concern as wastewater contaminants, and attention must also be given to other emerging environmental contaminants and associated risks.
Lately, public support for the reuse of greywater has grown considerably in water stressed areas. For example, drought induced water restrictions in Australia have resulted in an enthusiastic public movement towards the application of greywater from laundries for garden irrigation. This increasingly widespread acceptance of water conservation practices is very promising, but most importantly, it highlights the need for timely introduction of guidelines to ensure that reuse is carried out safely. This is paramount to ongoing public acceptance of this resource. Indeed, water re-use schemes are often perceived as quite problematic and high risk, but do not need to be if proper precautions are taken and people are suitably educated regarding the potential risks. Furthermore, health risks linked to unsuitable use of the wrong water supply or mistaken cross connection between potable water and reclaimed water in a dual reticulation system can be minimised by introducing user friendly aspects such as colour coded pipes and taps, warning signs, and removable garden taps (to protect children). These measures are already being implemented in Australia where new developments supporting dual reticulation are plumbed to carry reclaimed water in purple pipes and potable water in green pipes.
With the best of intentions, greywater treatment and the use of dual pipe or third pipe schemes for domestic use of reclaimed water cannot succeed unless technology adoption issues and public acceptance of these systems is carefully addressed. All wastewater reuse and recycling schemes require some behavioural changes and this cannot be ignored when installing such a system without seriously jeopardising the success of the scheme and/or increasing the associated health risks to the user community. It is important to ensure that any required behavioural changes are acceptable to the user public in order to guarantee successful technology uptake and system implementation. For example, ‘no-mix’ toilets require a behavioural change that many would consider radical, requiring men to sit down to urinate. If this behavioural change does not take place, source separation of yellow water and brownwater would not be successful and the recycling system could fail to be of use. Increasing the efficiency of source control through informed choice of household products is another area where the need for public education is evident. This can be instrumental in decreasing the pollutant load of water destined for reuse.

Priority pollutant behaviour in household wastewater.
Date submitted: 2008-08-11 Date submitted:
File name: D5.2_Final_report[1].doc Page 80
Legislation relevant to wastewater reuse and recycling is not yet well developed, and at this stage, most countries do not have specific wastewater reuse guidelines and quality standards for assessing the reuse potential of reclaimed wastewater and any associated risks, but must rely instead on related (but not directly applicable) regulations. For example, the World Health Organisation’s international standards for drinking water (WHO, 2006), and the European Commission’s proposed environmental quality standards (EQS) (EC, 2006) may be used as surrogates for greywater quality assessment in some countries. Throughout Europe, many countries still do not provide water quality targets and/or guidance regarding the level of treatment required prior to reuse. Moreover, where standards do exist, they focus primarily upon conventional water monitoring parameters such as microbial indicator organisms, organic content, turbidity/ suspended solids and pH, and do not specifically address PPs or other micropollutants. Nevertheless, as discharge standards are likely to become increasingly stringent in future, and removal of micropollutants (including endocrine disrupting substances, metals, pesticides, personal care products and pharmaceuticals) is likely to become of increasing concern for wastewater utilities and regulators, it is important to investigate the efficacy of greywater treatment for emerging pollutants and non-standard parameters in order to ensure that treatment can be optimised for the maximum environmental benefit. Furthermore, it is important to recognise that many of the WFD PPs are already subject to increasing regulatory restrictions, as well as substitution, and other types of source control. As noted earlier, numerous other xenobiotic pollutants are also likely to be found in domestic greywater and it is possible that the current PPs will not always present the greatest potential concern when considering the recycling of greywater. It is very important that further work be done to elucidate the range of pollutants commonly present in greywater and to identify those of most concern.
Ongoing management and maintenance of treatment and reuse systems is integral to their success and safety, but can be labour intensive and expensive in some cases. Before implementing any such technologies it is always important to ensure that sufficient resources are available to guarantee the ongoing operation and maintenance of the system. Larger systems can employ professionals whereas smaller single household based systems may require some degree of maintenance by the householders. This is potentially problematic if the required maintenance time and effort is not met by the householders, and it is therefore important to ensure that lack of adequate monitoring and maintenance is not a problem for small-scale sites. Sufficient attention must be given to the public’s perception of risk and acceptability as well as to their ability to utilise the technology. If “small footprint” recycling technologies serve a single home or small community, then it is necessary to know whether individuals are willing and/or able to deal with the practicalities of technology management such as changing filters, fault-finding, etc. (Jeffrey and Temple, 1999). Some advanced control systems now incorporate real-time remote monitoring systems with multi-layered alarm response protocols coupled with early warning devices (Dimitriadis, 2005). However, Melin et al. (2006) note that although online-integrity testing is becoming standard procedure for drinking water applications, its implementation in wastewater treatment schemes is relatively rare. Nevertheless, greater use of advanced adaptive technology such as this can make it possible to control system operation from almost any location at any time and may enable urban recycling operations to be more easily monitored in the future (Dimitriadis, 2005). Contingency plans should also be developed to ensure that treatment processes are sufficiently robust to maintain effective treatment under unsteady state feed conditions (including cessation of feed and pollutant surges) and so that system failure does not cause unacceptable levels of risk. Piloting of proposed systems is also fundamental, to ensure that problems are avoided in the full scale plant. This is necessary even if well-developed technologies are to be used (DTI, 2006). Disposal issues for excess treated wastewater and sludge generated as a result of treatment processes should also be addressed.

Priority pollutant behaviour in household wastewater.
Date submitted: 2008-08-11 Date submitted:
File name: D5.2_Final_report[1].doc Page 81
13. Conclusions In this report, the literature documenting the presence and fate of the selected PPs in household wastewater fractions has been thoroughly reviewed, and existing and emerging technologies for treating and/or recycling household wastewaters (grey, yellow, black and brown) at the individual household or community scale have been identified and described. Treatment efficiency data for PPs in relevant systems were found to be severely restricted and did not enable firm conclusions and recommendations to be drawn on the basis of published experimental results. Thus, in order to provide some insight into the likely fate of PPs in source separated treatment, case study data from the Nordhavnsgården treatment plant were also presented, and theoretical scenario analyses with a special emphasis on greywater (currently the most commonly recycled household wastewater stream) were carried out.
Although it was not feasible to consider all possible greywater treatment and reuse scenarios within the scope of this report, the results do illustrate that localised greywater treatment and reuse can potentially achieve considerable volume reductions with regard to total WWTP influent. The resulting concentration increases in the combined WWTP influent have the potential to contribute to greater WWTP efficiencies. The influence of the reuse option can be demonstrated by the fact that irrigation completely removes the volume of treated greywater from the wastewater flow reaching the WWTP, whereas other reuse options such as toilet flushing may only provide a temporary diversion, thereby reducing the demand on potable water and the immediate volume of wastewater discharged to the WWTP, but not necessarily having a significant impact on the overall load of pollutants. In contrast, systems based on the reuse of greywater for garden irrigation or infiltration will result in lower pollutant loads entering the sewer, but care needs to be taken to ensure that unacceptable environmental pollution does not occur due to the release of hazardous substances that are not readily biodegradable in the soil environment. The further examination of greywater treatment scenarios is advocated for providing an insight into the range of benefits which can be achieved both with regard to potable water demand and treatment volume arriving at the WWTP.
Geochemical modelling was used in this report to help determine the likely partitioning behaviour of PPs during greywater treatment and prompted the conclusion that, as the majority of greywater treatment systems rely on sludge disposal to sewer and many PPs partition predominantly to the sludge fraction during treatment, greywater treatment is unlikely to be of major use from a source control perspective and will not provide a significant pollutant barrier for the majority of PPs. Thus, although the benefits of greywater recycling and source separation are obvious in terms of water savings, the benefits in relation to source control are less certain. Therefore, additional source control measures directed at reducing the PP content of domestic greywater (e.g. green labeling, green procurement, information campaigns, substance substitution, and regulatory controls) will continue to be important.
Due to continually increasing pressures on potable water supplies, the impetus for water reuse and recycling is steadily increasing. With increasingly widespread adoption of water reuse practices, it is imperative that any risks are recognised and addressed, and that suitable regulations and guidelines are put in place to protect public health and the environment, for this is an area where policy is generally either still in development or entirely lacking. Health risks associated with incorrect use of the wrong water supply or mistaken cross connections between potable water and reclaimed water in a dual reticulation system can be minimised by introducing user friendly aspects such as colour coded pipes and taps, warning signs, and removable garden taps. However, it is only when there is sufficient

Priority pollutant behaviour in household wastewater.
Date submitted: 2008-08-11 Date submitted:
File name: D5.2_Final_report[1].doc Page 82
information regarding the mixture of hazardous substances occurring in source separated wastewaters and their fate in available treatment systems that adequate steps can be taken to ensure that human exposure is limited and that release to the environment and subsequent accumulation is minimised. These steps should not only include the introduction of well informed policy that supports reuse whilst minimising the risks, but should also see increased effort to exercise source control options to decrease the hazardous substance content of wastewaters. The risks associated with wastewater reuse are certainly there, but clever engineering, well informed policy, and good end-user engagement can go a long way towards ensuring that these risks are minimised.

Priority pollutant behaviour in household wastewater.
Date submitted: 2008-08-11 Date submitted:
File name: D5.2_Final_report[1].doc Page 83
References Abegglen, C., and Siegrist, H. (2006). Domestic wastewater treatment with a small-scale membrane bioreactor. Water Science & Technology. 53(3): 69–78. Ahel, M., Giger, W., Koch, M. (1994). Behaviour of alkylphenol polyethoxylate surfactants in the aquatic environments. Occurrence and transformation in sewage treatment. Water Research, 28(5): 1131-1142. Almeida, M.C., Butler, D., and Friedler, E. (1999). At-source domestic wastewater quality. Urban Water. 1: 49 – 55. Andersson , Å., and Jenssen, A. (2002). Flöden och sammansättning på BDT-vatten, urin, fekalier och fast organiskt avfall i Gebers (Flows and comosition of greywater, urine, faeces and solid biodegradable waste in Gebers: In Swedish, English summary). Insitutionsmeddelande 2002: 05, Department of Agricultural Engineering, Swedish University of Agricultural Sciences, Uppsala, Sweden. Andersson M. & Dalsgaard A. (2004a) Etablering og drift af anlæg til opsamling, rensning og genanvendelse af gråvand til toiletskyl og maskinvask af tøj. Økologisk byfornyelse og spildevandsrensning no. 47. http://www2.mst.dk/Udgiv/publikationer/2004/87-7614-151 9/html/default.htm Andersson M and Dalsgaard A (2004b) Demonstrationsprojekt med genanvendelse af gråt spildevand fra en større gråvandsproducent Økologisk byfornyelse og spildevandsrensning Nr. 46 http://www2.mst.dk/Udgiv/publikationer/2004/87-7614-149-7/html/default.htm Andreoli, R., Manini, P., Bergamaschi , E., Mutti, A., Franchini, I., and Niessen W.M.A. (1999). Determination of naphthalene metabolites in human urine by liquid chromatography–mass spectrometry with electrospray ionization. Journal of Chromatography A, 847: 9–17 Alkalde, T.K., Peralba, M.C.R., Zini, C.A., Caramão, E.B. (2004). Quantitative analysis of benzene, toluene, and xylenes in urine by means of headspace solid-phase microextraction Journal of Chromatography A, 1027: 37–40. AQUAREC. (2004). Integrated concepts for reuse of upgraded wastewater. Review report on wastewater treatment unit operations. AQUAREC EVK1-CT-2002-00130, Work Package 7, Deliverable D17. Eds: V. Miska, A. Ravazini, and J. de Koning. Accessed via: http://www.ivt.rwth-aachen.de/index.php?id=311 Arrebola, F.J., Martinez Vidal, J.L., and Fernández-Gutiérrez, A. (1999). Excretion study of endosulfan in urine of a pest control operator. Toxicology Letters. 107: 15–20. Atkinson, S. (2005). Conference report: Integrated Concepts in Water Recycling 2005. Membrane Technology, August, 2005. Avery, L.M., Frazer-Williams, R.A.D., Jeffersen, B., and Shirley-Smith, C. (2006). Green Roof Water Recycling System ‘GROW’. Final report for the Department of Trade and Industry ‘Partners in Innovation’ Programme. Cranfield University. Bán, Z.S., and Dave, G. (2004). Laboratory studies on recovery of N and P from human urine through struvite crystallisation and zeolite adsorption. Environmental Technology. 25(1): 111 – 121. Bartels, P., Ebeling, E., Krämer, B., Kruse, H., Osius, N., Vowinkel, K., Wassermann, O., Witten, J., and Zorn C. (1999). Determination of chlorophenols in urine of children and suggestion of reference values. Fresenius Journal of Analytical Chemistry. 365 :458–464 Birks, R., Colbourne, J., Hills, S., and Hobson, R. (2004). Microbiological water quality in a large in-building water recycling facility, Water Science and Technology. 50(23): 165–172.

Priority pollutant behaviour in household wastewater.
Date submitted: 2008-08-11 Date submitted:
File name: D5.2_Final_report[1].doc Page 84
Bjorkman, L., Sandborgh Englund, G., Ekstrand, J. (1997). Mercury in saliva and feces after removal of amalgam fillings. Toxicology and applied pharmacology, 144(1): 156-162. Burrows, W.D., Schmidt, M.O., Carnavale, R.M. and Schaub, S.A. (1991). Nonpotable reuse: Development of health criteria and technologies for shower water recycle. Water Science and Technology. 24(9): 81 – 88. Campbell, J. A. and Whiteker, R. A. (1969). A Periodic Table Based on Potential-pH Diagrams. Journal of Chemical Education. 46(2): 90-92. Casanova, L.M., Gerba, C.P., and Karpiscak, M.M. (2001a). Chemical and microbial characterisation of household greywater. Journal of Environmental Science and Health. 36(4): 395 – 401. Casanova, L.M., Little, V., Frye, R.J., and Gerba, C.P. (2001b). A survey of the microbial quality of recycled household greywater. Journal of the American Water Resources Association. 37(5): 1313 – 1319. Chang, S., Waite, T.D., Schaefer, A.I., and Fane, A.G. (2003). Adsorption of trace hormones on microfiltration hollow fibre membranes. Environmental Science and Technology. 37(14): 3158 – 3163. Chino, M., Moriyama, K., Saito, H., and Mori, T. (1991). The amount of heavy metals derived from domestic sources in Japan. : Water Air and Soil Pollution, 57-8, 829-837. Christova-Boel, D., Eden, R.E., and McFarlane, S. (1996). An investigation into greywater reuse for urban residential properties. Desalination. 106: 391 – 397. CIBA Geigy (1977). Wissenschaftliche Tabellen Geigy. Teilband Körperflüssigkeiten. 8th Edition. Basel, (In German). Cited in Tettenborn, F., Behrendt, J., and Otterpohl, R. (2007). Resource recovery and removal of pharmaceutical residues – Treatment of separate collected urine. Final report for task 7 of the demonstration project ‘Sanitation Concepts for Separate Treatment of Urine, Faeces, and Greywater (SCST). Accessed via: http://www.kompetenz-wasser.de Cooper, P.F. (2001). Historical aspects of wastewater treatment. In: Decentralised sanitation and reuse: Concepts, systems and implementation. Eds: P. Lens, G. Zeeman, and G. Lettinga. Integrated Environmental Technology Series. IWA Publishing, London. pp 11 – 38. Crittenden, J.C., Sanongraj, S., Bulloch, J.L., Hand, D.W., Rogers, T.N., Speth, T.F. and Ulmer, M. (1999). Correlation of aqueous-phase adsorption isotherms. Environmental Science and Technology. 33: 2926 – 2933. DANVA (2007) Danish Water and Wastewater Association VAND I TAL DANVA’s Benchmarking og Vandstatistik 2007. Accessed via http://www.bessy.dk Daughton, C.G., and Ternes, T.A. (1999). Pharmaceutical and personal care products in the environment: Agents of subtle change? Environmental Health Perspectives. 107(Supplement 6): 907 – 942. De Boer, J. (2006). Brominated flame retardants in the environment. The price for our convenience? Environmental Chemistry. 1: 81-5. Diaper, C. (2004). Innovation in on-site domestic water management systems in Australia: A review of rainwater, greywater, stormwater and wastewater utilisation techniques. Australian Water Conservation and Reuse Research Program Report. CSIRO Urban Water, CSIRO MIT Technical Report 2004-073. ISBN 0 643 09182 3. Dimitriadis, D. (2005). Issues encountered in advancing Australia’s water recycling schemes. Research Brief No. 2, 2005-06. Accessed via: http://www.aph.gov.au/library/pubs/RB/2005-06/06rb02.htm DTI (2006). UK Department of Trade and Industry. Water recycling and reuse in Singapore and Australia. Global Watch Mission Report. DTI, London.

Priority pollutant behaviour in household wastewater.
Date submitted: 2008-08-11 Date submitted:
File name: D5.2_Final_report[1].doc Page 85
Dyck-Madsen, S., Mikkelsen, PS., Hoffmann, B. (1999). Alternative spildevandssystemer - 10 illustrerede eksempler fra Sverige. Technical University of Denmark ID: dtu173685. EC (2003). European Commision. Report from the Commission to the Council and the European Parliament on the implementation of Community waste legislation for the period 1998-2000. COM(2003) 250 final. EC (2006). European Commission. Proposal for a directive of the European Parliament and of the Council on environmental quality standards in the field of water policy and amending Directive 2000/60/EC; 2006. Retrieved December 2007 from http://eur-lex.europa.eu/LexUriServ/LexUriServ.do?uri=COM:2006:0397:FIN:EN:PDF. EcoSanRes (2005). EcoSanRes Fact Sheet 8 – Introduction to greywater management. Based on Ridderstolpe, P. (2004). Introduction to greywater management. EcoSanRes Publication Series, Report 2004-4. Stockholm Environment Institute; Stockholm, Sweden. Accessed via: www.ecosanres.org ENEA, 2001 ENEA (Italian National Agency for New Technologies, Energy and Environment) Section of Wastewater Treatment and Water Cycle. http://www.bologna.enea.it/ambtd/aquasave-doc/aquas-ing.htm) Engqvist, A. (1998). Mercury exposure from amalgam fillings – analysis of mercury in different biological matrices and speciation in the faeces. Arbete och hälsa – Vetenskaplig skriftserie. Institutionen för analytisk kemi. Stockholms Universitet. EPA Victoria. (2006). Water reuse and recycling web pages. http://www.epa.vic.gov.au/water, http://www.health.vic.gov.au/environment Eriksson, E., Auffarth, KPS., Henze, M., Ledin, A. (2002) Characteristics of grey wastewater. Urban Water. 4: 85-104. Eriksson, E., Auffarth, K.P.S., Eilersen, A.M., Henze, M., Ledin, A. (2003) Household chemicals and personal care products as sources for xenobiotic organic compounds in grey wastewater. Water S.A.. 29(2), 135-146. Eriksson, E., and Ledin, A. (2003). Analysis of long-chain fatty acids in grey wastewater with in-vial derivatisation. International Journal of Environmental Analytical Chemistry. 83 (12) 987–995 Eriksson, E., Yan, X., Lundsbye, M., Madsen, T.S., Andersen, H., Ledin, A. (2007) Variation in grey wastewater quality reused for toilet flushing. In: Guiding the growth of water reuse, 6th IWA Specialty Conference on Wastewater Reclamation and Reuse of Sustainability, 9-12 October 2007, Antwerp, Belgium, 2007, IWA publishing. European Commission Directives: All European Union legislation is accessible from http://eur-lex.europa.eu/en/index.htm Friedler, E. and Hadari, M. (2006). Economic feasibility of on-site greywater reuse in multi-storey buildings. Desalination. 190: 221–234. Friedler E., Kovalio, R., and Galil, N.I. (2005). On-site greywater treatment and reuse in multi-storey buildings Water Science and Technology. 51(10): 187–194. Friedler E., Kovalio, R., and Ben-Zvi, A. (2006). Comparative study of the microbial quality of greywater treated by three on-site treatment systems Environmental Technology. 27: 653-663. Gerba, C.P., Straub, T.M., Rose, J.B., Karpiscak, M.M., Foster, K.E., and Brittain, R.G. (1995). Water quality of graywater treatment system. Water Resources. 31(1): 109 – 116. Gray, N.F. (2004). Biology of wastewater treatment. Series on Environmental Science and Management, Vol. 4. 2nd Edition. Imperial College Press. 1421pp. Green, W., and Ho, G. (2005). Small-scale sanitation technologies. Water Science & Technology. 51(10): 29–38

Priority pollutant behaviour in household wastewater.
Date submitted: 2008-08-11 Date submitted:
File name: D5.2_Final_report[1].doc Page 86
Gulyas, H., Bruhn, P., Furmanska, M., Hartrampf, K., Kot, K., Luttenberg, B., Mahmood, Z. (2004). Freeze concentration for enrichment of nutrients in yellow water from no-mix toilets. Water Science & Technology. 50(6): 61–68 Gundel, J., and Angerer, J. (2000). High-performance liquid chromatographic method with fluorescence detection for the determination of 3-hydroxybenzo[a]pyrene and 3-hydroxybenz[a]anthracene in the urine of polycyclic aromatic hydrocarbon-exposed workers. Journal of Chromatography B. 738: 47–55 Günther, F. (2000). Wastewater treatment by greywater separation: Outline for a biologically based greywater purification plant in Sweden. Ecological Engineering. 15: 139 – 146. Hargelius, K., Holmstrand, O., and Karlsson, L. (1995). Hushallsspillvatten Framtagande av nya schablonvärden för BDT-vatten. In Vad innehaller avlopp fran hushall? Näring och metaller i urin och fekalier samt i disk-, tvätt, bad- and duschvatten. Stockholm: Swedish EPA (Naturvardsverket). Hanaeus, J., Hellstrom, D., and Johansson, E. (1997). A study of urine separation in an ecological village in northern Sweden. Water Science and Technology. 35(9):153 – 160. Hara, K., Hanaoka, T., Yamano, Y., and Itani, T. (1997). Urinary 1-hydroxypyrene levels of garbage collectors with low-level exposure to polycyclic aromatic hydrocarbons. The Science of the Total Environment. 199: 159-164. Hecht, S.S., Grabowski, W., Groth, K. (1979). Analysis of faeces for benzo(a)pyrene after consumption of charcoal broiled beef by rats and humans. Food and Cosmetics Toxicology, 17(3): 223-227. Hellström, D. (1999). Exergy analysis: A comparison of source separation systems and conventional treatment systems. Water Environment Research. 71(7): 1354 – 1363. Henze, M., Harremoës, P., la Cour-Jansen, J. and Arvin, E. (1996). Wastewater treatment – Biological and chemical processes, 2nd edition. Springer Verlag Berlin, 27-30. Heudorf, U., Butte, W., Schulz, C., and Angerer, J. (2006). Reference values for metabolites of pyrethroid and organophosphorous insecticides in urine for human biomonitoring in environmental medicine. International Journal Hygiene and Environmental-Health. 209: 293–299. Hills, S., Birks, R., and McKenzie, B. (2002). The Millenium Dome ‘Watercycle’ experiment: to evaluate water efficiency and customer perception at a recycling scheme for 6 million visitors. Water Science and Technology. 46(6-7): 233-240. Höglund, C.E., and Stenström, T.A.B. (1999). Survival of cryptosporidium parvum oocysts in source separated human urine. Canadian Journal of Microbiology. 45: 740-746. Höglund, C., Vinnerås, B., Stenström, T.A., Jönsson, H. (2000). Variation of chemical and microbial parameters in collection and storage tanks for source separated human urine. Journal of Environmental Science and Health Part A – Toxic/Hazard. Substances Environmental Engineering. 35: 1463 – 1475. Höglund, C. (2001). Evaluation of microbial health risks associated with the reuse of source-separated human urine. Doctoral thesis. Royal Institute of Technology, Stockholm. Höglund, C., Ashbolt, N., Stenström, T.A., Svensson, L. (2002a). Viral persistence in source-separated human urine. Advances in Environmental Research. 6: 265 – 275. Höglund, C., Stenström, T.A., Ashbolt, N. (2002b). Microbial risk assessment of source-separated urine used in agriculture. Waste Management Research. 20: 150 – 161. Holten Lützhøft, H-C., Eriksson, E., Scholes, L., Donner, E., Wickman, T., Sörme, L., Lecloux, A. Ledin, A. (2007). Database presenting basic information on the PPs, Deliverable 3.1 of the ScorePP project, p. 1-3 +
Priority pollutant behaviour in household wastewater.
Date submitted: 2008-08-11 Date submitted:
File name: D5.2_Final_report[1].doc Page 87
Appendix 1 (Powerpoint presentation: D3.1 Compilation of PP Inherent Properties) and Appendix 2 (Database). Available from www.scorepp.eu. Höök, F. (2007) Handdukar med ett smutsigt förflutet (Towels with a dirty history) Swedish Society for Nature Conservation Retrieved from http://www.snf.se (In Swedish) Hore, P., Zartarian, V., Xue, J., Özkaynak, H., Wang, S-W., Yang, Y-C., Chu, P-L., Sheldon, L., Robson, M., Needham, L., Barr, D., and Freeman, N., Georgopoulos, P., Lioy, P.J. (2006). Children's residential exposure to chlorpyrifos: Application of CPPAES field measurements of chlorpyrifos and TCPy within MENTOR/SHEDS-Pesticides model. Science of the Total Environment. 366: 525–537. Hovvang, M. (2002) Nedsivning af paracetamol, ibuprofen, caffeine, 4-nonylphenol ethoxylat (NPEO) ungersøgt ved laboratorieforsøg. Msc thesis, Institute of Environment & Resources, Technical University of Denmark. (In Danish) Huang, C.H., and Sedlak, D.L. (2001). Analysis of estrogenic hormones in municipal wastewater effluent and surface water using enzyme-linked immunosorbent assay and gas chromatography/tandem mass spectrometry. Environmental Toxicology and Chemistry. 20: 133 – 139. Huang, C.H., Renew, J.E., Smeby K.L., Pinkston, K., and Sedlak, D.L. (2001). Assessment of potential antibiotic contaminants in water and preliminary occurrence analysis. Water Research. 120: 133 – 139. Hung I-Fu, Lee Shu-An, Chen Ren-Kun. (1998). Simultaneous determination of benzene, toluene, ethylbenzene and xylenes in urine by thermal desorption-gas chromatography. Journal of Chromatography B. 706: 352-357. Huntsman, B.E., Staples, C.A., Naylor, C.G., Williams, J.B. (2006) Treatability of nonylphenol ethoxylate surfactants in on-site wastewater disposal systems. Water Environment Research. 78 (12): 2397-2404. Hypes, W.D. (1974). Characterisation of typical household greywater. In: J.H.T. Winneberger (Ed.). Manual of greywater treatment practice. pp 79, 88. Inoue, K., Kawaguchi, M., Okada, F., Takai, N., Yoshimura, Y., Horie, M., Izumi, S., Makino, T., Nakazawa, H. (2003). Measurement of 4-nonylphenol and 4-tert-octylphenol in human urine by column-switching liquid chromatography–mass spectrometry. Analytica Chimica Acta. 486: 41–50 Ishihara, N. (2000). Excretion of methyl mercury in human faeces. Archives of Environmental Health. 55(1): 44-47. ISTAT (2004). Istituto Nazionale di Statistica, Sistema di Indagini delle Acque 1999 (Italian National Statistical Institute, Water Survey System 1999). Available at http://acqua.istat.it/ (In Italian) Ivahnenko and Zogorski (2006). Sources and occurrence of chloroform and other trihalomethanes in drinking-water supply wells in the United States, 1986–2001: U.S. Geological Survey Scientific Investigations Report 2006 – 5015. http://pubs.usgs.gov/sir/2006/5015/sir2006-5015.pdf, Accessed: 04.01.08 Jacks, G., Forsberg, J., Mahgoub, F. and Palmqvist, K. (2000). Sustainability of local water supply and sewage system — a case study in a vulnerable environment. Ecological Engineering, 15(1-2): 147-153. Jacob, P., Wilson, M., and Benowitz, N.L. (2007). Determination of phenolic metabolites of polycyclic aromatic hydrocarbons in human urine as their pentafluorobenzyl ether derivatives using liquid chromatography-tandem mass spectrometry. Analytical Chemistry. 79:587-598. Jefferson, B., Laine, A.L., Stephenson, T., and Judd, S. (2001). Advanced biological unit processes for domestic water recycling. Water Science and Technology. 43: 211-218 Jefferson, B., Burgess, J.E., Pichon, A., Harkness, J., and Judd, S.J. (2001). Nutrient addition to enhance biological treatment of greywater. Water Research. 35(11): 2702 – 2710.

Priority pollutant behaviour in household wastewater.
Date submitted: 2008-08-11 Date submitted:
File name: D5.2_Final_report[1].doc Page 88
Jeffrey, P., and Temple, C. (1999). Sustainable water management: some technological and social dimensions of water recycling, Sustainable Development International 1 pp. 63–66. Jeppsen, B. (1993). Domestic greywater reuse: Preliminary evaluation. Urban Water Research Association of Australia. ISBN 1875298 614. Johnston, A.E., and Richards, L.R. (2003). Effectiveness of different precipitated phosphates as phosphorous sources for plants. Soil Use and Management. 19(1): 45 – 49. Jönsson, H., Stenström, T.A., Svensson, J., and Sundin, A. (1997). Source separated urine-nutrient and hevay metal content, water saving, and faecal contamination. Water Science and Technology. 35(9): 145 – 152. Jönsson H, Vinnerås B, Höglund C, and Stenström T-A. (1999). Source separation of urine - an added function to the sewage system aiming at sustainability. Wasser und Boden. 51: 21–5. Jönsson, H., Baky, A., Jeppsson, U., Hellström D, and Kärrman E. (2005). Composition of urine, faeces, greywater and bio-waste. Urban Water Report 2005:6, Chalmers University of Technology, Göteborg. Kadlec, R.H., and Knight, R.L. (1999). Treatment wetlands. Boca Raton: Lewis. Kawaguchi, M., Ito, R., Sakui, N., Okanouchi, N., Saito, K., Seto, Y., Nakazawa, H. (2007). Stir-bar-sorptive extraction, with in-situ deconjugation, and thermal desorption with in-tube silylation, followed by gas chromatography-mass spectrometry for measurement of urinary 4-nonylphenol and 4-tert-octylphenol glucuronides. Analytical and Bioanalytical Chemistry. 388: 391 - 398. Kies and Ip (1991) Lead bioavailability to humans from diets containing constant amounts of lead – impact of supplemental Cu, Zn and Fe. Trace substances in Environmental Health – XXIV, 177-184. Kjellerup, M., Hansen, A.M. (1994). Vandbesparende foranstaltninger. Copenhagen: Teknisk Forlag: 1994. ISBN 87 571 1435 9 (In Danish). Kujawa-Roeleveld, K., Elmitwalli, T., Gaillard, A., van Leewen, M., and Zeeman, G. (2003). Co-digestion of concentrated black water and kitchen refuse in an accumulation system within the DESAR (decentralised sanitation and reuse) concept. Water Science and Technology. 48(4): 121 – 128. Laak, R. (1974). Relative pollution strengths of undiluted waste materials discharged in households and the dilution waters used for each. In J.H.T. Winneberger (Ed.) Manual of grey water treatment practice. pp 68 - 78. Ann Arbor. MI: Ann Arbor Science. Larsen, T.A., and Gujer, W. (1996). Separate management of anthropogenic nutrient solutions (human urine). Water Science and Technology. 34(3-4): 87-94 Larsen, T.A., Peters, I., Alder, A., Eggen, R., Maurer, M. and Muncke, J. (2001). Re-engineering the toilet for sustainable wastewater management. Environmental Science and Technology, 35(9): 192A-197A Larsen, T.A., Lienert, J., Joss, A., Siegrist, H. (2004). How to avoid pharamceuticals in the aquatic environment. Journal of Biotechnology. 113(1-3): 295 – 304. Larsen, N.J. (2006). Demonstrationsprojekt i fuldskala for rensning af gråt spildevand Økologisk byfornyelse og spildevandsrensning, No. 59 http://www2.mst.dk/Udgiv/publikationer/2006/87-7052-149-2/html/default.htm Ledin, A., Auffarth, K., Eriksson, E., Smith, M., Eilersen, A-M., Henze, M., and Mikkelsen, P.S. (2002). Undersogelse af lokal håndtering af gråt spildevand (Investigation of local handling of grey wastewater). Environment and Resources DTU. Technical University of Denmark and Danish EPA. (In Danish). Ledin A., Auffarth K., Eriksson E., Smith M., Eilersen A-M., Mikkelsen P.S., Dalsgaard A. & Henze M. (2006) Udvikling af metode til karakterisering af gråt spildevand. Økologisk byfornyelse og spildevandsrensning, no. 58. http://www.mst.dk/Udgivelser/Publikationer/2006/07/87-7052-116-6.htm

Priority pollutant behaviour in household wastewater.
Date submitted: 2008-08-11 Date submitted:
File name: D5.2_Final_report[1].doc Page 89
Lee, B.L., Ong, H.Y., Ong, Y.B., Ong, C.N. (2005). A sensitive liquid chromatographic method for the spectrophotometric determination of urinary trans,trans-muconic acid. Journal of Chromatography B. 818: 277–283. Lienert, J., Burki, T., and Escher, B.I. (2007). Reducing micropollutants with source control: substance flow analysis of 212 pharmaceuticals in faeces and urine Water Science and Technology. 56: 87-96. Lind, B.B., Ban, Z., Byden, S. (2001). Volume reduction and concentration of nutrients in human urine. Ecological Engineering. 16(4): 561 – 566. Loyo-Rosales, J., Rice, C., Torrents, A. (2007). Fate of Octyl- and Nonylphenol Ethoxylates and Some Carboxylated Derivatives in Three American Wastewater Treatment Plants. Environmental Science and Technology. 41: 6815-6821. Lundin, M., Bengtsson, M., and Molander, S. (2000). Life cycle assessment of wastewater systems: Influence of system boundaries and scale on calculated environmental loads. Environmental Science and Technology. 34(1): 180-186. Luo, X.W., Ong, H.Y., Tan, C., Foo, S.C. and Ong, C.N. (1997). Environmental and biological monitoring of organochlorine residues after the plague epidemic in Surat, India - a preliminary study. Environmental monitoring and assessment. 44: 369-374. Lynettefællesskabet I/S (2007) Information regarding volumes and size retrieved from their homepage http://www.lyn-is.dk/ Mao, L., Sun, C., Zhang, H., Li, Y., Wu, D. (2004). Determination of environmental estrogens in human urine by high performance liquid chromatography after fluorescent derivatisation with p-nitrobenzoyl chloride. Analytica Chimica Acta. 522: 241–246. March J.G., Gual M., Orozco F. (2004) Experiences on greywater re-use for toilet flushing in a hotel (Mallorca Island, Spain). Desalination. 164: 241-247. Maurer, M., Pronk, W., and Larsen, T.A. (2006). Treatment processes for source-separated urine. (Review). Water Research. 40: 3151 – 3166. Meeker, J.D., Barr, D.B., and Hauser, R. (2006). Thyroid hormones in relation to urinary metabolites of non-persistent insecticides in men of reproductive age. Reproductive Toxicology. 22: 437–442 Melin, T., Jefferson, B., Bixio, D., Thoeye, C., De Wilde, W., De Koning, J., van der Graaf J., and Wintgens, T. (2006). Membrane bioreactor technology for wastewater treatment and reuse. Desalination. 187: 271–282. Mendaš, G., Tkalcevic, B., and Drevenkar, V. (2000). Determination of chloro- and methylthiotriazine compounds in human urine: extraction with diethyl ether and C18 solid-phase extraction for gas chromatographic analysis with nitrogen-selective and electron capture detection. Analytica Chimica Acta. 424: 7–18. Meuling, W.J.A., Ravensberg, L.C., Roza, L., van Hemmen, J.J. (2005). Dermal absorption of chlorpyrifos in human volunteers. International Archives of Occupational and Environmental Health. 78: 44–50. Mikkelsen, P.S., Holten Lützhøft H-C., Eriksson, E., Ledin, A., Donner, E., Scholes, L., Revitt, M., Lecloux, A., Wickman, T., Atanasova, N., Kompare, B., and Banovec., P. (2007). Source Control Options for Reducing Emission of Priority Pollutants from Urban Areas – Source Characterisation. Presentation at the 11th International Conference on Diffuse Pollution and 1st Joint Meeting of the IWA Diffuse Pollution and Urban Drainage Specialist Groups, Belo Horisonte, Brazil, 26-31 August 2007. Nghiem, L.D., Schaefer A.I., and Elimelech, M. (2005). Nanofiltration of Hormone Mimicking Trace Organic Contaminants. Separation Science and Technology. 40(13): 2633 – 2649.

Priority pollutant behaviour in household wastewater.
Date submitted: 2008-08-11 Date submitted:
File name: D5.2_Final_report[1].doc Page 90
Nghiem, L.D., Oschmann, N., and Schaefer, A.I. (2006). Fouling in greywater recycling by direct ultrafiltration. Desalination. 187: 283 – 290. Nielsen M and Pettersen T (2005) Genanvendelse af gråt spildevand på campingpladser - Fase 2 og 3 Økologisk byfornyelse og spildevandsrensning no. 57. Report to the Danish EPA http://www2.mst.dk/Udgiv/publikationer/2005/87-7614-899-8/html/default.htm Nolde, E. (1999). Greywater reuse systems for toilet flushing in multi-storey buildings – over ten years experience in Berlin. Urban Water. 1: 275 – 284. NSW Health. (2000). Greywater reuse in sewered single domestic premises. New South Wales Department of Health Report. Accessed via: www.health.nsw.gov.au Otterpohl, R., Braun, U., and Oldenburg, M. (2002). Innovative technologies for decentralised wastewater management in urban and peri-urban areas. Keynote Presentation at IWA Small2022, Istanbul, September 2002. Otterpohl, R., Braun, U., and Oldenburg, M. (2003). Innovative technologies for decentralised water-, wastewater and biowaste management in urban and peri-urban areas. Water Science and Technology. 48(11-12): 23–32. Ottosson, J. (2003). Hygiene aspects of greywater and greywater reuse. Licentiate thesis. Royal Institute of Technology, Department of Land and Water Resources Engineering, and the Swedish Institute for Infectious Disease Control, Department of Water and Environmental Microbiology. ISBN 91-7283-436-6. Accessed via: www.diva-portal.org/diva/getDocument?urn_nbn_se_kth_diva-1551-2__fulltext.pdf Overgaard Pedersen P. (2003) Vurdering af etablerede forsøg med opsamling, rensning og genanvendelse af gråvand til toiletskyl (Evaluation of established trials for collection, treatment and reuse of greywater for toilet flushing) Danish EPA, Økologisk byfornyelse og spildevandsrensning No. 42, 2003 http://www.mst.dk Palm, O., Malmén, L., Jönsson, H. (2002). Robusta, uthålliga små avlopp. En kunskapssammanställning (Robust, sustainable small wastewater systems - A literature review). Report 5224, Swedish Environmental Protection Agency, Stockholm. (In Swedish with English summary). Palmquist, H. (2004) Hazardous substances in wastewater management. Doctoral thesis 2004:47, Luleå University of Technology. Accessed via http://epubl.luth.se/1402-1544/2004/47/LTU-DT-0447-SE.pdf Palmquist, H., and Hanæus, J. (2005). Hazardous substances in separately collected grey- and blackwater from ordinary Swedish households. Science of the Total Environment. 348: 151– 163. Palmquist, H. and Jönsson, H. (2003). Urine, faeces, greywater, and biodegradable solid waste as potential fertilisers http://www.urbanwater.org/file/dyn/00000m/2700m/2709i/Helena%20Palmquist%20lybeck. df Parkhurst, D.L., and Appelo, C.A.J. (2007). PHREEQC (Version 2)-A Computer Program for Speciation, Batch-Reaction, One-Dimensional Transport, and Inverse Geochemical Calculations, v2.14.02. Retrieved from http://wwwbrr.cr.usgs.gov/projects/GWC_coupled/phreeqc/index.html (Dec. 2007). Peck, C.C., and Albro, P.W. (1982). Toxic potential of the plasticizer DEHP in the content of its disposition and metabolism in primates and man. Environmental Health Perspectives. 45: 11-17. Peter-Froehlich, A., Pawlowski, L., Bonhomme, A., and Oldenburg, M. (2004). EU demonstration project for separate discharge and treatment of urine, faeces and greywater - Part I: Results. Water Science and Technology 56, 239-249 Poli, D., Manini, P., Andreoli, R., Franchini, I., Mutti, A. (2005). Determination of dichloromethane, trichloroethylene and perchloroethylene in urine samples by headspace solid phase microextraction gas chromatography–mass spectrometry. Journal of Chromatography B. 820: 95–102.

Priority pollutant behaviour in household wastewater.
Date submitted: 2008-08-11 Date submitted:
File name: D5.2_Final_report[1].doc Page 91
Preuss, R., Koch, H., and Angerer, J. (2005). Biological monitoring of the five major metabolites of di-(2-ethylhexyl)phthalate (DEHP) in human urine using column-switching liquid chromatography–tandem mass spectrometry. Journal of Chromatography B, 816: 269–280. Pronk, W., Biebow, M., and Boller, M. (2006a). Electrodialysis for recovering salts from a urine solution containing micropollutants. Environmental Science and Technology. 40(7): 2414-2420 Pronk, W., Biebow, M., and Boller, M. (2006b). Treatment of source-separated urine by a combination of bipolar electrodialysis and a gas transfer membrane. Water Science and Technology. 53(3): 139 – 146. Pronk, W., Palmquist, H., Biebow, M., Boller, M. (2006c). Nanofiltration for the separation of pharmaceuticals from nutrients in source-separated urine. Water Research. 40(7): 1405 – 1412. Roempp. (1997). Römpp Lexikon Chemie. 10th Edition. Georg Thieme Verlag, Stuttgart, New York. Cited in Tettenborn, F., Behrendt, J., and Otterpohl, R. (2007). Resource recovery and removal of pharmaceutical residues – Treatment of separate collected urine. Final report for task 7 of the demonstration project ‘Sanitation Concepts for Separate Treatment of Urine, Faeces, and Greywater (SCST). Accessed via: http://www.kompetenz-wasser.de Ronteltap, M., Maurera, M., and Gujer, W. (2007). The behaviour of pharmaceuticals and heavy metals during struvite precipitation in urine. Water Research. 41: 1859 – 1868. Rose, J.B., Sun, G-S., Gerba, C.P. and Sinclair, N.A. (1991). Microbial quality and persistence of enteric pathogens in graywater from various household sources. Water Research. 25(1): 37 – 42. Santala, E., Uotila, J., Zaitsev, G., Alasiurua, R., Tikka, R., and Tengvall, J. (1998). Microbiological greywater treatment and recycling in an apartment building. Presented at AWT98 – Advanced Wastewater Treatment. Recycling and Reuse: Milano, 14 – 16 September 1998, pp 319 – 324. Schaefer, A.I., Nghiem, L.D. and Waite, T.D. (2003). Removal of natural hormone estrone from aqueous solutions using nanofiltration and reverse osmosis. Environmental Science and Technology. 37: 182 – 188. Schlummer, M., Moser, G.A., McLachlan, M.S. (1998). Digestive tract absorption of PCDD/Fs, PCBs, and HCB in humans: Mass balances and mechanistic considerations. Toxicology and Applied Pharmacology, 152(1): 128-137. Schouw, N.L., Danteravanich, S., Mosbaek, H., Tjell, J.C. (2002). Composition of human excreta - a case study from Southern Thailand. Science of the Total Environment, 286(1-3): 155-166. Sheikh, B. (1993). The city of Los Angeles grey water pilot project shows a safe use of gray water is possible. In: Water resources planning management and urban water resources. pp 678-681. New York, USA: ASCE. Shin, H-S., Lee, S-M., Sco, I-S., Kim, G-O., Lim, K-H., and Song, J.S. (1998). Pilot-scale SBR and MF operation for the removal of organic and nitrogen compounds from greywater. Water Science and Technology. 38(6): 79 – 88. Siegrist, H., Witt, M., and Boyle, W.C. (1976). Characteristics of rural household wastewater. Journal of the Environmental Engineering Division. 102(EE3): 553 – 548. Siegrist, H. (2003). Micropollutants – New challenge in wastewater disposal? EAWAG News, 57e: 7-10 Skender, L., Brčić, I., and Karalić, V. (2004). Urine analysis for the evaluation of environmental exposures to aromatic hydrocarbons. Archives of Environmental Health. 59(5): 237-244. Smith, M., Henze, M., & Ledin, A. (2001) Identifikation af gråvandsanlæg (Identification of greywater treatment plants) Danish EPA, Økologisk byfornyelse og spildevandsrensning, no. 9, 2001. http://www.mst.dk

Priority pollutant behaviour in household wastewater.
Date submitted: 2008-08-11 Date submitted:
File name: D5.2_Final_report[1].doc Page 92
Smith, C.J., Huang, W., Walcott, C.J., Turner, W., Grainger, J., Patterson, D.J.Jr. (2002). Quantification of monohydroxy-PAH metabolites in urine by solid-phase extraction with isotope dilution-GC–MS. Analytical and Bioanalytical Chemistry. 372:216–220. Snyder, S.A., Westerhoff, P., Yoon, Y., and Sedlak, D.L. (2003). Pharmaceuticals, personal care products and endocrine disruptors in water: Implications for water treatment. Environmental Engineering Science. 20: 449 – 469. Sørensen, J. (2007). Personal communication with the manager of the Nordhavnsgården treatment plant owned by FSBbolig. Šperlingová, I., Dabrowská, L., Stránský, V., Kučera, J., and Tichý M. (2007). Human urine certified reference material CZ 6010: creatinine and toluene metabolites (hippuric acid and o-cresol) and a benzene metabolite (phenol). Analytical and Bioanalytical Chemistry. 387: 2419–2424. Stubsgaard, A.E. (2001). Hygienic aspects of solid fractions of waste water. In: Decentralised sanitation and reuse: Concepts, systems and implementation. Eds: P. Lens, G. Zeeman, and G. Lettinga. Integrated Environmental Technology Series. IWA Publishing, London. pp 485 - 500. Stubsgaard, A.E. (2001). Danske Pileanlæg. Økologisk byfornyelse og spildevandsrensning Nr. 5: 2001. Accessed via: http://www2.mst.dk/Udgiv/publikationer/2001/87-7944-501-2/pdf/87-7944-502-0.pdf Surendran, S., and Wheatley, A.D. (1998). Greywater reclamation for non-potable reuse. Journal of CIWEM. 12 : 406 – 413. Sydney Olympic Park Authority (2006). Urban water reuse and integrated water management web pages. Available via www.sydneyolympicpark.com.au. Testfakta (2007) Vinteroveraller för barn (Winter overalls for children) Retrieved from http://www.testfakta.se/img/2007/11/9/21510.pdf (in Swedish) Tettenborn, F., Behrendt, J., and Otterpohl, R. (2007). Resource recovery and removal of pharmaceutical residues – Treatment of separate collected urine. Final report for task 7 of the demonstration project ‘Sanitation Concepts for Separate Treatment of Urine, Faeces, and Greywater (SCST). Accessed via: http://www.kompetenz-wasser.de/index.php?id=295&type=0&jumpurl=fileadmin%2Fuser_upload%2Fpdf%2Fforschung%2Fscst%2FSCST_Urine_Treatment_FinalReport_Task_7__TUHH__Tettenborn_5.9.2007_.pdf Thames Water. (2002). Water recycling and reuse: Achieving sustainability from alternative water sources. Accessed via: www.thames-water.com Thompson, T. S., and Treble, R. G. (1996). Pentachlorophenol Levels in Human Urine. Bulletin of Environmental Contamination and Toxicology. 56:520-526 Tidåker, P., Sjöberg C., and Jönsson H. (2007). Local recycling of plant nutrients from small-scale wastewater systems to farmland - A Swedish scenario study. Resources, Conservation and Recycling. 49: 388–405 To-Figueras, J., Barrot, C., Sala, M., Otero, R., Silva, M., Ozalla, M.D., Herrero, C., Corbella, J., Grimalt, J. and Sunyer, J. (2000). Excretion of hexachlorobenzene and metabolites in feces in a highly exposed human population. Environmental Health Perspectives, 108(7): 595-598. Toriba, A., Nakamura, H., Chetiyanukornkul, T., Kizu, R., Makino, T., Nakazawa, H., Yokoi, T., and Hayakawa, K. (2003). Method for determining monohydroxybenzo[a]pyrene isomers using column-switching high-performance liquid chromatography. Analytical Biochemistry. 312: 14–22. TOXNET (2007). United States National Library of Medicine. Toxicology data network. Accessible at: http://toxnet.nlm.nih.gov/

Priority pollutant behaviour in household wastewater.
Date submitted: 2008-08-11 Date submitted:
File name: D5.2_Final_report[1].doc Page 93
Udert, K.M. (2002). The fate of nitrogen and phosphorus in source-separated urine. Report for the Swiss Federal Institute of Technology, Zurich. Cited in Tettenborn, F., Behrendt, J., and Otterpohl, R. (2007). Resource recovery and removal of pharmaceutical residues – Treatment of separate collected urine. Final report for task 7 of the demonstration project ‘Sanitation Concepts for Separate Treatment of Urine, Faeces, and Greywater (SCST). Accessed via: http://www.kompetenz-wasser.de Udert, K.M., Larsen T.A., and Gujer, W. (2006). Fate of major compounds in source-separated urine. Water Science and Technology. 54(11–12): 413–420 U.S. Environmental Protection Agency (2007) EPI Suite v3.20 (February 2007). Retrieved from http://www.epa.gov/opptintr/exposure/pubs/episuite.htm (Apr. 2007). United States National Institute of Health ‘Household Products Database’ (US NIH HPD) http://householdproducts.nlm.nih.gov, last accessed: 9.12.07. Vahter, M., Berglund, M., Lind, B., Jorhem, L., Slorach, S., and Friberg, L. (1991). Personal monitoring of lead and cadmium exposure – a Swedish study with special reference to methodological aspects. Scandinavian Journal of Work and Environmental Health. 17: 65 – 74. Vahter, M; Berglund, M; Nermell, B and Akesson A (1996) Bioavailability of cadmium from shellfish and mixed diet in women. Toxicology and Applied Phramacology, 136, 2, 332-341. Vinnerås, B. (2002). Possibilities for sustainable nutrient recycling by faecal separation combined with urine diversion. PhD Thesis. Agraria 353, Swedish University of Agricultural Sciences. Accessed via: http://epsilon.slu.se Vinnerås, B., and Jönsson, H. (2002a). Faecal separation for nutrient management – evaluation of different separation techniques. Urban Water. 4: 321 – 329. Vinnerås, B., and Jönsson, H. (2002b). The performance and potential of faecal separation and urine diversion to recycle plant nutrients in household wastewater. Bioresource Technology. 84: 275–282. Vinnerås, B., Palmquist, H., Balmér, P., and Jönsson, H. (2004). The characteristics of household greywater and biodegradable solid waste – a proposal for new Swedish design values. Presented at the Leading-Edge Conference in Sustainability in Water-Limited Environments. 8-10 November 2004, Sydney, Australia. Vinnerås, B., Palmquist, H., Balmér, P., Jönsson, H. (2006). The characteristics of household wastewater and biodegradable solid waste – a proposal for new Swedish design values. Urban Water. 3(1): 3-11. Vural N. and Duydu Y. (1995). Biological monitoring of lead in workers exposed to tetraethyllead. The Science of the Total Environment. 171: 183-187. Wahl, H.G., Hong, Q., Stube, D., Maier, M.E., Haring, H-U., Liebich, H.M. (2001). Simultaneous analysis of the di(2-ethylhexyl)phthalate metabolites 2-ethylhexanoic acid, 2-ethyl-3-hydroxyhexanoic acid and 2-ethyl-3-oxohexanoic acid in urine by gas chromatography–mass spectrometry. Journal of Chromatography B, 758: 213–219. Weglin, J., and Vinnerås, B. (2000). Avloppsvatten och fast organiskt avfall i hyreshuset Ekoporten – sammansättning och flöde. Rapport 242, Institutionen för lantbruksteknik, Sveriges Lantbruksuniversitet. Uppsala. World Health Organization. (2006) Guidelines for drinking-water quality [electronic resource] : incorporating first addendum. Vol. 1, Recommendations. – 3rd ed. ISBN 92 4 154696 4. Retrieved from http://www.who.int/water_sanitation_health/dwq/gdwq0506.pdf (Jan. 2008) Wieland, P.O. (1994). Designing for human presence in space – an introduction to environmental control and life support systems. NASA RP-1324. Appendix E/F, 227-251. Accessed via: http://trs.nis.nasa.gov/archive/00000204/01/rp1324.pdf

Priority pollutant behaviour in household wastewater.
Date submitted: 2008-08-11 Date submitted:
File name: D5.2_Final_report[1].doc Page 94
Wilderer, P.A. (2001). Decentralised versus centralised wastewater management. In: Decentralised sanitation and reuse: Concepts, systems and implementation. Eds: P. Lens, G. Zeeman, and G. Lettinga. Integrated Environmental Technology Series. IWA Publishing, London. pp 39 – 54. Wilhelm, M., Ewers, U., Wittsiepe, J., Fürst, P., Hölzer, J., Eberwein, G., Angerer, J., Marczynski, B., Ranft, U. (2007). Human biomonitoring studies in North Rhine-Westphalia, Germany. International Journal of Hygiene and Environmental Health. 210: 307–318. Wilsenach, J., and van Loosdrecht, M. (2003). Impact of separate urine collection on wastewater treatment systems. Water Science and Technology. 48(1): 103–110. Wilsenach JA and van Loosdrecht MCM (2004). Effects of separate urine collection on advanced nutrient removal processes. Environmental Science and Technology. 38(4): 1208 – 1215. Wilsenach, J.A., van Bragt, W.P.M., de Been, P., van Loosdrecht, M.C.M. (2005). Evaluation of separate urine collection and treatment to augment existing wastewater treatment works. Water Science and Technology. 52(4): 71-80. Ying, G-G., Kookana, R., and Waite, T.D. (2004). Endocrine disrupting chemicals (EDCs) and pharmaceuticals and personal care products (PPCPs) in reclaimed water in Australia. Australian Water Conservation and Reuse Research Program Report. ISBN 0 643 09180 7. Accessed via: www.clw.csiro.au/awcrrp/stage1files/AWCRRP_1H_Final_27Apr2004.pdf

ScorePP priority pollutants in household wastewater.
Date submitted: 2008-08-11
File name: D5.2_Final_report[1].doc Page 95
Appendix A: Uses of priority pollutants (based on information collected in ScorePP Task 4.1).
Common name CAS No. Usage
Benzene and PAHs Benzene 71-43-2 Used in the maufacture of industrial chemicals such as polymers, detergents, pesticides pharmaceuticals, dyes, plastics, resins. Used as a fuel additive - increases the otane rating and reduces knocking Used as a solvent for waxes, resins, oils, natural rubber, etc. Used in lubricants and additives Used in pharmaceuticals Used in worm-repellants for horses and mules Has been used as a disinfectant. Naphthalene 91-20-3 Anthelmintic (Cestodes). Use as a non-agricultural pesticide, e.g. dog, squirrel, bat, bird, rabbit and moth repellant (67 products with >95% naphthalene content; total 89 products) Has been used in insecticidal dusting powders. Greenhouse fumigant for gladiolus thrips. Used internally as a vermicide. Has been used as antiseptic (topical and intestinal). Ingredient of some toilet bowl deodorants. Formerly used in wood preservation. Used in the manufacture of hydronaphthalenes (Tetralin, Decalin) which are used as solvents, in lubricants, and in motor fuels. Used in the production of colouring agents for ue in the dye industries. Used as an additive in some construction materials. Anthracene 120-12-7 Used in the manufacture of dyes. Fluoranthene 206-44-0 Used as a lining material to protect the interior of steel and ductile-iron potable water pipes and storage tanks. Used in the production of fluorescent dyes. Used as a stabilizer in epoxy resin adhesives. A parent compound for pharmaceutical drugs. Constituent of coal tar and petroleum derived asphalt. Formed as a result of incomplete combustion of organic materials (e.g. wood and fossil fuel). Benzo(a)pyrene 50-32-8 Benzo(a)pyrene is not produced or used commercially but is formed as a result of incomplete combustion of organic materials (e.g. wood and fossil fuel). Occurs in coal tar Benzo(g,h,i)perylene 191-24-2 No commercial use; but is formed as a result of incomplete combustion of organic materials (e.g. wood and fossil fuel). Indeno(1,2,3-cd)pyrene 193-39-5 No known commercial use; but is formed as a result of incomplete combustion of organic materials (e.g. wood and fossil fuel). Benzo(k)fluoranthene 207-08-9 No known commercial production or use; but is formed as a result of incomplete combustion of organic materials (e.g. wood and fossil fuel). Benzo(b)fluoranthene 205-99-2 No commercial use; but is formed as a result of incomplete combustion of organic materials (e.g. wood and fossil fuel). Chlorinated aliphatics Methylenechloride 75-09-2 Used as a solvent in paint removers; degreasing and cleaning fluids; and food processing (extraction solvent for spice oleoresins, hops, and for removal of caffeine from coffee). Aerosol propellant. Solvent - pharmaceutic aid. Formerly used as an active ingredient in pesticides and insecticides Chloroform 67-66-3 Used as a solvent for fats, oils, rubber, alkaloids, waxes, gutta-percha, resins. Used in fire extinguishers to lower the freezing temp of carbon tetrachloride (Former use? Carbon tetrachloride is no longer used)
Used as a cleansing agent.

ScorePP priority pollutants in household wastewater.
Date submitted: 2008-08-11
File name: D5.2_Final_report[1].doc Page 96
Appendix A cont’d.
Common name CAS No. Usage
Carbontetrachloride 56-23-5 Formerly used as an anthelmintic (Nematodes). Formerly used as dry cleaning agent, fire extinguisher and grain fumigant. Solvent for oils, fats, lacquers, varnishes, rubber waxes, resins. Solvent - pharmaceutic aid. Ethylene chloride 107-06-2 Solvent for fats, oils, waxes, gums, resins, and particularly for rubber. Has been used as an insecticide, herbicide and soil fumigant. Formerly used as an anti-knock gasoline additive. Used in the manufacturing of vinyl chloride, acetyl cellulose. C10-13 chloroalkanes 85535-84-8 Used as a flame retardant in rubber/paint Used as a plasticiser in rubber/paint Used in metal working fluid Used in fat liquoring agents in the leather industry Used in flame-resistant, water repellent and rot-preventing textile finishing. Used in sealing compounds for building, automotive and industrial applications Chlorinated alkenes Trichloroethylene 79-01-6 Used in degreasing and in dry cleaning. Used for solvent extraction in many industries (solvent for fats, waxes, resins, oils, rubber, paints, and varnishes). Used in the manufacture of organic chemicals and pharmaceuticals (e.g. chloroacetic acid). Tetrachloroethylene 127-18-4 Used as an anthelmintic (Nematodes, Trematodes). Minor use in grain fumigation Used for degreasing metals. Solvent - used in dry cleaning and textile processing. Insulating fluid and cooling gas in electrical transformers. Chlorobenzenes 1,2,4-Trichlorobenzene 120-82-1 Solvent used in chemical manufacturing of dyes & intermediates, dielectric fluid, synthetic transformer oils, lubricants, heat-transfer media, insecticides. Used in septic tank and drain cleaners Used as a dye carrier Used in abrasive formulations Used in degreasing agents Used in wood preservatives Formerly used as a soil treatment for termite control. Trichlorobenzenes 12002-48-1 Still used as an intermediate for manufacture of pesticides, process solvents, dye carriers and heat transfer media. Formerly used in termite preparations. Pentachlorobenzene 608-93-5 Chemical intermediate for pentachloronitrobenzene Hexachlorobenzene 118-74-1 Formerly as an agricultural fungicide and pesticide but this use has now largely ceased. Phenols Pentachlorophenol 87-86-5 Multiple biocidal uses. Used as an antimicrobial preservative/fungicide for wood, wood products, starches, textiles, paints, adhesives, leather, pulp, paper, industrial waste systems, building materials. Insecticide for termite control. Herbicide - general. Defoliant - pre-harvest.

ScorePP priority pollutants in household wastewater.
Date submitted: 2008-08-11
File name: D5.2_Final_report[1].doc Page 97
Appendix A cont’d.
Common name CAS No. Usage Phenols cont’d Pentachlorophenol 87-86-5 Used as a surface disinfectant. Octylphenols 1806-26-4 Similar usage to that of nonylphenols but generally less used Used in the manufacturing of nonionic surfactants, plasticisers, antioxidants, fuel oil stabiliser, intermediates for resins, fungicides, bactericides, dyestuffs, adhesives, rubber
chemicals. Octylphenol ethoxylates (OPEs) (produced from 4-tert-OP) are used in pesticide formulations and in water-based paints. Octylphenol ethoxylates (OPEs) are also used as textile and leather auxiliaries (e.g. hot melts, textile printing, leather finishing). Octylphenol ethoxylates (OPEs) are mainly used as emulsifiers for emulsion polymerisation by companies producing polymers (e.g. styrene-butadiene) para-tert-octylphenol 140-66-9 4-tert-octylphenol-formaldehyde novolac resins used in printing inks for most modern printing processes. The resins are reacted with other resins, oils etc (leaving no sig trace of
free alkyphenol), and are then diluted in ink solvents and pigmented. 4-tert-octylphenol-formaldehyde novolac resins used for electrical insulating varnishes for secondary insulation of electric windings (e.g. in motors and transformers). Fully cured
to form a thermosetting polymer, which is insoluble in water. A very high proportion (up to 98 %) of the OP resin manufactured is used in rubber compounding for tyre manufacture in the EU. A small amount of the ethoxylates produced using OPs are used to produce OP ether sulphates (OPE-S) that are mainly used as an emulsifier in water based paints. Also used as an emulsifier or dispersant in pesticide or herbicide formulations. Main usage as an intermediate in the production of phenol/formaldehyde resins (98% of use) and in the manufacture of octylphenol ethoxylates (2 % use) May be formed as a degradation product of alkylphenol surfactants in wastewater Nonylphenols 25154-52-3 Used as a nonionic surfactant, lubricating oil additive, fungicide, petroleum demulsifiers, and antioxidant for polymers Used in bactericides; dyes; drugs; adhesives Used in the prepn of lubricating oil additives, resins, plasticizers, and surface active agents Nonylphenol ethoxylates used in emulsion polymerisation, in leather processing, in metal finishing, in the textile industry, in water-based paints and emulsion coated papers and
as a cleaning agent Antioxidant in the manufacture of polystyrene Used in car wash detergent Used in PVC paste. As spermicide (nonoxynol-9) on condoms and contraceptive creams May also be released to the environment as a metabolic degradation product of nonylphenol polyethoxylate surfactants 4-para-nonylphenol 104-40-5 Used in the prepn of lubricating oil additives, resins, plasticizers, and surface active agents In stabilizers, petroleum demulsifiers, fungicides, antioxidants for rubbers and plastics Routinely used as a co-stabilizer with mixed-metal stabilizers for heat stabilization during plastic production A major source of p-nonylphenol in the environment is as a biodegradation product of nonylphenyl ethoxylates Hexachlorocyclohexanes Hexachlorocyclohexane 608-73-1 Multiple biocidal uses, but these uses have largely been phased out. Component of insecticides; toxic to flies, cockroaches, aphids, grasshoppers, wire worms, and boll weevils. Used in special shampoos, lotions, and powders for the treatment of hair lice Lindane 58-89-9 Still used in products such as shampoos and lotions to treat head and pubic lice (pediculides, scabicides). Ectoparasiticid - veterinary. Formerly used as an insecticide, pesticide DDT and metabolites para-para-DDT 50-29-3 Insecticide DDE 72-55-9 Degradation product of DDT. DDD 72-54-8 Insecticide.
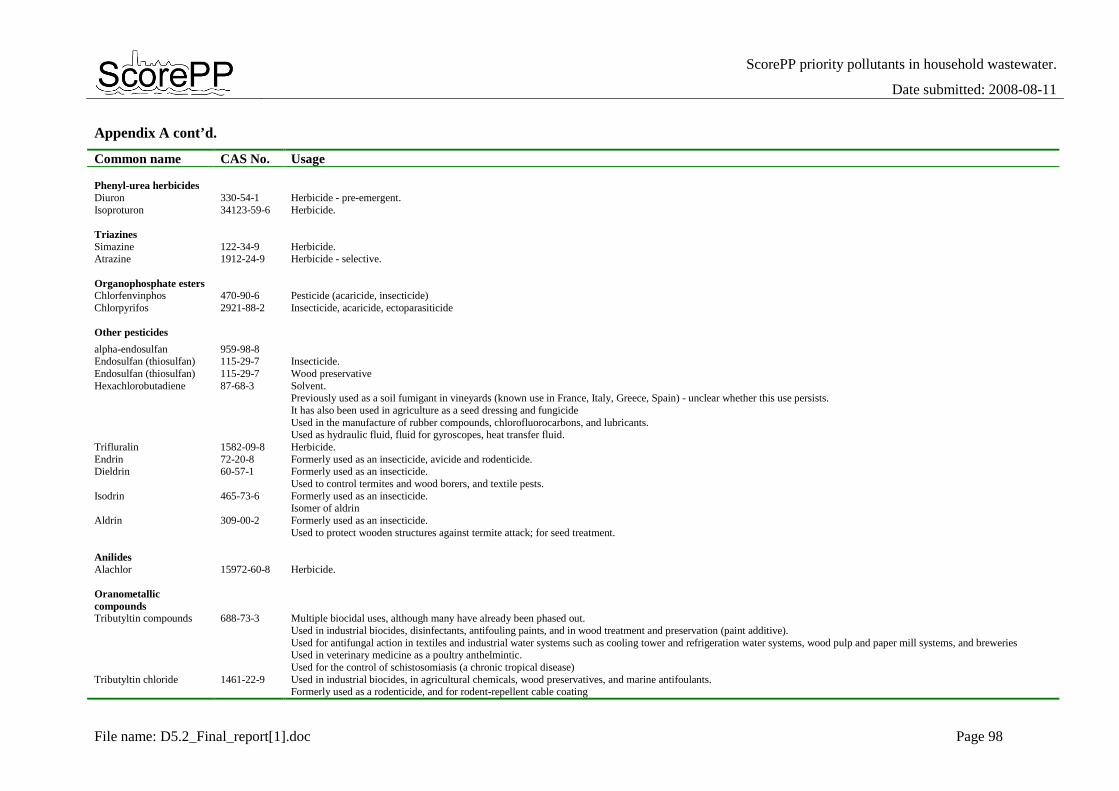
ScorePP priority pollutants in household wastewater.
Date submitted: 2008-08-11
File name: D5.2_Final_report[1].doc Page 98
Appendix A cont’d.
Common name CAS No. Usage Phenyl-urea herbicides Diuron 330-54-1 Herbicide - pre-emergent. Isoproturon 34123-59-6 Herbicide. Triazines Simazine 122-34-9 Herbicide. Atrazine 1912-24-9 Herbicide - selective. Organophosphate esters Chlorfenvinphos 470-90-6 Pesticide (acaricide, insecticide) Chlorpyrifos 2921-88-2 Insecticide, acaricide, ectoparasiticide Other pesticides
alpha-endosulfan 959-98-8 Endosulfan (thiosulfan) 115-29-7 Insecticide. Endosulfan (thiosulfan) 115-29-7 Wood preservative Hexachlorobutadiene 87-68-3 Solvent. Previously used as a soil fumigant in vineyards (known use in France, Italy, Greece, Spain) - unclear whether this use persists. It has also been used in agriculture as a seed dressing and fungicide Used in the manufacture of rubber compounds, chlorofluorocarbons, and lubricants. Used as hydraulic fluid, fluid for gyroscopes, heat transfer fluid. Trifluralin 1582-09-8 Herbicide. Endrin 72-20-8 Formerly used as an insecticide, avicide and rodenticide. Dieldrin 60-57-1 Formerly used as an insecticide. Used to control termites and wood borers, and textile pests. Isodrin 465-73-6 Formerly used as an insecticide. Isomer of aldrin Aldrin 309-00-2 Formerly used as an insecticide. Used to protect wooden structures against termite attack; for seed treatment. Anilides Alachlor 15972-60-8 Herbicide. Oranometallic compounds Tributyltin compounds 688-73-3 Multiple biocidal uses, although many have already been phased out. Used in industrial biocides, disinfectants, antifouling paints, and in wood treatment and preservation (paint additive). Used for antifungal action in textiles and industrial water systems such as cooling tower and refrigeration water systems, wood pulp and paper mill systems, and breweries Used in veterinary medicine as a poultry anthelmintic. Used for the control of schistosomiasis (a chronic tropical disease) Tributyltin chloride 1461-22-9 Used in industrial biocides, in agricultural chemicals, wood preservatives, and marine antifoulants. Formerly used as a rodenticide, and for rodent-repellent cable coating

ScorePP priority pollutants in household wastewater.
Date submitted: 2008-08-11
File name: D5.2_Final_report[1].doc Page 99
Appendix A cont’d.
Common name CAS No. Usage Oranometallic compounds Tributyltin methacrylate 2155-70-6 Used in antifouling paints for use on ship and boat hulls, quays, buoys, crabpots, fish nets, and cages. TBT compounds have also been registered as molluscicides, wood preservatives, masonry slimicides, and disinfectants. Also used as biocides for cooling systems and cooling towers, pulp and paper mills, breweries, leather processing, and textile mills.
Bis(tributyltin) oxide 56-35-9 Used in antimicrobials and slimicides for cooling-water treatment and as hard-surface disinfectants. Also used for laundry sanitisers and to prevent mildew formation in water-based emulsion paints.
Fungicide and bactericide in underwater and antifouling paints, pesticide Preservative for wood, textile, paper, leather, and glass. Used as a water repellent coating, antioxidant, curing agent, and corrosion inhibitor; and in flame resistant polyester. Used as a fungicide and pesticide in timber treatments. Also used in rodent repellants, and insecticides Used as a molluscicide Used in marine antifouling paints, latex and other paints, plastics, wood and stone preservatives Tetra-N-Butyltin 1461-25-2 Antifouling agent Stabilizing and rust-inhibiting agent for silicones; lubricant and fuel additive; polymerization catalyst; hydrochloric acid scavenger Tetramethyl lead 75-74-1 Antiknock additive for fuel. Ethyltrimethyllead 1762-26-1 Anti-knock agent used for aviation fuels. Diethyldimethyllead 1762-27-2 Anti-knock agent used for aviation fuels. Methyltriethyllead 1762-28-3 Anti-knock agent used for aviation fuels. Tetraethyl lead 78-00-2 Anti-knock agent used for aviation fuels. Formerly used as an antiknock agent in leaded fuel although it has now been largely replaced by methyl-tert-butyl ether. Fuel additive (lubricant). Methylmercury 22967-92-6 Methyl mercury has no industrial uses; it is formed in the environment from the methylation of the inorganic mercurial ion. Formerly used as a fungicide-treatment for grains and seeds. Used as timber preservative, and disinfectant. Dimethylmercury 593-74-8 Inorganic reagent Phenylmercuric acetate 62-38-4 Formerly used in paints to prevent mold. Used for diseases of turf on golf greens and tees; and most seed- and soil-borne diseases of cereals, sorghum, and groundnuts. Formerly used as a crop fungicide, slimicide and herbicide. Used as an in-can paint preservative and paint film mildewcide. Leather mildewcide. Used as a preservative for eyewashes. Used as a preservative and mildewcide for inks and adhesives. Used in contraceptive gels and foams and as a preservative in various drug preparations. Metals Cadmium and its compounds 7440-43-9
The major intentional uses of cadmium are Ni-Cd batteries, cadmium pigments, plastic stabilisers, cadmium coatings, cadmium alloys and cadmium electronic compounds such as cadmium telluride (CdTe).
Cadmium is used in black and white television phosphors and in blue and green phosphors for colour TV tubes. Used in electronics and optics, and in semi-conductors.
In alloys with copper, lead, bismuth, silver, nickel, tin, aluminium,and gold used for coating telephone cables, trolley wires, welding, electrodes, automatic sprinkler systems, steam boilers, fire alarms, high pressure/temperature bearings, starting switches, light duty circuit breakers, low temperature solder, and jewelery.
Used in some photographic emulsions and as a colorant in glass, pastics and ceramics.

ScorePP priority pollutants in household wastewater.
Date submitted: 2008-08-11
File name: D5.2_Final_report[1].doc Page 100
Appendix A cont’d.
Common name CAS No. Usage Metals Cadmium and its compounds 7440-43-9 Soft solder and solder for aluminum. Cadmium sulphide and cadmium sulphoselenide are used as bright yellow to deep red pigments in plastics, ceramics, glasses, enamels and artists colours Hardener for copper. Coating and electroplating steel and cast iron.
Ni-Cd batteries have extensive applications in consumer applications such as cordless power tools, cellular telephones, camcorders, portable computers, portable household appliances and toys.
Used in fire protection systems, machinery enamels, baking enamels; photography & lithography. Cadmium 2-ethylhexanoate 2420-98-6 Cadmium 2-ethylhexanoate used as a liquid heat and light stabilizer (retains transparency) in plastics manufacture
Cadmium acetate 543-90-8 Cadmium acetate used as a colorant for glass and textiles, glaze for ceramics where it produces iridescent effects, starting material for preparation of cadmium halides, and as an alternative to the cyanide bath for cadmium electrolysis.
Cadmium acetate used for producing iridescent effects on porcelains and pottery; and in cadmium electroplating Cadmium bromide 7789-42-6 Cadmium bromide used in photography; process engraving; lithography Cadmium carbonate 513-78-0 Cadmium carbonate formerly used as a lawn and turf fungicide Cadmium chloride 10108-64-2 Cadmium chloride formerly used as a lawn and turf fungicide
Cadmium chloride has been used in photography, photocopying, dyeing and calico printing, cadmium pigment manufacture, galvanoplasty, manufacture of special mirrors, ice-nucleating agent, and lubricants.
Cadmium mercury sulfide 1345-09-1 Cadmium mercury sulfide is used as a pigment Cadmium nitrate 10325-94-7 Cadmium nitrate used in photographic emulsions. Cadmium oxide 1306-19-0 Cadmium oxide is used in nitrile rubbers and plastics such as Teflon to improve their high-temperature properties and heat resistence Cadmium oxide is used in phosphors, semiconductors; glass; in storage battery electrodes; as nematocide; in cadmium electroplating; in ceramic glazes. High purity cadmium oxide is used as a second polarizer (in addition to silver oxide) in silver-zinc storage batteries. Cadmium stearate 2223-93-0 Cadmium stearate used as a commercial adherent Cadmium stearate used as a heat stabilizer in PVC plastics Cadmium stearate used as a lubricant and heat stabiliser in PVC plastics. Cadmium sulfate 10124-36-4 Cadmium sulfate used as a nematocide. Cadmium sulfate used as a fungicide ... For painting bark surface in infected areas of apple, pear trees. Cadmium sulfate used as an accelerator in cement formation Cadmium sulfide formerly used in shampoo for the treatment of seborrhea capitis.
Cadmium sulfide used as a pigment; colour for soaps; colouring glass yellow; colouring textiles, paper, rubber; in printing inks, ceramic glazes, fireworks; in phosphors and fluorescent screens.
Cadmium sulfide in lead sealing glass binders has been developed to provide a smooth glass enamel surface that would be very durable and resist damage from development, cleaning, and handling.
Other uses of cadmium sulfide take advantage of its semiconducting properties, including use in solar cells and smoke detectors.
The main use of cadmium sulfide is as a pigment, particularly in the glass and plastics industry. Cadmium sulfide colorants find use in plastics, paints, soaps, rubber, paper, glass, printing inks, ceramic glazes, textiles and fireworks.
Lead and its compounds 7439-92-1 Used in pigments for paints. In asphalt Used for brake linings. Used in lubricating oils. In tyres, and as tyre weights.

ScorePP priority pollutants in household wastewater.
Date submitted: 2008-08-11
File name: D5.2_Final_report[1].doc Page 101
Appendix A cont’d.
Common name CAS No. Usage Metals Lead and its compounds 7439-92-1 In storage batteries. In bearing materials (low friction interface between moving parts) Cable sheathing Crystal glass (lead crystal). For damp courses and roofing, and in building construction. In electronic devices. In solder, other lead alloys, for bearing metal, and in the metallurgy of steel and other metals. For lead shot Leaded glass in TV screens In pewter SLI batteries (car) For sound insulation For traction batteries (electric vehicles) For weights (curtain, dive) In ceramics, plastics, and electronic devices. In plastics. Coating of ceramics Mercury and its compounds 7439-97-6
Formerly used as an antimicrobial agent, and in pesticides but these uses are now restricted.
Used in dentistry (e.g. amalgams) and pharmaceuticals, also anti-fouling paints. In switches, fluorescent lamps. Component of batteries (e.g. zinc-carbon and mercury cells). In barometers, thermometers, hydrometers, pyrometers. In mercury arc lamps producing ultraviolet rays. Hg often available for purchase in religious supply stores known as botanicas. Recommended uses include wearing as amulets, sprinkling on floor, or adding to candle or lamp. Also sometimes taken internally to treat gastrointestinal disorders, or added to detergent or cosmetic products. Availability in these stores suggests that indoor mercury exposure may be a problem in some households. Nickel and its compounds 7440-02-0 May be found in consumer products such as jewellery, batteries, paint and ceramics, magnetic tapes, computer components, and goods containing stainless steel such as cooking
utensils and cutlery Nickel acetate is used as a mordant (chemical used to fix pigments into fabric during the dyeing process) in the textile industry. Nickel carbonate is used as a catalyst to remove organic contaminants from wastewater or potable water. Ni carbonate used in the preparation of coloured glass (gives green colour), and in the manufacture of nickel pigments, and for colour stabilisation of colour copy paper. Used for fabricated metal products (e.g. cutlery, handtools, hospital and kitchen equipment, ductwork, general hardware, and sheet metal boilers), machinery, household
appliances, building construction, electrical equipment, motor vehicle construction. Trinickel Orthophosphate, Ni3(PO4)2 • 7H2O, used in steel coatings and in pigment for oil and water based paints Finely divided nickel-based catalysts are used in the hydrogenation of vegetable oils and other organic substances, and in the production of fertilisers, pesticides and fungicides. Component of ceramics As an antistatic coating Component of storage batteries (e.g. Ni-Cd batteries) and fuel cell electrodes, used by automotive manufacturers in the EU for electric vehicles powered by nickel-metal hydride,
nickel-cadmium, or sodium metal-nickel batteries For 'electroforming' to produce items as diverse as moulds for pressing compact discs and security holograms, and screens for carpet printing. For 'electroless' nickel deposits - often used in pump and valve applications, and in computer hard disks

ScorePP priority pollutants in household wastewater.
Date submitted: 2008-08-11
File name: D5.2_Final_report[1].doc Page 102
Appendix A cont’d.
Common name CAS No. Usage Metals Nickel and its compounds 7440-02-0 For both ferrous and nonferrous alloys, copper and brass alloys, electrical resistance alloys, electroplated protective coatings For electrical contacts and electrodes. Used in electrical equipment mainly in the form of resistance alloys. For lightning-rod tips For magnets, as a component of permanent magnets For Nickel-plating (used for car bumpers and trim and other consumer products). In duplex stainless steels (which typically contain 5-7% nickel). In machinery parts. In Nickel-Iron alloys - used in clock pendulums, lead-frames in packaging electronic chips, and for shadow-masks in television tubes. In spark plugs In stainless steel for many hygienic applications, e.g. in food processing, beverage production and medicine, and for domestic kitchen equipment and utensils. Stainless steels are
also used for architectural applications. In stainless steel for use in potable water systems and wastewater treatment plants. Used for stainless steel aeration piping, transfer piping for digester gas and sludge, sliding
gates, valves, tanks, screens, hand rails, and other equipment. In the construction of desalination plants (Cu-Ni alloys) In surgical and dental prostheses In the manufacturing of nickel steel armour plate and burglar proof vaults Nickel and its alloys are employed in electronic devices and for electromagnetic shielding of computers and communication equipment. Nickel oxide is used in fuel cell electrodes, and for colouring and decolourising glass. Nickel Oxide is used for alloy and stainless steel production, and specialty ceramics Nickel salts are used in electroplating, including the electroplating of plastics (e.g. for automobile trim, bathroom fittings and electronic connectors) Nickel silvers and nickel alloys with zinc and copper are used for coatings on tableware and as electrical contacts Nickel-chromium alloys (e.g. Nichrome) are used for heating elements Nickel-copper alloys are also used to manufacture food-processing equipment. For coins, electrotypes, and storage batteries. For the manufacturing of Monel metal, stainless steels, heat resistant steels, heat and corrosion resistant alloys, nickel-chrome resistance wire, and cast irons. For the manufacturing of tubing made from copper nickel alloy In equiatomic nickel-titanium shape memory alloys for applications such as spectacle frames. In superelastic alloys for applications such as medical devices and mobile telephone aerials. Magnets, lightning-rod tips, electrical contacts and electrodes, spark plugs, machinery parts. Nickel-plating. Other DEHP 117-81-7 Plasticizer in PVC applications and flexible vinyls. Pentabromobiphenylether 32534-81-9 Additive flame retardant