Embed Size (px)
Citation preview

1
PUB Water R&D Approach8 September 2015
Jeslyn ThongAssistant Director
Technology Department

2
Programme on 8 Sept 2015
930am-1015am Overview of PUB and EWI · PUB’s approach to R&D· Highlights of key R&D projects· Overview of EWI’s strategies and funding Schemes
10.15am – 11.40am Sharing by DTU
12noon – 1.15 pm Lunch
1.30pm to 2.30pm Visit to Integrated Validation Plant @ Ulu Pandan Water Reclamation PlantHosted by Mr Wah Yuen Long
2.30pm – 3.00pm Travel to NEWater Visitor Centre
3.00pm – 4.00pm Guided Tour of NEWater Visitor Centre

3
Outline of Briefing
Our Approach in R&D
Overview of R&D Progress
Background and Role of EWI
Highlight of Projects in Key Areas
Our Partners
Our R&D Technology Roadmaps

4
Outline of Briefing
Our Approach in R&D
Overview of R&D Progress
Background and Role of EWI
Highlight of Projects in Key Areas
Our Partners
Our R&D Technology Roadmaps

5
Singapore’s Water Challenges
Singapore
� Lack of Storage
�Competing Land Use
• Land Area: ~ 700 km2
• Population: 5 million people
• Water Demand: 400 MGD
• Rainfall: 2.4 m
• Catchment areas: 66%

6
Rising Energy Prices
Stringent Regulations& Public Expectations
Prices set to increase in the long run
Population Growth
Rise of Megacities
Climate Change
No Pristine Water Sources
Challenges Ahead

7
Non-
domestic
55%
Supply
Desalinated water
10%
NEWater 30%
Imported
water
Local catchment
Domestic
45%
Demand
2010
Non-
domestic
70%
Domestic
30%
Desalinated water
25%
NEWater 55%
Imported
water
Local catchment
SupplyDemand
2060
Water demand in 2060 = 2 x Water demand in 2011*
Energy
• Triple from 1050 to 3200 GWh/year
• Footprint increase from 1.7 to 2.5 kWh/m3
Sludge
• Double to more than 600,000 tonnes /year
Water Quality
• Maintaining good water quality and security increasingly challenging
Land Use
• Siting of infrastructure increasingly challenging
Singapore’s Water Challenges

8
Waste
Minimisation
Key
Drivers
Strategic Thrusts of R&D:
1. Increase water resources
2. Protect water quality and
security
3. Reduce production cost
Driver:
“Adequate Water Supply”:
•Rainfall: 2.4 m
•Land area: 700 km2
•Large domestic and industrial demand
Driver:
“Good Water Quality”:
•Water resources coming from
unconventional sources
Drivers for PUB’s R&D
PUB’s strategy for long term sustainability of our water supply is to continue
leveraging on technological innovation to overcome the water challenges.

9
searainstormwater
management
collection
of rainfall
in drains &
reservoirs
treatment of
raw to potable
water
reclamation
of
used water
collection
of used water
in sewers
supply of
water to the
population &
industries
treatment
of
used water
desalinationdesalination
collection
of rainfall
in drains &
reservoirs
1. Increase Water Resources
reclamation
of
used water
2. Water Recycling 3. Improve efficiency
4. Improve Water Quality 5. Improve Water Security
PUB’s R&D Strategies

10
Upstream fundamental research(Usually carried out in laboratory scale in tertiary and research institutes)
Challenges
Break-throughs
Pilot studies
Demo plant studies
Our Approach to Water R&D

11
1. Source for new ideas
2. Benchmark against existing
system
3. Improve technology
through basic and applied research
4. Demonstrate and implement
improvised technology
4-step Approach:
Assessment of New Technology/ Idea
Starting with the end in mind…..

12
Outline of Briefing
Our Approach in R&D
Overview of R&D Progress
Background and Role of EWI
Highlight of Projects in Key Areas
Our Partners
Our R&D Technology Roadmaps

13
Water as Strategic Growth Area
Environment and Water Industry Programme Office (EWI)

14
Growing the Water IndustryWhole of Government Approach
Whole of Government 3 Strategic Thrusts
Funding: S$330M in 2006S$140M in 2011
2015 Targets: 1. Triple VA contribution to S$1.7B2. Double employment to 11,000

15
Growing the Water IndustryBuilding the Strong Foundation
Pipeline of trained manpower to support industry growth• Over 330 Masters / PhD trained• Over 360 researchers / engineers / grad students• 47 PhDs sponsored to date
Impressive progress in a relative short period (7 years) in growing the Singapore water industry.- Clean Water Mid-Term Review Panel and International Advisory Panel (2013)

16
Investing in Technology
Supporting Technology Development

17
Outline of Briefing
Our Approach in R&D
Overview of R&D Progress
Background and Role of EWI
Highlight of Projects in Key Areas
Our Partners
Our R&D Technology Roadmaps

18
On PUB front,• PUB started its R&D programme in collaboration with
local and international organisations since 2002
• No. of Projects to-date: 405
• Total Project Value: S$245 mil (38% PUB, 30% NRF, 32% external)
• Increase of annual R&D Budget from S$5mil to S$20mil in 2010
On EWI front,• Develop and implement EWI’s Environment and Water Research Program (EWRP)
• Launched a total of 18 requests-for-proposals (RFPs) under IRIS scheme since 2006
• Total funding of S$181.5mil for 106 projects awarded to-date, 9 proposals are in the process of awarding
Status of R&D

19
Outline of Briefing
Our Approach in R&D
Overview of R&D Progress
Background and Role of EWI
Highlight of Projects in Key Areas
Our Partners
Our R&D Technology Roadmaps

20
R&D Technology Roadmaps
Copyright © 2013 PUB All Rights Reserved
Biological Processes•Anaerobic MBR•Granular sludge processes•Low energy nutrient/organic removal•Anaerobic sludge digestion
Chemical Redox Technologies •Advanced oxidation technologies•Disinfection technologies
Desalination and Water Reuse•Ceramic Membranes•Electrochemical desalting•Biomimetics / Biomimicry•Membrane fouling control•Process improvements•Membrane improvements
Sludge and Brine Management (EWW Nexus)•Osmotic power PRO/RED•Sludge-to-energy conversion•Resource recovery from residues•Sludge management
Water Quality Analysis•Rapid detection of emerging pollutants•Fish biosensors•Rapid microbial detection•Sensors for membrane systems•“Living lab” on the reservoir
Technically Feasible and Economically Viable Water Solutions
New Ideas and Innovations
Water Distribution•Smart grid development (data mining and data analytics) •Network Modelling / Cloud computing
Watershed Management•Intelligent watershed management (data mining and analytics)•Climate change modelling•Phytoremediative treatment of water
Groundwater / Underground Caverns•Geophysical/geotechnical surveys•Water quality management / treatment•Sustainable water extraction/use•Energy recovery
Decentralised Water Treatment Technologies•Small-scale point of use technologies•Greywater Recycling•Sewer Mining technologies•Stormwater technologies
Industrial Water Technologies•Industrial wastewater treatment•Membrane distillation•Seawater cooling•Adsorption chillers •Novel heat exchangers•Reduction in evaporative loss
Planning and Infrastructure
Needs
Manpower Challenge
Sustainability & Land Use
Automation / Robotics•Self-correction /self-control of plant•Intelligent CCTV system for remote plant supervision•Process-design automation•Robotics for inspection / surveillance
Improve and Protect
Water QualityReduce
Energy Consumption
IncreaseWater Resources
MinimiseWaste Generation
Lower Chemical Usage
Decrease Water Production
Costs

21
searainstormwater
management
collection
of rainfall
in drains &
reservoirs
treatment of
raw to potable
water
reclamation
of
used water
collection
of used water
in sewerssupply of
water to the
population &
industries
treatment
of
used water
desalination
Variable Salinity Process
Low Energy MBR
Water Quality Modelling and
Prediction
Integrated Anaerobic &
Aerobic Treatment
Real-Time Water Quality Monitoring
and AnalysisRegenerative
Photocatalysts
BiomimeticMembranes
MicrobialFuel Cells
Electrochemical Desalting
Source Control
Reducing Evaporation
Biomimicry
Membrane Distillation Membrane
Integrity Sensors
Rainfall Prediction
Robust Sensors
Microbial Source
Tracking
Contaminants of Emerging Concerns
R&D in the Water Loop

22
Outline of Briefing
Our Approach in R&D
Overview of R&D Progress
Background and Role of EWI
Highlight of Projects in Key Areas
Our Partners
Our R&D Technology Roadmaps

23
1) Desalination – Breakthrough in Energy Reduction
Current
3.5kWh/m3
Short-term
<1.5kWh/m3
Long-term
<1kWh/m3
SWRO
� Variable Salinity Process : 1.7 kWh/m3
� Memstill (with waste heat): 1.0 kWh/m3
� Electrochemical Desalting: 1.5 kWh/m3
Breakthrough R&D
� Biomimetic
� Biomimicry
Aquaporins
Mangrove

Electrochemical Desalting – Disruptive Paradigm Shift
Seawater contains only 3.5 wt% of salts (mainly Na+ and Cl-) with the rest being water.
Disruptive Paradigm Shift:
Why drive 1 T of water through RO membrane instead of moving 35 kg of salts?
Using electric field to move ions out of seawater at 1.5kWh/m3

25
Osmotic Power – Current Technologies
Desalination Plant
co-location
NEWater Factory
Pressure Retarded Osmosis (PRO): • Osmosis through a semi-permeable membrane dependent on the osmotic
pressure difference of 2 streams, generating a water flux to generate power via a hydropower turbine.
Brine
Brine
Energy-Waste-Water Nexus:
� Co-location of facilities to exploit salinity
gradient power from SWRO and NEWater
brines

26
Final Sedimentation Tank
Used Water Treatment NEWater Treatment
Aeration Basin
Primary Sedimentation
Tank
Microfiltration /Ultrafiltration
Reverse Osmosis
Ultraviolet Disinfection
Used Water NEWater
Membrane Bioreactors
Piloting tested three MBRs
(300 m3/d) in 2004
Reverse Osmosis
Ultraviolet Disinfection
Primary Sedimentation
Tank
Membrane Bioreactor
Advantages of MBR:
�Smaller Footprint
�Improved NEWater Quality
Challenge:
�High Energy Requirements
2) Reduced Energy and Footprint for NEWater Production
Energy reduced
from >1.0 kWh/m3
to <0.4 kWh/m3
through R&D.

27
Pilot Plant Study
Demo Plant (Optimization) Study
� 6 MBR Pilot Studies� >20 MBR Testbedding Studies
Membrane BioreactorsNew Used Water Treatment Paradigm
Global benchmark !

28
3) Energy-efficient WRPs with higher recovery
UASB-MBR Demo Integrated Validation Plant
• 1 MGD UASB-Ceramic MBR demo plant at
JWRP ($10.3 mil)
• 1000 m3/d Integrated Validation Plant at
UPWRP ($4.8 mil)
• Pilot and validate research findings
• Incorporate technologies for Tuas WRP (2022)
UASB tanks
Aeration tanks
Ceramic
membranes
Expected Outcomes of IVP (24 mths)
• 150% more energy recovery
• 40% reduction of net system energy
consumption
• 30% reduction in plant footprint
• 10% reduction in quantity of waste
dewatered sludge

29
Camera
Fish Tank
4) Enhancing Water Security
Fish Activity Monitoring System (FAMS)
Ensuring good water quality• Round-the-clock surveillance of drinking water quality• 42 units installed, another 27 units to be deployed in 2015
Improving manpower productivity• Automated water quality monitoring• Remote monitoring

30
4) Enhancing Water Security
On-line Detection of Cryptosporidium within 1 hour
• EWI Challenge Call in 2008• At least 6 times better than state-of-the-art that requires more than 6 hours• Spin-offs
Next Steps• Prototype development• Validation testing• Extend to testing of viruses and bacteria
Pre-concentration and detection chips

31
Service Reservoir
WSCC
Distribution System
� Online Event Detection (CANARY)
� Source Identification (PONI)
� Sensor Placement (SPOT)� Next
Generation Microbial Sensors
Imported Water
Mobile Water Quality Stations
Water Sampling
BaselineData
� Fish Biosensors� FAMS� Transgenic Fish
� Piezoelectric� N DLC: Pt� MZI sensors
� Wireless Data Transmission
Online Sensors(pumping mains)
Online Sensors(critical locations)
5) Real-Time Water Quality Monitoring

32
… and consumes more than
half Singapore’s water supply
Manufacturing accounts for
20-25% of Singapore’s economy…
21%Electronics
• 45% share of world’s hard disk
media
• 11% of world’s foundry wafer
output
• 16 wafer fabrication plants
Marine & Offshore
•70% of world’s jack-up oil rigs
Chemicals & Process
• >S$37 bil assets in petchem
cluster
•Refining capacity of 1.3 mbpd
Opportunity to apply national strategic
imperative to
COLLECT, RECOLLECT & REUSEevery drop of industrial water,
to achieve zero liquid discharge and water reuse
EXAMPLES OF WATER INTENSIVE INDUSTRIES
Non-
domestic
55%
Non-
domestic
70%
2012 2060
Total water demand (mgd) 400 800
Non-domestic demand (mgd)
200 560
New Focus Areas – Industrial Water Solutions

33
Outline of Briefing
Our Approach in R&D
Overview of R&D Progress
Background and Role of EWI
Highlight of Projects in Key Areas
Our Partners
Our R&D Technology Roadmaps

More than 100 test-bedding projects at PUB facilities - Bringing technology
closer to the market.
Graham Tek 16-inch RO pilot plant
FO-MBR
Partner: GE WaterPartners: Evoqua
Partner: KIWA Partner: Mann+Hummel Ultraflo
Solar desalination
Partner: Tritech
MBBR-UF
EDIAnMBR
Working closely with Industry to Test New Technologies/Ideas
35
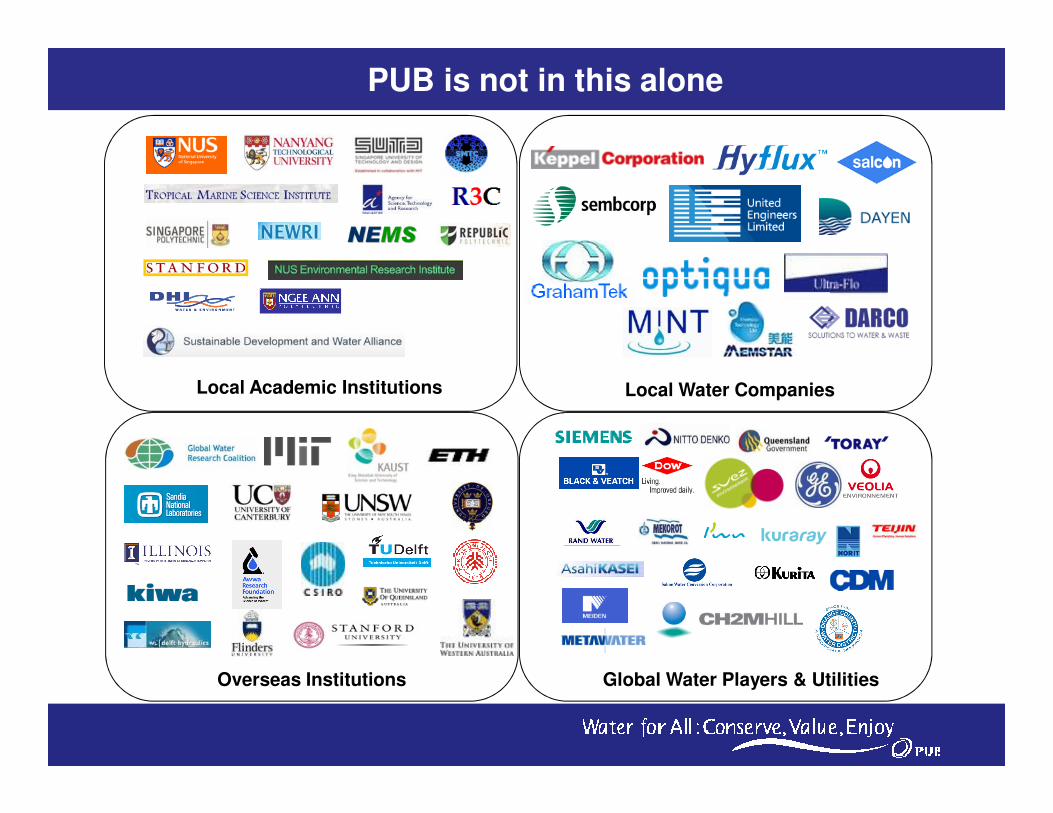
PUB is not in this alone
Local Water Companies
Global Water Players & UtilitiesOverseas Institutions
Local Academic Institutions

36
TTTTHANKHANKHANKHANK YYYYOUOUOUOU