Embed Size (px)
Citation preview

Environmental Fracturing in Clay Till Deposits
Camilla Christiansen & Judith Sarah Alexandra Wood
Master Thesis
Institute of Environment & Resources Technical University of Denmark
January 2006


i
ABSTRACT
Clay till more than 1 m thick covers more than 40% of Denmark (Klint and Gravesen, 1999), and large parts of North America and Europe (Parker et al., 1994). These low permeability deposits are often sites of contamination. In a late-time context, remediation of contaminants at such sites is exacerbated by slow reverse-diffusion from the matrix to fractures (Reynolds and Kueper, 2002; Jørgensen et al., 2005). In the case of chlorinated solvents, this reverse diffusion may constitute a long-term source of contamination at concentrations above Danish drinking water guidelines (AVJ, 2001). Pneumatic fracturing coupled with mass reduction technologies is a promising developing technology (Roote, 2000). In particular, claims that pneumatic fracturing produces a dense fracture network, thereby shortening diffusion pathways make it attractive.
Since pneumatic fracturing has not been undertaken in Denmark prior to this joint investigation, a litera-ture search of Canadian, US, European, and Danish experiences with fracturing was conducted to determine what type of results may be anticipated and which parameters are most influential on the charac-teristics of induced fractures. The environmental fracturing literature has been found to be extensive, but lacks detailed documentation of induced fracture characteristics, in particular, field evidence of an induced dense fracture network.
A modelling study investigated matrix and contaminant parameters influencing diffusion and thus, reme-diation times and whether pneumatic fracturing can address diffusion-limited remediation. Based on this modelling study, which assumes diffusion-limitation and operates with a strict definition of remediation of chlorinated ethenes (10 μg/L throughout the matrix), fracture spacing is the most decisive parameter on remediation times: a fracture spacing of 10 cm is required to attain a reasonable remediation time (10 yrs) in the worst case contamination scenario.
Finally, a field study was conducted at the Vasby pneumatic fracturing site. The geologic characteristics of the field site were investigated, and found to be typical of Danish basal clay till sites. Thus, fracturing results appear transferable to other Danish sites given similar operator-determined conditions. Tracer-coloured induced fractures in a 10 x 10 x 5 m excavation were compared to those observed in cores and auger cuttings and to geological features to investigate induced fracture propagation. Propagation of in-duced fractures has been found to be strongly influenced by the hydraulically active natural fracture network, where fracture spacing is variable, but on the order of 1 m. Localized areas with a dense induced fracture network are believed to be associated with more permeable zones of the overburden. Below 6 m, where the natural vertical fracture spacing is wide, venting of injected gas through the (more) massive overburden may give rise to localised zones of fingering along the induced fractures, but otherwise, pre-dominately horizontal fractures are anticipated.
The application of the technology at the Vasby site differed from literature reports. Extensive surface vent-ing may have influenced the radius and density of the induced fracture network.
Despite lack of agreement between the fracture spacing believed necessary and that which is believed achievable via modelling and field investigation respectively, pneumatic fracturing coupled with injection of remedial reactants appears both promising and feasible based on observations of tracer diffusion zones extending from induced fractures. However, the technology must be further developed to improve control over fracture propagation and spacing to become viable in a remedial context.

ii
ABSTRACT
Morænelersaflejringer, der overstiger 1 m i tykkelse, dækker mere end 40% af Danmark (Klint og Grave-sen, 1999), store dele af Nord Amerika og Europa (Parker et al., 1994). Disse lav-permeable aflejringer er ofte forurenede, og deres oprensning besværliggøres på sene tidsstadier af de forurenende stoffers lang-somme diffusion ud af den lav-permeable matrix til naturligt forekommende eller inducerede sprækker (Reynolds og Kueper, 2002; Jørgensen et al., 2005). Når der er tale om chlorerede opløsningsmidler, kan denne diffusion komme til at udgøre en langsigtet forureningskilde, hvis afledte stofkoncentrationer over-stiger de danske drikkevandskriterier (AVJ, 2001). Koblingen af pneumatisk frakturering til en masse-omsætningsmetode er en lovende teknologi under udvikling (Roote, 2000). Især påstande om at pneuma-tisk frakturering kan danne et tæt sprække-netværk, og dermed forkorte diffusionsveje, gør metoden attrak-tiv.
Da pneumatisk frakturering ikke forud for dette samarbejdsprojekt har været forsøgt i Danmark, er et litte-raturstudie over canadiske, amerikanske, europæiske og danske erfaringer med frakturering blevet gen-nemført for at udlede hvilken type resultater, der ville kunne forventes, samt hvilke parametre, der kan forventes at udøve mest indflydelse på udformningen af inducerede sprækker. Litteraturen om miljø-frakturering er omfattende, men savner detaljeret dokumentation af inducerede sprækkers karakteristika, især felt data, der understøtter påstanden om dannelse af tætte sprække netværk.
Gennem et modelleringsstudie er det blevet undersøgt hvilke matrix- og stof-parametre, der er bestem-mende for diffusionsraten og dermed oprensningstid, og efterfølgende om pneumatisk frakturering kan nedbringe diffusionsstyret oprensningstid. På baggrund af modelleringsstudiet, der antager diffusionssty-rede oprensningsforhold og arbejder med en streng definition af oprensning for chlorerede ethener (max. 10 μg/L i matrix), er sprække afstand den afgørende størrelse i bestemmelsen af oprensningstid: en spræk-ke afstand på 10 cm er nødvendig for at opnå rimelige oprensningstider (10 år) af et worst-case forure-ningsscenarium.
Til slut blev foretaget et felt studie på fraktureringslokaliteten i Vasby. Lokalitetens geologiske forhold blev undersøgt med henblik på vurdering af muligheden for overførsel af opnåede resultater til andre dan-ske lokaliteter. Felt lokaliteten vurderes som en typisk dansk bundmorænelerslokalitet. Således forventes resultater opnået ved den pneumatiske frakturering at være typiske for hvad der vil kunne forventes opnået på andre danske lokaliteter ved brug af lignende operatørbestemte forhold. Inducerede sprækker farvet af injicerede sporstoffer set i en 10 x 10 x 5 m udgravning af fraktureringsfeltets vest-side blev sammenholdt med lokalitetens geologi, samt kerner og jordprøver udtaget ved snegleboring på lokaliteten, for at under-søge de inducerede sprækkers udbredelse. Udbredelsen af inducerede sprækker er stærkt påvirket af det hydraulisk aktive netværk af naturlige sprækker, hvis afstande varierer, men er af størrelsesordenen 1 m. Lokaliserede områder med tætte sprække netværk menes at være knyttet til mere permeable zoner af un-dergrunden. Dybere end 6 m u.t., hvor forekomsten af naturlige vertikale sprækker er svindende, kan den injicerede gas’ søgning mod overfladen gennem den (mere) massive undergrund muligvis give anledning til ’fingerering’ ud fra de inducerede sprækker, hvis overordnede orientering ellers forventes horisontal.
Anvendelsen af pneumatisk frakturering på Vasby lokaliteten afveg fra typiske forhold beskrevet i littera-turen. Omfattende overfladebrydning af unjiceret gas/tracer kan have haft indflydelse på den opnåede in-fluensradius og tætheden af det inducerede netværk.
Til trods for uoverensstemmelsen mellem nødvendig og opnåelig sprække afstand i oprensningsøjemed, synes pneumatisk frakturering koblet til injektion af reaktanter farbar baseret på observationer af sporstof-diffusion ud fra inducerede sprækker. Teknologien må dog videreudvikles for at forbedre kontrollen over sprække udbredelse og afstand, før den fremstår som en brugbar oprensingsteknologi.


iii
FOREWORD This report marks the completion of a 30 ECTS point Master Thesis project undertaken to obtain the degree Master of Science in Environmental Engineering at the Technical University of Denmark (DTU). The project has been conducted under the supervision of Professor Poul L. Bjerg from August 2005 to January 2006 at the university’s Institute of Environment & Resources (E&R), DTU. The fieldwork conducted for this Master Thesis was related to a pilot study of pneumatic fracturing conducted by the consultancy firm NIRAS with E&R, DTU for Copenhagen County (Københavns Amt). K.E.S. Klint, GEUS, provided a short course in geologic characterisation of the field site and subsequent data analysis. The authors would like to thank Mette Broholm, Peter Bauer-Gottwein and Stine Brok Christensen for assistance and guidance during the the course of the project. Furthermore, thanks go to Knud Erik Klint, whose field consultancy services were indispensable, as well as Anders G. Christensen and Charlotte Riis, NIRAS, who were helpful with field activities and data. We also wish to thank Carsten Bagge Jensen, Københavns Amt, who allowed us to be involved in the field activity and who helped us with our application for use of Brilliant Blue as a tracer at the Vasby site, as well as our search for an excavation contractor. Last, but not least huge thanks go to our supervisor Poul L. Bjerg who has provided focused, encour-aging and positive guidance throughout the thesis-writing process. The goal of the project has been to evaluate the potential of the commercial but incompletely devel-oped environmental fracturing technology to enhance otherwise limited remediation possibilities of contaminated, low-permeability sites. Fulfilling this task proved to be a far-reaching and exciting challenge, requiring literary research into many different subjects. To maintain focus in the report, a lot of information of peripheral importance to the statement of central conclusions has been placed in appendices. Those relevant for each individual report chapter are stated therein. Data in electronic form (US, Canadian and Danish experiences with environmental fracturing, modelling results, and fluorometer testing results) are in CD format in Appendix Y. Lyngby, January 26th 2006 __________________________________ __________________________________ Camilla Christiansen Judith Sarah Alexandra Wood


iv
TABLE OF CONTENTS
Chapter 1: Introduction
1
1.1 Objectives
3
1.2 Outline
3
Chapter 2: Description of pneumatic fracturing technology
5
2.1 The evolution of fracturing
5
2.2 Pneumatic fracturing technology
6
2.2.1 Procedure 6 2.2.2 Stress and orientation of induced fractures 7 2.2.3 Saturation conditions 8 2.2.4 Operator-determined parameters 8 2.2.5 Leak-off 9 2.2.6 Surface venting and intersection with subsurface structures
9
2.3 Creating multiple fractures in vertical boreholes
10
2.3.1 Number of fracture intervals and spacing 10 2.3.2 Geology and aspects to consider when creating multiple fractures 10 2.3.3 Top-down method 10 2.3.4 Bottom-up method
11
2.4 Monitoring during the fracturing process
11
2.4.1 Pressure-time curves 11 2.4.2 Flow measurements 12 2.4.3 Measurement of pressure effects 12 2.4.4 Uplift
12
2.5 Post-fracture testing
13
2.6 Evaluation of the induced fracture effects
13
2.7 Characteristics of pneumatically induced fractures
15
2.8 Potential risks associated with environmental fracturing
18
2.9 Suitability screening of sites for environmental fracturing
19
2.9.1 Characteristics of unsuitable sites
19
2.10 Conclusions
21
Chapter 3: Low-permeability deposits in Denmark
23
3.1 Definition of low-permeability deposits
23
3.2 Typical clay till deposits
24
3.2.1 Clay fraction 26 3.2.2 Bulk hydraulic conductivity 26 3.2.3 Presence of sand lenses and stringers 27 3.2.4 Presence of bio-pores 27 3.2.5 Natural fractures – occurrence and types
27
3.3 Conclusions 34

v Table of contents
Chapter 4: Modelling solute transport in fractured low-permeability deposits
37
4.1 General considerations
37
4.1.1 Simplification of fracture network 37 4.1.2 Transport processes and parameters to consider
38
4.2 Discussion of modelling investigations from the literature
40
4.3 Modelling of contaminant transport in clay till
43
4.3.1 Conceptual model 44 4.3.2 Modelling with MATLAB
48
4.4 Conclusions
59
Chapter 5: Field investigation of a naturally-fractured clay-till
61
5.1 Description of the Vasby field site
61
5.1.1 Geology of the field site
61
5.2 The excavation
64
5.2.1 Location and procedure 64 5.2.2 Collection of data from the excavation
64
5.3 Lithological description
64
5.4 Fracture characterisation and fabric analysis
67
5.4.1 Fabric analysis 70 5.4.2 Classification of natural fractures 70 5.4.3 Geological history of the site as related by till and fracture observations 73 5.4.4 Depth and spacing of natural fractures
73
5.5 Is the site typical?
76
5.5.1 Vertical fracture spacing 76 5.5.2 Redox boundary
77
5.6 Conclusions
77
Chapter 6: Field investigation of pneumatically induced fractures
79
6.1 Goals of the field investigation
79
6.2 Methods
80
6.2.1 Selection of dye tracer 80 6.2.2 Visual inspection of geoprobe cores and comparisons with auger cuttings
80
6.3 Observations from the pneumatic fracturing process
81
6.3.1 General description of the pneumatic fracturing procedure at Vasby 82 6.3.2 Field and monitoring observations
83
6.4 Location of induced fractures as observed in the excavation
86
6.5 Location of induced fractures as observed in cores and auger cuttings
87
6.5.1 Observed orientation 88 6.5.2 Correlation to natural fractures
88
6.6 Compilation of data regarding fracture extent, orientation, and form
89
6.6.1 Radius of influence 91 6.6.2 Pancakes vs. spokes 91

Table of contents vi
6.7 Tracer visibility
92
6.7.1 Cores and auger cuttings 92 6.7.2 Excavation
93
6.8 Conclusions
93
Chapter 7: Discussion
95
7.1 Hypothesised method of induced fracture propagation at the Vasby site
95
7.2 Implications regarding creation of a dense fracture network
97
7.3 Evaluation of pneumatic fracturing as applied at the Vasby site
99
7.3.1 Pressure effects 99 7.3.2 Uplift 100 7.3.3 Linking the individual evaluations
101
7.4 Monitoring and evaluation data
101
7.5 Applicability of the modelling results
102
7.6 Site suitability for application of pneumatic fracturing in a remedial context
103
Chapter 8: Conclusions
105
Chapter 9: Perspectives
107
9.1 Potential improvements to the pneumatic fracturing process
107
9.2 Future research
108
9.2.1 Further field studies at Vasby
108
9.3 Further modelling studies
109
List of references
111
List of appendices
125


1
CHAPTER 1
INTRODUCTION Clayey glacial deposits are found across large areas of North America and Europe at or near ground surface (Parker et al., 1994). In Denmark, low-permeability clay-till deposits with a thickness greater than one meter cover more than 40% of the landscape, (Klint and Gravesen, 1999). Conse-quently, clay-till deposits are often sites of contamination. Chlorinated solvents are a widespread contaminant source and particularly difficult to remediate due to their chemical-physical characteristics. In particular their density, volatility and tendency to sorb to soil organic matter result in spreading and phase distribution that make them difficult to locate and remediate (AVJ, 2001). At older contaminated sites, solvent contamination slowly dif-fusing out of low-permeability media creates long-term contamination sources (Reynolds and Kueper, 2002; Broholm et al., 2005). In Denmark, this poses a serious threat to drinking water sup-plies, which are dominantly groundwater-based. Over the years, a number of techniques have been developed and tested in the context of remediating soil and groundwater contaminated with chlo-rinated solvents in situ. However, no single technique has been shown to achieve adequate remediation of chlorinated solvents found in low-permeability soils when applied alone (AVJ, 2003; Christ et al., 2005; Jørgensen et al., 2005). Environmental fracturing coupled with in situ remediation has shown more promise (Riser-Roberts, 1998; Roote, 2000; US DOE, 2000; Schuring, 2002). In particular, developing technolo-gies that couple environmental fracturing with in situ mass removal techniques such as chemical oxidation with permanganate, chemical reduction with zero valent iron, and enhanced anaerobic reductive dechlorination may provide remedial solutions (Christ et al. 2005; Jørgensen et al., 2005). Environmental fracturing refers to the process of injecting a fluid (liquid or gaseous) under pressure at a specific depth in a borehole to create a fracture for use in remedial purposes, i.e. accessing an otherwise inaccessible contamination for some type of remediation process. Injection of a water-based fluid is referred to as hydraulic fracturing, while injection of a compressed gas is referred to as pneumatic fracturing. Both types of environmental fracturing were developed in the United

2 Introduction
States and Canada, and have over the past decade become established and commercial techniques in these countries. Their application in other parts of the world appears extremely limited however. The limited use of environmental fracturing technology outside the US and Canada may be attrib-uted to the fact that the effects of the method are not yet, despite its commercialisation, well-documented. In general, environmental fracturing has thus far constituted a “black box” method, where documentation of effects is primarily provided via indirect methods in an unsystematic man-ner. The lack of documentation is exacerbated by the fact that most of the literature stems from remediation pilot projects or commercial remedial activities, where the testing methods and results may not stand up to scientific scrutiny. In addition, case studies tend to report enhanced remedia-tion effects rather than a characterisation of the fracturing process and precise documentation of the induced fracture network, for example EPA (1995), FRTR (1995-2005), Roote (2000), ARS (2005a), and FRx (2005). Only two excavation projects investigating environmentally fractured sites are known at exist: an ongoing GEUS project in Poland (Klint, 2005, personal communication) and a completed project in Sarnia, Canada (Markesic, 2000). The project in Poland involves hydraulic fracturing. The Sarnia site is believed to be a glacial lacustrian till (Klint, 1996) and thus, the characteristics of induced fractures attained at this site are not necessarily applicable to Denmark, where the most common type of till is basal till (Houmark-Nielsen et al., 2005). Environmental fracturing has been documented as effective in increasing the permeability of silt, clay and clay-till sites, increasing flow rates, and improving contaminant removal rates (Frank and Barkley, 1994; EPA, 1995; Bures, 1998; Roote, 2000). However, a number of researchers have observed a decreasing trend in removal rates over time (EPA, 1995; Martin et al., 2002; Schuring, 2002; Strong et al., 2004). Decreasing removal rates over time are frequently attributed to diffusion limitations, as research has demonstrated that significant contaminant mass may be stored in the porous geologic matrix (McKay et al., 1993b; Parker et al., 1994; Parker et al., 1997). In other words, while fracturing enhances advective and dispersive transport of contaminants in the subsur-face via increased permeability in the form of induced fractures, mass removal from these fractures is thought to become limited by the rate of diffusive transport from the soil matrix to the fractures (or other permeable features) (Ding et al., 2000; Kidd, 2001; Reynolds and Kueper, 2002; Schuring 2002; Broholm et al., 2006). A number of researchers have investigated diffusion in fractured low-permeability media via nu-merical models (McKay et al., 1993c; Parker et al., 1994; Ball et al., 1997; Parker et al., 1997, Ding et al., 2000; Reynolds and Kueper, 2001, 2002; Kueper and Reynolds, 2002). While some have investigated diffusion times, a systematic analysis of the relative influence of both matrix and frac-ture parameters on reverse diffusion rates and thus remediation times appears to be lacking.
Introduction 3
1.1 Project objectives
• A literature search will be undertaken to investigate the state of the art of environmental fracturing technology including the remedial enhancements achievable and characteristics of induced fractures.
• A modelling study will be undertaken to investigate whether environmental fracturing has the potential to reduce remediation times and if so under what conditions. The modelling results will also be evaluated from the perspective of field site results.
• The characteristics of a ‘typical clay till’ will be investigated to determine whether the field site may be considered typical and thus whether the fracturing results may be transferred to proposed sites. Furthermore, experiences from the North American case studies ought to be applicable to the Danish site, and thus Denmark in general if the field site is indeed typical.
• A field study will be conducted at a pilot-scale pneumatic fracturing project site (the first in Denmark) to compare the characteristics of induced fractures at the field site to those de-scribed in the literature. An excavation of an edge of the fracturing field will permit detailed inspection and characterisation of the induced fractures and investigation of their mode of propagation.
1.2 Report outline The report will focus on pneumatic fracturing as this is the type of environmental fracturing tech-nology applied at the field site. Appendices associated with the chapters are mentioned within the chapter text. Technical terms in italics are defined in Appendix A: Glossary. Chapter 2 presents the theory of the pneumatic environmental fracturing technology to establish the most important operator-determined parameters of the technology and the typical characteristics of induced fractures. Furthermore, suitability screening of proposed sites is discussed. The theory is supported by an extensive literature study, serving to structure North American experiences with the technology to date. Chapter 3 describes typical Danish basal clay tills: basal tills are the most common till type in Denmark. Surprisingly, an overview of characteristics of a typical Danish clay till was not found in the literature. The authors have therefore compiled an overview table, thus permitting conclusions regarding the representativeness of the field site in a Danish context to be drawn. Furthermore, the possibility of transferring US and Canadian experiences and results to Danish till sites and thus the suitability of the latter to undergo environmental fracturing is evaluated. Based on knowledge obtained from Chapters 2 and 3, a modelling investigation of the parameters and processes controlling chlorinated ethene transport in till is undertaken in Chapter 4. Identifica-tion of controlling parameters and processes facilitates confirmation or rejection of the hypothesis of diffusion-limited remediation at environmentally fractured sites in a late-time context. Further-

4 Introduction
more, an assessment of whether the controlling parameters and processes may be optimised via environmental fracturing is made. Investigation of a field scale technology in new settings is not complete without a field trial. The authors thus participated in a pneumatic fracturing pilot study carried out at a Danish clay till site (Vasby) in December 2005 with the purpose of evaluating conclusions drawn in Chapters 2 and 3, focus being placed on the parameters deemed most important in Chapter 4. (As the fracturing site is uncontaminated, and the timeframe of the project was furthermore of short duration, actual field tests of the conclusions drawn in Chapter 4 were not possible.) The authors’ independent contribu-tion to the field study consisted of an excavation of part of the fracturing site and characterisation of natural and induced fractures. Chapter 5 thus examines the excavation results pertaining to classification of the site’s natural geo-logic features, while Chapter 6 presents observations made during the pneumatic fracturing pilot study, results obtained via the excavation with regard to induced fractures, as well as other field data. Chapter 7 addresses issues raised in the preceding chapters. A theory regarding induced fracture propagation at the field site is presented. The fracturing process and the characteristics of the in-duced fractures are discussed relative to the fracturing literature. The modelling results are evaluated from the perspective of the field results. Chapter 8 concludes the report, while Chapter 9 offers perspectives for future work including fu-ture prospects of the technology in Denmark that are beyond the scope of this report.

5
CHAPTER 2
DESCRIPTION OF PNEUMATIC FRACTURING TECHNOLOGY
The following description of pneumatic fracturing technology is based on an extensive literature search including general summary reports and 39 international case studies (Canadian and US). The chapter presents the most important aspects of the technology thereby providing valuable background information for future users of the technology.
2.1 The evolution of fracturing Fracturing has been used in the oil industry since the 1940s (Bures, 1998), and in the water well industry for more than 50 years to increase the radius of influence and flow rates to wells, thereby increasing production rates (Schuring, 2002). In the early 1980s, pilot-scale fracture technology was applied to address similar well-production problems at low-permeability contaminated sites in the US where remedial activities based on abstraction were ineffective (EPA, 1994). Fracturing in a remedial context is referred to as environmental fracturing and may include blast fracturing (the use of explosives in bedrock), hydraulic fracturing (injection of a liquid under pressure) and pneu-matic fracturing (injection of a compressed gas). Blast fracturing is not discussed further. Hydraulic fracturing is discussed in Appendix B: Description of hydraulic fracturing technology. This appen-dix also contains general information that pertains to both pneumatic and hydraulic fracturing, for example types of well completion and fracturing from horizontal wells. Pneumatic injection technology is not a stand-alone remedial technology (Bures, 1998; Suthersan, 1999; Schuring, 2002) but is used to enhance other remedial activities. Awareness of the potential for diffusion to act as the rate-limiting step in many remedial projects appears to have shifted the focus of environmental fracturing away from the creation of a few large fractures (as was the goal in the 1980s) towards attempts to create dense fracture networks. A dense network increases frac-ture density, shortens diffusion pathways, and thus reduces the time for matrix-embedded
6 Description of pneumatic fracturing technology
contaminants to travel to fractures where mass removal (via advective transfer to the surface or in situ mass transformation or reduction) can occur. The extensive environmental fracturing literature is discussed in Appendix C: Experiences with environmental fracturing. Appendix Y: Electronic data, Table C.1*: US and Canadian experiences with environmental fracturing is a ‘searchable’ database that summarises the most relevant infor-mation from the literature search.
2.2 Pneumatic fracturing method Pneumatic fracturing is described as producing a dense network of small-aperture fractures (0.5 – 1 mm) with radii ranging between about 3 to 15 m from the fracture well as low-viscosity gas is forced through the overburden (Kidd, 2001; see also Table 2.2). The vertical extent of the network is determined by the packer interval (described below). Pneumatic fractures are also said to propa-gate along, and extend existing fractures while creating a secondary network of smaller fractures (EPA, 1995). This dense small-aperture network is believed to a function of the low viscosity of gas, creates a dense network of small-aperture fractures throughout the fracture interval and extend-ing meters away from the fracture well.
2.2.1 Procedure
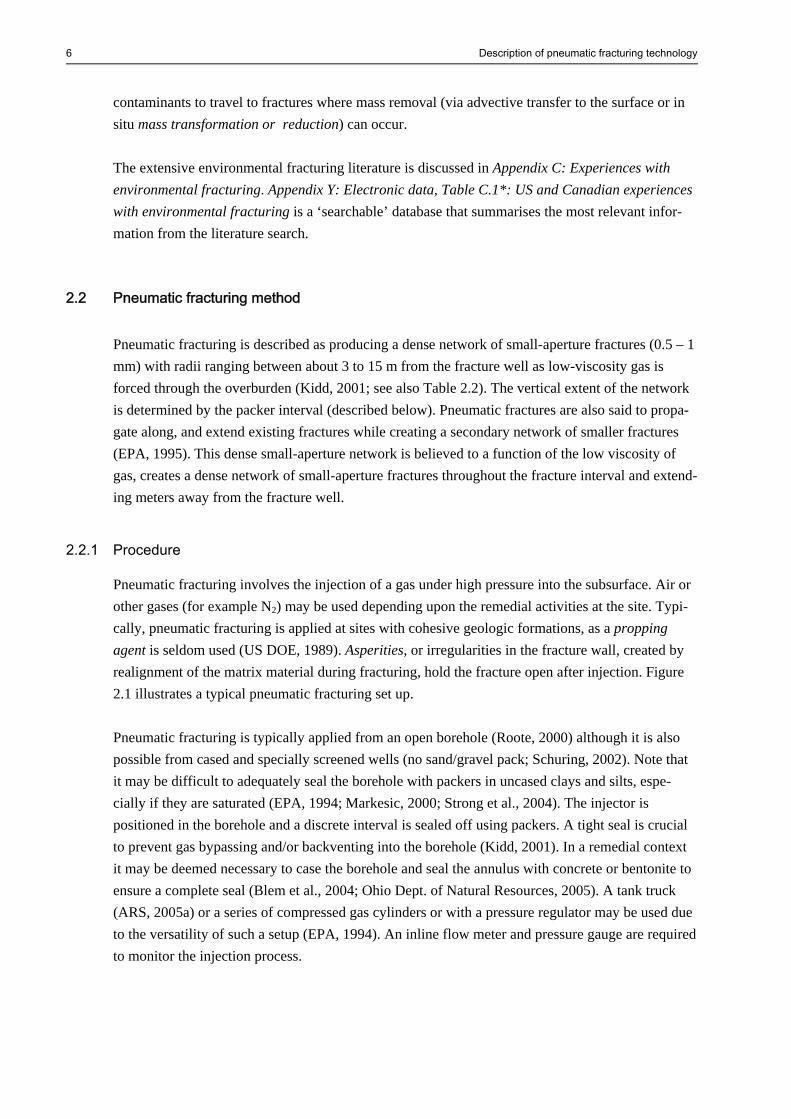
Pneumatic fracturing involves the injection of a gas under high pressure into the subsurface. Air or other gases (for example N2) may be used depending upon the remedial activities at the site. Typi-cally, pneumatic fracturing is applied at sites with cohesive geologic formations, as a propping agent is seldom used (US DOE, 1989). Asperities, or irregularities in the fracture wall, created by realignment of the matrix material during fracturing, hold the fracture open after injection. Figure 2.1 illustrates a typical pneumatic fracturing set up. Pneumatic fracturing is typically applied from an open borehole (Roote, 2000) although it is also possible from cased and specially screened wells (no sand/gravel pack; Schuring, 2002). Note that it may be difficult to adequately seal the borehole with packers in uncased clays and silts, espe-cially if they are saturated (EPA, 1994; Markesic, 2000; Strong et al., 2004). The injector is positioned in the borehole and a discrete interval is sealed off using packers. A tight seal is crucial to prevent gas bypassing and/or backventing into the borehole (Kidd, 2001). In a remedial context it may be deemed necessary to case the borehole and seal the annulus with concrete or bentonite to ensure a complete seal (Blem et al., 2004; Ohio Dept. of Natural Resources, 2005). A tank truck (ARS, 2005a) or a series of compressed gas cylinders or with a pressure regulator may be used due to the versatility of such a setup (EPA, 1994). An inline flow meter and pressure gauge are required to monitor the injection process.

Description of pneumatic fracturing technology 7
Figure 2.1: The principles of pneumatic fracturing. Typically, an interval of a borehole is isolated using packers. Gas is injected under pressure at a high flow rate to create new fractures and a dense network of secondary fractures. The fracturing process is monitored. The amount of surface uplift is an indication of the fracture aperture, while the radial extent of uplift is an indication of the fracture extent.
2.2.2 Stress and orientation of induced fractures
From a remedial perspective, the creation of predominately horizontal fractures is desirable as it increases the contact of fractures with contaminated areas that are predominately shallow and flat-lying. Furthermore, induced horizontal fractures connecting with existing (short) vertical fractures may create a network of fractures. Induced fractures form perpendicular to the direction of least principal stress (Suthersan 1999). In Denmark, much of which has been previously glaciated, the sediments are referred to as overcon-solidated, meaning that the compaction of the sediments (due to glaciation) is greater than the present-day in situ stress. Glacial retreat caused the relationship between stresses in the sediments to shift as the vertical stress diminished, while the horizontal stresses remained unchanged. Thus, in present-day overconsolidated glacial sediments, the vertical stress is the smallest and fractures tend to propagate in an initially horizontal direction. However, as induced fractures propagate, their direction may be influenced by geological ‘weaknesses’ and ‘paths of least resistance’ (EPA, 1994). A more thorough discussion of stresses and overconsolidation is found in Appendix D: Discussion of directions of stress and overconsolidation. Due to the influence of stress on the initial direction of fracture propagation, disturbed, excavated, and/or eroded sites may not be suitable fracturing sites as the in situ stresses are disturbed (Kidd, 2001, Schuring, 2002).
Gas cylinders
Safety valve
Pressure regulator Flow gauge
Packer
Nozzle
Typical maximum depth ~ 10 m
Mimimum fracture depth trypically > 3m
Fracturing interval ~0.6 m
Pressure transducer
Uplift monitoring equipment

8 Description of pneumatic fracturing technology
Surface loading may also have an effect on the direction of fracture propagation. Large vehicles have been used to ‘steer’ fractures in a desired direction (Suthersan, 1999). Apparently ‘uninten-tional steering’ of induced fractures towards buildings and other points of surface loading is common (Nilsson et al., 2000).
2.2.3 Saturation conditions
Pneumatic fracturing has been successfully applied in the unsaturated (vadose) and saturated zones (Roote, 2000). The borehole accessing the desired interval(s) may be drilled using an auger drill, direct push, or other method. The radius of the borehole will depend upon the size of the fracturing equipment, as well as the number of completed wells planned for a particular borehole.
2.2.4 Operator-determined parameters
Flow rate
The injection flow rate is the dominant factor in controlling pneumatic fracture dimensions. Thus, the design goal of a pneumatic fracturing project is to provide the highest flow rate possible EPA, 1994; Suthersan, 1999). Based on field observations, pneumatic fractures reach their maximum dimensions after about 20 seconds, and further injection appears only to hold the fractures fully dilated (Suthersan, 1999).
Fracture initiation pressure
The pressure required to initiate a pneumatic fracture depends upon the cohesive (tensile) strength of the formation and the overburden pressure (a function of the density and depth). Initiation pres-sures found in the literature range from 500 to 2000 kPa (US DOE, 1998). Suthersan (1999) for example, claims that about 700 kPa is adequate at about 6 m b.s. (100 psi at 20 ft). A method to calculate a rough estimate of the required initiation pressure is found in Appendix E: Method to estimate required initiation pressure for pneumatic fracturing. However, specific field data which are not typically available are required in the formula (for example, apparent tensile strength of the overburden). Considering the difficulty in obtaining data and the potential variability across a site and over depth, it will likely be more practical and just as appropriate to adopt a rule-of-thumb value or reasonable initiation pressure used at a similar site and test it at the fracture site. A rule-of-thumb to estimate the pressure required to ‘lift the overburden’ is 14 to 21 kPa per 0.3 m depth (2-3 psi per foot of depth; Schuring, 2002) and further pressure may be required to overcome frictional loses in delivery lines, geologic formation, etc.
Fracture propagation pressure
The pressure required to propagate a fracture is less than the initiation pressure (EPA, 1994). The compressed gas is injected at rates of 25 to 50 m3/ minute for periods of generally 10 to 30 seconds (US DOE, 1998). Suthersan (1999) claims that flow rates of about 28 m3/ minute (1000 scfm) are

Description of pneumatic fracturing technology 9
adequate in low permeability deposits. The actual propagation pressure will depend upon the flow rate and the site characteristics. Although the propagation pressure is lower than the initiation pressure, the injection must be main-tained at a rate that exceeds the ability of the formation to receive the gas, i.e. the flow rate must exceed the natural permeability of the formation so that enough ’back pressure’ is developed to propagate the fracture (Suthersan, 1999; Schuring, 2002). Reference to previous studies, and/or experience, and/or estimation methods may be used to obtain educated estimates of suitable pressures at a proposed site. However, both the initiation and propa-gation pressures depend upon the site geology and operator-determined parameters (i.e flow rate). Therefore, a test fracturing in an uncontaminated area of the site is always recommended (Kidd, 2001).
2.2.5 Leak-off
The maximum radius and aperture of a pneumatic fracture is a function of the volume of gas in-jected into it and the rate of leak-off (EPA, 1994; Suthersan, 1999). Leak-off refers to the movement of fracture gas into pores and natural fractures along the fracture plane. When the rate of injection equals the rate of leak-off into the formation, propagation ceases. Fast rates of leak-off may dilate pores and natural fractures adjacent to the main fracture, further contributing to in-creased permeability (EPA, 1994).
2.2.6 Surface venting and intersection with subsurface structures
Fracture propagation also ceases for the following reasons: 1) if the fracture climbs and vents at ground surface referred, a phenomenon referred to as a blow-up or daylighting; 2) the gas intersects a utility line, improperly sealed borehole, etc. and the pressure is ‘bled off’; or 3) the gas meets a solid structure (Suthersan, 1999). While surface venting provides visual confirmation of the extent of induced fracture(s), it is an undesirable event in most situations. Diversion of horizontally propagating fractures towards ground surface means that the fracture length and radius of influence that could potentially be achieved at a site do not develop. Markesic (2000), using a ‘top-down’ fracturing method (de-scribed below) starting at 2.5 m b.s., observed that all subsequent (deeper) fractures resulted in repeated surface venting at the same locations (8 and 5.4 m from the fracturing well). In the past, and in the context of present-day coupled mass-transfer remedial technologies, the goal of fractur-ing is often to induce fractures with the greatest radial extent and an aperture large enough to permit advection or delivery of remedial substances. However, a balance must be attained between the high injection pressure and flow rate required to produce large fractures, and lower pressures and rates to prevent surface venting. On-site trial and error is the only method to determine optimal injection pressure and flow rate (Kidd, 2001).
10 Description of pneumatic fracturing technology
2.3 Creating multiple fractures in vertical boreholes
2.3.1 Number of fracture intervals and spacing
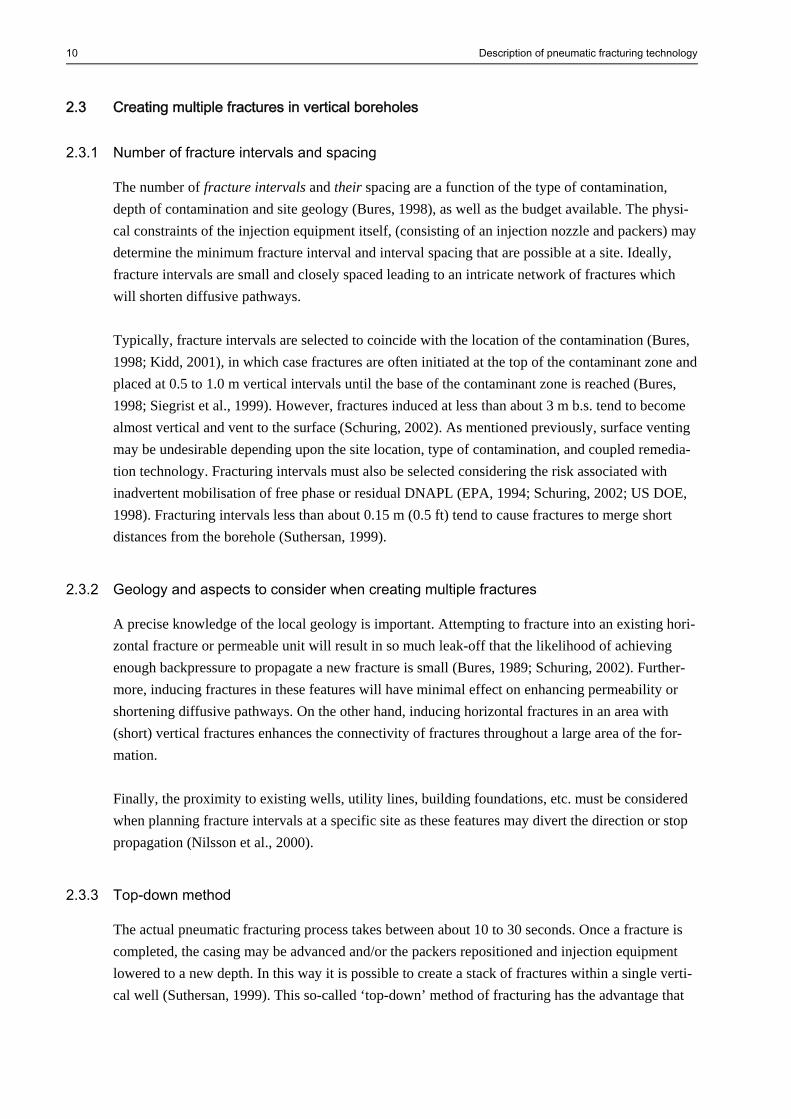
The number of fracture intervals and their spacing are a function of the type of contamination, depth of contamination and site geology (Bures, 1998), as well as the budget available. The physi-cal constraints of the injection equipment itself, (consisting of an injection nozzle and packers) may determine the minimum fracture interval and interval spacing that are possible at a site. Ideally, fracture intervals are small and closely spaced leading to an intricate network of fractures which will shorten diffusive pathways. Typically, fracture intervals are selected to coincide with the location of the contamination (Bures, 1998; Kidd, 2001), in which case fractures are often initiated at the top of the contaminant zone and placed at 0.5 to 1.0 m vertical intervals until the base of the contaminant zone is reached (Bures, 1998; Siegrist et al., 1999). However, fractures induced at less than about 3 m b.s. tend to become almost vertical and vent to the surface (Schuring, 2002). As mentioned previously, surface venting may be undesirable depending upon the site location, type of contamination, and coupled remedia-tion technology. Fracturing intervals must also be selected considering the risk associated with inadvertent mobilisation of free phase or residual DNAPL (EPA, 1994; Schuring, 2002; US DOE, 1998). Fracturing intervals less than about 0.15 m (0.5 ft) tend to cause fractures to merge short distances from the borehole (Suthersan, 1999).
2.3.2 Geology and aspects to consider when creating multiple fractures
A precise knowledge of the local geology is important. Attempting to fracture into an existing hori-zontal fracture or permeable unit will result in so much leak-off that the likelihood of achieving enough backpressure to propagate a new fracture is small (Bures, 1989; Schuring, 2002). Further-more, inducing fractures in these features will have minimal effect on enhancing permeability or shortening diffusive pathways. On the other hand, inducing horizontal fractures in an area with (short) vertical fractures enhances the connectivity of fractures throughout a large area of the for-mation. Finally, the proximity to existing wells, utility lines, building foundations, etc. must be considered when planning fracture intervals at a specific site as these features may divert the direction or stop propagation (Nilsson et al., 2000).
2.3.3 Top-down method
The actual pneumatic fracturing process takes between about 10 to 30 seconds. Once a fracture is completed, the casing may be advanced and/or the packers repositioned and injection equipment lowered to a new depth. In this way it is possible to create a stack of fractures within a single verti-cal well (Suthersan, 1999). This so-called ‘top-down’ method of fracturing has the advantage that

Description of pneumatic fracturing technology 11
only a small interval of the formation is lifted with each fracturing interval. Thus, there is less like-lihood of opening large vertical fractures which may limit the lateral extent of subsequent induced horizontal fractures (Klint, 2005, personal communication).
2.3.4 Bottom-up method
It is also possible to create fractures from the bottom up, by advancing the casing or drilling to the maximum depth and then isolating the fracture zone with packers. After a fracture is complete the casing is withdrawn and/or the packer system is raised together with the fracturing equipment. The ‘bottom-up’ method has several advantages. First, there is less surface uplift associated with deeper fractures (Blem et al., 2004). Thus, in areas with sensitive surface structures, a stack of increasingly shallow fractures could be induced, while constantly assessing the acceptability of the uplift. Sec-ond, smearing along the inside of a borehole caused by augering or an advancing casing can reduce the hydraulic conductivity of a well by 1-2 orders of magnitude (McKay et al., 1993a)*. Thus, the bottom-up method reduces the possibility that induced fractures become ‘smeared closed’ by ad-vancing casing and/or packers. The bottom up method has the disadvantage that it lifts the entire overburden and thus may open vertical fractures from the given fracturing depth to the surface. These vertical features may limit the possible lateral extent of subsequent fractures (Klint, 2005, personal communication). Lower than expected injection pressures and/or lack of surface uplift observed by some researchers at shallower fracturing depths (Strong et al., 2004) may be due to the above-described opening of the overburden.
2.4 Monitoring during the fracturing process A number of parameters are monitored during environmental fracturing to: 1) ensure that the frac-turing activities are proceeding properly; 2) obtain information about the fracture dimensions and; 3) to prevent damage to nearby structures and/or utilities.
2.4.1 Pressure-time curves
The pressure is monitored over time to obtain an indication of whether the fracturing process has proceeded typically. Atypically high pressures may be an indication of clogging somewhere in the injection system, while atypically low pressures may indicate a leak in the injection system, surface venting, loss of gas into an utility line, etc. (Walsted et al., 2002), see Figure 2.2.
* This problem, however, may be addressed by pushing the advancing casing in with as little rotation is possible (D’Astous et al., 1989), thereby, preserving any existing fractures.

12 Description of pneumatic fracturing technology
Figure 2.2: Pressure vs. time curve measured during pneumatic fracturing. A-B represents gas pressure build-up as gas is injected into the sealed borehole. The formation is not yet fractured. B represents ‘cracking’ of the formation. The pressure exceeds the in situ stress conditions and the strength of the formation within the in-terval isolated by the packers and a fracture is initiated. B-C represents the pressure decline within the sealed interval as gas rushes out of the packer interval and into the propagating fracture. C-D represents a period of fracture maintenance and dilation. Here the flow rate into the fracture exactly equals the leak-off. D-E repre-sents termination of pressure injection and rapidly declining pressures (figure from ARS, 2005b).
2.4.2 Flow measurements
A flow meter indicates the amount of fluid injected into the formation and provides general moni-toring of the injection process.
2.4.3 Measurement of pressure effects
Pressure effects may be measured at several locations. A recording pressure transducer is often placed in the borehole to provide more precise monitoring of the process (Kidd, 2001). Monitoring wells may be fitted with pressure transducers, or simple plastic bags sealed to the top of the stand pipe to obtain an indication of the magnitude and extent of connectivity achieved by fracturing (Blem et al., 2004).
2.4.4 Uplift
The amount and radial extent of surface uplift during and after fracturing may be recorded using survey equipment and/or tiltmeters (EPA, 1994). The amount of uplift is often assumed to be
representative of the induced fracture aperture(s) at shallow depths (1.5 to 5 m b.s. i.e. when the ratio of fracture length to depth is about 3; EPA, 1994). Similarly, the radial extent of surface uplift is often used as indirect measurement of fracture length/radius (US DOE, 1998). Although these monitoring techniques are widely used to assess fracture characteristics (EPA, 1994; US DOE 1998, they are at best imprecise and at worst misrepresentative.

Description of pneumatic fracturing technology 13
Paradoxically, fracture aperture is seldom measured directly, although the accuracy of this term may be important in diffusion calculations.Fracture radius (the lateral extent of fractures) may af-fect hydraulic conductivity and advection by orders of magnitude, but is likewideypically measured indirectly via uplift. Cores, while they disturb aperture measurements provide direct documentation of the the induced fractures. Some of the shortcomings of commonly-used direct and indirect methods of fracture characterisation are described in Appendix F: Direct and indirect methods to evaluate the pneumatic fracturing process and induced fractures. This appendix provides the reader with background knowledge which facilitates a more critical assessment of fracturing results.
Uplift near sensitive structures
Tiltmeters have the advantage that they record surface deformation during the fracturing process. Thus, they are recommended at sites with sensitive structures (EPA, 1994). It is generally believed that overlying structures can accommodate a deformation of 1:300 (or 1 cm over 3 m) without structural damage (Schuring, 2002). No reports of structural damage due to uplift during fracturing were found during the literature search, thus typical uplift is assumed to be less than 2 cm as Nils-son et al. (2000) claim that uplift greater than this may cause structural damage. Large rigid structures, for example concrete pads, appear unaffected (US DOE, 2000). In terms of sanitary and storm sewers, an uplift of 1.0 to 1.5 percent (i.e. 1 cm over 1 m) can lead to flow problems. Plastic pipes are particularily sensitive to uplift and displaced connector collars lead to a risk of leakage (Thornberg, 2005, personal communication).
2.5 Post-fracture testing Some type of post-fracture testing is generally conducted as documentation of the fracturing effects. At contaminated sites, the testing often includes pump tests to measure the radius of well influence, vapour and/or hydraulic conductivity enhancements, as well as mass removal rates to document enhanced contaminant removal rates (Roote, 2000). Uplift measurements to estimate apertures and fracture radii are the most common methods to document the extent of fractures These indirect methods are simple and inexpensive but imprecise (Schuring, 2002). The use of tracer tests is rare, and the use cores to provide documentation of induced fracture networks appears to be undertaken only at research sites (Markesic, 2000, Walsted et al., 2002; Blem et al., 2004)
2.6 Evaluation of the induced fracture effects Environmental fracturing has been undertaken at many sites to realise a variety of improvements in remedial activities, some of which are listed in Box 2.1.

14 Description of pneumatic fracturing technology
Box 2.1: Anticipated improvements to be achieved by application of environmental fracturing, as reported in the literature. More than one improvement may be expected at a single site.
All case studies in the literature report at least some degree of success in achieving their particular goals, and often the degree of enhancement is substantial as indicated by Table 2.1. These figures appear encouraging, but they must be seen in relation to remediation targets, which have not, in most of these cases, been identified. Furthermore, while remediation targets may be met at a par-ticular project, residual concentrations may remain significantly above Danish drinking water criteria (for example, 0.1 μg/L for the total content of chlorinated solvents; Kjeldsen and Christen-sen, 1996). Documentation of residual concentrations nearing Danish drinking water guidelines were not found in the literature search of the case studies. Table 2.1: Summary of fracturing results as reported by Schuring (2002) and a literature search of 39 pneu-matic fracturing studies.
Results from 86 case studiesA Enhancements Range of
reported results Average of
reported results Results of literature searchB
Increase in permeability / Conductivity
1.5 to 175 times 28 times 1 to > 1 order of magnitude
Increase in mass removal rates
3 to 25 times 10 times 50-99.9%C
Fracture radius
1.4 to 10.7 m 4.9 m 2.6 to > 10 m
Increase in radius of well influence
1.4 to 30 times 8 times 50 to 200%
A: from Schuring, 2002. Some of the 86 case studies may or may not be the same as those reported in Ap-pendix C: Experiences with environmental fracturing. None of these 86 studies are blast-fracturing studies. B: See Appendix Y: Electronic data, Table C.1*: US and Canadian experiences with environmental frac-turing for details. C: percent reduction in contaminant concentration.
1. Creation of pathways to enhance movement and removal of liquid and vapour contaminants through low permeability soils (EPA, 1994; Bures, 1998; Schuring, 2002; Blem et al., 2004)
2. Provision of contaminant containment (Bures, 1998; Walsted et al., 2002) 3. Increase in radius of influence around the fracture well (EPA, 1994, Blem et al., 2004) 4. Delivery of chemical or biological reagents or supplements, for example nutrients, microbes,
etc. into low permeability soils (EPA, 1994; Bures, 1998; Schuring, 2002; Strong et al., 2004) 5. Increase of contact area with contaminated soils, particularly isolated pockets, or under struc-
tures (US DOE, 1998; Schuring, 2002; Blem et al., 2004;) 6. Intersection with natural fractures and thus improved fracture connectivity (US DOE, 1998) 7. Creation of advective channels (Suthersan, 1999; Schuring, 2002) 8. Shortening of diffusion pathways (Suthersan, 1999; Schuring, 2002) 9. Reduction of remediation time (EPA, 1995; Schuring, 2002) 10. Reduction of costs (Schuring, 2002; Blem et al., 2004) 11. Improved operational control of remediation processes due to more uniform pressure gradients
in entire formation (Schuring, 2002)

Description of pneumatic fracturing technology 15
In addition, since most of the literature regarding environmental fracturing stems from remedial pilot projects or full-scale commercial remedial projects, the methods of fracture characterisation and pneumatic fracturing performance evaluation may not stand up to scientific scrutiny. Note that in Table 2.1 fracture radius refers to the physical extent of induced fractures. The radius of well influence or just radius of influence refers to the radius within which effects of fracturing can be measured, although physical evidence of induced fractures may not be observable. The ra-dius of influence is said to be about 3 times greater than the fracture radius (Blem et al., 2004). In the literature, measurements of radius of influence are often used as surrogate estimates of fracture radius (given the rarity of direct measurements). A long timeframe will be required to assess whether some of the anticipated improvements listed in Box 2.1, for example shortening of diffusive pathways, are realised. Other improvements are cum-bersome and/or expensive to measure, for example # 6 (intersection with natural fractures and thus improved fracture connectivity). Consequently, the majority of the fracture evaluation results are presented in terms of improved fluid extraction, mass removal rates, etc., or easily measured physi-cal parameters. Much less weight is laid on a precise description of small-scale fracture characteristics, for example via visual inspection of cores. Thus, the improvements listed in Box 2.1 are assumed to occur to some degree, but are rarely investigated directly. Consequently, readers of fracturing literature must be critical regarding reported fracture characteristics and performance enhancements attributed to environmental fracturing.
2.7 Characteristics of pneumatically induced fractures Pneumatic fracturing is typically described as producing a dense network of small-aperture frac-tures over the entire fractured interval (US DOE, 1998; Strong et al., 2004). Pneumatic fracturing is also said to extend existing fractures and create a secondary network of fissures and channels (EPA, 1995). Documentation to support the above description of dense networks is poor. Consequently, it is uncertain whether a dense network is actually created, and if so whether creation of such a net-work is a function of the fracturing method, site characteristics, or both. However, if pneumatic fracturing creates both a dense network of fractures to shorten diffusive pathways and fracture ap-ertures large enough to permit advective flow and/or delivery of remedial substances, it would be an attractive fracturing technology to enhance in situ remedial techniques. Unfortunately, only one study documents creation of a dense network of induced fractures in parts of a fracturing field (Markesisc, 2000). The literature search revealed a wide range of quantitative results indicating that the applicability and results of fracturing are highly site dependent (Schuring, 2002). Table 2.2 presents a selection of typical values which consequently should be considered as guideline values, rather than absolute parameter definitions. The maximum depth to which pneumatic fracturing can be applied and cre-ate horizontal fractures is uncertain. The largest pneumatic contractor, ARS claims that there is no

16 Description of pneumatic fracturing technology
theoretical depth limit for initiating a fracture in a geologic formation as long as sufficient pressure and flow can be delivered to the fracture zone. The maximum depth to which ARS has been able to achieve horizontal pneumatic fractures is as yet 23 m b.s. (75 ft b.s.), however, no mention was made concerning the geology (ARS 2005a). Roote (2000) states that the maximum documented pneumatic fracturing depth is about 14 m b.s. (45 ft b.s.). A maximum depth of about 10 m (30 ft) appears feasible based on the literature search. The main disadvantage of pneumatic fractures is their apparent short longevity (from months to greater than two years (EPA, 1994; Suthersan 1999). However, this disadvantage may be addressed by pneumatically injecting fine-grained solid material to prop the fractures open (EPA, 1994). In a remedial context, sand could be replaced with a propping agent beneficial to coupled remediation technologies (see Appendix G: Coupled remediation technologies). The possibility of propping pneumatic fractures makes the technique more attractive economically (greater fracture longevity per fracturing event) and more flexible from a remedial perspective (enhanced permeability, con-nectivity, shorter diffusion pathways plus, the possibility to re-inject reagents).

Description of pneumatic fracturing technology 17
Table 2.2: Comparison of pneumatic fracturing requirements and results obtained primarily from summary reports. Specific results from case studies are presented in Appendix Y: Electronic data, Table C.1*: US and Canadian experiences with environmental fracturing.
Characteristics of pneumatically induced fractures and fracturing process
Aperture
0.5 – 1 mmA,B; difficult to determine at depthC; decrease with depth due to overburden absorbing strain of deformationD; 0.2 – 40 mm*
Uplift
When shallow fractures (i.e. length to depth ratio = 3) then uplift = apertureC
Fracture fluid
Air or other gas (i.e. N2) – clean operation and volume of contaminated media is not increased, less chance of creating an onsite spill via back pressure vent-ing into the fracture wellA
Initiation pressure
About 700 kPa at 6 m b.s. (100 psi at 20 ft b.s )B; can be estimated B; ranges of pressures used (maybe init and prop) are 500-2000 kPa (73-290 psi)A; 500-1000 kPa (73-145 psi)C; ~14 to 21 kPa per 0.3 m depth (2-3 psi/ft overburden) plus frictional losesD; function of cohesion of overburden, depth, etc.C; site specificE
Propagation pressure
Generally less than initiation pressureC; site specificE
Flow rate
25-50 m3/minuteA; 28 m3/minute is generally adequate in low-permeability depositsB
Duration of fracturing
20 secondsA; 15-20 secondsD
Orientation
Predominately horizontal, the fractures may ‘climb’ towards the surface at outer edges of shallow fracturesA; tendency to propagate along existing frac-turesB; follow ‘path of least resistence’B,E,F,G; extend existing fractures and create a secondary network of fissures and channelsH; redistributed the subsur-face flowH,G; function of site and operator-determined parametersC
Radius of fracture zone
~6 to 15 m, max. ~21 (20-50 ft max 70A); 3 to 8 m (10-25 ftB); at depths of about 1.5 to 5 m b.s. fracture radius = 3 x fracturing depth, at depths > 5 m b.s. then radius = 4 x fracturing depthD; 4.6 to 9 m (15-30 ft)*
Radius of influence
About 3 times the fracture radiusI,J; 3 to 100 m (10-300 ft)*
Minimum depth possible
> 3 m otherwise surface venting (daylighting) tends to occur but in dense, stratified deposits shallower may be possible, i.e. min depth 0.9 mD
Maximum depth possi-ble
Less than 23 m (75ft)K; weight of overburden below this depth reduces the self-propping ability of the fracturesA; about 14 m (45 ft)L; 2-26m (7-80 ft), but max. generally at about 10 m (30 ft)*
Injection interval
0.2 to 0-9 m, although 0.6 m is typicalD
Minimum spacing be-tween fractured intervals**
Depends on fracturing equipment
Longevity
> 2 years, but site specificB; once a fracture is opened in clay is does not ‘heal’ during swellingD; many months, but may close if formation becomes saturatedC
Factors controlling max dimensions
Injection flow rate (and rate of leak-off)B
Advective flow
No propping agent, so the Cubic Law appliesB
Fracture density
Dense network of microfractures with a small area of influence immediately around the fracture well, a few major fractures propagate out into the forma-tionA
* Range of values found during the literature study; A: US DOE, 1998; B: Suthersan, 1999; C: EPA, 1994; D: Schur-ing, 2002; E: Kidd, 2001; F: Markesic, 2000; G: Strong et al., 2004; H: EPA, 1995; I: Nilsson et al., 2000; J: Blem et al., 2004; K: ARS, 2005a; L: Roote, 2000. **The minimum distance between fractured intervals is poorly defined/described in the literature. In some studies the packer and fracturing equipment form a single unit and thus, while there is actually some spacing between the fractured zones, it is possible to have nearly continuous fracture intervals. In other studies only selected depths or geological units are fractured and the spacing between fracture intervals may be long and/or irregular.

18 Description of pneumatic fracturing technology
2.8 Potential risks associated with environmental fracturing
Although environmental fracturing has been demonstrated to enhance permeability and improve removal rates, the benefits must be weighed against potential risks. Box 2.2 is provides a list of potential risks but is likely not complete, thus it is up to the environmental consultant to evaluate the particular site and identify potential problems. Box 2.2: Potential problems associated with environmental fracturing.
1. Possible compression of the borehole arising from inflation of the dual-interval packers during pneumatic fracturing may render the borehole unsuitable for subsequent use as an injection, ex-traction, or monitoring well (Kidd, 2001).
2. Smearing due to advancing equipment (and perhaps packer compression) may close previously induced fractures (D’Astous, et al., 1989).
3. High vacuum pressure used in some coupled remediation methods, for example dual phase extraction, may “choke off” or close natural and perhaps induced fractures resulting in altered or even decreased permeability (Bures, 1998).
4. Fracturing may re-arrange the connectivity in the underground (EPA, 1995) and may result in decreases in hydraulic conductivity (Markesic, 2000).
5. Increased hydraulic connectivity at a site may result in raised water table elevations which may hamper some remedial activities, for example soil vapour extraction or injection of gases, etc. in enhanced in situ methods (Bures, 1998).
6. Lack of control in fracture generation (US DOE, 1998). 7. May remobilise contamination (Schuring, 2002; US DOE, 1998). Strong possibility for vapour
mobilization during pneumatic fracturing and aqueous mobilization during hydraulic fracturing (EPA, 1994). Also creation of vertical fractures or intersection with natural vertical fractures may cause downward migration of DNAPL (EPA, 1994). However, geomechanical theory and extensive in situ monitoring has demonstrated that fractures at shallow depths (< 30 m) con-tinue horizontally or propagate upwards towards ground surface (Schuring, 2002). Creation of horizontal fractures may lead to rapid horizontal flow and lateral migration of contaminants (Jakobsen and Klint, 1999; Klint and Gravesen, 1999).
8. Damage to buildings and utilities (Schuring, 2002). Uplift of about 1-3 cm occurs when frac-tures are induced at about 5 m b.s. When fractures are deeper than 5 m b.s., then heave is small (Schuring, 2002). Significant heave directly around the point of injection in loose soils (Schur-ing, 2002). Heave of 1 to 1.5% cm may cause flow problems in sewers (Thornberg, 2005, personal communication).
9. Damage to existing wells (short-circuiting of slurry into well, breaching of seal, vertical shift-ing of casing) may occur. The amount of damage is a function of the distance to the fracture well, robustness of well construction, and operational fracturing pressures (Schuring, 2002; ARS Consultants, 2005, personal communication).

Description of pneumatic fracturing technology 19
2.9 Suitability screening of sites for application of environmental fracturing
2.9.1 Characteristics of unsuitable sites
Table 2.3 lists a number of factors that must be considered when screening the suitability of a pro-posed site for application of pneumatic fracturing. Some factors are relatively minor, for example proximity to sensitive structures, and will not likely eliminate a site. It is up to the environmental consultant to decide whether a particular site is suitable. A discussion of pre-fracturing screening and testing that ought to be performed at a proposed site is found in Appendix H: Planning field-work at proposed fracturing sites. Since environmental fracturing is not a stand-alone technology, simultaneous site suitability screening with regard to the proposed coupled remediation technology is also necessary. This topic is beyond the scope of this project. However, screening methods have been established, for example for ARD (Jørgensen et al., 2005; see Appendix I: Assessment of site suitability for ARD.

20 Description of pneumatic fracturing technology
Table 2.3: Characteristics of potentially unsuitable sites regarding application of pneumatic fracturing. Characteristic Value(s) Comments
Hydraulic conductivity >10-6 m/s (Bures, 1998)
Effect of permeability increase will be small relative to frac-turing costs.
Proportion of cobbles and boulders Many
Difficult to propagate and control fracture orientation (Bures, 1998).
Heterogeneous sites Complex geology with many perme-able features
Difficult to achieve fractures in sand (Bures, 1998). Difficult to control propagation (US DOE 1998). Induced fractures strongly influenced by path of least resistance (EPA, 1994). Native permeability may be high enough that fracturing will produce negligible effect (Bures, 1998).
Depth to contamina-tion
< 3 m from ground surface
Conventional methods (excavation) often more cost- effec-tive. (Bures, 1998). Risk of surface venting (Schuring, 2002).
Degree of consolida-tion*
Fill, unconsolidated overburden Ko <1; ORC<1
Difficult to achieve fractures (Bures, 1998). Sediments are underconsolidated and vertical fractures will tend to form (Schuring, 2002).
Plastic limit of soil
The higher the plas-tic index, the more sensitive the soil is for water and will liquefy
Fractures will not propagate as far in plastic clays compared to brittle clays (Nilsson et al., 2000).
Liquid limit of soil
Natural moisture content > liquid limit
May liquify under fracturing (Suthersan, 1999).
Cohesion Poorly consolidated / weak cohesion
Fractures tend to close upon relaxation of fracture stress if geologic material is not cohesive (Suthersan, 1999). Loose soils tend to heave significantly immediately around injec-tion point (Schuring, 2002).
Proximity to buildings, utility lines, etc.
Close to historic structures, structures with weak founda-tions, utility lines that cannot be prop-erly sealed, etc.
Uplift may weaken buildings and ultilities (US DOE, 1998). Utilities etc may act as preferential pathways and limit frac-ture generation due to leak-off (US DOE, 1998). Heavy installations/buildings/tanks at surface may cause surface loading that may ‘steer’ the fracture towards the point of stress (Suthersan, 1999). Most buildings will not be affected by a 1:300 surface heave to horizontal distance deformation (Schuring, 2002). Although uplift of 1 to 1.5% may cause flow problems in sewers (Thornberg, 2005, personal com-munication).
Contamination
Creation or opening of vertical fractures may mobilise DNAPLs.
Number of natural fractures
Extensive natural fractures may result in so much leak-off that fracturing pressure cannot be attained (US DOE, 1998). Presence of (short) vertical fractures may facilitate creation of a network of fractures (Klint, 2005, personal communica-tion).
Site area Large sites
As an engineering safety factor, fracture zones should be designed to overlap in the plan view (Suthersan, 1999). This may be prohibitively expensive at large sites.
Disturbances
Previous excava-tions, abandoned wells, buried struc-tures
Underconsolidated layers may lead to vertical fractures. (Kidd, 2001). Other disturbances may influence propagation and/or cause short-circuiting (Schuring, 2002). Backfilled excavations may terminate fractures or alter path radically (EPA, 1994).
*: Ko refers to the coefficient of earth pressure at rest. OCR refers to overconsolidation ratio. Both are de-scribed in Appendix D: Discussion of directions of stress and overconsolidation.
Description of pneumatic fracturing technology 21
2.10 Conclusions Although environmental fracturing has been used to enhance remedial activities at contaminated sites since the 1980s in Canada and the US, and many rules-of-thumb have been established, there are still many parameters such as initiation pressure, propagation pressure, flow rates, etc. which are site-specific and must be determined by trial and error. A good knowledge of site geology is crucial for successful fracturing activities to target contami-nated areas and avoid excessive leak-off into permeable lenses, utility lines, etc. A top-down fracturing method in areas with natural vertical fractures seems to enhance the creation of fracture networks due to uplift and opening of existing vertical fractures in the overburden above the frac-tured interval without limiting the potential lateral extent of subsequent induced fractures. A number of reports and researchers claim that pneumatic fracturing, due to the lower viscosity of gas, creates a dense network of small-aperture fractures throughout the fracture interval and extend-ing meters away from the fracture well. Only a single case study provides concrete documentation of such a network in portions of a field site, however, if dense fracture networks can be induced, then pneumatic fracturing would be an attractive method to couple with remedial activities in low-permeability sites. There is a huge volume of environmental fracturing literature, however, the majority stems from commercial remediation projects, and typically scientific methodology and investigative detail is lacking. Consequently, induced fracture characteristics are poorly documented. Improved reporting of correlation between operator-controlled fracturing parameters, fracture characteristics and geo-logical site characteristics would further the state of knowledge regarding environmental fracturing enormously and facilitate transfer of experience to proposed sites.


23
CHAPTER 3
LOW-PERMEABILITY DEPOSITS IN DENMARK Knowledge of the characteristics of low-permeability deposits is valuable because it provides the environmental consultant with a fundamental understanding of their ‘typical’ characteristics. Based on these, intitial estimates of advective flow and diffusion rates and thus potential remediation times may be obtained for sites that may be poorly characterised. If a proposed fracturing site is similar to those in the literature, this may furthermore facilitate initial selection of operating parame-ters (injection pressure, rate, etc) at the new site.
3.1 Definition of low-permeability deposits Low-permeability deposits include silts, clays, and silty and clayey tills. While silt and clay depos-its may stem from a number of different geological time periods and depositional environments, the term till is only used in reference to poorly sorted (diamict) deposits of glacial origin. In the follow-ing chapter, the discussion will focus on clay till deposits alone due to their predominance in Dan-ish settings: clay till deposits with a thickness greater than one meter cover more than 40% of Denmark (Klint and Gravesen, 1999). Based on the extensive glaciation of Canada the northern US, see Figure 3.1, till deposits are also abundant here. The characteristics of Danish clay till deposits are assumed to be reasonably representative of silt and clay deposits, considering the overlap in porosities and hydraulic conductivities among them, see Table 3.1, as well as the variation in grain sizes of tills. The clay content of Danish basal tills (the most common till type in Denmark) ranges from a few percent to 35% (Houmark-Nielsen et al., 2005). In Denmark, the term moraine clay (moræneler) is used to describe till deposits, where the percent clay may vary from 12 to more than 30% clay (Larsen et al., 1995). In other countries, soil is only defined as a clay if it contains at least 35% clay-sized particles (Canadian Ministry of Natural Re-sources, undated). Thus, a direct translation of the Danish moræneler as moraine clay is a misno-

24 Low-permeability deposits in Denmark
mer: as stated, the term clay till (or clayey till) is a more accurate description of the Danish depos-its.
Figure 3.1: Extent of soils related to glaciers in Canada and the northern US (grey shaded area). Southern-most glaciation margin given by blue line. Distribution of fracturing sites in the US and Canada also shown (blue numbers refer to hydraulic fracturing sites, while red numbers refer to pneumatic fracturing sites). Table 3.1: Comparison of the range of porosity and hydraulic conductivity values for the low-permeability de-posits clay, silt and glacial till.
Sediment
Porosity Hydraulic conductivity (m/s)
Clay
0.35 - 0.50 (Cherry, 1989; Fetter, 1993) 10-9 – 10-5 (Cherry, 1989)
Silt
0.40 - 0.70 0.33 - 0.60
(Cherry, 1989) (Fetter, 1993)
4 . 10-13 – 10-9 (Cherry, 1989)
Clay till
0.10 - 0.20 0.3 - 0.42 0.23 -0.46
(Fetter, 1993) (Parker et al., 1994) (Danish values*)
10-12 – 10-6 5. 10-10 – 5.8 . 10-5 3. 10-11 – 1.3 . 10-4
(Cherry, 1989) (Parker et al., 1994) (Danish values*)
* References given in Table 3.2*
3.2 Typical clay till deposits Knowledge of the typical characteristics of a clay till provides a valuable assessment tool for an environmental consultant. Surprisingly, the authors were unable to find a summary table or similar description of a ‘typical’ Danish clay till. In fact, GEUS (Geological Survey of Denmark and Greenland) is presently collecting information for such a table. The 21 Danish sites, the locations of which are identified in Figure 3.2, and 1 Canadian site (Laidlaw, Sarnia, see Figure 3.1) were
Extent of glaciated area; # pneumatic sites / # hydraulic sites

Low-permeability deposits in Denmark 25
selected, either because the naturally-occurring fractures at the site have been described and/or environmental fracturing has taken place at the site (Slagelsesvej, Haslev, Vasby, and the Canadian site). An exception is the Dalumvej site, which is included because it provides the ‘base case’ characteristics for the modelling discussed in Chapter 4. Table 3.2* represents the authors’ attempt to create an overview table de-scribing the range of clay till charac-teristics, based on a literature search. Due to its size Table 3.2* is found in Appendix J: Comparison of till charac-
teristics at 21 Danish sites and 1 Cana-dian site. However, a summary of selected data is given in Table 3.2. In general, the matrix characteristics of the Danish sites have similar value ranges. Comparisons between Danish and Canadian sites reveal 2 exceptions: clay fraction and bulk hydraulic conductivity. These parameters and others of interest in terms of environmental fracturing are discussed separately in the following sections. Table 3.2: Summary table of Danish (basal) clay till characteristics. Data from the Canadian site (Laidlaw, Sarnia) are not represented here. A larger, more detailed table (including the Canadian site) is given in Ap-pendix J: Comparison of till characteristics at 21 Danish and 1 Canadian site.
Parameter
Range of values Average # of observations
% clay
6-31 27 27
foc
0.0015-0.0078 0.0029 15
ρb [g/cm3]
1.53 to 2.01 1.79 23
φ
0.2-0.42 0.30 25
Kb [m/s]
10-4 – 5 . 10-10 -
Redox boundary [m b.s.]
2 - 6.5 4.2 24
# fracture systems
1-5 3 18
Max. fracture depth [m b.s.]
2 - >9 > 5 19
Vertical fracture spacing at < ~5 m b.s. [cm]
0.5 - 667 83 (27)* 53 (45)*
Horizontal fracture spacing at < ~5 m b.s. [cm]
0.3 - 165 75 (15)* 52 (43)*
Vertical fracture spacing at > ~5 m b.s. [cm]
? - -
Horizontal fracture spacing at > ~5 m b.s. [cm]
? - -
Fracture aperture [μm]
31-3000 663 11
* The number stated in parentheses represents a more appropriate value/number, as a minor part of the observations with uncharacteristically large fracture spacings have been omitted.
1 Silstrup 2 Mammen 3 Grundfør 4 Estrup 5 Dalumvej 6 Ringe 7 Lillebæk 8 Fårdrup 9 Flakkebjerg 10 Slagelsevej 11 Haslev 12 Gedser Odde 13 Slæggerup 14 Vasby 15 Kamstrup 16 Havdrup 17 Højstrup 18 Rantzausgade19 Englandsvej 20 Avedøre 21 Gjorslev
1
2
3
4 56
7
89
1011
12
13 14
15 16
17
18 19
20 21
Figure 3.2: Location of Danish till sites described in Table 3.2*. Note that the locations of Estrup and Lillebæk are based on Klint (2001) and do not match possible locations found on KRAK (2005).

26 Low-permeability deposits in Denmark
3.2 .1 Clay fraction
The clay fraction in Danish clay tills is generally lower than in Canadian clay till where the percent clay is typically greater than 25% (Cherry, 1989). Consequently, the longevity and maximum radial extent of induced fractures may be less in Denmark compared to more clay-rich and thus cohesive Canadian sites. Figure 3.3 illustrates the clay content of selected Danish clay tills compared to se-lected Canadian tills.
Figure 3.3: Grain size distribution of four Ontario clay tills (based on 400 samples) with selected Danish clay till site superimposed. Canadian till information from Flint (1971). The letters refer to the dominate source of particles in the tills: IM, igneous and metamorphic; LD, limestone and dolostone; CS: till containing mainly claystone and siltstone; CL: mainly clay and silt derived from lacustrian sediments. Texture of Danish sites from Lindhardt et al., 2001)
3.2.2 Bulk hydraulic conductivity
The range of bulk hydraulic conductivity (Kb) values measured in Danish clay tills (see Table 3.2) is frequently at the high end of the range of typical values listed in Table 3.1. This may be due to the generally lower clay fraction in Danish clay tills. It may also be due to the depth of sampling at the Danish sites, which is typically less than 5 m, and thus, in the fractured, weathered zone of the profile. Bulk hydraulic conductivity values for the unweathered clay at the Laidlaw site are 1 to 3 orders of magnitude smaller than in the weathered till (Cherry, 1989; D’Astous et al., 1989). Simi-larly, in a summary article discussing overburden characteristics, Jacobs et al. (2001) states that the hydraulic conductivities of basal clay tills may vary from 10-11 m/s in laboratory tests to 10-6-10-7 m/s in field studies where more permeable sand lenses or fractures are intersected. As measurement methods are generally not stated, it is difficult to evaluate whether the discrepancy between Kb values signify a general trend of higher conductivity in Danish tills or simply alternative estimation methods. If the hydraulic conductivities in Denmark are, in fact, generally at the high end of the scale, then the enhancement in permeability, and/or removal rates, etc. attributable to environmental fracturing may be less pronounced compared to sites with low K values. Bures (1998) states that the hydraulic
Fårdrup
Estrup
Silstrup
Slæggerup

Low-permeability deposits in Denmark 27
conductivity at a site ought to be no more than 10-6 m/s to achieve a significant enough improve-ment in K relative to the cost of fracturing.
3.2.3 Presence of sand stringers and lenses
Presence of sand stringers or lenses is a characteristic of many of the clay till deposits described in Table 3.2*. For example, at the Flakkebjerg and Haslev sites thin shear planes/bands with sand/silt or sand/gravel were observed throughout the till with spacings of 20-30 cm (Klint, 2001). At the Dalumvej and Silstrup sites, larger sand lenses were observed. While these features are frequently observed in the field and may be noted in borelogs, they often become omitted from geologic pro-files and general site descriptions. This is unfortunate, as the permeable stringers and lenses act as large fractures where advective transport and bacterially mediated reactions may take place. Deposits with sand stringers and lenses are generally to be avoided during environmental fracturing because the fracturing process cannot significantly increase the hydraulic conductivity of these features (Bures, 1998). Furthermore, these features may ‘divert’ the injection fluid along their paths, avoiding the low-permeability deposits intended for fracturing (Schuring, 2002). Sand stringers and lenses are commonly found in flow and melt-out till deposits (and/or end mo-raine and dead-ice landscapes). These deposits often overlie basal till deposits, which are more homogeneous (Marsh and Dozier, 1981), and thus more suited for environmental fracturing (Klint, 2005, personal communication). Consequently, the presence of sand lenses and stringers in the upper meters of a till deposit do not necessarily rule against the site’s suitability to undergo fractur-ing, but warrant an investigation the deeper geology. The environmental consultant may conduct a very simple preliminary screening of a proposed fracturing clay till site by localising the site on a geomorphological map and thus evaluating whether the till is basal or not.
3.2.4 Presence of bio-pores
Root- and wormholes are also typical features in low-permeability deposits. At shallow depths (generally less than 2 m b.s.) the number of so-called bio-pores may be high: 100 per m2 at Haslev (Jakobsen and Klint, 1999), 400 per m2 at Silstrup, and 1900 per m2 at Slæggerup (Lindhardt et al., 2001). Their diameters may be significant, from 2-3 to 5-6 mm (Jakobsen and Klint, 1999; McKay et al, 1999) relative to the apertures of natural fractures. The interconnectivity and wide aperture of bio-pores in the upper 1-2 meters of most low-permeability deposits makes fracturing superfluous in this zone. Furthermore, environmental fracturing at depths less than 3 m b.s. is likely to increase the already high interconnectivity and may result in daylighting.
3.2.5 Natural fractures - occurrence and types
Many low-permeability soils are naturally extensively fractured (Klint 2001; Klint et al., 2001; Lindhardt et al., 2001), see Table 3.2*. Environmental fracturing in a remedial context may thus

28 Low-permeability deposits in Denmark
appear superfluous at many sites. Typically, however, only a small fraction of the natural fractures are hydraulically active. Klint (2001) states that only 10% of observed fractures were hydraulically active at a number of the Danish sites investigated. O’Hara et al. (2000) observed that DNAPL flowed through only 5 to 15 % of the visible, oxidation-stained fractures at the Canadian Laidlaw site, while Jørgensen et al. (2003) via dye tracer tests estimated that 13 to 23% of the visible frac-tures at the Havdrup site are hydraulically active. Application of environmental fracturing at such sites lifts the entire overburden above the fracture depth resulting in a re-arrangement of the over-burden structures, an opening of existing fractures, and ideally, improved interconnectivity (Klint, 2005, personal communication,). The environmental consultant is thus interested in assessing the likelihood of whether a particular site is fractured and what the characteristics of typical fractures may be. Determining whether a (contaminated) low-permeability clay till site is naturally fractured or not, is facilitated by an understanding how natural fractures have been created in Danish low-permeability clay till deposits. Appendix K: Natural fractures and depositional environments of tills provides a more thorough treatment of this topic. Natural fractures in clay till may be divided into 3 main groups (Klint, 2001): 1) glacial-tectonic fractures; 2) neotectonic fractures; and 3) contraction fractures. Contraction fractures may further be classified as unsystematic, while glacial- and neotectonic frac-tures are systematic, meaning that they may be grouped according to their orientation. The general descriptions of the various types given below are based on Klint et al. (2001) and/or Klint (2004a) unless another reference is given, while specific examples are taken from the till literature study (references may be seen in Table 3.2*).
Glacial-tectonic fractures
Glacial-tectonic fractures are formed in glacially-deposited sediments by the same glacier respon-sible for their deposition.
Proglacial and glacial margin-tectonic fractures
Proglacial and glacial margin landscapes (end moraines and dead-ice landscapes) are poorly suited to environmental fracturing, as they are associated with heterogeneous sediments (flow and melt-out tills), which may also be faulted, etc. Consequently, fractures formed in these deposits tend to be more random compared to subglacial fractures (described below) making it difficult to estimate the degree of natural fracturing. This, in turn, makes it difficult to both anticipate the extent and form of induced fractures as well as anticipate improvements via environmental fracturing when the ‘pre-fracturing conditions’ are typically heterogeneous over small distances. Furthermore, the native hydraulic conductivity may be relatively high in proglacial and glacial margin landscapes due to the heterogeneous nature of these glacial deposits. The Silstrup site is an example of a pro-glacial/glacial margin landscape. The natural fractures at this site are poorly developed (only 1 or 2 systems, compared to 3 to 5 systems at most other sites) and shallow (< 4 m). The fractures’ poor

Low-permeability deposits in Denmark 29
development at this site is further compounded by the fact that the till here is poorly drained (dis-cussed below).
Subglacial-tectonic fractures
Subglacial-tectonic fractures arise from the glacier load and movement over a foundation of basal till. Thus, their orientation is systematically related to the directions of ice movement. The majority of the sites listed in Table 3.2* consist of sub-glacial deposits, many of them lodgement tills. Subglacial-tectonic fractures may be further divided into 4 groups: sub-horizontal shear, conjugating (vertical) shear, (vertical) exten-sion and hydro-fractures. Hydro-fractures are rare, and thus not discussed further. The other three types of sub-glacial-tectonic frac-tures are shown in Figure 3.4. The spacing of these fractures varies with depth and between deposits, but is always wider than contrac-tion fractures (discussed below). The presence of more than two systems of vertical fractures at a site is attributable to more than one glacial advance or to neo-tectonic activity in the region.
Depth and spacing of vertical glacial-tectonic fractures
There appears to be a connection between the type of sediment underlying a till and the depth and intensity of vertical glacial-tectonic fractures in the till. The size and intensity of fractures in tills overlying permeable deposits (well-drained tills) are generally greater than those of fractures in tills overlying low-permeability deposits (poorly drained tills). Examples of well-drained sites in Table 3.2* include Kamstrup and Haslev, with fractures extending to below 7 and 9 m, respectively. Sil-strup, on the other hand, is an example of the fracture development associated with poorly a drained site: it is underlain by a heavy marine clay.
When the till thickness becomes large, the drainage function of underlying permeable deposits becomes negligible. This appears to be confirmed by Canadian field studies where the maximum depth of observed fractures does not generally exceed 10 m in thick (20 to 50 m thick) clay depos-its in the Sarnia (Ontario) and the Montreal areas (Cherry, 1989). At the well-drained Duffins Creek site, also in Canada, conjugating shear fractures extending beyond 12 m below surface were observed (Klint, 2001). It must be noted that the previous presence of permafrost and/or the supply of a large amount of melt-water to an underlying deposit that might otherwise be deemed of high permeability might
Figure 3.4: Three (of four) types of subglacial-tectonic fractures. The vertical shear fractures usually appear as conjugated sets. Compli-ments of K.E.S. Klint.

30 Low-permeability deposits in Denmark
have lowered its permeability at the time of till deposition. Thus, determination of the deposits underlying a till is not a foolproof method for evaluating whether the overlying till might be ex-pected to be fractured or not. But generally, a poorly drained till is also poorly consolidated and poorly fractured. The relationship between vertical fracture depth, spacing and drainage conditions for 12 (of the 21) Danish sites is illustrated in Figure 3.5. Generally, a vertical fracture spacing of approximately 20 cm is observed until 4 m b.s., unless the till is poorly drained. Below 4 m, fracture spacing widens to approximately 1 m at 8.5 m b.s. in well-drained tills. For an averagely drained till, fracture spac-ing increases to 1.5 m already at 7 m b.s. Note that the fracture spacings stated in Figure 3.5 repre-sent all vertical fractures observed at the given sites. Vertical glacial-tectonic (extension or shear) fracture spacing is observed to vary from 3-35 cm (until at least 5 m b.s.) at the Avedøre site, to 14-667 cm (until 5 m b.s.) at the Flakkebjerg site.
Figure 3.5: Fracture distribution at 12 of the previously presented Danish clay till sites (two sets of data from the Haslev site are included). The stated fracture spacing is cumulative, which means that it represents the average distance between all the fractures, as if they were lined up in one system of parallel fractures. The relationship between fracture depth and drainage conditions is indicated via the line legend. From Klint (2001).

Low-permeability deposits in Denmark 31
Depth and spacing of horizontal subglacial-tectonic fractures
As subhorizontal shear fractures are most often created along with the till in the deforming bed, these are expected to be found throughout basal tills regardless of drainage conditions. Their spac-ing will be relatively constant throughout, even increasing toward the bottom, if the underlying deposit is sand* (Klint, personal communication, 2005). They may furthermore have significant unbroken trace lengths (> 6 m (Klint and Jakobsen, 1999)). The reported spacings of subhorizontal shear fractures vary from 0.4-3 cm (at 1.6-3.5 m b.s.) at the Rantzausgade site, to 80 cm (until at least 9 m b.s.) at the Haslev site.
Neo-tectonic fractures
Neo-tectonic fractures may be found in all types of deposits, as they are formed in connection with displacements/shifts in the Earth’s crust. They are thus primarily located over older fault zones that have been reactivated by land heaves caused by glacier recession (melting), more general plate-tectonic movement, and/or still active salt horsts. Usually, it is difficult to conclusively classify a fracture as neo-tectonic, unless it traverses both glacial and younger (postglacial) sediments. They are thought to be rare (in Denmark), but are poorly researched. They must not be neglected, however, as they traverse whole sediment packs to great depth (> 20 m (Klint, 2001) and are thus of primary importance for transport of various sub-stances to groundwater. Examples of tetonic regions are the Carlsberg Fault under Copenhagen (relevant for the Avedøre, Englandsvej, and Flakkebjerg sites) and the Tornquist zone that extends across northern Jutland through the Øresund Sound between Denmark and Sweden (Klint, 2001).
Contraction fractures
Contraction fractures may be expected in all cohesive deposits, as they arise due to climatic change which results in desiccation (i.e. dry-out) and/or freeze-thaw processes in the subsurface. The frac-tures are thus irregularly oriented vertical fractures or a dense network of small irregular fractures, respectively. In the upper 2 to 3 m b.s., the fractures may be so frequent that the till texture be-comes fissile (Klint, 2001). In practice, it may be difficult to distinguish between the formation processes, hence the general name, contraction fractures.
Depth correlation to redox boundary
The influence of climactic changes, and thus the presence of contraction fractures, is negligible beyond a certain depth. Typically, the number of contraction fractures decreases with depth†. The maximum depth of penetration of contraction fractures usually coincides with the depth of the re-dox boundary. The redox boundary is typically found at depths of 4-6 m b.s. in Danish till plains, see Figure 3.6, and deeper in elevated areas (redox boundaries observed for the individual sites included in the till literature study are given in Table 3.2*). The depth of the redox boundary typi-
* Shear is conditioned by the presence larger grained sediments. † Desiccation fractures have been observed to decrease log-normally with depth (McKay et al., 1993c).

32 Low-permeability deposits in Denmark
cally also coincides with the lowest depth of groundwater table occurring in summer. The ex-tremely high number of small fractures in the oxidized zone (i.e. spacings of 1-4 cm at 2.5-4 m b.s.) may present a risk of daylighting during environmental fracturing, especially at shallow depths. The expectation that contraction fractures may be found in all cohesive deposits to a depth coincid-ing with the redox boundary is supported by the following evidence: 1) the ubiquitous presence of near-surface fractures in Danish tills (with the exception of under saturated conditions; Klint, 2001); 2) the ubiquitous presence of near-surface fractures in Canadian clay tills (Cherry, 1989); and 3) hydraulic conductivity values in the shallow, weathered zone which are typically 1 to 3 or 2 to 3 orders of magnitude greater than in the unweathered zone (Cherry, 1989; D’Astous et al., 1988). The clear connection between contraction fracture penetration depth and the depth of the redox boundary gives rise to the rule-of-thumb that any fractures present under the redox boundary are glacial- or neo-tectonic in origin. The orientation and characteristics of natural fracture types found in basal tills are summarised in Table 3.3.
Figure 3.6: Geological logs for 13 Danish till localities from Klint (2001). Observed minimum and maximum depth of the redox boundary is marked by the broken lines.

Low-permeability deposits in Denmark 33
Table 3.3: Orientation, characteristics and primary depository locations of natural fractures. Based on Klint (2004) and Klint et al. (2001). Additional information in Appendix K: Natural fractures and depositional envi-ronments of tills.
Fracture type
Orientation Characteristics Deposit type
Subh
oriz
onta
l she
ar
- Sub-horisontal
- Dip slightly (0-20◦) toward or away from the direction of ice movement
- > 20 m long
- Undulating surfaces w/ stripes
- Sand- or silt-filled
- Connect vertical fractures
- Found in almost all lodgement tills
- Present throughout till
- Increased frequency toward bottom of till
- Hydraulic properties poorly examined
Basal (lodgement)
tills
Vert
ical
shea
r
- Vertical / subvertical
- 60-90◦ dip
- Oriented perpendicu larly to the direction of ice movement
- Sets of primary and secondary conjugated fractures (with acute intersection angle of 20◦)
- Planar form
- Can traverse till deposits of thicknesses exceeding 10 m if underlain by well-drained deposits
Basal tills
Subg
laci
al-t
ecto
nic
Exte
nsio
n
- Vertical
- 80-90◦ dip
- Oriented parallel to direction of ice move ment
- Are of primary importance for transport of various substances to groundwater
Basal tills
Free
ze-th
aw
- Subhorisontal
- > 0,5 cm spacing
- Common/ever-present above water table
- Decreased frequency over depth
- Form zones with typical horizontal spacing of 0,5 cm (unsaturated in summer, saturated in winter – in this period basis for large lateral flow)
Cohesive deposits
Con
trac
tion
Des
icca
tion
- Vertical
- Irregular polygons
- Common/ever-present above water table
- Decreased frequency over depth
- Found only in fine-grained sediments (do not cut through larger sand layers/lenses
Cohesive fine-grained
deposits
Neo
-tec
toni
c
- Vertical/subvertical
- Systematic
- Rare (poorly researched)
- Traverse whole sediment packs to great depth (>10 - >100 m)
- Are of primary importance for transport of various substances to groundwater
- Found at steep faults
All
3.2.6 Fractures at Canadian sites
The Laidlaw site may not be typical of Canadian basal clay tills as there is some discussion whether it is a glaciolacustrian (water-lain), melt-out, or lodgement till. Furthermore, there is only

34 Low-permeability deposits in Denmark
one type of fracture (contraction fractures) observed at the site (Klint, 1996). The natural fractures at four other Canadian sites near Toronto, Ontario (Rouge River 1 and 2, Duf-fins Creek, and Scarborough Bluffs) have been documented (Klint, 2001), but insufficient data was available to include them in Table 3.2*. However, the Duffins Creek and Scarborough Bluffs sites are basal till sites, while at the Rouge River 1 and 2 sites basal tills are found together with clay and silt deposits. At all 4 sites systematic fractures (horizontal shear, vertical conjugating shear, and vertical extension fractures) and unsystematic contraction fractures similar to those observed in Denmark were documented. Furthermore, the maximum depth of vertical factures also appears to depend on drainage conditions: for example, deep vertical fractures to 12 m b.s. observed at the Duffins Creek site. The similarity between natural fracture systems and orientations relative to glacial advances observed at Canadian and Danish sites suggests that Canadian experience with environmental fracturing may be applicable to Danish sites. By extension, similar glacial activity and deposits in Canada and the northern US (depicted in Figure 3.1) may permit application of North American experiences with environmental fracturing to Denmark.
3.3 Conclusions
Typical Danish clay tills of significant thickness appear to be basal tills. Consequently, the frac-tures ‘typically’ encountered in a Danish clay till more than 2 meters thick are the following:
• Subglacial-tectonic fractures as seen in Figure 3.4: o a system of horizontal/subhorizontal shear fractures that may have significant un-
broken trace lengths (> 6 m (Klint and Jakobsen, 1999))and are present throughout the till deposit.
o one to two systems of vertical/subvertical fractures oriented perpendicular (conju-gating shear fractures) or parallel (extension fractures) to the direction of ice movement. When the till is well drained, these vertical fractures may be quite ex-tensive vertically, for example greater than 9 m at Haslev (Jakobsen and Klint, 1999). The number and spacing of vertical fractures tends to decrease with depth. It is probable that vertical fractures may extend to the bottom of till units at well-drained sites with moderate till thickness.
o The spacing of the glacialtectonic fractures is systematic, but variable over depth and between sites, as evident from Table 3.2*. The presence of more than two sys-tems of vertical fractures at a site is attributable to more than one glacial advance or neo-tectonic activity in the region. Neo-tectonic regions are not considered typi-cal sites.
• Contraction fractures (desiccation and freeze-thaw) fractures are present in all (unsatu-rated) tills and other cohesive deposits to a depth coinciding with the redox boundary.
The vertical fracture spacing of approximately 20 cm until 4 m b.s. deduced from Figure 3.5 is confirmed by the data presented in Table 3.2, where an average vertical fracture spacing is 27 cm until 5 m b.s. An average horizontal fracture spacing of 15 cm until approximately 5 m b.s. is also

Low-permeability deposits in Denmark 35
determined via data from the 21 reviewed sites. 10-23% of the fractures are believed to be hydrau-lically active naturally (Klint, 2001; Jørgensen et al, 2003). At greater depth, natural fractures ap-pear to be few (subhorizontal shear fractures only). If a site in question has matrix and geomorphic characteristics similar to one of these sites it is reasonable to expect a similar fracture spacing over depth. If sand stringers/lenses are present, it will probably be in the upper meters of the deposit, reflecting that the basal till is overlain by a flow till (Klint, 2005, personal communication), and thus making fracturing inexpedient at depths lower than 2-3 m. The typical density of bio-pores in the upper meter further compounds the natural permeability in this zone. Fracturing at depths exceeding 3 m appears promising, due to the typically extensive existing network, which may be opened and con-nected (Klint, 2005, personal communication,). Natural fracture systems in Denmark and 4 Canadian sites near Toronto, Ontario are similar both in terms of number of systems and orientations of fracture systems relative to glacial advances and vertical fracture depth and drainage conditions. This suggests that Canadian experience with envi-ronmental fracturing may be applicable to Danish sites. By extension, similar glacial activity and deposits in Canada and the northern US may permit application of North American experiences with environmental fracturing to Denmark.

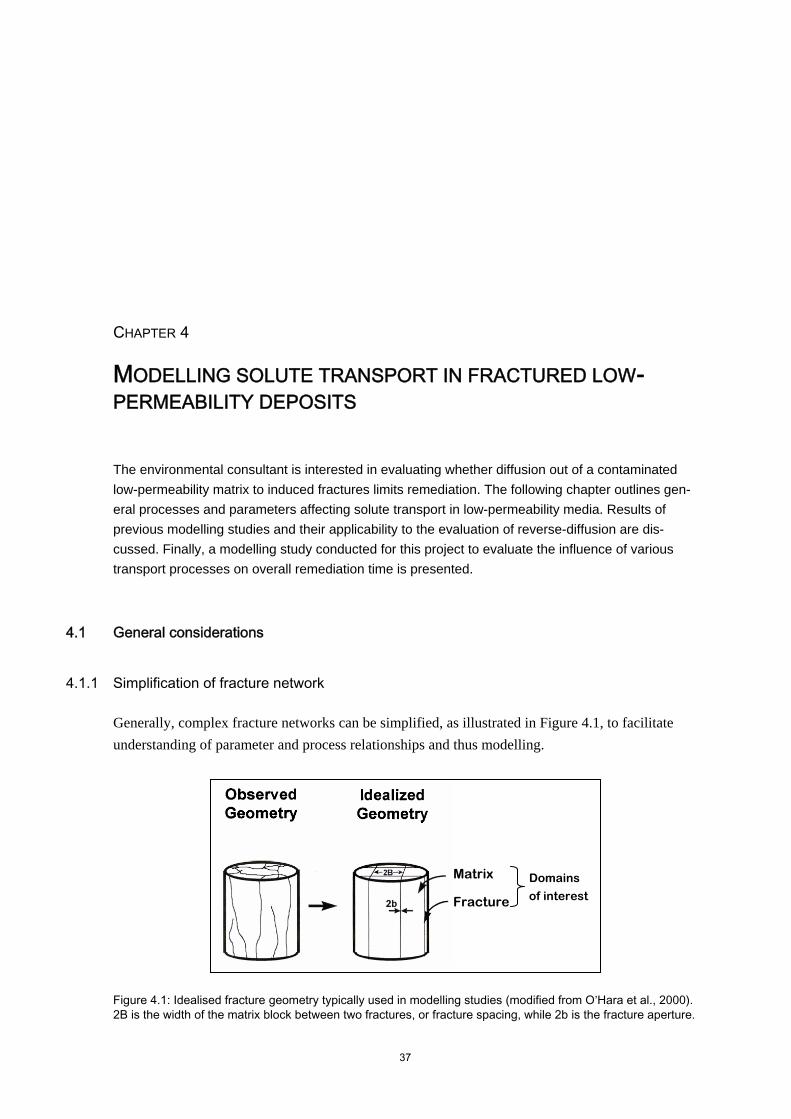
37
CHAPTER 4
MODELLING SOLUTE TRANSPORT IN FRACTURED LOW-PERMEABILITY DEPOSITS The environmental consultant is interested in evaluating whether diffusion out of a contaminated low-permeability matrix to induced fractures limits remediation. The following chapter outlines gen-eral processes and parameters affecting solute transport in low-permeability media. Results of previous modelling studies and their applicability to the evaluation of reverse-diffusion are dis-cussed. Finally, a modelling study conducted for this project to evaluate the influence of various transport processes on overall remediation time is presented.
4.1 General considerations
4.1.1 Simplification of fracture network
Generally, complex fracture networks can be simplified, as illustrated in Figure 4.1, to facilitate understanding of parameter and process relationships and thus modelling.
Figure 4.1: Idealised fracture geometry typically used in modelling studies (modified from O’Hara et al., 2000). 2B is the width of the matrix block between two fractures, or fracture spacing, while 2b is the fracture aperture.
Matrix
Fracture
Domains
of interest

38 Modelling solute transport in fractured low-permeability deposits
4.1.2 Transport processes and parameters to consider
The processes controlling transport of dissolved solutes in fractured low-permeability geologic material, and thus of interest in modelling context, are: 1) advection in the fractures; 2) (aqueous) diffusion in the matrix (to and from fractures); and 3) attenuation processes including sorption, precipitation, and degradation in both the fractures and matrix (McKay et al., 1993a). The general advection-dispersion equation accounts for all of these processes, and can be adapted to describe transport in a particular domain of interest (Equation 4.1).
nattenuatioadvectiondiffusionsorption
CrxCv
xCD
tCR
fme )(
2
2−
∂∂
⋅−∂
∂⋅=
∂∂⋅
where R = a retardation coeffient [-],
De = an effective diffusion coeffient [L2/T] (homogeneous and isotropic diffusion assumed (Kjeldsen, 1996); De = τ·Dw, where τ is tortuosity and Dw is the aque-ous diffusion coefficient),
v = an advective velocity [L/T], r(C) = any type of reaction (e.g. 1st order degradation: r(C) = λ·C, where λ = a 1st
order degradation rate [T-1]), and C(x,t) = the resultant contaminant concentration at position x along the flow-line and
time t [M/V].
Parameter overview
The components of Equation 4.1 may be broken down into many interrelated sub-parameters. Fig-ure 4.2 provides an illustration of this, and thus a conceptualisation of a sensitivity analysis, where the parameters deemed most influential to a particular process are listed along the right side, given the assumptions stated in the figure text. A detailed discussion of the theory behind the figure, ex-planation of the terms, and their typical value ranges are found in Appendix L: Theory of transport in fractured, low- permeability deposits. Note that R has been incorporated in De in the advection-dispersion equation stated in Figure 4.2, thus yielding an apparent effective diffusion coefficient, De
*. The influential parameters identified in Figure 4.2 are listed in Table 4.1. The subscript b is used to denote the fracture, for example φb for fracture porosity. This subscript was used to facilitate a clear understanding of terms discussed in this section and the subsequent MATLAB modelling, as f (the logical choice and thus that typically used in the literature to denote fractures) was not accepted in the MATLAB scripts. The terms 2b and 2B are generally used to denote fracture aperture and frac-ture spacing respectively.
(4.1)

Modelling solute transport in fractured low-permeability deposits 39
Figure 4.2: Illustration of the processes and parameters of interest in the domains of a fractured, low perme-ability medium. The following assumptions are made in the figure: 1) the hydraulic gradient (i) is constant; 2) the reaction term for a particular compound is given by first order degradation the rate of which, λ, is assumed constant; and 3) retardation of solutes in the fractures (i.e. due to sorption on to fracture walls etc.) is assumed negligible. An expression for the contaminant concentration in the matrix, Cm, is not given, but it is known that it will be dependent on Cb, as the latter will influence the amount of contaminant diffusing out of the matrix at the fracture-matrix interface, and thus the contaminant concentration distribution in the matrix. Furthermore, the hydraulic conductivity of the fractures, Kb, is stated as being dependent on only fracture aperture. This is due to the fact that its other defining parameters ρ and μ are the density and viscosity of the fluid (water) flow-ing through the fractures, and thus not of interest.
xm = 2B
ρs
φm
p
foc
pmφτ =
λ
Diffusion in matrix
RDD w
eτ
=*
dm
b KRφρ
+= 1
ococd fKK ⋅=
( )msb φρρ −= 1
Koc
2
2
m
m
xC
∂∂
Reaction in matrix and fractures
CxC
vxC
DtC
b
b
m
me ⋅−
∂∂⋅−
∂
∂⋅=
∂∂
λ2
2*
2
b bb
b b b
m mCV A x
= =⋅
Cm Sw
Advection in fractures
iK
vb
b ⋅−=φ
( )2212
bgKb μρ
=
2b
xb
Bb
b 22
=φ
b
b
xC∂∂
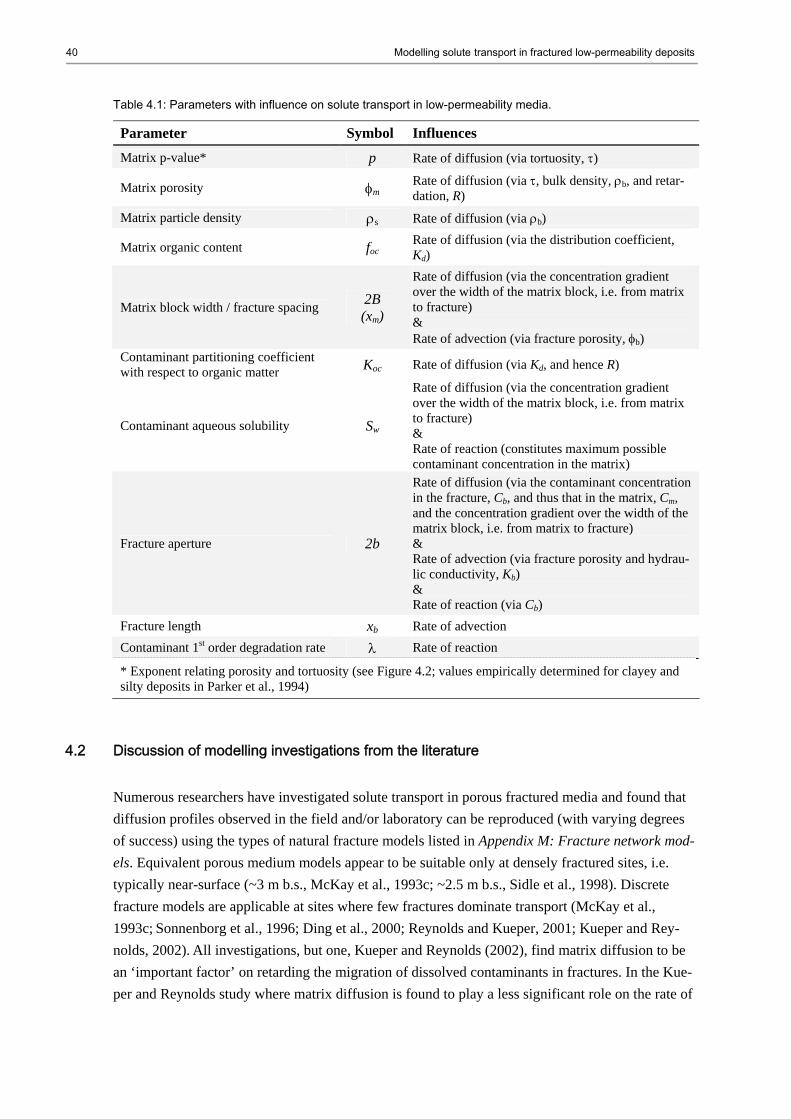
40 Modelling solute transport in fractured low-permeability deposits
Table 4.1: Parameters with influence on solute transport in low-permeability media.
Parameter
Symbol Influences
Matrix p-value* p
Rate of diffusion (via tortuosity, τ)
Matrix porosity φm
Rate of diffusion (via τ, bulk density, ρb, and retar-dation, R)
Matrix particle density ρs
Rate of diffusion (via ρb)
Matrix organic content foc
Rate of diffusion (via the distribution coefficient, Kd)
Matrix block width / fracture spacing 2B (xm)
Rate of diffusion (via the concentration gradient over the width of the matrix block, i.e. from matrix to fracture) & Rate of advection (via fracture porosity, φb)
Contaminant partitioning coefficient with respect to organic matter Koc Rate of diffusion (via Kd, and hence R)
Contaminant aqueous solubility Sw
Rate of diffusion (via the concentration gradient over the width of the matrix block, i.e. from matrix to fracture) & Rate of reaction (constitutes maximum possible contaminant concentration in the matrix)
Fracture aperture 2b
Rate of diffusion (via the contaminant concentration in the fracture, Cb, and thus that in the matrix, Cm, and the concentration gradient over the width of the matrix block, i.e. from matrix to fracture) & Rate of advection (via fracture porosity and hydrau-lic conductivity, Kb) & Rate of reaction (via Cb)
Fracture length xb
Rate of advection
Contaminant 1st order degradation rate λ
Rate of reaction
* Exponent relating porosity and tortuosity (see Figure 4.2; values empirically determined for clayey and silty deposits in Parker et al., 1994)
4.2 Discussion of modelling investigations from the literature Numerous researchers have investigated solute transport in porous fractured media and found that diffusion profiles observed in the field and/or laboratory can be reproduced (with varying degrees of success) using the types of natural fracture models listed in Appendix M: Fracture network mod-els. Equivalent porous medium models appear to be suitable only at densely fractured sites, i.e. typically near-surface (~3 m b.s., McKay et al., 1993c; ~2.5 m b.s., Sidle et al., 1998). Discrete fracture models are applicable at sites where few fractures dominate transport (McKay et al., 1993c; Sonnenborg et al., 1996; Ding et al., 2000; Reynolds and Kueper, 2001; Kueper and Rey-nolds, 2002). All investigations, but one, Kueper and Reynolds (2002), find matrix diffusion to be an ‘important factor’ on retarding the migration of dissolved contaminants in fractures. In the Kue-per and Reynolds study where matrix diffusion is found to play a less significant role on the rate of

Modelling solute transport in fractured low-permeability deposits 41
contaminant migration (perhaps due to the boundary conditions selected), diffusion is nonetheless found to be significant in the context of remediation times. A selection of the studies is briefly discussed below, as they provide a type of sensitivity analysis of parameters influencing transport and of the relative importance of advective and diffusive trans-port in fractured low-permeability deposits. Ball et al. (1997) were able to obtain good agreement between concentration profiles for PCE and TCE measured from cores taken from a low-permeability medium at the Dover Air Force Base (Delaware, USA) and profiles simulated using a simple 2-layer aquitard diffusion model. As the study did not include fractures, diffusion out of the low-permeability matrix, into the aqui-tard/aquifer was modelled. The model was thus used to investigate site clean-up times assuming a near-zero contaminant concentration at the aquifer/aquitard interface. Ball et al. hereby observed: 1) slow removal from the more-strongly sorbing layer; 2) ‘dramatically’ decreasing removal rates over time due to diffusion from the less-sorbing layer into the more-sorbing layer; and 3) subse-quent slow removal from the more sorbing layer. Since the conceptual model in the study did not include fractures, solute and matrix parameters affecting retardation (i.e. Koc, foc, ρs, and φ, see Fig-ure 4.2 and Table 4.1) became the dominant parameters affecting estimated remediation times. Parker et al. (1994) used a Fickian diffusion model to evaluate sensitivity of DNAPL ‘disappear-ance’ rates from fractures. The modelling exercise involved dissolution of DNAPLs in fractures of various apertures and subsequent diffusion into porous matrices. The sensitivity of the so called ‘immisible-phase dissapearence time’ from a specified-aperture fracture was evaluated for 4 DNAPLs (and thus 4 solubilities, Sw, and retardation factors, R) as well as for a typical range of organic contents (foc) and matrix porosities (φ, which also influence R). Parker et al. (1997) ex-tended the previous work to consider 2 types of networks: parallel plate fractures, and 3-dimensional networks of orthogonal fractures. The investigations of disappearance times by Parker et al. (1994; 1997) provide an interesting anal-ogy to investigations of remediation times. Parameters which increase the time for complete DNAPL disappearance from fractures might also be expected to play a significant role on ‘reverse’ diffusion times from the matrix to fractures and thus, on remediation times. However, as results from Parket et al. (1994; 1997) are presented as the ‘equivalent fracture aperture’ where all DNAPL will disappear, it is difficult to isolate the influence of individual parameters. Furthermore, diffusion into a low-permeability matrix from a fracture (filled with DNAPL) or other source zone must be expected to be faster than reverse-diffusion out of the matrix to another (induced) fracture, due to the higher initial contaminant concentration gradients present in the first scenario, assuming initial free-phase contamination in the fractures. Selected results of the two Parker studies are presented in Table 4.2 and 4.3. Table 4.2 indicates that an order of magnitude decrease in the organic content of the matrix results in a 1 order of mag-nitude increase in PCE disappearance time, while an order of magnitude decrease in matrix poros-

42 Modelling solute transport in fractured low-permeability deposits
ity results in an increased disappearance time of almost 2 orders of magnitude (100 days to 9855 days). It should be noted, however, that the porosity range (0.08-0.54) is outside the normal range for a basal till (0.1 to 0.4; see later discussion in the modelling section of the chapter). Table 4.2 and 4.3 illustrate that the most significant effects are observed when fracture aperture and spacing (matrix block dimension) are varied. An increase in fracture aperture of 1 order of magni-tude causes a 2 order of magnitude increase in disappearance times. This is explained by the wider fracture containing more PCE, and thus it takes longer for the DNAPL to dissolve, relative to a narrow fracture. An increase in spacing of 2 orders of magnitude results in 4 or almost 4 orders of magnitude increase in disappearance times in a parallel plate and 3D network respectively, as the increase of fracture spacing has the effect of increasing the length of the diffusion pathway to the centre of the matrix. Conceptually, if remediation times are considered the reverse of the disappearance times of Parker et al. (1994; 1997), then fracture aperture and fracture spacing are anticipated to be dominant pa-rameters affecting remediation times at fractured low-permeability sites. Table 4.2: Summary of selected modelling results of disappearance times due to PCE dissolution and subse-quent disappearance from single fractures of various apertures into a porous matrix (based on Parker et al.,1994).
Aperture (2b) [mm]
Retardation (R)
foc
Matrix porosity (φm)
Disappearance times (tD) [days]
0.01 (10 μm)
1 - - ∼540
0.1 (100 μm)
1 - - ∼18250
0.01
>1 0 - ∼320
0.01
>1 0.001 - ∼100
0.01
>1 0.01 - ∼9
0.01
1 - ∼0.08 ∼9855
0.01
1 - ∼0.54 ∼100 Table 4.3: Summary of selected modelling results of disappearance times (tD) due to PCE dissolution and subsequent disappearance from a 1-D parallel plate network (similar to that presented in Table 4.2) and 3-D orthogonal plate network (modified from Parker et al., 1997).
Fracture porosity (φb)*
Retarda-tion (R)
foc
Matrix porosity (φm)
Matrix block dimension (2B)
[cm]
tD 1-D finite distance**
[days]
tD 3-D cube
[days]
10-4
>1 0.01 0.35 1 0.15 0.02
10-4
>1 0.01 0.35 10 15.0 1.8
10-4
>1 0.01 0.35 100 1500 180
* Fracture porosity (φf) describes the relationship between fracture aperture and fracture spacing for an idealized network. The greater the aperture, the smaller the number of fractures per meter for a selected φf. When φf = 10-4 , a fracture aperture of about 0.01 mm results in a fracture spacing of about 10 and 50 frac-tures/m in a 1-D parallel plate network and a 3-D orthogonal parallel plate network, respectively. ** Similar to that presented in Table 4.2.
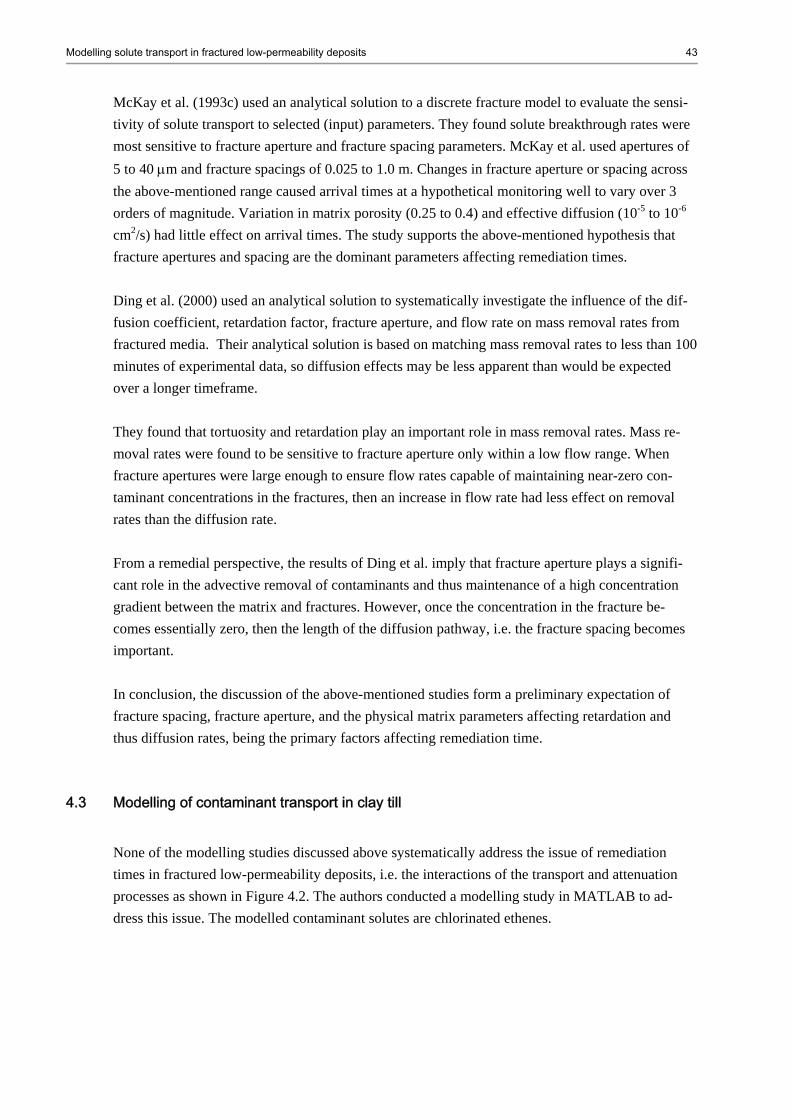
Modelling solute transport in fractured low-permeability deposits 43
McKay et al. (1993c) used an analytical solution to a discrete fracture model to evaluate the sensi-tivity of solute transport to selected (input) parameters. They found solute breakthrough rates were most sensitive to fracture aperture and fracture spacing parameters. McKay et al. used apertures of 5 to 40 μm and fracture spacings of 0.025 to 1.0 m. Changes in fracture aperture or spacing across the above-mentioned range caused arrival times at a hypothetical monitoring well to vary over 3 orders of magnitude. Variation in matrix porosity (0.25 to 0.4) and effective diffusion (10-5 to 10-6 cm2/s) had little effect on arrival times. The study supports the above-mentioned hypothesis that fracture apertures and spacing are the dominant parameters affecting remediation times. Ding et al. (2000) used an analytical solution to systematically investigate the influence of the dif-fusion coefficient, retardation factor, fracture aperture, and flow rate on mass removal rates from fractured media. Their analytical solution is based on matching mass removal rates to less than 100 minutes of experimental data, so diffusion effects may be less apparent than would be expected over a longer timeframe. They found that tortuosity and retardation play an important role in mass removal rates. Mass re-moval rates were found to be sensitive to fracture aperture only within a low flow range. When fracture apertures were large enough to ensure flow rates capable of maintaining near-zero con-taminant concentrations in the fractures, then an increase in flow rate had less effect on removal rates than the diffusion rate. From a remedial perspective, the results of Ding et al. imply that fracture aperture plays a signifi-cant role in the advective removal of contaminants and thus maintenance of a high concentration gradient between the matrix and fractures. However, once the concentration in the fracture be-comes essentially zero, then the length of the diffusion pathway, i.e. the fracture spacing becomes important. In conclusion, the discussion of the above-mentioned studies form a preliminary expectation of fracture spacing, fracture aperture, and the physical matrix parameters affecting retardation and thus diffusion rates, being the primary factors affecting remediation time.
4.3 Modelling of contaminant transport in clay till
None of the modelling studies discussed above systematically address the issue of remediation times in fractured low-permeability deposits, i.e. the interactions of the transport and attenuation processes as shown in Figure 4.2. The authors conducted a modelling study in MATLAB to ad-dress this issue. The modelled contaminant solutes are chlorinated ethenes.

44 Modelling solute transport in fractured low-permeability deposits
The MATLAB modelling study has included the following:
1) An investigation of the interaction between diffusive matrix transport and fracture degrada-tion of chlorinated ethenes to establish the threshold rates for diffusion and degradation re-sulting in diffusion- and degradation-limited remediation respectively.
2) An analysis of contaminant transport time (through matrix to fracture) relative to various
physical parameters, the purpose of which is to identify the parameters influencing trans-port and thus remediation time. The goal of the (sensitivity) analysis is to investigate whether fracturing can enhance transport rates, or if other unalterable processes/parameters govern transport and hence remediation time.
4.3.1 Conceptual model
Dimensions
The conceptual model used for the contaminant transport modelling is visualised in Figure 4.3. Its idealised fracture geometry (see Figure 4.1) is based on the assumption that a low-permeability matrix, upon fracturing, can be conceptually approximated as consisting of a number of (homoge-neous) matrix blocks bordered on all sides by fractures (of equal aperture). This is in accordance with the claim that environmental fracturing creates and/or activates (sub)horizontal fractures in low-permeability media, and provides connectivity between these and naturally occurring (sub)vertical fractures, thus also expanding and/or activating the vertical fractures (see Chapter 2 and 3). While this conceptual model is in principle three-dimensional (3D), it can easily be con-densed to 1D, based on the following assumptions:
1) No advection or degradation is taking place in the matrix due to its low permeability. 2) Degradation thus takes place in the fracture network and is herein uniform throughout.
The first assumption signifies that contaminant transport out of the matrix takes place via diffusion alone, the rate of which is governed by concentration gradients. The second assumption signifies that the difference in concentration between a given point in the matrix and the surrounding frac-ture network is the same in every direction. Thus, assuming a zero-concentration in the fractures, the largest concentration gradient will exist along the line marking the shortest distance between the viewed matrix point and a fracture. I.e. contamination will always diffuse out of the matrix (and into the fracture network) along the shortest route possible. This route would be a straight line (1D), were it not for tortuosity. While the tortuosity effect is significant, it does not warrant 2D consideration, as it is taken into consideration via the effective diffusion coefficient. Diffusive ma-trix transport can thus be approximated and modelled as 1D, its rate dependent on the concentration gradient maintained between matrix and fracture via advection and/or degradation taking place in the latter. Accordingly, worst case transport time scenarios are modelled by considering a length of

Modelling solute transport in fractured low-permeability deposits 45
matrix and adjacent fracture from the matrix’s centre to adjacent fracture’s centre, see Figure 4.3 (3). Advection has been omitted in the second assumption, as the condensation of the model to 1D makes it impracticable to model both advection and diffusion, their directions of transport being perpendicular in the model (modelling both would require 2D). Qualitative conclusions regarding advection may, however, be inferred from the degradation term of the model, as they have the common function (indicated previously) of maintaining a high contaminant concentration gradient between matrix and fracture. With the stated assumptions, the advection in fractures and reaction in matrix branches of Figure 4.2 become irrelevant for the modelling. Figure 4.4 gives a reduced version of the figure, showing only the terms considered in the modelling (sensitivity).
Contamination scenario
A late-time contamination scenario (in the saturated zone) is coupled to the conceptual model above. It is assumed that the matrix contains no free phase contamination (no source zone), but is permeated with contamination (until saturation point of the contaminant(s)). Thus, the matrix con-centration may decrease over time.
Composition of contamination
The parent compound of most chlorinated ethene contaminations (in Denmark) is either PCE or TCE, as these were previously widely used in dry-cleaning, industrial degreasing, etc. However, daughter products are presently found at many contaminated sites, where some extent of natural degradation (ARD) has taken place over the years. Thus, the contaminations to be remediated are often composed of multiple compounds. A thorough description of chlorinated solvents and their transport mechanisms in soil and groundwater is given in Appendix N: Theory of chlorinated sol-vents. In the following, focus is, as indicated above, placed on the subgroup chlorinated ethenes.
The influence of contamination composition on degradation
For diffusion out of the matrix to occur, a certain concentration gradient must be upheld via the degradation (or mass transfer) taking place in the fractures. Degradation rates depend upon the chosen remediation technique and the dechlorination stage of the contamination. The first order degradation rates of the three mass destruction remediation techniques described in Appendix G: Coupled remediation technologies are given in Table 4.4. The variation in ARD rates (which re-flects sequential degradation) is only of consequence for the overall remediation time if any rate within the range is too low to maintain diffusion out of the matrix. As stated previously, determina-tion of the threshold degradation rate, which entails a shift from diffusion to degradation limitation on remediation time, is one of the aims of the modelling.

46 Modelling solute transport in fractured low-permeability deposits
Its influence on diffusion
Chlorinated ethenes are as a group classified as mobile compounds. There are, however, significant differences in the substances’ sorption tendencies and thus retardation. PCE is the most sorbing compound, with a Kd-value of 0.47 and hence a retardation coefficient of 4.36 in a typical Danish clay till*. Worst case diffusion scenarios should thus be achieved by modelling PCE as the sole contamination component. However, it must be noted that the solubility of PCE is much lower than those of the lesser chlorinated ethenes. This means that the required concentration reduction for PCE to meet a defined remediation target concentration is much smaller than for lesser chlorinated ethene contaminations. Whether this has a significant influence on diffusion and hence remediation time must thus also be investigated in the modelling. Table 4.4: First order chlorinated ethene degradation rates for the techniques presently favoured for remedia-tion of soil and groundwater contaminated with chlorinated ethenes described in Appendix G: Coupled reme-diation technologies.
λ
Chemical oxidationA w/ KMnO4
(Broholm et al., 2005)
[hr-1]
Natural ARD (adequate concentrations of hydrogen assumed present;
Gonsoulin et al., 2004) [hr-1]
Enhanced ARD (Major et al., 2002)
[hr-1]
Chemical reductionB w/ ZVI
[hr-1]
PCE
6.3·10-9
1.0
TCE
5.7·10-9
2.5
cDCE
9.5·10-9
0.6
VC
0.2-4 h-1
6.0·10-9
0.9
0.2-4 h-1
A For degradation of PCE to innocuous end-products – it is assumed that the degradation of any lesser chlorinated compounds will not have degradation rates exceeding this one. B Inferred from chemical oxidation, see Appendix G: Coupled remediation technologies.
Remediation target
The Danish EPA has set a maximum concentration limit of 0.1 μg/L for the total content of chlo-rinated solvents in drinking water. Concentrations met in extraction/monitoring wells in close downstream proximity to a contaminated area are expected to be at least 100 times smaller than those in the contaminated matrix due to immediate advective dilution of the mass diffusing into the fractures from the matrix. The remediation target of the modelling study is therefore set to 10 μg/L under the expectation that this will represent a remediation level adequate to uphold drinking water quality criteria. Thus, the modelling aims to study the remediation time (tr) required to achieve maximum contaminant concentrations of 10 μg/L throughout the contaminated matrix.
* Based on the Dalumsvej site on Funen: foc = 0.0033 and φ = 0.275 (Hedeselskabet, 2005) – defined later in the chapter.

Modelling solute transport in fractured low-permeability deposits 47
Figure 4.3: Conceptual model of matrix and fracture. Fracture and matrix are 2·xb and 2·(xm - xb) wide respec-tively.
x0 xb xm
C(x,t)
x x0 xb xm
Fractures enhanced / created by environmental fracturing
Natural fractures enhanced by environmental fracturing
3D
1D
Matrix
(2)
Close-up of matrix and frac-ture in 1D perspective – the
furthest any contaminant particle will have to travel in the matrix to reach a fracture
is half the matrix width (= B22
1 ⋅ )
(3)
Model only required to view a length of matrix and frac-ture from centre to centre - Opposite is a plot for view-ing the contaminant concen-
tration profile from the centre of the fracture to the
centre of matrix
Fracture
≈
(1)
Preliminary 3D ideali-sation of fracture network geometry
~ 1D

48 Modelling solute transport in fractured low-permeability deposits
Figure 4.4: Processes and parameters of relevance in the model, when advection is not modelled (directly) and reaction in the matrix is assumed negligible.
4.3.2 Modelling with MATLAB
A detailed description of the implementation of the above-described conceptual model in MAT-LAB 6.5 is given in Appendix O: Implementing the conceptual model in MATLAB. The appendix also gives an overview of all simulations (input codes) run in MATLAB, while an excel spread-sheet containing all modelling results is found in electronic form in Appendix Y: Electronic data, Modelling results. In the following modelling section, a basic modelling scenario is first described, followed by investigations of each of the parameters along the bottom line of Figure 4.4, as they are assumed to have potential for influencing remediation times of contaminated low-permeability sites. In the results tables presented, scenario numbers are stated to facilitate reference to the simu-lation overview in Appendix O.
Basic modelling scenario
The physical parameters employed in the basic modelling scenario (Scenario #1) are given in Table 4.5 and are those stated in Hedeselskabet (2005) in their simulations of PCE degradation via chemical oxidation in till (and sand) at the Dalumsvej-site on Funen, as these are thought to be typical of Danish clay tills.
xm = 2B ρs φ p foc
Cm
Cb (2b)
Diffusion in matrix
RDD w
eτ
=*
Koc
db KRφρ
+= 1
CxC
vxC
DtC
b
b
m
me ⋅−
∂∂⋅−
∂
∂⋅=
∂∂
λ2
2*
pφτ =
( )φρρ −= 1sb ococd fKK ⋅=
2
2
m
m
xC
∂∂
2b
Reaction in fractures
Sw λ

Modelling solute transport in fractured low-permeability deposits 49
An average natural fracture spacing of 50 cm and an aperture of 0.5 mm are furthermore employed. The latter value does not take into consideration the presence of natural sand stringers found in till. Assuming a matrix saturated with PCE (Sw = 240 mg/L), the use of the stated parameters, and a high fracture degradation rate of 1 hr-1, yields the plot shown in Figure 4.5 for contaminant concen-tration in the matrix at selected times. In this scenario, where PCE migrates across 25 cm of matrix to reach a fracture and therein be degraded at a rate of 1 hr-1 (2.78·10-4 s-1), the shape of all† the PCE concentration-profiles clearly illustrates an diffusion process unlimited by degradation (the concentration in the fractures is always lower than in the matrix), i.e. a diffusion-limited remedia-tion time. The time necessary (tr) for the PCE concentration anywhere in the matrix to be reduced (from initially 240 mg/L) to maximally 10 μg/L is 239 years. This confirms the need for remedia-tion efforts coupled with environmental fracturing at low-permeability sites, as remediation times exceeding a decade are likely unsatisfactory in most contexts.
† When a single, constant degradation rate is applied in a given scenario, the same process will limit transport throughout the remediation timeframe of that scenario.
a b
c
Figure 4.5: (a) Basic scenario PCE matrix profiles at selected times after remediation initiation. (b) Close-up of profile at tr = 239 years, where Cm,max = 10 ug/L (at xm = 25 cm), i.e. total remediation time according to the defined remediation target. (c) Close-up of fracture-matrix interface at tr = 239 years.

50 Modelling solute transport in fractured low-permeability deposits
Table 4.5: Values of physical parameters of till employed as basic scenario in modelling.
Parameter
Value (employed in Hedeselskabet, 2005)
φ
0.275
p
1
ρs
2.7 g/cm3
foc
0.0033
Koc
143 cm3/g
τ
0.275 (=φp)
Dw
5.61·10-6 cm2/s
ρb
1.96 g/cm3 (= ρs(1-φ))
Kd
0.472 cm3/g (= foc · Koc)
R 4.358 ( db Kφρ
+= 1 )
De
1.54·10-6 cm2/s (= Dw · τ)
De*
3.54·10-7 cm2/s (= De/R)
Degradation- vs. diffusion-limitation of remediation time (investigating λ)
The apparent effective diffusion coefficient rate (in till) and degradation rate used for PCE in the basic modelling scenario differ by approximately 3 orders of magnitude (3.54·10-7 cm2·s-1 vs. 2.78·10-4 s-1), a difference which is seen to induce a strong diffusion gradient, and hence remedia-tion times that are diffusion-limited. The relationship between degradation rate and apparent effective diffusion coefficient is investi-gated further via a series of MATLAB simulations (# 10-13 and 46-53) represented in Table 4.6 below. The purpose of this was to deduce an overall rule-of-thumb regarding the threshold relation-ship necessary (on an order of magnitude scale) between degradation and diffusion rates to induce diffusion-limited remediation time. From the table it is seen that the degradation rate of PCE must be at least an order of magnitude greater than its apparent effective diffusion rate in till for the remediation of a clay till matrix con-taminated with this substance to be diffusion-limited. Furthermore, the rule-of-thumb seems to hold irrespective of chlorination step (i.e. for all the chlorinated ethenes) and the diffusive transport length, i.e. fracture spacing. Smaller fracture spacing necessitates a slightly higher degradation rate to maintain the same degree of diffusion-limitation as seen in the basic PCE scenario, but this was to be expected, as smaller spacing is synonymous with a decrease in matrix length and thus diffu-sive transport time. When the chlorinated ethene to be remediated is VC, a slightly smaller difference between degra-dation and diffusion rate is seen to be sufficient to maintain diffusion-limitation. This was also
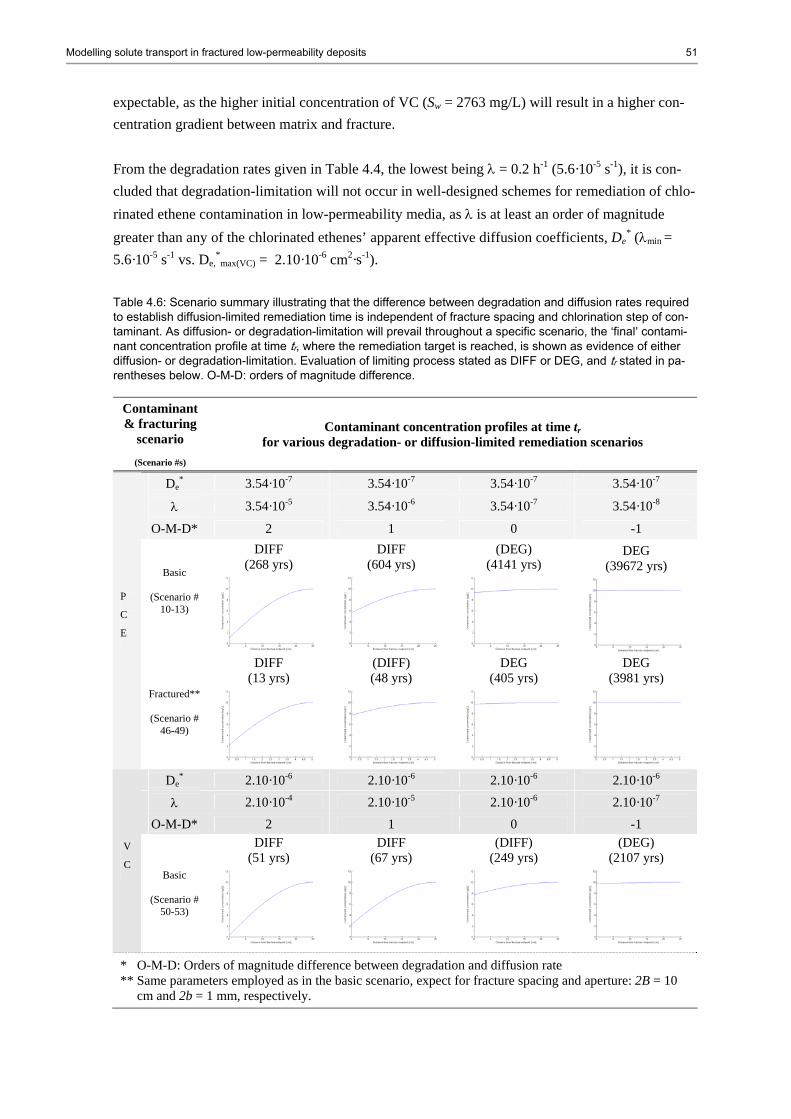
Modelling solute transport in fractured low-permeability deposits 51
expectable, as the higher initial concentration of VC (Sw = 2763 mg/L) will result in a higher con-centration gradient between matrix and fracture. From the degradation rates given in Table 4.4, the lowest being λ = 0.2 h-1 (5.6·10-5 s-1), it is con-cluded that degradation-limitation will not occur in well-designed schemes for remediation of chlo-rinated ethene contamination in low-permeability media, as λ is at least an order of magnitude greater than any of the chlorinated ethenes’ apparent effective diffusion coefficients, De
* (λmin = 5.6·10-5 s-1 vs. De,
*max(VC) = 2.10·10-6 cm2·s-1).
Table 4.6: Scenario summary illustrating that the difference between degradation and diffusion rates required to establish diffusion-limited remediation time is independent of fracture spacing and chlorination step of con-taminant. As diffusion- or degradation-limitation will prevail throughout a specific scenario, the ‘final’ contami-nant concentration profile at time tr, where the remediation target is reached, is shown as evidence of either diffusion- or degradation-limitation. Evaluation of limiting process stated as DIFF or DEG, and tr stated in pa-rentheses below. O-M-D: orders of magnitude difference.
Contaminant & fracturing
scenario
(Scenario #s)
Contaminant concentration profiles at time tr for various degradation- or diffusion-limited remediation scenarios
De*
3.54·10-7 3.54·10-7 3.54·10-7 3.54·10-7
λ
3.54·10-5 3.54·10-6 3.54·10-7 3.54·10-8
O-M-D*
2 1 0 -1
Basic
(Scenario # 10-13)
DIFF (268 yrs)
DIFF (604 yrs)
(DEG) (4141 yrs)
DEG (39672 yrs)
P
C
E
Fractured**
(Scenario # 46-49)
DIFF (13 yrs)
(DIFF) (48 yrs)
DEG (405 yrs)
DEG (3981 yrs)
De*
2.10·10-6 2.10·10-6 2.10·10-6 2.10·10-6
λ
2.10·10-4 2.10·10-5 2.10·10-6 2.10·10-7
O-M-D*
2 1 0 -1 V
C Basic
(Scenario #
50-53)
DIFF (51 yrs)
DIFF (67 yrs)
(DIFF) (249 yrs)
(DEG) (2107 yrs)
* O-M-D: Orders of magnitude difference between degradation and diffusion rate ** Same parameters employed as in the basic scenario, expect for fracture spacing and aperture: 2B = 10 cm and 2b = 1 mm, respectively.

52 Modelling solute transport in fractured low-permeability deposits
In the remaining modelling scenarios, ARD is chosen as the vantage point for degradation, because it is more versatile than the other techniques discussed in Appendix G: Coupled remediation tech-nologies. The slowest step of ARD is the degradation of cDCE to VC with a degradation rate of 0.6 hr-1, and it is approximated that this rate will constitute the worst case degradation time scenario for any well-designed ARD remediation setup, see Figure 4.6. It should be noted that this is a signifi-cant simplification. The stoichiometric implications of the sequential chlorinated ethene degrada-tion have in actual ARD remediation efforts been seen to cause significant degradation inhibition (Jørgensen et al., 2005). I.e. degradation-limitation may realistically be difficult to avoid, even in well-designed remediation setups.
Figure 4.6: Conceptualisation of worst case ARD degradation rate.
If the initial lag phase before onset of each degradation stage and the final period of VC-degradation are disregarded, then the rate at which cDCE is degraded to VC is seen to decide the overall degradation rate and time for the whole (sequential) dechlorination process. A “pseudo” worst case degradation rate for the overall process is thus given by:
λARD = λcDCE = 0.6 hr-1
2
3 4
Lag
~ λcDCE
-1= 1.7 hr
Final VC-degradation
1
PCE TCE
cDCEVC
TCE
cDCE
VC
(1) λPCE-1 = 1.0 hr
(2) λTCE-1 = 0.4 hr
(3) λcDCE-1 = 1.7 hr
(4) λVC-1 = 1.1 hr
T
I
M
E
Ethene
2
cDCE
Ethene
1−∝ λdegt
1st order degradation is given by the equation: ⇔⎟⎟⎠
⎞⎜⎜⎝
⎛⎟⎟⎠
⎞⎜⎜⎝
⎛⋅=⋅= ⋅−
end
ideg
tiend C
CteCC ln1deg
λλ

Modelling solute transport in fractured low-permeability deposits 53
Closely spaced fractures vs. widely spaced lenses/stringers (investigating 2b and 2B )
Tills are known to contain high-permeability sand lenses, stringers, and/or pockets, which may be viewed as very wide fractures. Thus, ‘fracture’ aperture becomes a parameter with a large range of possible values. The conceptualisation of the sensitivity analysis (Figure 4.4) suggests that fracture aperture may influence diffusion significantly, as it influences the contaminant concentration in the fractures (it is a deciding factor in the fracture volume‡ over which contaminant mass may distrib-ute itself) and thus the amount of contaminant diffusing out of the matrix to the fractures (over the fracture-matrix interface) at any given time. Its influence, as well as that of fracture spacing, is investigated via the set of scenarios described in Table 4.7 below and visualised in Figure 4.7. As can be seen from the modelling results displayed in Table 4.7, the presence of thicker high-permeability lenses in a till matrix does not induce significant reductions in remediation times. Under diffusion-limited circumstances, i.e. circumstances where a high degradation rate and thus contaminant concentration gradient are maintained, the presence of thick lenses with relatively large spacing results in a remediation time more than 4 orders of magnitude larger than that simu-lated with very closely spaced thin fractures. Even under degradation-limited circumstances, i.e. circumstances where only a low degradation rate is maintained, the thick lenses still result in a remediation time approximately double of that simulated for the closely spaced thin fractures.
Figure 4.7: Conceptualisation of 2 matrix sections. They both contain 150 cm low-permeability till material, in which diffusion takes place, and 60 cm of high-permeability fractures/lenses, in which degradation takes place. When he same contamination scenario is applied to both, their modelled remediation times will reveal whether different distribution of the low- and high-permeability material influences remediation time. ‡ As the model is 1D, contaminant mass is only distributed over a length/width (0.5·2b) of fracture here.
cm
cmcm
cmxcmx
cmwidthblockMatrixcmwidthLense
m
b
210
503203
3510
5020
⋅⋅
⎩⎨⎧
==
⇒⎭⎬⎫
==
cm
cmcm
cmxcmx
cmwidthblockMatrixcmwidthFracture
m
b
210
25.06001.0600
175.005.0
25.01.0
⋅⋅
⎩⎨⎧
==
⇒⎭⎬⎫
==

54 Modelling solute transport in fractured low-permeability deposits
Table 4.7: Comparison of remediation times for till matrix sections with equal total thicknesses of low- and high-permeability areas, but different distributions: one has widely spaced thick lenses, while the other has closely spaced thin fractures. The basic Dalumvej scenario and a realistic fracturing scenario are also been included.
Degradation rate, λ
Aperture, 2b
Spacing, 2B
tr
Scenario #
Scenario
Process limiting tr
[hr-1] [cm] [cm] [yrs]
1
Dalumvej DIFF 1.0 0.05 50 239
14
Widely spaced thick lenses DIFF 1.0 20 50 236
15
Closely spaced thin fractures DIFF 1.0 0.1 0.25 0.022
18
Realistic fracture scenario DIFF 1.0 0.1 10 10
16
Widely spaced thick lenses DEG 1.0·10-4 20 50 381
17
Closely spaced thin fractures DEG 1.0·10-4 0.1 0.25 170
19
Realistic fracture scenario
DEG 1.0·10-4 0.1 10 5062
Realistic fracturing scenario
Replacing the very closely spaced fracture scenario with one believed to be more realistic based on fracturing experiences and claims (upon fracturing; 2b = 1 mm and 2B = 10 cm; Scenario #18/19) still reveals remediation time to be much faster with more closely spaced, thinner fractures under diffusion-limiting circumstances (236 vs. 10 years), while the lense scenario is faster under degra-dation-limited circumstances (381 vs. 5062 years). For the environmental consultant, however, neither alternative in the latter case is attractive. Fracture aperture is thus seen to play an inferior role in remediation time compared to fracture spacing as long as a high concentration gradient is maintained. This is in accordance with the mod-elling results of Ding et al. (2000) discussed earlier, where fracture aperture was observed to be significant as long as it was associated with increased advective flow serving to reduce contaminant concentration in the fracture. I.e. when an advective rate sufficient to maintain a zero-concentration in the fracture is established, further increase of aperture is inconsequential. The results are not directly comparable to those of McKay et al. (1993), as the fracture apertures modelled by McKay et al. are much smaller than those deemed relevant in this modelling study, i.e. the modelled ranges do not overlap at all. However, fracture spacing is shown to be a parameter significant to transport time in both studies. Based on the findings of the degradation investigations above, diffusion-limitation (via a high deg-radation rate) has been implemented in all simulations from this point on.
Sensitivity analysis of fracture spacing and aperture (investigating 2b and 2B)
To better quantify the individual significance of fracture spacing and aperture, a type of sensitivity analysis, in which only one of the parameters is altered at a time, was conduced. The simulations

Modelling solute transport in fractured low-permeability deposits 55
are thus based on the basic scenario, but with altered fracture spacing and aperture (within a realis-tic/typical range), respectively, see Table 4.8. Table 4.8: Modelling results for sensitivity analysis of fracture spacing/aperture influence on remediation time. For comparative purposes, the basic modelling scenario (# 1) and the realistic, fractured scenario (# 39) are also given in the table.
Scenario #
Aperture, 2b Spacing, 2B Remediation time, tr [cm]
[cm]
[yrs]
1
0.05 50 239
31
0.05 200 3785
32
0.05 100 952
33
0.05 20 40
34
0.05 10 11
35
0.05 5 3
36
0.01 50 270
37
0.2 50 237
38
0.07 50 240
39
0.1 10 10 From the table it is seen that reducing the fracture spacing 1 order of magnitude (from 100 to 10 cm) results in an almost 2 order of magnitude reduction in remediation time (952 to 11 years), while a (more than) 1 order of magnitude increase in fracture aperture (from 0.01 to 0.2 cm) results in only a comparatively slight reduction in remediation time (270 to 237 years). Thus, as also con-cluded in the section discussing the influence of sand stringers above, fracture spacing has a much larger influence on remediation time than does fracture aperture under diffusion-limited circum-stances. The lowest remediation time is again obtained via use of the ‘realistic fracturing scenario’ (here # 39). With the obtained results, the hypothesis of remediation time constituting the reverse of the disap-pearance times of Parker et al. (1994; 1997) appears to hold only for fracture spacing, as Parker et al. saw equal orders of magnitude increase in disappearance time upon increase in fracture aperture and spacing (2:1 and 4:2) respectively. This is not surprising, as spacing plays a similar role in both modelling studies (it is the deciding factor of the distance to/from the centre of matrix). Aperture, on the other hand, in the modelling scenarios of Parker et al. decides the volume of DNAPL which must diffuse into the matrix, and thus has an influential role here. Due to diffusion-limitation in the present modelling study, aperture plays only a negligible role in deciding the amount of dissolved contaminant which may diffuse out of the matrix. The conclusions regarding fracture aperture and spacing of this study are in general agreement with conclusions from previous studies. If it is proven correct that pneumatic fracturing creates a dense network of small fractures, thus shortening diffusion pathways to a minimum, it appears that its use will be expedient for the purpose of remediation enhancement at low-permeability contaminated sites.

56 Modelling solute transport in fractured low-permeability deposits
Sensitivity analysis of matrix characteristics (investigating p, φm, ρs, and foc)
To evaluate whether the typical variability of the matrix parameters on the bottom line of Figure 4.4 have the potential to significantly influence diffusive transport time, another sensitivity analysis has been conducted. It involved another series of simulations based on the basic scenario, where one parameter at a time was varied across its typical value range. Typical value ranges, deduced from the literature, are stated in Table 4.9, while results of the investigation are presented in Table 4.10 and 4.11. Table 4.9: Typical values and value ranges of physical parameters employed as basic scenario in modelling.
Parameter
Typical value Value range
φ
0.275 (Hedeselskabet, 2005) 0.1-0.4 (Table 3.1)
ρs
2.7 g/cm3 (Parker et al., 1994) 2.6-2.75*
foc
0.0033 (Hedeselskabet, 2005) 0-0.01 (Parker et al., 1994)
p
1 (Parker et al., 1994) 0.4-2 (Parker et al., 1994)
τ
0.275 (=φp) 0.076-0.597**
* inferred from typical use of 2.65 g/cm3 for most soil minerals (Christiansen, 2005, personal communication) **inferred from p-value range
Table 4.10: Modelling results for sensitivity analysis of unfractured matrix characteristics. Color coding illus-trates the ‘pathway of influence’ of a given parameter.
φ
p τ ρs foc ρb Kd R De tr
#
Scenario
[-]
[-] [-] [g/cm3] [-] [g/cm3] [cm3/g] [-] [cm2/s] yrs
1
Dalumvej 0.275 1 0.275 2.7 0.0033 1.96 0.472 4.358 1.54·10-6 239
21
0.1 0.561 0.275 2.7 0.0033 2.43 0.472 12.464 1.54·10-6 692
22
Porosity altered 0.4 1.409 0.275 2.7 0.0033 1.62 0.472 2.911 1.54·10-6 162
23
0.275 0.4 0.597 2.7 0.0033 1.96 0.472 4.358 3.35·10-6 115
24
0.275 1.1 0.242 2.7 0.0033 1.96 0.472 4.358 1.36·10-6 273
25
Tortuosity altered (via p-value) 0.275 2 0.076 2.7 0.0033 1.96 0.472 4.358 4.24·10-7 859
26
0.275 1 0.275 2.6 0.0033 1.89 0.472 4.234 1.54·10-6 235
27
Density altered 0.275 1 0.275 2.75 0.0033 1.99 0.472 4.420 1.54·10-6 245
28
0.275 1 0.275 2.7 0.001 1.96 0.143 2.018 1.54·10-6 112
29
Organic content altered
0.275 1 0.275 2.7 0.01 1.96 1.430 11.176 1.54·10-6 620 Table 4.11: Value ranges of selected parameters presented in Table 4.10 converted to relative ranges (%).
Parameter
Variation within typical range
Model input parameters affected by variation
Effect
Resulting change in tr
φ
+300 R (ρb) -77 (-33) -77
p
+400 De (τ) -87 (-87) +647
ρs
+6 R (ρb) +4 (+5) +4
foc
+900 R (Kd) +454 (+900) +454

Modelling solute transport in fractured low-permeability deposits 57
The modelling results show that the parameters φ and foc, upon alteration over their typical range of values, produce significant variations in retardation, thus influencing diffusion and remediation times significantly. The influence of ρs-alteration is slight, however, as its typical value range is narrow. Thus, the much more pronounced influence of porosity and organic content is in part at-tributed to their typical value ranges which, in relative terms, are much broader than that of (clay) particle density. In general, the direct proportionality seen between alterations induced in retarda-tion and remediation time are given by the fact that remediation time is, in all the simulations of this modelling segment, essentially a function of diffusion time, which is directly proportional to the retardation factor (and the square of diffusive transport distance, d):
RdD
RD
dDdt
wwediff ⋅⋅
⋅=
⋅== 2
2
*
2 1ττ
The results are similar to those observed by Parker et al. (1994; 1997), Ball et al. (1997), and Ding et al. (2000), where parameters influencing retardation are also found to influence diffusion times significantly. The p-value, via tortuosity, influences the diffusion pathway (represented by the effective diffusion coefficient), i.e. the distance a contaminant particle must travel via diffusion to exit the matrix. While its typical range of values is not, in relative terms, as large as that of foc, variation over its range induces the largest difference in remediation times of the 4 investigated parameters. It is, in fact, the only parameter, the alteration of which, induces a proportionally larger alteration of reme-diation time (+400% vs. +647%). This result is in accordance with findings of Ding et al. (2000), who also found tortuosity to significantly influence diffusion. It should be noted that the values of the discussed matrix parameters are, as indicated in Table 4.10 and 4.11 as well as Figure 4.4, not independent. I.e., the influence of each parameter seen in the above may be coupled to that of others. While a sensitivity analysis would typically address such coupling, it was beyond the scope of this modelling study. Upon comparison with the findings of the fracture spacing investigations discussed above, it is concluded that while selected physical matrix parameters do influence remediation time, their in-fluence does not appear as significant when compared to the influence of fracture spacing. Several orders of magnitude decrease in remediation time were seen upon a 1 order of magnitude decrease in fracture spacing, while variation of the physical parameters only induces changes in remediation time on the scale of 1:1 (for φ and foc less, and for p/τ more). The conclusion is supported by the findings of McKay et al. (1993), Parker et al. (1994; 1997), and Ding et al. (2000). Nonetheless, while the discussed matrix characteristics are neither feasibly altered, nor as influen-tial as parameter(s) that are, the matrix parameter analysis indicates that precise knowledge of the physical matrix characteristics of a proposed fracturing site is valuable, as the use of imprecise

58 Modelling solute transport in fractured low-permeability deposits
estimates of these parameters may lead to an inaccurate range of anticipated remediation times at the site, fracturing-enhanced or not. Table 4.12 illustrates that implementation of the highest p-value (and thus highest tortuosity) within the typical range (p = 2) instead of the central typical value (p = 1) is sufficient to alter the effective diffusion rate of PCE to an extent that remediation time in the previously utilised ‘realistic fracturing’ scenario will become 35 years instead of 10. This is of relevance to the environmental consultant in terms of forming realistic remediation ex-pectations upon fracturing, as estimates of fracturing-enhanced remediation time based on a typical physical scenario (e.g. the basic scenario of this modelling study) could thus be misleadingly opti-mistic. Table 4.12: Illustration of the influence of p on remediation time.
Scenario #
Scenario
λ [hr-1]
p [-]
De [cm2/s]
2B [cm]
2b [mm]
tr [yrs]
18
Realistic fracturing scenario, typical p-value
1.0 1 1.54·10-6 10 1 10
54
Realistic fracturing scenario, typical p-value, worst case degradation rate
0.6 1 1.54·10-6 10 1 10
55
Realistic fracturing scenario, high p-value, worst case degradation rate
0.6 2 4.24·10-7 10 1 35
Investigating contaminant characteristics (Sw and Koc)
The contaminant parameters identified in Figure 4.4 to potentially influence diffusive matrix trans-port, and thus remediation time, are the following: 1) aqueous solubility, Sw; and 2) the partitioning coefficient with respect to organic matter, Koc. The latter may be calculated via the partitioning coefficient with respect to octanol, Kow. The values of these 3 parameters as well as others influ-enced by them are summarised in Table 4.13 below for the chlorinated ethenes. Table 4.13: Selected physical-chemical parameters of the chlorinated ethenes.
Contaminant Sw logKow Koc*
Kd (foc- derived)
R Dw De De*
[mg/L] [-] [cm3/g]
[cm3/g]
[-] [cm2/s] [cm2/s] [cm2/s]
PCE
240 2.88 142.96 0.472 4.358 5.61·10-6 1.54·10-6 3.54·10-7
TCE
1400 2.53 61.83 0.204 2.452 6.23·10-6 1.71·10-6 6.99·10-7
cDCE
3500 1.86 12.43 0.041 1.292 7.08·10-6 1.95·10-6 1.51·10-6
VC
2763 1.38 3.94 0.013 1.092 8.34E·10-6 2.29·10-6 2.10·10-6
*Calculated via Abdul’s Formula: logKoc =1.04 · logKow – 0.84 (Kjeldsen and Christensen, 1996)
As may be seen from Table 4.13, the chlorinated ethenes become more soluble in water the less chlorinated they are, except for VC, which is less soluble than cDCE. Their retardation and effec-tive diffusion coefficients also become lower and higher respectively, i.e. the lesser chlorinated compounds also sorb less. As remediation time has been said to be diffusion-limited in expediently

Modelling solute transport in fractured low-permeability deposits 59
designed remediation schemes, it appears likely that it will thus also be shorter if the contamination is made up of lesser chlorinated ethenes, as postulated earlier in the chapter. To investigate the influence of the contaminant chlorination step on remediation time, two simula-tions are run with each contaminant: an unfractured basic scenario and a realistically fractured sce-nario. Initial matrix concentration is altered in each simulation set, in accordance with the sub-stances’ varying aqueous solubilities, while the target degradation rate (worst case) and remedia-tion concentration are always 0.6 hr-1 and 0.01 mg/L (or 10 μg/L), respectively. The modelling results are given in Table 4.14 below. It is seen that the assumption made earlier of PCE-contamination constituting a worst case diffusion scenario was correct, as remediation time gener-ally decreases for the lesser chlorinated ethenes. Table 4.14: Modelling results for analysis of contaminant compound influence on remediation time.
Fracture
aperture, 2b spacing, 2B
tr
(”worst case”*) Scenario # Scenario Contaminant
[cm] [cm] [yrs]
1
Dalumsvej PCE 0.05 50 239
39
Realistic fractured scenario PCE 0.1 10 10
40
Dalumsvej TCE 0.05 50 144
41
Realistic fractured scenario TCE 0.1 10 6
42
Dalumsvej cDCE 0.05 50 72
43
Realistic fractured scenario cDCE 0.1 10 3
44
Dalumsvej VC 0.05 50 51
45
Realistic fractured scenario VC 0.1 10 2
* ARD degradation rate of cDCE slowest and thus deciding rate for overall degradation, see Figure 4.6.
4.4 Conclusions
For well-designed remediation setups of fractured, low-permeability media contaminated with chlorinated ethenes, i.e. setups where a degradation rate of no less than 0.2 h-1 (5.6·10-5 s-1) is main-tained, diffusion-limitation of remediation time will prevail. (This is based on the modelling-derived rule-of-thumb stating that remediation time will be diffusion-limited as long as the degra-dation rate is an order of magnitude greater than the effective diffusion coefficient. The range of the latter for chlorinated ethenes in till is 3.54·10-7 – 2.1·10-6 cm2·s-1 making the threshold degrada-tion rate for degradation-limitation ~1·10-7 s-1.)
Some physical characteristics – p (τ), φ and foc – of a low-permeability medium will influence dif-fusion and thus remediation time more than others. This information is valuable in relation to set-ting realistic anticipated (fracturing-enhanced) remediation times.

60 Modelling solute transport in fractured low-permeability deposits
While actual chlorinated ethene contaminations will consist of multiple components, a contamina-tion consisting of solely PCE constitutes a worst case scenario due to its more pronounced ten-dency to sorb to the organic matter present in the matrix sediment. Given diffusion-limitation, fracture spacing has a much more pronounced influence on remediation time than fracture aperture. Thus, the natural presence of few isolated sand lenses, etc. in an other-wise low-permeability matrix will not serve to reduce remediation time significantly. Even in deg-radation-limited scenarios, fracture aperture, or lense thickness, has little influence on remediation time compared to the influence fracture/lense spacing has under diffusion-limited circumstances. Aperture may become more important when stoicheometric reactions involving delivery of reme-dial substances (donors, oxidants, etc.) are considered, as degradation-limitations must here be expected to come into play. Furthermore, some remedial substances may diffuse into the matrix, thus ‘expanding’ the reaction zone otherwise expected limited to the fractures. The results of the MATLAB study are in overall agreement with the results of the previous model-ling studies discussed earlier in the chapter. Our latest study has, however, explored the subject of solute transport in low-permeability from a new angle: determination of remediation times for low-permeability media saturated with chlorinated ethene contamination. The study is simple, but the results may serve as a basis for more elaborate studies in the future. To obtain total remediation times of less than a decade at low-permeability till sites contaminated with chlorinated ethenes, fracture spacing of maximally 10 cm must be achieved. However, the remediation target of the modelling is very strict. Actual remediation efforts at contaminated low-permeability sites will likely aim to simply reduce the flux of contaminants (Broholm et al., 2005), and thus a larger fracture spacing may be sufficient.

61
CHAPTER 5
FIELD INVESTIGATION OF A NATURALLY-FRACTURED CLAY TILL This chapter outlines the field work associated with and results obtained from an excavation of the Vasby site carried out in December 2005. The objective of the excavation was to character-ise/classify the till deposit, including fractures naturally present in the till. This provides a basis for evaluation of whether the site constitutes a typical Danish clay-till site, and thus whether experi-ences from the pneumatic fracturing pilot study conducted at the site may 1) be compared to re-sults of previous international studies, and 2) be transferred to other proposed Danish and/or international sites.
5.1 Description of the Vasby field site The field site is is an agricultural property located in Vasby, Hedehusene, east of Roskilde (see Figure 3.1). The NE corner of the site was previously the location of a chemical distribution depot and a small machine shop from which contamination has taken place. Consequently, detailed con-sultants reports regarding the local geology are available. A site map including locations of previ-ously installations is given in Appendix P: Map of the Vasby site.
5.1.1 Geology of the field site
Glacial history
Figure 5.1 illustrates the glacial history of the field site area during the last glacial period. From 18-17,000 years BC the area was overridden by a glacier (the Late Baltic Advance) which deposited a ground moraine over previous glacial sediments. From 17-16,000 years BC, the ice retreated and an end moraine is therefore located almost directly over the field site at Vasby. To the west of the end moraine, an outwash plain formed, resulting in extensive sand and gravel deposits. After the final retreat of the glacier (16-14,500 years BC), a dead ice landscape formed SW and NE of the
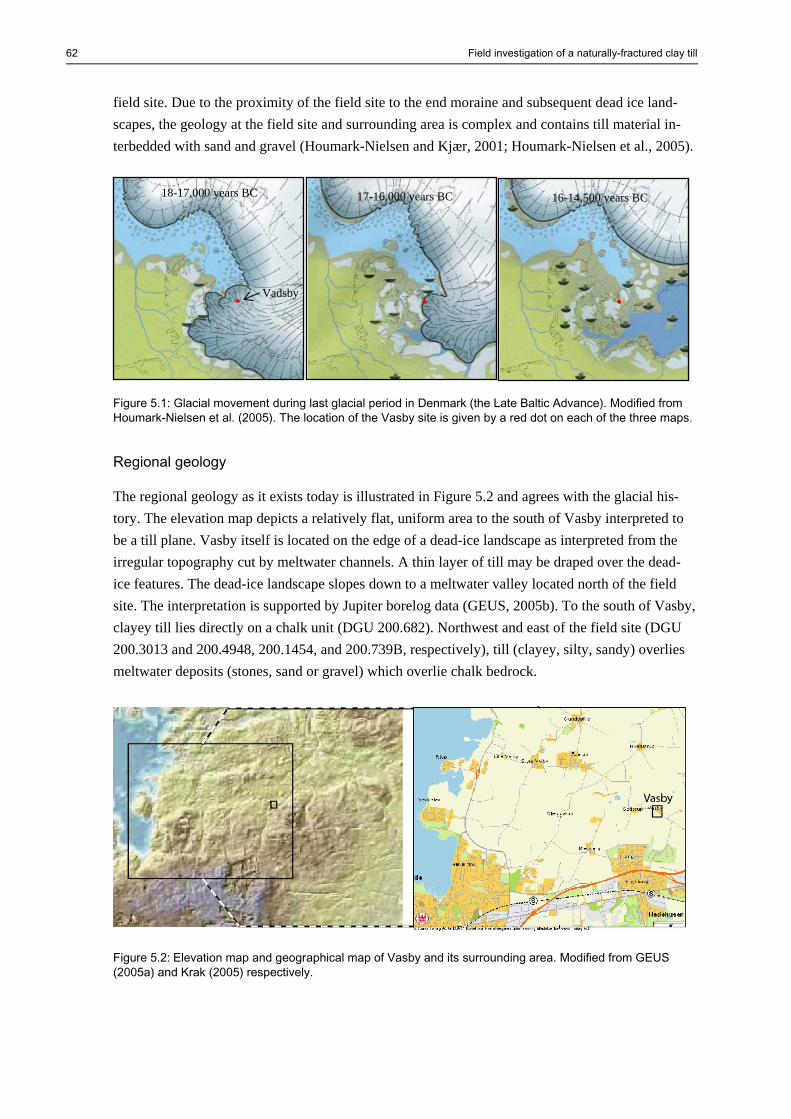
62 Field investigation of a naturally-fractured clay till
field site. Due to the proximity of the field site to the end moraine and subsequent dead ice land-scapes, the geology at the field site and surrounding area is complex and contains till material in-terbedded with sand and gravel (Houmark-Nielsen and Kjær, 2001; Houmark-Nielsen et al., 2005).
Figure 5.1: Glacial movement during last glacial period in Denmark (the Late Baltic Advance). Modified from Houmark-Nielsen et al. (2005). The location of the Vasby site is given by a red dot on each of the three maps.
Regional geology
The regional geology as it exists today is illustrated in Figure 5.2 and agrees with the glacial his-tory. The elevation map depicts a relatively flat, uniform area to the south of Vasby interpreted to be a till plane. Vasby itself is located on the edge of a dead-ice landscape as interpreted from the irregular topography cut by meltwater channels. A thin layer of till may be draped over the dead-ice features. The dead-ice landscape slopes down to a meltwater valley located north of the field site. The interpretation is supported by Jupiter borelog data (GEUS, 2005b). To the south of Vasby, clayey till lies directly on a chalk unit (DGU 200.682). Northwest and east of the field site (DGU 200.3013 and 200.4948, 200.1454, and 200.739B, respectively), till (clayey, silty, sandy) overlies meltwater deposits (stones, sand or gravel) which overlie chalk bedrock.
Figure 5.2: Elevation map and geographical map of Vasby and its surrounding area. Modified from GEUS (2005a) and Krak (2005) respectively.
18-17,000 years BC 17-16,000 years BC
Vadsby
16-14,500 years BC

Field investigation of a naturally-fractured clay till 63
Local geology and hydrogeology
Figure 5.3 provides an overview of the local geology, based on preliminary site characterisation reports completed for Copenhagen County (Københavns Amt, 2005a; 2005b) over the NE corner of the property Vadsbyvej 16A. The actual fracturing and excavation area are located further SW on the property, see Appendix P: Map of the Vasby site. Hand-texturing of geoprobe cores taken from the fracturing site prior to fracturing confirm that the overburden at the fracturing site and adjacent contaminated site are similar: a sandy (silty) clay diamict (see Appendix Q: Soil survey method and description of cores KF0-KF3 for a description of the cores).
Figure 5.3: Conceptualisation of the local geology in the Vasby area.
Fracture observations
A few natural fractures with ochre precipitates on the fracture face and occasionally in the matrix were observed in some of the geoprobe cores from 2 to 3.30 m b.s. At greater depths, regions of complex grey and yellow-brown coloration were observed in some cores. The grey striations were interpreted to be fractures. Their grey colour is due to decomposition of organic matter resulting in reducing conditions within the fractures (discussed later). These fractures are considered most likely to be hydraulically active (Klint, 2005, personal communication).
Bulk hydraulic conductivity
Bulk hydraulic conductivity values determined by slug tests range between 3.5 x 10⁻⁷ m/s at 8 m depth in well Well B101 (screened between 6-8 mbs in sandy, gravely, clay till) and 2.1 x 10⁻⁸ m/s at 12 m depth in B102 (screened between 10.5 and 12.5 m b.s. in sandy, gravely, clay till; Køben-havns Amt, 2005b). These lie within the higher end of the range of values for a glacial clay till (see Table 3.1) likely due to natural fractures and sand stringers.
+ 25 + 24
+ 9
+ 7
Fill Clay till w/ sand stringers Sand Limestone

64 Field investigation of a naturally-fractured clay till
5.2 The excavation
5.2.1 Location and procedure
A bulldozer with a smooth shovel was used to excavate a 10x10 m area on the NW corner of the fracturing area, see Figures 5.4 and 5.5. The overburden was scraped outwards from the excavation in layers about 0.5 to 1 m deep and wide. The ex-cavating process was monitored. Smaller layers were removed at depths and/or in locations were induced fractures were anticipated or if tracer was observed. Observed pneumatically induced frac-tures are described in Chapter 6. The area was excavated to a depth of approximately 5 meters below ground surface.
5.2.2 Collection of data from the excavation
To characterise the excavated till, the following data collection tasks were performed in the exca-vation:
1) After scraping the vertical profiles of the excavation clean (with hoes), surveying rods were placed 1 meter apart along the profiles, and photographs were taken to document the profiles.
2) A lithology log of the profiles was kept, noting sediment composition and colour.
3) Large fractures observed in the profiles were properly exposed using a knife, whereafter their strike, dip, colour, and location along the profile were noted at 2 depths (one on each profile). Fracture spacing along the SE wall was also measured.
4) Fabric analyses, which consist of characterising small elongated stones for use in deducing ice movement directions, were carried out at 3 depths (2 on horizontal surfaces and 1 on a vertical surface.
5) Overall trace frequency of observed vertical and horizontal fractures was counted. The data collected and overview figures created from these data are discussed in the following sections. For more thorough method descriptions the reader is referred to Klint (2001).
5.3 Lithological description
The lithology of the site as observed in Profiles 1 and 2 of the excavation is depicted inFigure 5.6.
Figure 5.4: Photo of the excavation carried out at the Vasby site, December 2005. Looking North. The NE corner of the site described in Køben-havns Amt (2005a; 2005b) is located by the red truck and barn seen in the photo.

Field investigation of a naturally-fractured clay till 65
Figure 5.5: Plan view of the excavation and fracturing field at the Vasby site. PF1 is the fracturing well, while T1-4 are monitoring wells positioned on the rim of the area expected to influenced by the fracturing (expected radius of influence = 5 m). Profiles 1 and 2 of the excavation were used in natural fracture and till characterisa-tion and classification. The extra step on the excavation’s SE wall was excavated to accommodate characteri-sation of the tracer-filled fractures (discussed in Chapter 6).
0 m 1 m 2 m 3 m 4 m 5 m
T4
T3
T2
PF1
Profile 1
Profile 2
0.4 m 1.8 m
1.0 m
0.8 m 0.8 m
0.5 m
1.6 m
1.1 m
1.2 m
4.4 m
N
0.4 m 1.8 m
1.8 m
0.8 m
4.8 m
0.5 m
2.3 m
1.7 m
4.5 m
Cross sectional view of SE wall of excavation Cross sectional view of NE wall (w/ Profiles 1 & 2) of excavation
T1

Structures
Structure legend
Soil Oxidised till, CaCO3-rich Oxidised till, Reduced till, CaCO3-poor CaCO3-rich
m b.s.
0
0.5
1.0
1.5
2.0
2.5
3.0
3.5
4.0
clay silt sand gravel
Clayey diamict Sandy diamict
Sorted
Unsorted
Soil
Till, silty, very sandy, slightly gravely, slightly stony, massive (homogeneous), olive brown, CaCO3-poor, ochre-coloured stains CaCO3 border Till, very silty, sandy, slightly gravely, stony, massive/fissile, light olive brown, CaCO3-rich, firm, few sand lenses, few stones of up to 40-50 cm diameter, large content of flint and chalk Till, very silty, sandy, slightly gravely, stony, solid, olive brown, firm, CaCO3-rich, fractures with grey surface, ochre in larger frac-tures, manganese in smaller fractures Transistion between oxidised till (above) to reduced till (below) with oxidised fractures Till, very silty, (slightly) sandy, slightly gravely, stony, solid, soft, CaCO3-rich, olive grey, only few fractures below 3.6 m.b.g.s.
Lith
olog
y
Description
Tex
ture
Lithology legend
Depositional classification
Bioturbation (worm holes) Roots
Stones and pebbles
Sand lenses Fractures
Flow till
Basal till (Type B: brittle)
Basal till (Type A:
deformable)
? ? ? ? ?
Figure 5.6: Lithology log of the Vasby site. Constructed from
Profiles 1 and 2 of the excavation, see Figure 5.4. The sediment descriptions w
ere made as the log w
as drawn, w
hile the depositional classification w
as not made until the natural fractures and fabric data, discussed in the follow
ing section, had been interpreted. Till type definitions found in Klint (2001) (see also Appendix K: Natural fractures and depositional environm
ents of tills).

Field investigation of pneumatic fracturing 67
5.4 Fracture characterisation and fabric analyses
Large natural fractures observed in the excavation profiles were characterised at two depths: 1 and 2.80 m b.s. The characterisation consisted of locating and properly exposing the larger natural frac-tures (later classified into three systems), and then measuring their strike and dip, see Figure 5.7 a and b. Recall from Chapter 3 that the fractures expected in clay-tills are unsystematic contraction fractures and systematic glacial-tectonic fractures. Fabric data were collected at 1, 2.20, and 3.2 m b.s. This consisted of uncovering small, elongated* stones and pebbles on a horizontal surface and likewise measuring their dip-direction and dip, see Figure 5.7c and d. It should be noted that no horizontal surface was available at 1 m b.s., and fabric data at this depth were thus collected on the vertical surface of Profile 1. This is typically not expedient due to potentially biased sampling and the large probability of the stones having been disturbed by the excavation and scraping.
Figure 5.7: (a) Measurement of fracture strike (flat board placed on fracture surface to assist measurement of the orientation of the plane); (b) Measurement of fracture dip; (c) Measurement of dip direction of stone (stone removed and replaced by a pencil to assist measurement of the line); (d) Measurement of dip of stone. The strike/dip-directions and dip measurements (given in Appendix R: Fabric data & strike and dip measurements of natural fractures at the Vasby site) were plotted stereographically via the program SpheriStat (Version 2.2), see Figure 5.8.
* A minimum width:length ratio of 1:1.5 is required for a stone to qualify for the fabric analysis, which should contain measurements from no less than 25 stones.
a b
c d

68 Field investigation of a naturally-fractured clay till
Figure 5.8: (right side) Stereographic projections of fabric data collected at 1, 2.2, and 3.2 m b.s. respectively at the Vasby site excavation. Interpreted ice movement directions superimposed. (left side) Stereographic projections of (major) fracture planes encountered in the Vasby site excavation at 1 and 2.80 m b.s. respec-tively. Interpreted ice movement directions and system classifications superimposed.
System 1
System 2 (1st and 2nd order, conjugated set)
Conjugated strike planes of System 2 fractures
System 3 (1st and 2nd order)
Strike plane(s) of System 3 fractures
Contraction fractures?
Other scatter (1st and 2nd order)
Avg. strike of fractures
Equal Area
(Schmidt)N Equal Area
Axial N = 38
E
+2S
+4S
+6S
+8S
+10S
(Schmidt)N
Axial N = 40
E
+2S
+4S
+6S
+8S
+10S
NEqual Area(Schmidt)
Axial N = 26
E +2S
NEqual Area(Schmidt)
Axial N = 28
E
+2S
+4S
+6S
1
2
N Equal Area (Schmidt)
Axial N = 26
E
+2S
+4S
Stones
Scour marks
Avg. dip direction of elongated stones
Initial ice movement direction Later ice movement direction

Field investigation of pneumatic fracturing 69
The stereographic projection figures were interpreted as described in Box 5.1. Box 5.1: How to read stereographic projections of fracture and fabric data obtained from a till.
Stereographic projection of fabric data The circle forming the basis of a stereographic projection of fabric data is a 2D representation of a sphere and reads like a compass. The plotted points represent the intersection between the sphere and the lines given by stones’ dip and dip-direction. The stones found in a basal till deposit are systemati-cally oriented according to the direction of movement of the glacier which deposited the till. Deposition of flow and melt-out tills are more chaotic, and thus their fabric direction is also scattered (Klint, 2001). An example of systematic NW-SE orientation of fabric is seen below (right). This means that the de-posit from which the data have been obtained is a basal till deposited by a glacier moving NW or SE.
N Equal Area (Schmidt)
Axial N = 40
E
+2S
+4S
+6S
+8S
+10S
NEqual Area(Schmidt)
Axial N = 28
E
+2S
+4S
+6S
Stereographic projection of fracture strike and dip data When strike and dip data from fractures are plotted stereographically, horizontal fractures are repre-sented at the center of the circle. Vertical fractures are represented on the rim of the circle. In the exam-ple above (left) the points found along the rim of the circle are seen to fall in two major clusters (which have been given different symbols – squares and circles – accordingly). The fractures of each cluster are oriented perpendicularly to the lines represented by the points. I.e. the vertical fractures represented by the circular points have an almost N-S orientation (see dotted line), while the vertical fractures repre-sented by the squares are oriented SW-NE (see broken line). Performing a cluster analysis in SpheriStat reveals that the square-cluster actually consists of 2 sub-clusters, i.e. the fractures represented by the squares are a conjugated set. The 2 overall fracture planes are represented in the figure by the curved black lines around the broken line. When comparing the orientation of the vertical fractures to the ice movement direction interpreted from the fabric data, one set (the squares) is seen to be perpendicular to the ice movement as determined by the fabric analysis, while the other has an orientation parallel to the ice movement direction. This is consistent with subglacial-tectonic vertical shear fractures and subglacial-tectonic vertical extension fractures respectively. The horizontal fractures represented at the center of the right figure are subse-quently interpreted as subglacial-tectonic shear fractures.

70 Field investigation of a naturally-fractured clay till
5.4.1 Fabric analysis
In the lower fabric analyses a clear pattern of SE-NW orientation of the stones and scour marks is seen, (see Figure 5.8). The upper fabric analysis is more scattered. This was to be expected as the analysis was carried out on a vertical surface. Nonetheless, a tendency of more S-N oriented stones can be inferred. Thus, the till is interpreted as a basal till deposited by an ice sheet, which transgressed the area on an initially north-western trajectory. Later the direction of ice movement over the site, if the upper fabric analysis is trusted, seems to have shifted to a more northbound path. This correlates well with the Late Baltic Advance (Houmark-Nielsen and Kjær, 2001), described in Section 5.2.1: Ge-ology, Glacial history. However, the scatter in the upper fabric could also be representative of a flow till deposit (overlying the basal till deposit).
5.4.2 Classification of natural fractures
Systematic horizontal fractures
A set of subhorizontal fractures were seen from approximately 2-4 m b.s. (see Figure 5.9). These are represented by the black crosses (System 1) in the lower left stereographical figure in Figure 5.8, and may, in accordance with Figure 3.3, be classified as sub-horizontal glacial-tectonic shear fractures (formed in the deforming bed of an advancing glacier). Most of the observed horizontal fractures were coloured in some areas, as shown in Figure 5.9. The colouration is a sign of hydrau-lic activity (see following section).
Figure 5.9: Subhorizontal fractures as encountered in the excavation above and below the redox boundary respectively (and intersected by vertical fractures).
Systematic vertical fractures
Many large vertical fractures transected Profiles 1 and 2 (and thus the horizontal fractures, see Fig-ure 5.9) of the excavation until at least 4 m b.s., see Figure 5.10. Above the redox boundary the fractures were grey. Below, they had ochre-coloured, and in a narrow zone also black, precipitates. This is a typical phenomenon conditioned by redox conditions: In the oxidised zone (above the

Field investigation of pneumatic fracturing 71
redox boundary), decay of organic matter present in the fractures has created reduced conditions leaving the fractures a grey colour, clearly discernible from the surrounding oxidised sediment (of brownish colour). Some of the colour may also be due to fine-grained silty-clayey water-transported fill. In the reduced zone (below the redox boundary) organic matter present in the fractures is undergoing reduction via redox com-pounds migrating (advectively) into the fractures (which are more permeable than the surrounding matrix) from the oxidised zone above. The ochre-coloured and black pre-cipitates illustrate that the fractures have iron- and man-ganese-reducing conditions. A few large vertical fractures without precipitate colour-ation (beyond reach of redox compound migration) were observed to extend below 4 m, but could not be described as they were in the water-filled sump area of the excava-tion. They could be discerned from the way soil fell away from the fracture plane during cleaning of the excavation profiles. No horizontal fractures were observed below 4 m. This might be attributable to their grey colour being indistinguishable from the surrounding grey sediment. These large vertical fractures are interpreted as subglacial-tectonic fractures, and are, via the stereographical projec-tion figures on the left side of Figure 5.8 seen to fall in two major clusters, represented by blue squares and green circles. They are thus divided into two systems: System 2 appears to be to be a conjugated set (two sub-clusters) of vertical shear fractures (having resulted from the glacial-tectonic loading/shear found near the interior of a glacier, see Figure 3.3), as their average strike plane is oriented SW-NE (see Figure 5.8 above) and thus per-pendicular to the early ice movement direction inferred from the lower fabric analyses.
System 3 appears to be a set of vertical subglacial-tectonic extension fractures (having resulted from the ice-tectonic loading found near a glacier margin, see Figure 3.3), as their average strike plane is oriented almost S-N at 2.8 m b.s. and S-N at 1 m b.s. (Figure 5.8) and thus more or less parallel to the late ice movement direction inferred from the upper fabric analysis. The theory that the ice direction altered during the late stage of the glacial advance is thus supported.
Figure 5.10: Vertical fractures (above and below the redox boundary respectively), as encountered in the excavation.

72 Field investigation of a naturally-fractured clay till
Unsystematic fractures
Many root- and wormholes are present in the upper meter of the soil at the Vasby site, see Figure 5.6, while contraction fractures – both vertical and horizontal – of random strike persist until at least 2 m b.s. Their depth likely extends until 3.5-4 m b.s., as the redox boundary was observed at this depth. The observed horizontal contraction (freeze-thaw) fractures are shown in Figure 5.11.
Figure 5.11: Closely spaced horizontal contraction fractures observed at approximately 1 m b.s. in the Vadsby site excavation, December 2005.
Overview of fracture observations
The larger vertical subglacial-tectonic and contraction fractures, as well as the horizontal subgla-cial-tectonic fractures, are emphasised in Figure 5.12, which gives an pictorial summary of the two primary profiles of the excavation.
Figure 5.12: Cross section of excavation showing major vertical fractures (systematic subglacial-tectonic (1-4 m b.s.) and contraction (1-2 m b.s..)) and horizontal fractures (2-3.5 m b.s.). See Appendix S:The excavation profiles for a larger photographic representation.
Oxidised Reduced
+ CaCO3 ÷ CaCO3
0 2.0 4.0 6.0
0
0.5
1.0
1.5
2.0
2.5
3.0
3.5
4.0
Sand lense
Direction of profile: 126o / 120o
N S

Field investigation of pneumatic fracturing 73
5.4.3 Geological history at the site as related by till and fracture observations
The geological history of the Vasby site is, based on the (overview of) fracture observations inter-preted as follows:
1) Glacier transgresses the area from SE to NW (Late Baltic Advance) forming the basal till and System 1 subhorizontal shear fractures in the deforming bed (of the glacier).
2) Continued ice transgression from SE to NW leading to formation of System 2 vertical shear fractures (conjugating fractures) in the non-deforming bed.
3) Ice regression resulting in deposition of flow till (1-1.5 m thick) on top of the basal till. (The basis for the flow till classification is: a) the diverse upper fabric measurements; b) that the area is located at the edge of a dead-ice landscape; and c) that sand lenses charac-teristic of a flow till were observed in upper 1.5 m of Profile 1.)
4) Re-advance of ice from S to N leading to formation of System 3 vertical extension frac-tures. (The basis for the evaluation of a glacier re-advance having taken place and the ex-tension fracture being formed at this time rather than earlier is that the extension fractures cut through the flow till, meaning that a glacier must at some point have overlain this de-posit.)
5) Glacier retreat.
6) Freeze-thaw processes create fissile structures (including unsystematic contraction frac-tures).
7) Desiccation creates random vertical fractures.
5.4.4 Depth and spacing of natural fractures
To obtain values of fracture spacing at the Vasby site, fracture trace frequencies were measured via the profiles of the excavation. Trace frequencies of the naturally-occurring vertical fractures were measured by counting the number of vertical fractures seen over a 2-m horizontal interval at vari-ous depths in the excavation, see Table 5.1. Horizontal fracture trace frequencies were measured by counting the number of horizontal fractures seen over 20-cm intervals from 0.7-4 m b.s., again see Table 5.1. Note that the trace frequencies counted all visible fractures, i.e. contraction and glacial fractures.
Horizontal fractures
The naturally occurring horizontal fractures have their maximum frequency at approximately 1 m b.s. (23 per 20 vertical cm) due to the high number of contraction fractures present here. The fre-quency generally decreases until 4.0 m b.s., where it is 1 fracture per 20 cm (only subglacial frac-tures left). This frequency is not expected to (systematically) decrease further. I.e. the horizontal shear fractures, which are observed in the excavation from 2-4 m b.s., are expected to extend

74 Field investigation of a naturally-fractured clay till
throughout the basal till deposit, given their formation in the deforming bed (along with the till itself). The horizontal fracture trace frequencies are directly convertible to spacing (the reciprocal value of frequency), as their dip is considered negligible. Thus a horizontal fracture spacing of about 1 cm is seen in the near-surface of the till deposit, while a spacing of 20 cm (likely ranging from 10-50 cm; Klint, 2005, personal communication) is expected throughout the basal till deposit.
Vertical fractures
The fact that the till deposit is underlain by sand/gravel (Københavns Amt, 2005a; 2005b) implies good drainage conditions and thus likelihood of the vertical shear and extension fractures travers-ing the entire depth of the till deposit. However, when considering the overall thickness of the till deposit (about 14 m at the site; Københavns Amt, 2005a; 2005b), drainage must be concluded poor, and thus the vertical fractures are not expected to extend very much deeper than observed in the excavation: the secondary water table varies between about 4 and 6 m b.s. in the area (Københavns Amt, 2005a), and thus 6 m b.s. will probably constitute the lower depth limit of the vertical frac-tures. Table 5.1 and Figure 5.13 illustrate that the vertical fracture frequency is at its maximum (17 per horizontal meter) at approximately 2 m b.s. and steadily declines to 0.5 per meter at 4.3 m b.s (this number is statistically unsound due to the small number of data points), which constituted the low-est possible measurement point. The low frequency encountered at this depth is thus expected to continue until maximally 6 m b.s. As the dip of the vertical fractures is considerable (see Figure 5.10), it must be taken into account when calculating their spacing. This has been done in an Excel spreadsheet, see Appendix T: Con-verting vertical fracture trace frequency to spacing for depths of 1 and 2.8 m b.s., as strike and dip were only measured at these depths. Vertical fracture spacing from 1-2.8 m b.s. is thus 12-14 cm (not counting contraction fractures). Disregarding the statistically very uncertain vertical fracture frequency count at 4.3 m b.s. (which converts to a spacing of 2 m withoup dip-correction), the ver-tical fractures are expected to have a spacing of 1-1.5 m from 4-6 m b.s.

Field investigation of pneumatic fracturing 75
Table 5.1: Fracture trace frequency at the Vasby site from 0.7-4.3 m b.s.
Depth [m b.s.]
# of vertical fractures per (horizontal)
meter
# of horizontal fractures per 20 (vertical) cen-
timeters
0.7
0.8 19
0.9
1.0 8.5 19
1.1
1.2 23
1.3
1.4 15
1.5 7
1.6 14
1.7
1.8 9
1.9
2.0 2.1
2
4
2.2
2.3 17 7
2.4
2.5 4
2.6
2.7 14.5 7
2.8
2.9 4
3.0
3.1 12.5 4
3.2
3.3 4
3.4
3.5 12 3
3.6
3.7 2
3.8
3.9 2.25 4.0
1
4.1 4.2 4.3 0.5
Figure 5.13: Fracture spacing at the Vasby site from0.7- 4.3 m b.s.
Horizontal fracture trace frequency
0 5 10 15 20 25
0.7
0.9
1.1
1.3
1.5
1.7
1.9
2.1
2.3
2.5
2.7
2.9
3.1
3.3
3.5
3.7
3.9
4.1
4.3
m b.s.
# of fractures per 20 cm
Vertical fracture trace frequency
0 5 10 15 20
0.7
0.9
1.1
1.3
1.5
1.7
1.9
2.1
2.3
2.5
2.7
2.9
3.1
3.3
3.5
3.7
3.9
4.1
4.3
m b.s.
# of fractures per m

76 Field investigation of a naturally-fractured clay till
5.5 Is the site typical?
To evaluate whether the Vasby site constitutes a typical Danish clay till site, its observed character-istics must be compared to those of the 21 till literature sites discussed in Chapter 3. Characteristics available for comparison are the natural fracture systems (seen from the above to be typical of a Danish basal till), fracture spacing, and redox boundary described in the above. Bulk hydraulic conductivity, discussed earlier in the chapter, was found to be at the higher end of the typical range, while other physical characteristics cannot be compared, as soil descriptions are not yet available.
5.5.1 Vertical fracture spacing
The vertical fracture spacing of the Vasby site is compared to that of other Danish till sites in Fig-ure 5.14 (identical to Figure 3.4, except for the added Vasby data), from which it is seen that the vertical fractures of the Vasby site fall within the typical range.
Figure 5.14: The vertical fracture spacing at the Vasby site compared to other Danish till sites. The Vasby data series consists of the 2 fracture spacing values calculated via the fracture characterisation carried out at 1 and 2.8 m b.s. (~ 3 m b.s.), while the Vasby* data series consists of points in between, inferred from the fracture trace frequency counts given in Table 5.1. The data series Vasby** has been plotted to show the fracture spacings expected for depths greater than 3 m (here the trace frequency counts have not been used, as they are not thought to be statistically accurate/representative). The data for the rest of the sites plotted in the fig-ure, as well as the figure layout are courtesy of K.E.S. Klint.
0 0.5 1 1.5 2 2.5 3
0
0.5
1
1.5
2
2.5
3
3.5
4
4.5
5
5.5
6
6.5
7
7.5
8
.m b.s
Spacing for vertical fractures (m
SilstrupH
aslev 1G
edserFlakkebjergA
vedøreH
avdrupFårdrupLillebæ
kR
antzausgadeSlæ
ggerupR
ingeH
aslev 2K
amstrup
EstrupM
amm
enG
rundførH
øjstrupG
jorslevV
asbyV
asby*V
asby?V
asby**

Field investigation of pneumatic fracturing 77
5.5.2 Redox boundary
The depth of the redox boundary (3.5-4 m b.s., see Figure 5.12) at the Vasby site is also easily compared to that found at other Danish sites via Figure 3.6, from which it is seen that the redox boundary at the Vasby site is more or less coincident with that of several other sites (Flakkebjerg, Lillebæk, and Haslev).
5.6 Conclusions The Vasby site is considered to be a typical Danish basal clayey till site based on the following characteristics:
• 3 sets of systematic glacial-tectonic fractures in addition to unsystematic contraction frac-tures are found at the site.
• The deeper till at the site is a sandy clay basal till with occasional sand stringers. The near surface till may be a flow till (due its more random fabric and more frequent sand lenses).
• The redox boundary varies between 3.5 and 4 m, this is similar to the range observed at other clay till sites.
• The vertical fracture spacing decreases abruptly at the redox boundary. • Vertical fractures are not anticipated to extend beyond about 6 m b.s. at Vasby due to the
drainage conditions. The horizontal fracture spacing at 1 m b.s. is 20 fractures per 20 vertical cm. Between 2-4 m b.s the spacing becomes wider, 1 fracture per 20 vertical cm. Horizontal shear fractures are ex-pected to continue to the bottom of the till unit with a spacing of about 20 cm. The vertical fracture spacing appears typical of other Danish clayey till sites. Between 1 to 2.8 m b.s the spacing of glacial tectonic fractures is about 12 to 14 cm. At 4.3 m b.s the spacing is 0.5 fractures per meter (this value is statistically unsound). Between 4 to 6 m b.s the spacing is estimated to be 1 -1.5 m between vertical glacial tectonic fractures. Only infrequent vertical glacial-tectonic fractures are expected to extend beyond 6 m b.s.


79
CHAPTER 6
FIELD INVESTIGATION OF PNEUMATICALLY INDUCED FRACTURES Chapter 6 presents observations of the pneumatic fracturing process as it was applied at the Vasby field site. The characteristics of the induced fractures observed in the excavation, cores and auger cuttings are described, as well as any apparent relation to geologic features at the site.
6.1 Goals of the field investigation
The overall goal of the authors’ field work associated with the pneumatic fracturing pilot study was to obtain insight into the characteristics of pneumatically induced fractures at a clay-till site. Spe-cifically, the goals were: 1) To compare the characteristics of pneumatic fractures induced in a Danish glacial till to de-
scriptions in the international literature to investigate whether ‘Danish’ fractures are typical. Since experience with fracturing is small in Denmark – the conducted pneumatic fracturing trial is in fact the first of its kind in Denmark – it would be advantageous if the pool of interna-tional knowledge and experience regarding pneumatic fracturing could be applied to Danish sites. In particular the applicability of ‘rules of thumb’ stated in the environmental fracturing literature to a Danish site have been investigated.
2) To produce a detailed description and mapping of the induced pneumatic fractures to investi-gate whether a dense network was formed.
3) To compare characteristics of induced fractures (orientation, spacing and form) to those of natural fractures, and thereby evaluate the influence of natural fractures on the formation of in-duced fractures.

80 Field investigation of pneumatically induced fractures
6.2 Methods The first goal was addressed by the visual inspections and observations made during the fracturing process. The second and third goals have been addressed via visual inspection/characterisation of cores, auger cuttings (retrieved by NIRAS) and the excavation described in Chapter 5. The inspec-tion was facilitated by dye tracer-injection during fracturing. The location and geology of the field site is described in detail in Chapter 5. Figure 6.1 illustrates the location of the site features de-scribed later in the text.
6.2.1 Selection of dye tracer
A mixture of five compounds was injected to address the various goals of the projects conducted at the Vasby site: uranine, rhodamine WT, optical white, bromide, and brilliant blue*. Brilliant blue was chosen, as the authors’ investigation required a tracer that would be visible under daylight conditions, but not interfere with the analysis of fluorescent dye tracers and bromide. Testing and selection of a suitable tracer was an important part of the pre-fracture planning (see Appendix U: Tracer investigations). Brilliant blue was thus (in the form of pre-mixed food colouring) mixed with the other tracers prior to injection in a ratio of 1 L brilliant blue per 50 L fluorescent tracer-bromide mixture.
6.2.2 Visual inspection of geoprobe cores and comparisons with auger cuttings
Four cores, one prior to fracturing, and three post-fracturing were obtained by NIRAS in clear plas-tic tubes using a geoprobe. A description of the handling of the cores and the authors’ role in the laboratory activities are discussed in Appendix V: Laboratory investigation of fluorescent tracers in cores KF0-KF3. The description of cores under daylight conditions and sediment analyses per-formed by the authors is found in Appendix Q: Soil survey method and description of cores KF0 – KF3. The geology of the overburden based on the cores is a sandy clay as observed in auger sam-ples and previous investigations at the site (Københavns Amt 2005a; 2005b). Data sheets including borelogs and location of induced fractures in the M-wells have been provided by NIRAS and re-ported in Københavns Amt (2006).
* The fluorescent tracers, uranine and rhodamine WT, permit easy analysis of water samples (using a fluorometer), while optical white is well-suited for detection by an FFD-probe. The 3 tracers thus facilitate documentation of the hydraulic radius of influence of the pneumatic fracturing, as well as documentation of induced fractures and diffusion via ultravio-let inspection. The tracer results were compared against bromide, a conservative tracer.

Field investigation of pneumatically induced fractures 81
Figure 6.1: Plan view of fracturing and monitoring installations and the excavation at the Vasby field site. PF1 is the fracturing well. T1 to T4 are monitoring wells installed prior to fracturing. T1 was removed during the excavation. M1 to M6 represent the locations of auger drilling to inspect cuttings for evidence of induced fractures. Geoprobe cores were taken at KF0 to KF3. Uplift was measured at PT1-3. The undulating purple lines represent the two induced fractures observed in the excavation. The dotted line A ‒ A’ represents the location of a cross section (Figure 6.10). The green dotted lines represent location of surface venting in addi-tion to that observed in wells. Distances between points may not be exact as they were measured in, but not surveyed.
6.3 Observations from the pneumatic fracturing process Based on the literature search, observations that were considered relevant for a later comparison of this pilot study with the technology description in Chapter 2 and other reports were recorded. The most important observations are discussed in the following. A table comparing rules-of-thumb regarding fracturing practices and results is found in Appendix W: Selected field observations from the Vasby pneumatic fracturing pilot study.
PF1
T1
M1
T3
T4
M2
M3
M6
M5
M4
KF1
KF3
KF2 X PT1X PT3
X PT2
0 m 1 m 2 m 3 m 4 m 5 m
N
A
A
KF0
T2
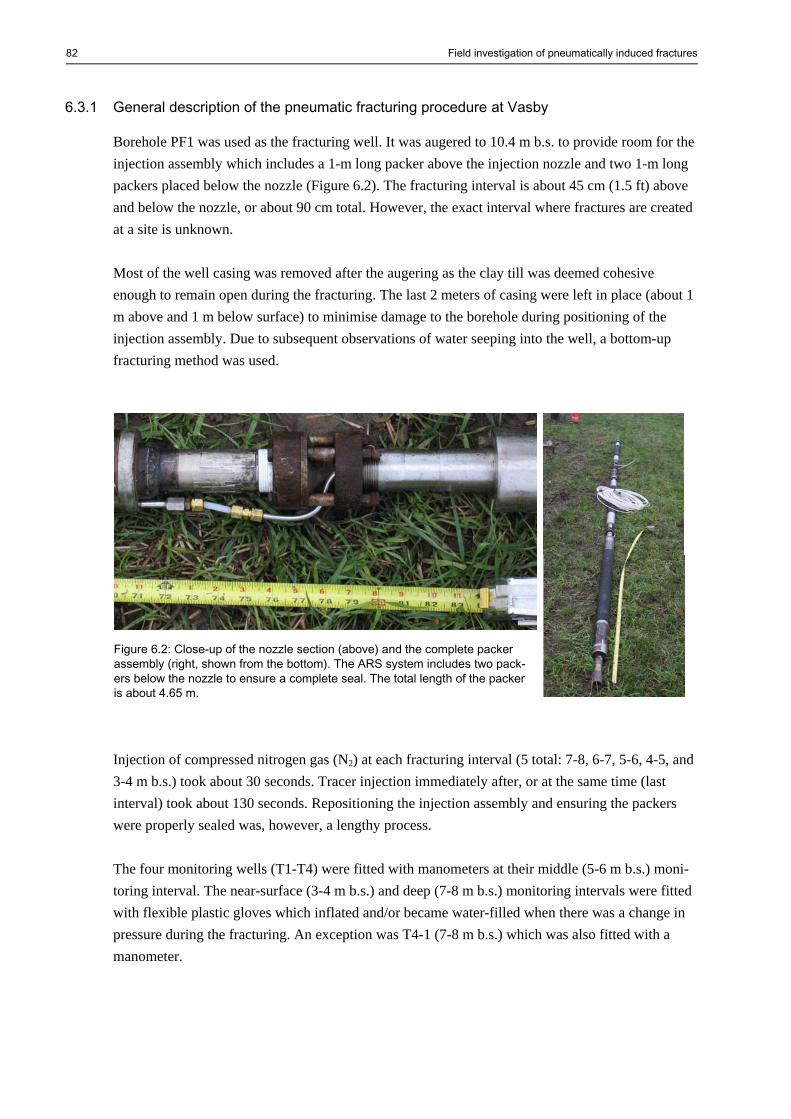
82 Field investigation of pneumatically induced fractures
6.3.1 General description of the pneumatic fracturing procedure at Vasby
Borehole PF1 was used as the fracturing well. It was augered to 10.4 m b.s. to provide room for the injection assembly which includes a 1-m long packer above the injection nozzle and two 1-m long packers placed below the nozzle (Figure 6.2). The fracturing interval is about 45 cm (1.5 ft) above and below the nozzle, or about 90 cm total. However, the exact interval where fractures are created at a site is unknown. Most of the well casing was removed after the augering as the clay till was deemed cohesive enough to remain open during the fracturing. The last 2 meters of casing were left in place (about 1 m above and 1 m below surface) to minimise damage to the borehole during positioning of the injection assembly. Due to subsequent observations of water seeping into the well, a bottom-up fracturing method was used.
Injection of compressed nitrogen gas (N2) at each fracturing interval (5 total: 7-8, 6-7, 5-6, 4-5, and 3-4 m b.s.) took about 30 seconds. Tracer injection immediately after, or at the same time (last interval) took about 130 seconds. Repositioning the injection assembly and ensuring the packers were properly sealed was, however, a lengthy process. The four monitoring wells (T1-T4) were fitted with manometers at their middle (5-6 m b.s.) moni-toring interval. The near-surface (3-4 m b.s.) and deep (7-8 m b.s.) monitoring intervals were fitted with flexible plastic gloves which inflated and/or became water-filled when there was a change in pressure during the fracturing. An exception was T4-1 (7-8 m b.s.) which was also fitted with a manometer.
Figure 6.2: Close-up of the nozzle section (above) and the complete packer assembly (right, shown from the bottom). The ARS system includes two pack-ers below the nozzle to ensure a complete seal. The total length of the packer is about 4.65 m.

Field investigation of pneumatically induced fractures 83
6.3.2 Field and monitoring observations
Initiation and propagation pressures
The initiation and propagation pressures applied at the various fracturing intervals at Vasby are listed in Table 6.1. Typical values summarised from the literature and rule-of-thumb values are included for comparison. While initiation and propagation pressures are site- and operation-specific (meaning also affected by flow rate, etc.; EPA, 1994; Suthersan, 1999), the initiation and propaga-tion pressures employed at the Vasby 7-8 m fracturing interval are both noted to be significantly higher than required. They fall within the typical range, however. The initiation pressures used at the shallower fracturing depths at the Vasby site are conversely, lower than the typical range, but show better agreement with the calculated required pressures. Table 6.1: Comparison of typical initiation and propagation pressures with those applied at the Vasby site. Data for the employed pressures found in ARS (2005b). Typical values are based on the literature search and summarised in Table 2.2.
Fracturing Interval (m b.s.) Parameter Typical values
7-8 6-7
5-6
4-5 3-4
Initiation pres-sure, employed [kPa (psi)]
500-2000 kPa (USDOE, 1989); 73-145 psi (EPA, 1994); about 700 at ~6 m b.s. (Suthersan, 1999)
862 (125)
414 (60)
379 (55)
310 (45)
276 (40)
Initiation pres-sure, required [kPa (psi)]
Rule-of-thumb: 2-3 psi per foot of overburden required to initiate frac-ture at certain depth (Schuring, 2002)
310-469 (45-68)
297-441 (43-64)
248-372 (36-54)
207-303 (30-44)
152-235 (22-34)
Propagation pressure [kPa (psi)]
Generally less than initia-tion pressures (Figure 2.2)
586 (85)
276 (40)
138 (20)
138 (20)
138 (20)
Interestingly, ARS (2005b) have an example of pneumatic fracturing data from a clay site at 5 m b.s. where initiation and propagation pressures (120 and 85 psi, respectively) were significantly higher than those used at 5-6 m b.s. at Vasby (55 and 20 psi, respectively), but match those used at the Vasby 7-8 m fracturing interval. This suggests that the overburden at the Vasby site may differ from sites with which the consultants have experience, perhaps due to the natural fracture density. However, graphs of pressure over time for each fracturing interval at Vasby (data not shown, but supplied by ARS, 2005b) appear typical of those depicted in the literature (see Figure 2.2).
Pressure effects
Relative pressure measurements were made by monitoring the manometers installed in the middle monitoring depth of each monitoring well, and that installed in the deep filter of T4. Qualitative observations of the remaining monitoring depths of each well were made via the fitted plastic gloves. The observed results, as well as observations of surface venting are listed in Table 6.2. The rapid response of tracer venting in monitoring wells T1 and T4 during fracturing at 5-6, 4-5 and 3-4

84 Field investigation of pneumatically induced fractures
m b.s. was explained by the ARS consultants as the creation of a ‘tunnel’ between the injection well and these monitoring wells. The surface venting at the site became more pronounced during the shallower fracturings. Monitor-ing wells T1 and T4 were rendered unusable due to jetting-out of the bentonite seals, observed as tracer-coloured mud exiting the wells. Short-circuiting in, or along the fracturing well is suggested by the spray observed exiting PF1 and green tracer bubbling out of the ground near PF1. Table 6.2: Pressure observations made during the pneumatic fracturing. Monitoring well depth 1 is 7-8 m b.s., depth 2 is 5-6 m b.s., and depth 3 is 3-4 m b.s. The units on the pressure gauges are unknown, but the gauge readings are used as a relative indication of some pressure effect observed at the monitoring wells. ‘-‘ signifies no data recorded. Compromised refers to the observed jetting-out of the bentonite seal around monitoring wells T1 and T4.
Fracturing interval (m b.s.)
Monitoring well no. and
depth
7-8 6-7 5-6 4-5 3-4
T1-1
>0 ‘Compromised’ ‘Compromised’ ‘Compromised’
T1-2
>0 0 ‘Compromised’ ‘Compromised’ ‘Compromised’
T1-3
Water Water & gas ‘Compromised’ ‘Compromised’ ‘Compromised’
T2-1
0 0 0 - -
T2-2
0 0 0 0 0
T2-3
0 Water & gas >0 - -
T3-1
0 Water & gas 0 - -
T3-2
1 >0 0 0 0
T3-3
Water & gas Water & gas Water & gas - -
T4-1
>0 2.4 ‘Compromised’ ‘Compromised’ ‘Compromised’
T4-2
1.5 0 ‘Compromised’ ‘Compromised’ ‘Compromised’
T4-3
0 Water & gas ‘Compromised’ ‘Compromised’ ‘Compromised’
VentingA (g: gas) (t: tracer)
10 m NW (g) 6 m WB (g)
4 locations 8.5 to 10 m NW (g); 6 m W (t); T4 (t,red)
Spray observed out of PF1; In and around T1 (t, green); In and around and T4 (t)
6 m W T1: red spray T4: tracer exit-ing well and annulus
T1 and T4: tracer exiting wells and annu-lus
A Venting locations are relative to PF1. B This location 6 m west of PF1 is the location of an abandoned geoprobe boring (loosely backfilled).
Tracer injection rate
The tracer-injection rate employed at the 7-8 m fracturing interval (26.6 m3/minute; ARS, 2005b) falls within the typical range of values for pneumatic fracturing (25 – 50 m3/ minute; US DOE, 1998), while the injection rates employed at subsequent intervals above (6.8 – 21.2 m3/minute; ARS, 2005b) were low. These low injection rates were, however, adequate to cause tracer appear-ance in T1 and T4 during fracturing at the more shallow elevations, as well as at venting locations even further from PF1 at deeper fracturing levels (Table 6.2).

Field investigation of pneumatically induced fractures 85
Uplift and estimated fracture aperture
The uplift, or surface heave was measured before, during, and after each pneumatic fracturing seg-ment, as well as during and after tracer injection, see Figure 6.3 a and b. Data from PT1 is not included but is known to be similar to the PT2 and PT3. Some of the later data is missing as it became too dark to see the survey rods. Furthermore, there is some discrepancy between this data and that supplied by ARS (2005b)†. The total uplift, and thus a rough estimate of the total sum of induced fracture apertures is obtained by subtracting the start elevation before the 7-8 m fracturing from the resid-ual elevation after fracturing at 3-4 m. Thus, the total heave for the entire fracturing process ranges be-tween 0.7 cm to greater than about 0.8 cm (0.25 to ~>0.3 inches). Exact values cannot be calculated since final residual data is missing. Divid-ing the total uplift (about 0.7 cm), by the number of fracturing intervals (5), gives an average fracture aper-ture of 0.14 cm. This value is greater than the typical range of fracture apertures (0.05 – 0.1 cm, Chapter 2) and implies that more than 1 fracture has been created per fracturing in-terval.
Lack of correlation between the surface elevation observed after a particular fracturing event and that observed before the following fracturing event suggest a further collapse of the fractured for-mation. This is observed at all elevations (with the exception of 7-8 m) in Figure 6.3a and at 5-6 m
† The data given by ARS for PT2 is in fact data for PT3 located 3 m southwest of PF1, Similarly the data given for PT3 is in fact data from PT2 located 3 m north of PF1. The ARS data gives only max. total heave (tracer max elevation minus start elevation) and residual (max residual elecation minus start elevation). Not all ARS and field data agree.
a
b
Uplift measured at PT2
34.534.634.734.834.9
3535.135.235.335.4
7-8m 6-7m 5-6m 4-5m 3-4m
Fracturing depths m b.s
Inch
es o
f upl
ift
start
max
residual
tracer
residual
after ½ hr
Uplift measured at PT3
34.5
34.7
34.9
35.1
35.3
7-8m 6-7m 5-6m 4-5m 3-4m
Fracturing depths m b.s
Inch
es o
f upl
ift
start
max
residualtracer
residual
after ½ hr
Figure 6.3a and b: Uplift measured at a) PT2 and b) at PT3. Start refers to the pre-fracturing elevation. Max refers to the maximum uplift observed during pneumatic fracturing. The yel-low residual values refer to the residual uplift, meaning the uplift measurable after fracturing has ceased. Tracer refers to the maximum uplift measured during tracer injection. The dark pur-ple residual values refer to the residual uplift measured after tracer injection has ceased. After the fracturing at 6-7 m the residual uplift after tracer injection was measured a half hour after tracer injection ceased. Some collapse of the fracture ap-pears apparent.

86 Field investigation of pneumatically induced fractures
in Figure 6.3b. Similarly, measurements of the residual uplift a half hour after fracturing at 6-7 m revealed a further reduction in uplift compared to that measured immediately after tracer injection. This reduction was associated with a slow seepage of red tracer-bentonite mixture out of T1 (from unknown depth(s)). The residual heave (the uplift measured after injection has ceased) decreased as the fracturing interval became shallower. At some depths, no residual heave was measurable.
6.4 Location of induced fractures as observed in the excavation The excavated area included the west edge of the fractured area (including monitoring well T1) and two areas where surface venting was observed. As listed in Table 6.2, surface venting was observed about 6 m west (in an abandoned geoprobe hole (KF0) during the pneumatic fracturing at 7-8 (gas venting) and 6-7 m b.s. (green tracer vent-ing). The geoprobe hole was visible during the excavation at about 1 to 1.5 m depth as an open cylindrical hole filled with green-coloured liquid (uranine). However, no induced fractures were visible beside or below this feature that would appear to connect it to one (or more) of the fractured depths in PF1. Similarly, surface venting of first gas at 10 m northwest (during tracer injection at 7-8 m b.s.) and later gas followed by green tracer at four points ranging in distance from 8.5 to 10 m northwest of PF1 was observed during injection at 6-7 m b.s. These locations were excavated, but no evidence of tracer was observed. Two induced fractures were clearly visible in the excavation 5½ days after completion of the pneumatic fracturing. The fractures were exposed at a distance of 4.84 m and 6.44 m respectively from the fracturing borehole, PF1 (Figure 6.1). The visible length of the fracture closest to PF1, henceforth Fracture 1, was over 4 m (Figure 6.4 and 6.5) while the other fracture, henceforth Frac-ture 2, was visible over a distance of almost 2 m, see Figure 6.5 and 6.6.
Figure 6.4: Initial exposure of Fracture 1 in the excavation, looking north.
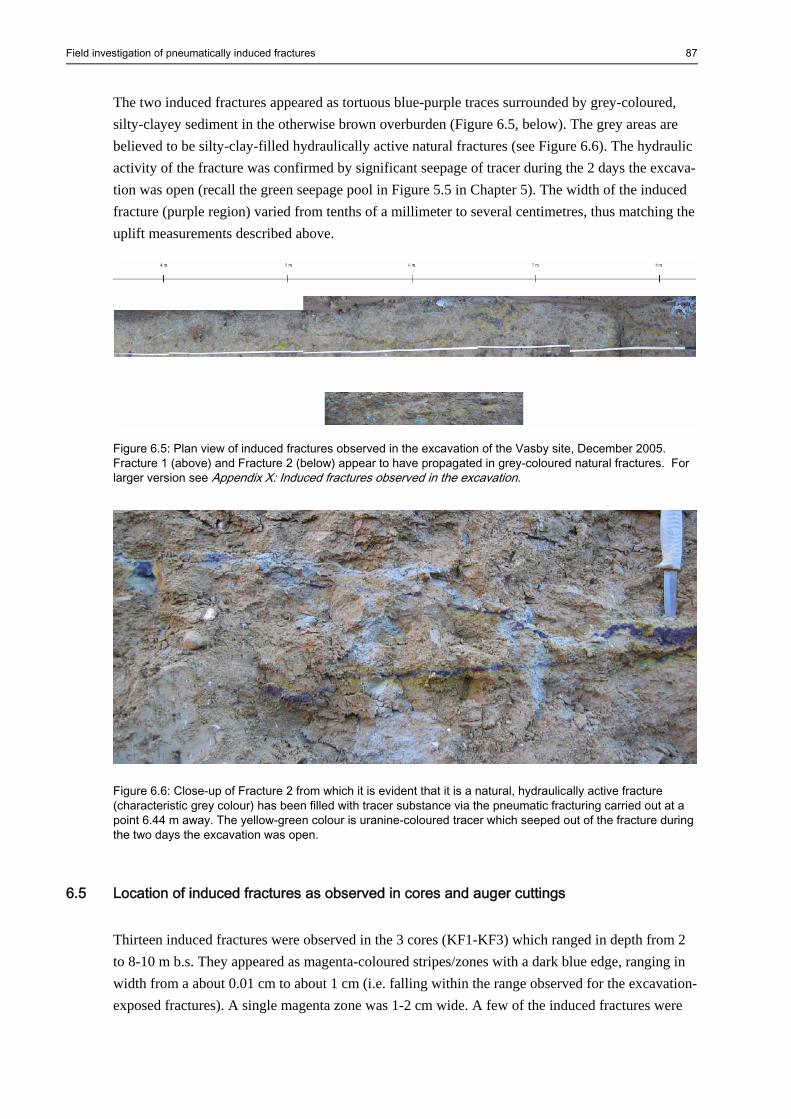
Field investigation of pneumatically induced fractures 87
The two induced fractures appeared as tortuous blue-purple traces surrounded by grey-coloured, silty-clayey sediment in the otherwise brown overburden (Figure 6.5, below). The grey areas are believed to be silty-clay-filled hydraulically active natural fractures (see Figure 6.6). The hydraulic activity of the fracture was confirmed by significant seepage of tracer during the 2 days the excava-tion was open (recall the green seepage pool in Figure 5.5 in Chapter 5). The width of the induced fracture (purple region) varied from tenths of a millimeter to several centimetres, thus matching the uplift measurements described above.
Figure 6.5: Plan view of induced fractures observed in the excavation of the Vasby site, December 2005. Fracture 1 (above) and Fracture 2 (below) appear to have propagated in grey-coloured natural fractures. For larger version see Appendix X: Induced fractures observed in the excavation.
Figure 6.6: Close-up of Fracture 2 from which it is evident that it is a natural, hydraulically active fracture (characteristic grey colour) has been filled with tracer substance via the pneumatic fracturing carried out at a point 6.44 m away. The yellow-green colour is uranine-coloured tracer which seeped out of the fracture during the two days the excavation was open.
6.5 Location of induced fractures as observed in cores and auger cuttings Thirteen induced fractures were observed in the 3 cores (KF1-KF3) which ranged in depth from 2 to 8-10 m b.s. They appeared as magenta-coloured stripes/zones with a dark blue edge, ranging in width from a about 0.01 cm to about 1 cm (i.e. falling within the range observed for the excavation-exposed fractures). A single magenta zone was 1-2 cm wide. A few of the induced fractures were

88 Field investigation of pneumatically induced fractures
open, but it is uncertain whether this occurred as a result of handling the cores. A single green-coloured fracture was observed. Some of the fractures were also associated with a thin yellow-green (uranine) coloured halo. Induced fractures were also easily observable in cuttings from the auger drilling at M1-M6 (0-8 m b.s.; M3 drilled to 9 m b.s.; data supplied by NIRAS). Due to the disturbance of the augered sam-ples, widths and apertures were not measurable. Orientation (horizontal vs. vertical) was also dis-turbed to some degree. The tracer colour in the auger cuttings was magenta, and areas with green tracer were also observed.
6.5.1 Observed orientation
The induced fractures observed in the cores were predominately horizontal (Figure 6.7a). Fractures in a core described as spanning more than 2 cm are likely vertical, subvertical, tortuous, and/or a fracture plane transversed the core, i.e. the fractures themselves were not assessed to be several centimetres thick (see for example Figure 6.7b). Fracture spacing ranged from about 1 cm to 2 m to massive. In the auger drillings M1 and M3, areas with extensive tracer colouration were observed (2.5 to 2.6 m b.s. and 2.4 to 5 m b.s., respectively). The induced fracture spacing in these disturbed samples is unknown.
Figure 6.7: (a)Three predominately horizontal induced fractures observed in Core KF2 (at 5.29, 5.30 and 5.32 m b.s.). (b) A tortuous fracture plane in core KF3 (at 5.81 to 6.00 m b.s.). Core KF2 was obtained 06-12-2005 and inspected/photographed 07-12-2005. Core KF3 was obtained 8-12-2005, photographed 9-12-2005, tex-ture and fractures described 12-12-2005. Fracturing took place 06-12-2005.
6.5.2 Correlation to natural fractures
No induced fractures were observed in the more sandy regions of the cores. However, induced fractures were observed in narrow sand lenses (3 times) and directly above an area of oxidized clay till (one time) in the auger cuttings. Based on the literature, fractures would be expected to follow
a b

Field investigation of pneumatically induced fractures 89
the path of least resistance and thus propagate along the sand stringers, if such features are present at the fracture well. Only one induced fracture was located in an area with the ochre-colouration associated with natural fractures (Figure 6.8). In the cores, no induced fractures were associated with the grey coloured fractures.
Figure 6.8: An induced fracture in KF2 at about 2.75 m b.s. associated with ochre discolouration, suggesting that the induced fracture propagated along an existing natural fracture. This is the only case (out of 13 induced fractures identified in Cores KF1-3) where an induced fracture was observed in association with an existing fracture.
6.6 Compilation of data regarding fracture extent, orientation, and form The observations of induced fractures at various depths in plan view are presented in Figure 6.9a-f. The shape of the plan view fracture radii is partly a function of the small number of monitoring points. The ‘fracture’ diameter is at least 10 m. Based on the rule-of-thumb regarding depth and induced fracture diameter, a diameter of 15 to 20 m would be expected at this depth. While the lateral extent of some fractures may be greater than the estimates based on core and auger cuttings, other fractures are known to have vented to the surface. Nevertheless, the extent of the fractures induced in the fracture field appears relatively widespread.

90 Field investigation of pneumatically induced fractures
a b
c d
e f
Figure 6.9a-f: Plan view of location of induced fractures based on visual inspection of cores, auger cuttings and pressure effects. The colours represent the following: purple: the M1-M3 auger cuttings data; light blue: core data; bright geen: surface venting; light green: pressure effects. The following depths are repre-sented: a) 2-3 m b.s.; b) 3-4 m b.s.; c) 4-5 m b.s.; d) 5-6 m b.s.; e) 6.5-7.0 m b.s.; f) 7.0-7.5 m b.s. The eleva-tion of the cores has an uncertainty of +/- about 10 cm.

Field investigation of pneumatically induced fractures 91
6.6.1 Radius of Influence
The radius of influence (radius extending beyond the physical extent of the fractures in which an effect on hydraulic conductivity, mass removal rates, etc. is measurable) is expected to extend about three times beyond the physical extent of the induced fractures (Nilsson et al., 2000; Blem et al., 2004). Unfortunately, determining the radius of influence of the induced fractures requires knowledge of the pre-fracturing conditions determined via slug tests, pump tests, tracer tests and/or vapour extraction tests to which post-fracturing testing may be compared. This oversight makes it difficult to compare the fracturing results at the Vasby site to the international literature. However, surface venting of gas and tracer during injection at 7-8 m b.s. at about 6 and 10 m from PF1 are evidence of a radius of influence of at least 10 at this depth.
6.6.2 Pancakes vs. spokes
When the site geology and location of induced fractures (based on cores, auger cuttings and the excavation) are presented as a cross section, the location of the fractures appears more random than in the plan view data (Figure 6.10). The cross section suggests that there may be several fractures of considerable subhorizontal extent climbing toward the surface, as the literature describes. The other data are less conclusive. This suggests that not all the induced fractures are continuous across a depth or depths, but may have a spoke-like or tortuous propagation over depth. At some locations (i.e. M3 2.5-5 and 5.7-5.8 m b.s., and M1 2.5-2.6 m b.s.) a dense fracture network appears to have been created. The data is not adequate to determine if these fractures are part of a larger intercon-nected fracture network. The cross section does not depict a clear relationship between the injection intervals and the depths of the fractures. A fracture appears to have been induced at 2.5 m b.s., although the shallowest frac-turing depth was 3-4 m b.s. Furthermore, fractures appear to have been induced at the depth of the injection nozzle (middle of the fracturing interval) as well as at the top and bottom of the interval.
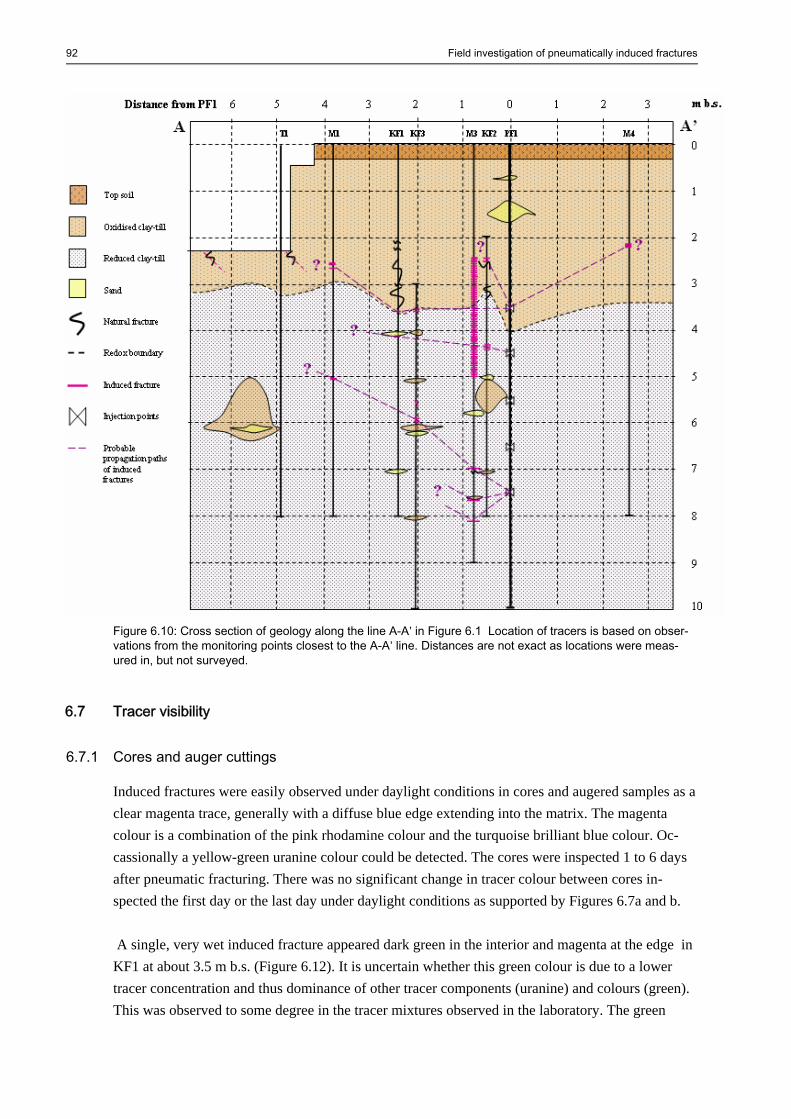
92 Field investigation of pneumatically induced fractures
Figure 6.10: Cross section of geology along the line A-A’ in Figure 6.1 Location of tracers is based on obser-vations from the monitoring points closest to the A-A’ line. Distances are not exact as locations were meas-ured in, but not surveyed.
6.7 Tracer visibility
6.7.1 Cores and auger cuttings
Induced fractures were easily observed under daylight conditions in cores and augered samples as a clear magenta trace, generally with a diffuse blue edge extending into the matrix. The magenta colour is a combination of the pink rhodamine colour and the turquoise brilliant blue colour. Oc-cassionally a yellow-green uranine colour could be detected. The cores were inspected 1 to 6 days after pneumatic fracturing. There was no significant change in tracer colour between cores in-spected the first day or the last day under daylight conditions as supported by Figures 6.7a and b. A single, very wet induced fracture appeared dark green in the interior and magenta at the edge in KF1 at about 3.5 m b.s. (Figure 6.12). It is uncertain whether this green colour is due to a lower tracer concentration and thus dominance of other tracer components (uranine) and colours (green). This was observed to some degree in the tracer mixtures observed in the laboratory. The green

Field investigation of pneumatically induced fractures 93
colour may also be due to insufficient mixing of the tracer mixture and/or separation of tracer com-ponents in the underground.
Figure 6.12: An induced fracture observed in KF1 at about 3.5 m b.s. The dark green colour may be due to lower diluted concentration, relative to the more frequently observed red-coloured tracer.
6.7.2 Excavation
Unlike the induced fractures observed in geoprobe cores and auger cuttings, the excavated fractures had a much more blue-purple colour. This colour may have been due to more rapid diffusion of rhodamine (and uranine) into the matrix than brilliant blue and consequently a change in the com-bined tracer colour. Diffusion of rhodamine and uranine was confirmed by laboratory analysis per-formed for the previously-mentioned research project at the Vasby site which showed uranine diffusion into the matrix and rhodamine retardation in the fractures (Københavns Amt, 2006). The blue-purple colour observed in the excavation may also have been due to light-sensitive degrada-tion of the fluorescent tracers, however the intensity of uranine seeping out of the fractures and puddling in the excavation did not appear to diminish during the two days the excavation was open.
6.8 Conclusions Observations of uplift, initiation pressures, and propagation pressures, as well as pressure effects such as surface venting and apparent short-circuiting in or along PF1 suggest that the application of pneumatic fracturing technology at the Vasby site differed from typical practices and/or the site characteristics may differ from international sites. Induced fractures observed in the excavation appear to have propagated along existing hydrauli-cally active fractures. Evidence from the cores and auger cuttings is less conclusive. Induced frac-

94 Field investigation of pneumatically induced fractures
ture spacing ranges from about 1cm to 2 m, to massive. While localised areas of dense induced fractures were observed at a few depths, evidence of the ability of pneumatic fracturing to create a dense fracture network was not conclusive. The induced fracture data in plan view suggest that the fractures may be relatively extensive and continuous. The cross-section data suggest the presence of some continuous induced fractures ex-tending outwards from PF1 at several depths. However, the form of other fractures in the cross section appears more random. This may in part be due to the sparse data across the site. The form of the other fractures may be more spoke-like or tortuous. The fracture radii and radii of influence cannot be determined based on the available field information (but are at least 6.44 and 10 m re-spectively). Fracture apertures (0.14 cm) calculated using uplift measurements are higher than typical values reported in the literature (0.05 – 0.1 cm), but within the range reported in the case studies. Aper-tures estimated from uplift must be used with caution. Field uplift data suggest that the formation continued to collapse even a half hour after tracer injection was complete. Consequently, uplift values likely overestimate actual apertures of induced fractures. In the excavation, the induced fracture apertures ranged from tenths of millimetres to several centimetres. In cores the width of magenta tracer ranged from less than 0.1 to about 1 cm. The apparent formation collapse raises concerns regarding the longevity of pneumatically induced fractures. Brilliant blue (alone or mixed with other tracers, as was the case in this study) is an extremely visi-ble tracer under daylight conditions in both cores and the excavation at the concentration injected and in the width of fractures observed at the field site.

95
CHAPTER 7
DISCUSSION
7.1 Hypothesised method of induced fracture propagation at the Vasby site The form of multiple induced fractures is often described in the summary literature as stacked pan-cakes or shallow- to steep-sided bowls (EPA, 1994, Suthersan, 1999, Nilsson et al, 2000). Authors of some field studies, however, describe less continuous fracture forms. Markesic (2000) in his excavation of the Laidlaw pneumatic fracturing site (Canada), observed induced fracture propaga-tion in ‘very discreet and tortuous vertical planes’. Strong et al. (2004) described the induced frac-tures as propagating horizontally and vertically in an ‘irregular lobed pattern’. Bures (1998) who is a hydraulic fracturing contractor, states that fractures are rarely perfectly radial or horizontal. These descriptions, while apparently contrasting, may in fact be manifestations of fracture propagation that is affected by the local geologic features at a particular site. This suggestion is supported by summary articles (EPA, 1994; Suthersan, 1999; Kidd, 2001) claiming that fractures will tend to propagate along a ‘path of least resistance’. Suthersan continues that particularly pneumatic fac-tures will tend to propagate along existing fractures. Field evidence, though limited, concurs. At the Laidlaw site, vertical contraction fractures (extending to > 7 m b.s.) have a random and closely spaced pattern. Here, Markesic (2000) observed vertical and tortuous outward propagation of in-duced fractures in existing vertical fractures. Similarly, Strong et al. believe that the induced frac-ture shape (inferred from uplift data) was due, in part, to site heterogeneities. Induced fracture propagation at the Vasby site is hypothesised to be influenced by the existing frac-ture network. Induced Fractures 1 and 2 (observed in the excavation) are believed to have propa-gated along (sub)horizontal glacial-tectonic shear System 1 fractures, venting to the surface via (sub)vertical glacial-tectonic shear System 2 fractures. A conceptual model of the hypothesised propagation of these two fractures is depicted in Figure 7.1. The relationship between Fractures 1 and 2 and the natural fracture system is depicted in Figure 7.2. At least two horizontally propagating induced fractures are assumed to have created the induced fractures observed in the excavation, because once a fracture vents to the surface it would likely not

96 Discussion
have enough backpressure to continue horizontally. However, it is possible that more than two horizontally propagating fractures have vented along the same vertical paths. For example Fracture 2 may have been formed by venting from the 7-8 and 6-7 m fracturing intervals, and Fracture 1 could have been formed via venting from the 5-6 m fracturing interval. However, venting in the monitoring wells 5 m from PF1 during fracturing of the 5-6, 4-5, and 3-4 m b.s. intervals suggests that injections at these levels would not have adequate backpressure to propagate further. Evidence from core and auger cutting observations to support this theory of fracture propagation along naturally-occurring fractures is less conclusive. Only one of the induced fractures observed in the cores (13 total in 3 cores) was observed within the trace of a natural fracture with ochre precipi-tates (Figure 6.8). Auger cuttings revealed no association between natural and induced fractures. Nevertheless, it is possible that induced fractures travelled along naturally-existing fractures, or other ‘weaknesses’ but that these were not discernable in the disturbed core and auger samples. Considering that natural fractures were ‘invisible’ at about 1 m below the redox boundary (meaning not associated with a coloured fill or precipitate), a natural fracture plane could easily be over-looked in cores and auger cuttings. Some of the cores did break smoothly along a plane, but such breaks may have been created during handling. At the Laidlaw site, Markesic (2000) took 12 con-tinuous vertical cores within 2 meters of the injection well in an attempt to document preferred tracer pathways through induced and natural fractures, but was unable to find evidence of these pathways.
Figure 7.1: Conceptual model of hypothesised induced fracture propagation at the Vasby field site resulting in the creation of induced Fractures 1 and 2 (observed in the excavation). The induced fractures are believed to have propagated along (sub)horizontal glacial-tectonic System 1 shear fractures, venting to the surface via (sub)vertical glacial-tectonic System 2 shear fractures.

Discussion 97
Figure 7.2: Conceptual model illustrating the relationship between the induced Factures 1 and 2 observed in the excavation (purple traces) and the naturally-occurring System 2 glacial tectonic fractures (represented by the transparent planes extending out from the observed System 2 fractures on the north profile of the excava-tion). The field observations from the Vasby site suggest that fractures do propagate along paths of least resistance and that these pathways determine the shape and extent of the induced fracture network. Consequently, geological features such as faults, permeable stringers or lenses and particularly naturally-occurring fractures play an important role on the form and extent of an induced fracture network that may be achieved at a particular site.
7.2 Implications regarding creation of a dense fracture network Pneumatic fracturing is typically described as producing a dense network of small-aperture frac-tures over the entire fractured interval (US DOE, 1998; Strong et al., 2004; ARS, 2005a). Pneu-matic fracturing is also said to extend existing fractures and create a secondary network of fissures and channels (EPA, 1995). However, the above discussion raises the question of whether this is in fact possible. Based on the theory of fracture propagation along the path of least resistance, the existing fracture network (and other permeable features) likely determine the maximum possible density of an in-duced fracture network at a site. If fact, the potential extent of an induced network may be further limited by the spacing of the hydraulically-active natural fractures, since these represent open pathways for propagating fractures. Markesic (2000) conducted two tracer tests at the Laidlaw site, one with potassium permanganate (KMnO4) three weeks prior to pneumatic fracturing to delinate

98 Discussion
the hydraulically-active natural fractures, and the other with brilliant blue during the fracturing to delineate the induced fractures. He found that induced fractures propagated predominately in the hydraulically active fractures, although there may have been locations were the pneumatic fractures ‘jumped’ between active fractures via inactive natural fractures and/or induced pathways. Other investigations involving dye tracer tests indicate that the percent of natural fractures that are hydraulically active at a site may vary between about 10% (Klint, 2001) and 13 to 23% (Jørgensen et al., 2003). Furthermore, asperities in natural fractures may act as barriers to the passage of in-jected gas or tracer, as has been observed with DNAPL (O’Hara et al., 2000). The ability of EPM models to match near- surface tracer data (i.e. 3 and 2.5 m b.s.) (McKay et al., 1993c; Sidle et al., 1998, respectively) but not deeper tracer data (>3 and > 4 m b.s., respectively) suggests that a greater proportion of natural fractures are hydraulically active near-surface than at depth, although some of this effect in EPM models may also be due to decreasing vertical fracture spacing. Consequently, if the natural vertical fracture spacing of 12-14 cm at the Vasby site until at least 3.5 m b.s. is considered and only 10% of these are hydraulically active, then a vertical induced fracture spacing of about 1.2-1.4 m would be expected due to venting. The distance between Fracture 1 and 2 is about 1.6 m measured along the exposure. The true distance between these features is less, however, due to their dip towards the fracturing well, and is thus similar to the expected induced fracture spacing based on hydraulically active fractures. An average natural vertical fracture spac-ing based on observations made at typical Danish sites is about 27 cm (Table 3.2). Thus, a spacing of about 2.7 m between vertical induced fractures may be achievable at Danish sites. The depth range of this spacing may be highly variable. Horizontal spacing at the Vasby site between 2-3.5 m b.s is about 5 cm. If only 10% of these are active, an induced fracture spacing of about 40 cm would be achievable. Figure 6.10 shows that at some locations an induced fracture spacing of 1 cm to about 50 cm is observed within this zone. Site-wide, a horizontal induced fracture spacing of 1 cm to 2 m to massive was observed. Likely, the horizontal fracture propagation is a function of whether a hydraulically active natural fracture intersects the fracturing interval at the depth in question. This may explain the apparent lack of correlation between the depth of the injection nozzle (in the middle of the fracture interval) and the depths of induced fractures. The average horizontal spacing of horizontal fractures at typical Dan-ish clay-till sites to 4 m depth is 15 cm (Table 3.2). Thus, an induced horizontal fracture spacing of about 1.5 m may be achievable at Danish clay-till sites. Comparison of the Vasby site with other basal clay-till sites suggests that the number of vertical fractures below 6 m is likely small (fewer than 1 per meter), although horizontal shear fractures are likely present throughout the till unit. Fractures induced below 6 m are anticipated to propagate along existing horizontal fractures. The lack of vertical fractures at this depth may result in some type of fingering as the gas attempts to vent through the (more) massive formation. The fingering will likely be localized around the horizontal fracture. Thus, fingering and a creation of a localised,

Discussion 99
very dense, fingered fracture network is likely only possible at depths greater than 6 m at the Vasby site. At a few locations a dense induced fracture network was observed, i.e. in Fracture 2, M1 from 2.5 to 2.6 m b.s., and M3 between 2.4 to 5.0 m b.s. and 5.7 to 5.8 m b.s., etc. However, there are also a number of depths where only a single induced fracture was observed and the spacing between frac-tures was wide. Likely, the dense networks have formed in locally more sandy or densely fractured regions of the clay till. This discussion suggests that the potential of pneumatic fracturing to create a dense fracture network at a site is strongly dependent on the characteristics of the existing frac-ture network and other geologic features. A conceptual drawing of fracture propagation through some fraction of the existing natural fractures is depicted in Figure 7.3.
Figure 7.3: Conceptual model of relationship between induced fracture network and existing (hydraulically-active) natural fracture network (in one fracturing direction).
7.3 Evaluation of pneumatic fracturing as applied at the Vasby site
7.3.1 Pressure effects
Pressure effects, as recorded in the monitoring wells, and observations of surface venting (listed in Table 6.2) provide evidence that the pneumatic fracturing conducted at the Vasby site deviated
Oxidised
Reduced
8.0 6.0 4.0 0 m
0
0.5
1.0
1.5
2.0
2.5
3.0
3.5
4.0
4.5
5.0
5.5
6.0
+ CaCO3
÷ CaCO3
Fracturing well
100 Discussion
from what is described in summary literature. For example, pressure effects were recorded in T3, at its 3-4 and 5-6 m b.s. monitoring elevations, while no pressure effect was observed at its 7-8 m b.s. interval, during fracturing at 7-8 m depth. This suggests that fracture propagation was not entirely horizontal. I.e. based on these pressure effects, a fracture induced at 7-8 m climbed 4 meters up-wards over 5 m horizontal distance to produce the pressure effect in T3 at 3-4 m b.s. Similar effects in T1 and T2, and less pronounced T3, from the fracturing at 6-7 m b.s. suggest that the fractures may have been propagating along paths of least resistance (via the extensively opened overburden) and/or that some short-circuiting may have occurred.
7.3.2 Uplift
Uplift data also indicate that the pneumatic fracturing at the Vasby site did not proceed as would be anticipated. The amount of residual uplift (measured shortly after fracturing has ceased at a given fracturing depth interval) is assumed to be directly proportional to the aperture at fracturing depths of 1.5 to 5 m b.s. (EPA, 1994). At depths greater than 5 m the correlation between uplift and aper-ture is not direct, due to the ability of the overburden to absorb the strain of deformation (Schuring, 2002) and the difficulty of measuring a very small uplift. At the Vasby site, residual uplift de-creased as the fracturing interval became shallower, although the opposite would be expected (Blem et al., 2004). At some depths, no residual heave was measurable. According to the literature this might suggest that no fractures were created. However, some field studies combining uplift measurements with visual inspection of cores have reported no measurable uplift although induced fractures could be observed in cores (Walsted et al., 2002; Blem et al., 2004). Thus, the measure-ments of uplift from Vasby suggest that the formation was opened during the fracturing of the deepest intervals (7-8 and 6-7 m b.s.) and that subsequent fracturing at shallower depths may not have opened/created new pathways, but just served to inject an additional mass of tracer into the formation. Lack of correlation between the surface elevation observed after a particular fracturing event and that observed before the following fracturing event suggest a further collapse of the fractured for-mation. As the ARS consultants noted only the residual uplift values for each fracturing event, and not the start and end elevation from which it was calculated, no indication of further formation collapse was noted. Formation collapse was, however, observed at all fracturing intervals above 7-8 m at PT2 and at 1 interval (6-7 m b.s.) at PT3. Similarly, measurements of the residual uplift a half hour after fracturing at 6-7 m b.s. revealed a further reduction in uplift compared to that measured immediately after tracer injection. This reduction was associated with a slow seepage of red tracer-bentonite mixture out of T1 (from unknown depth(s)). These decreases in residual uplift suggest that measurements made immediately after injections likely overestimate the uplift and conse-quently fracture apertures. Furthermore, they raise concerns regarding the longevity of pneumatic fractures. A final measurement of the residual uplift some days after the fracturing would give a more precise estimate of the residual uplift. Logistical constraints did not permit this.

Discussion 101
7.3.3 Linking the individual evaluations
The observations of pressure effects and residual uplift, as well as the discrepancies between typi-cal/required pressures and injection rates and those used at the Vasby site suggest that the bottom-up fracturing method resulted in uplift of the entire overburden above the fracturing level (7-8 m b.s.) thereby creating fractures, or opening of hydraulically inactive fractures throughout the over-burden from 8 m and upwards. It is theorised that the opening of the natural fractures in the over-burden above about 6 m became ‘paths of least resistance’ for subsequently induced fractures, thus diverting their propagation (which would otherwise have maintained a (sub)horizontal direction) towards the surface. Strong et al. (2004) used an initiation pressure of 140 psi in a low-permeability alluvium at 27 m and a bottom-up fracturing method, and observed that injections at shallower intervals required lower than expected injection pressures. They attributed this to ‘merging’ or interconnection with deeper previously created fractures. However, after the first fracturing no subsequent heave was observed. These observations suggest that a similar opening of the overlying overburden and natu-ral fractures may have occurred during Strong et al.’s field investigation. The application of pneumatic fracturing at the Vasby site differed from what is typically described in the literature. It is possible that venting is so commonplace that it is not considered noteworthy in case study reports. If this is the case, then the results obtained at the Vasby site are representative of what is achievable at a similar site under similar operator-determined conditions. However, if surface venting is not typical, then it may be possible to achieve a wider fracture radius than that observed at the Vasby site. Furthermore, the amount of surface venting at the site may have hin-dered the development of a denser fracture network, as the gas did not have the opportunity to vent slowly through the overburden, or along small natural fractures due to the wide-aperture paths of least resistance created by initial surface venting.
The surface venting and short-circuiting might have been reduced if the casing had been kept in place in PF1. This would have addressed the problem of obtaining a tight seal between packers and an open borehole in saturated clays (EPA, 1994; Markesic, 2000; Strong et al., 2004). Furthermore, cement grout around monitoring wells and particularly in abandoned boreholes (such as KF0) is often recommended to prevented short circuiting and surface venting at such installations/locations (Blem et al., 2004; ARS Consultants, 2005, personal communication; Ohio Dept. of Natural Re-sources, 2005).
7.4 Monitoring and evaluation data The pneumatic fracturing conducted at the Vasby site has been assessed based on the available monitoring and site characterisation data, much of which was qualitative. The extensive surface venting suggests that the radii of fractures and influence are smaller than could otherwise be

102 Discussion
achieved (although the exact extents at the Vasby site are unknown due to sparse monitoring be-yond the T wells). The lack of pre- and post-fracturing data collection in the form of slug tests, pump tests, vapour extraction tests, etc. makes it difficult to draw definitive conclusions regarding the success of the fracturing or to compare the Vasby site results to the existing international re-sults. Some monitoring data collected at the Vasby site is not yet available. It is anticipated that analysis of tracer concentrations in water sampled from the monitoring wells will provide evidence of con-nectivity between the injection well and the monitoring wells. However, apparent short-circuiting (perhaps along the annulus of monitoring wells) may have resulted in trapping of significant tracer concentrations in the permeable filter intervals of the monitoring wells, and thus this data should be used with caution. Likely, subsequent water samples, after there has been some flow through the system will be more representative of actual concentrations in the subsurface. When this data is combined with samples from installed seepage meters, a much broader data base will be available upon which the success of the fracturing may be evaluated. Cores and auger samples provided confirmation of induced fractures, but it was difficult to discern geological features in these. The excavation provided a unique opportunity to investigate the theory of induced fracture propagation in along paths of least resistance as postulated in the fracturing literature. Markesic (2000) concurs that delineation of the induced fractures pathways is only pos-sible in an excavation. Now that the mode of induced fracture propagation has been illuminated at a Danish site, other methods, perhaps discreet interval tracer tests combined with precise geological mapping may be sufficient to document induced fracture networks in the future. Vertical coring, while not ideal, provides a relatively inexpensive and fast method to document the fracture net-work.
7.5 Applicability of modelling results Soil sample analyses for Vasby are unavailable at present. Thus, Vasby matrix characteristics can-not be compared to those of Dalumvej which was used as the modelling base/case. In terms of frac-ture spacing the modelling chapter has demonstrated that a fracture spacing of about 10 cm is required to obtain a reasonable remediation time (10 years or less) of a worst case chlorinated eth-ane contamination at a typical Danish till site. The Vasby field results suggest that the required fracture spacing cannot be achieved via pneumatic fracturing. While this has dire implications for total remedial times, these results must be seen in light of the target remediation defined in the modelling. The modelling focused on total remediation time required to achieve a contaminant concentration of 10 µg/L throughout the matrix. In many remedial situations, however, a flux re-duction is also of interest, and this was not addressed by the modelling study. Thus, while the time-frames associated with total remediation of a site are long, significant flux reduction and thus reduction in treatment costs may be achieved by coupling pneumatic fracturing with a suitable in situ technology.

Discussion 103
Furthermore, laboratory investigations of cores under UV light revealed an uranine diffusion zone extending outwards from induced fractures (Københavns Amt, 2006). This observation indicates that remedial substances capable of diffusing into the matrix, for example permanganate, could be injected to create a reaction zone that extends beyond the induced fracture walls, thus lessening the fracture spacing requirements for remedial purposes. Broholm et al. (2005) observed PCE degrada-tion zones of 2 and 15 cm in cores from the unweathered and weathered (matrix) zones of the Da-lumvej till deposit, respectively, after injection and inward diffusion of permanganate. Investigations of Siegrist et al. (1999) report results similar to those of Broholm et al. with regard to permanganate. The present model would require alterations if flux reductions were to be estimated over time. The model must be in 2 and ideally 3 dimensions to permit modelling of advection. Addition of a reac-tant that diffuses into the matrix would permit modelling of a reaction zone. Finally, stoichiometric equations describing the degradation process (sequential if ARD) should be considered. It is antici-pated that fracture aperture would become a more influential parameter on diffusion and thus remediation times in such a model.
7.6 Site suitability for application of pneumatic fracturing in a remedial context Application of pneumatic fracturing may not be suitable at all sites. While fracturing may be used as a delivery method for remedial substrate, uniform spreading of substrate may not be possible in a poorly developed fracture network. Furthermore, fracturing will not likely be considered for sites with accessible contamination at depths from 0 to 5 meters, as excavation will be less expensive. Remediation coupled with pneumatic fracturing is well suited to fractured clay-tills overlying un-fractured clay-tills. These are found in areas where the till deposits are thick, likely greater than 10 m. Poor drainage conditions mean that vertical fractures do not extend throughout the till, while widely-spaced horizontal shear fractures are likely present at depth. The existing fracture network promotes creation of a network of induced fractures in the oxidized zone. Deeper horizontal frac-tures may likely connect with vertical fractures as observed at Vasby. The underlying unfractured till acts as a barrier to prevent downward transport or mobilisation of contamination. This situation is depicted in Figure 7.4a. Recall that the maximum depth of pneumatic fracturing (with subhori-zontal fractures achieved) to date has been 23 m although depths of 10 m appear more common. Whether or not this depth represents the maximum depth at which remedial activities may be as-sisted by fracturing is uncertain.

104 Discussion
Figure 7.4: (a) Conceptual model of contamination in a fractured till overlying a (vertically) unfractured till. The lack of vertical fractures in the lower unit means it acts as an effective barrier for downward transport of con-taminants. Such sites may be good candidates for coupled remediation. (b) A thin fractured till over a perme-able layer (with advective flow arrows). Caution must be exercised when applying fracturing at such a site to avoid creation of conduits and/or gradients that may result in contaminant transport into the underlying perme-able layer. Relatively thin clay-tills (less than 10 m) overlying well-drained sands, gravels, or fractured per-meable bedrock tend to have vertical fractures extending to the bottom of the till layer (Klint, 2001; Figure 7.4b). Pneumatic fracturing must be applied with caution at such sites. The fracturing inter-val must be above the bottom level of contamination to avoid opening/creation of induced fractures that could act as conduits to the underlying permeable deposits. Furthermore, changes in fracture connectivity may alter gradients and result in greater spreading (EPA, 1994; US DOE, 1998; Schuring, 2002), also horizontally (Jakobsen and Klint, 1999; Klint and Gravesen, 1999), than would otherwise occur. Thin clay-till sites contaminated with compounds that are not denser than water are likely better suited to coupled remediation compared to thin clay-till DNAPL sites. Urban sites may not be suited to application of pneumatic fracturing with the presently observed degree of fracture propagation control. Creation of horizontal fractures in excavated or backfilled material that is unconsolidated or poorly consolidated is difficult (EPA, 1994; Kidd, 2001; Schur-ing, 2002). Utility lines and other installations at the site may be difficult to grout properly. If pneu-matic fracturing is applied at such a site it is recommended that the shallowest fracturing interval be at least 1 m below installations located within the anticipated fracture radius to reduce the risk of daylighting and to prevent damage to installations (US DOE, 1998; Schuring, 2002; Thornberg, 2005, personal communication).
a b
105
CHAPTER 8
CONCLUSIONS
Based on the literature survey, modelling study, observations made during the pneumatic fractur-ing, inspection of induced fractures in the excavation, cores and auger cuttings, as well as the in-vestigation of typical till characteristics, the following conclusions may be made:
• The pneumatic fracturing technology appears to be well-developed, and operator-determined parameters are well-documented. However, precise and direct measurements of induced fracture characteristics are few. This may be explained by: 1) methods to obtain direct documentation of induced fractures are cumbersome (multilevel tracer tests), inade-quate (i.e difficult to ‘capture’ fractures in cores), or infeasible (excavation at a contami-nated site); and 2) the majority of the sites are remedial pilot- or full-scale projects, rather than scientific studies, and thus fracture characterisation is apparently of secondary interest relative to documentation of remediation enhancements. Instead, fracturing effects tend to be evaluated from pre-and post fracturing testing of well radius of influence, hydraulic conductivity and mass removal rates.
• The modelling study revealed that a fracture spacing of 10 cm is required (in a diffusion-limited remedial context) to obtain a reasonable remediation time (10 yrs) of a typical till contaminated with PCE (worst case) with the selected remedial goal (10 μg/L throughout the entire matrix). This has dire implications, if pneumatic fracturing is not able to achieve this spacing. However, a more nuanced picture of the potential for induced fractures to en-hance coupled remediation could be obtained by modelling flux reduction reactions with an inward-diffusing reactant. Tracer diffusion profiles observed in cores indicate inward-diffusion and formation of a reaction zone along induced fractures as a realistic remedial technique.
• The Vasby field site is typical of Danish basal till sites based on the type of till (sandy clay with occasional sand stringers), the number of systematic fractures systems (3), the depth to the redox boundary (3.5-4 m-b.s.), the decrease in the number of vertical fractures at the redox boundary, and the estimated depth of vertical fractures due to drainage conditions at the site (6 m b.s.).

106 Conclusions
• Similarities between till deposits (grain-size distribution, to some degree hydraulic conduc-tivity, and number and type of fracture systems) between 21 Danish and 4 Canadian sites in Ontario indicate that there is a basis for transferring fracturing experiences from Canada and the northern US (where there are similar glacial deposits) to Denmark. However, op-erator-determined initiation and propagation pressures applied at sites that are less densely fractured than Vasby may not be appropriate.
• Induced fractures propagated along naturally-existing, hydraulically-active fractures. In the upper 6 m of the overburden, this natural network is believed to determine the density of the induced fractures. Localized weaknesses or tortuous natural fractures may give rise to localized fingering. Below 6 m (the vertical glacial-tectonic fractures are infrequent) in-duced fracture propagation will be predominately horizontal. Localized fingering may also occur along the fracture as gas dissipates through the (relatively) massive overburden.
• Both the process of pneumatic fracturing as well as some of the results (surface venting) differed from what is typically reported in the literature. Consequently, it is uncertain whether: 1) a denser induced fracture network could be obtained if the technology has been applied differently; 2) if the induced network is a function of the site characteristics alone; or 3) both operator-determined parameters and site characteristics are influential. If surface venting, although rarely reported, is a common event, then creation of a dense fracture network is a function of (2) or (3).
Pneumatic fracturing coupled with in situ mass reduction or transformation techniques where re-medial substances are injected simultaneously is a promising technology to remediate some con-taminated low-permeability sites in Denmark. Shallow contaminated sites (< 5 m b.s.) or disturbed urban sites are poorly suited due to the cost, relative to excavation, and the risk of surface venting. Naturally-fractured low-permeability sites with deeper-lying contamination are likely well suited, as the technology has been applied at depths until 23 m (although 10 m is more common). How-ever, better control of induced fracture propagation, in particular fracture spacing is necessary in order to address diffusion-limited remediation times.
107
CHAPTER 9
PERSPECTIVES
9.1 Potential improvements to the pneumatic fracturing process based on experiences from the Vasby site In addition to the Vasby site, pneumatic fracturing and tracer injection was also undertaken at a rain-water collection basin in Glostrup. Although the overburden at the Glostrup site consists of gyttja and clay, rather than clay-till, some conclusions apply to both sites. Induced fracture spacing was observed to vary from about 1 cm to greater than 2 m, to massive at the Vasby site. Since the MATLAB modelling clearly demonstrates that fracture spacing is a cru-cial parameter in remediation times it would be advantageous to redesign the fracturing assembly to permit a much closer fracturing interval. The nozzle and packer system was long (about 4.65 m) and only permitted a fracturing interval of about 0.9 m. Observations from the Vasby site suggest that lower pressures than those used would likely be adequate to ‘crack’ Danish clay tills and propagate fractures. Lower pressures would likely also permit the use of shorter packers and a smaller fracturing interval. If the pneumatic fracturing were applied from a cased well, to reduce the chance of short-circuiting to previously fractured intervals, then a closer fracturing interval might be achievable. A closer interval might also provide more control over directions of fracture propagation. The potential for extensive horizontal propagation of induced fractures is greatest in overburden in which the naturally existing vertical fractures have not been opened previously. Avoiding surface venting is important. If the pneumatic fracturing had been applied to deliver bac-teria, substrate, etc. as part of a coupled remediation project these (perhaps expensive) substances, would be wasted. In the case of pneumatic fracturing coupled with chemical oxidation, the loss of potassium permanganate could be a health risk, and not least, extremely difficult to clean up. Both sites were fractured from the bottom up, meaning that fractures were induced at the deepest interval first. Surface venting was observed at both sites, often repeatedly at the same locations. It

108 Perspectives
is the authors’ belief that a top-down application of fracturing is superior, as it is associated with less uplift per fracturing interval and thus less disturbance of the overburden as a whole. The wide-spread surface venting led the authors to speculate whether this phenomenon could be used to an advantage. In particular, the observations of repeated surface venting at wells 5 m from the fractur-ing well (Vasby) to 30 m away (Glostrup). According to the ARS consultants, they always ‘find’ existing or abandoned hole not sealed with concrete grout. Perhaps these features could be used to guide propagating fractures, for example by ‘ringing’ a site with open monitoring wells to steer induced fractures to the edge of the contaminated zone. At Vasby, a fracture radius of at least 6.4 m was attained. Based on the literature summary, radii of 8 to 15 m may be possible. Thus, it might be possible to fracture across an entire contaminated zone. This would require that other monitor-ing wells and installations at a contaminated site were adequately grouted with concrete. In theory, the open wells could delineate the outer edge of the fractures, and if the wells were closely-spaced around the periphery, might ensure a more symmetrical and uniform fracturing in plan view. This ring could serve both to steer the direction of fracture propagation and serve as monitoring wells for hydraulic and/or tracer testing to document the radius of fracturing influence. More control over the direction of fracture propagation may also be possible using temporay sur-face loading with for example a heavy vehicle. It has been stated in the literature that local surface loading (a heavy vehicle or building) can cause unintentional steering of induced fractures (Suther-san, 1999; Nilsson et al., 2000). At the Vasby site, a heavy trailer with compessed gas cyclinders was located over the later site of the excavation, and in the direction where most surface venting was observed. Thus, it might be possible to control the direction of fracture propagation using stra-tegically placed vehicles.
9.2 Future research The future of environmental fracturing in Denmark depends upon the ability of environmental con-sultants and operators to manipulate the fracturing processes to achieve the desired results for a particular site. This requires a thorough knowledge of the operator-parameters and the resulting induced fractures. At present the degree of knowledge within the field of environmental fracturing is not adequate.
9.2.1 Further field studies at Vasby
The authors propose a new field project at the Vasby site as the geology and natural fractures are now well described. The project would involve characterisation of the pre-fracturing hydraulic conductivity based on slug tests. Both pre-fracturing hydraulic conductivity and natural fracture connectivity would be documented by means of a forced gradient tracer test with a dye tracer that remains visible over several months (for example brilliant blue). After tracer breakthrough in moni-toring/pumping wells pneumatic fracturing would be undertaken.

Perspectives 109
The technology would be applied using lower initiation and propagation pressures than used previ-ously at the site. As well, a top-down fracturing method, a cased fracturing well, and cement-grounted monitoring wells would be recommended. A second tracer would be injected during the pneumatic fracturing to permit differentiation of induced and hydraulically active natural fractures. Subsequently, the fracture field would be excavated. Excavation of the fractured area in a number of vertical and horizontal layers would provide a vis-ual 3-D picture of the type of fracture network created and hopefully prove or disprove the claim regarding creation of a dense fracture network. Ideally, the excavation would be deeper than 5 m as there is limited fracture documentation below this depth. The intensity of tracer colour on photo-graphs combined with soil samples from the excavation could be used to investigate the existence of preferential pathways through the fractured till. The presence of both tracers in a single fracture would confirm induced fracture propagation in existing, hydraulically active fractures. The pres-ence of the second tracer in natural (but not blue) fractures would indicate that the fracturing had opened existing, but hydraulically inactive fractures. The presence of the second dye tracer in ap-parently massive overburden would indicate that pneumatic fracturing created a new fracture net-work. Hopefully, ‘invisible’ natural fractures would be more discernable due to their fracture planes in an excavation. Thus, the use of two dye tracers during different stages of the field investi-gation would illuminate the relationship between induced and natural fracture networks.
9.2.2 Modelling studies Possible alterations to the MATLAB model that would make it more useful in modelling flux re-duction have been discussed in Chapter 7. These include developing a 3D model with addition of an inward-diffusing reactant thereby creating a degradation zone and addition of stoichiometric relationships between contaminants and reactants. The model in its present form would be im-proved by plotting the scaled sensitivities of the various parameters, i.e. the relative significance of each parameter on remedial times. Furthermore, the model could be tested by attempting to model existing diffusion profiles to investigate whether there appears to be other processes than those modelled that affect rates. The timeframe of the project did not permit these activities.


List of references 111
LIST OF REFERENCES
American Geological Institute, 1984
American Geological Institute, 1984. Dictionary of Geological Terms. Eds. Bates, R.L. and Jackson, J.A. Double Day, New York, 571 p.
ARS, 2005, personal communication
ARS Consultants
ARS, 2005a ARS Technologies, 2005a. Pneumatic Fracturing. Www.arstechnologies.com/pneumatic_fracturing.html updated 2005, also case study information.
ARS, 2005b ARS Technologies, 2005b. Report of Results. Pneumatic frac-turing substrate injection pilot study. Glostrup site and moraine clay site Denmark. December 2005.
ASTM, 1984 American Standard Testing Methods, 1984. ASTM soil analy-sis methods.
AVJ, 2001 Amternes Videnscenter for jordforureningen, 2001. Håndbog om undersøgelser af chlorede stoffer i jord og grundvand. Tek-nisk og administration Nr. 5. 2001.
AVJ, 2003 Amternes Videnscenter for Jordforureningen, 2003. Afværge-håndbog om chlorede stoffer i jord og grundvand. Teknik og Administration Nr. 4. 2003.
Ball et al., 1997 Ball, W.P., Chongxuan L., Guoshou, X. and Young, D.F., 1997. A diffusion-based interpretation of tetrachloroethene and thrichloroethene concentation profiles in a groundwater aqui-tard. Water Resources Research, Vol. 33. No. 12: 2741-2757.
Baun and Kusk, 2004
Baun, A. and Kusk, O., 2004. Kursusnoter: Miljøkemi og Øko-toksikologi, civilkursus udbudt på DTU.
BC MOE, 2005 British Colombia Ministry of the Environment, 2005. home-page http://wlapwww.gov.bc.ca/wat/gws/gwdocs/prac_info/GROUND7.html.
Blem et al., 2004 Blem, B.C, Nielsen, H.H., Fischer, E.V., Nielsen, S.C., Brøker, T. og Slack, B., 2004. Frakturer fra lodrette testboringer på Vestergade 10, Haslev. Teknologiudviklingsprojekt, Miljøsty-relsen, Miljø- og Energiministeriet. 81 p.
Broholm et al., 2005 Broholm, M.M., Hønning, J. and Bjerg, P.L., (2005): Kemisk oxidation med permanganat: Omsætningshastigheder og spredning i moræneler. Miljøstyrelsesrapport (in press).

112 List of references
Broholm et al., 2006 Broholm, M.M., Hønning, J., Bjerg, P.L., Hansen, H.C.L., Lar-sen, T.H. and Skou, H., 2006. Potential for Permanganate Oxi-dation of PCE Contaminated Clayey Till. Field, Laboratory and Modelling. Abstract for: The fifth international conference on Remediation of Chlorinated and Recalcitrant Compounds, Monterey, California, USA, May 22-25, 2006.
Bures et al., 2003 Bures, G.H., Sorenson, K.S., Martin, J.P. and Reinke, R.F., 2003. Overcoming the limitations of in situ bioremediation in low permeability soils through hydraulic soil fracturing. Frac Rite Environmental Ltd. (www.fracrite.ca).
Bures, 1998 Bures, G.H., 1998. Environmental fracturing of soils in hori-zontal and vertical boreholes for enhanced site remediation. Northern Alberta Institute of Technology: Field demonstration and symposium on environmental applications of horizontal directional drilling technology. Frac Rite Environmental Ltd. (www.fracrite.ca).
Canadian Ministry of Natural Resources (undated)
Canadian Ministry of Natural Resources (undated). Soil Survey Field Manual.
Cherry, 1989 Cherry, J.A., 1989. Hydrogeologic contaminant behaviour in fractured and unfractured clayey depostits in Canada. In (Eds.) Kobus, H.E. and Kinzelbach, W. Contaminant Transport in Groundwater. Proceedings of the international symposium on contaminant transport in groundwater, Stuttgart, 4-6 April 1989. A. A. Balkema, Rotterdam. pp. 11- 20.
Christ et al., 2005 Christ, J.A., Ramsburg, C.A., Abriola, L.M., Pennell K.D. and Löffler, F.E., 2005. Coupling aggressive mass removal with microbial reductive dechlorination for remediation of DNAPL source zones: a review and assessment. Environmental Health Perspectives, Vol. 113, No. 4: 465-477.
Christensen, 2004 Christensen, J.S., 2004. Afværge af chlorerede opløsningsmid-ler - kemiske oxidation. AVJ info. Nr. 4-2004: 5-14.
Christiansen, 2005, personal communication
John L. Christiansen, GEO.
Cox and Durant, 2005 Cox, E.E. and Durant, N.D., 2005. Recent advances in biore-mediation of chlorinated solvents in groundwater. ATV Vintermøde om jord- og grundvandsforurening, 8.-9. marts 2005.
D'Astous et al., 1989 D'Astous, A.Y., Ruland, W.W., Bruce, J.R.G., Cherry, J.A., and Gillham, R.W., 1989. Fracture effects in the shallow groundwater zone in weathered Sarnia-area clay. Can. Geotech. J., Vol. 26, 1989: 43-56.
DGSI, 2005 DGSI, 2005. Durham Geo Slope Indicator homepage http://www.slopeindicator.com/instruments/tilt-portable.html.

List of references 113
Ding et al., 2000 Ding, Y., Schuring, J.R., Member, ASCE, and Chan, P.C., 2000. Engineering reliability assessment of contaminant re-moval by pneumatic fracturing. Practice Periodical of Hazard-ous, Toxic and Radioactive Waste Management. January 2000: 24-29.
Eby, 2005 Eby, N., 2005. Glaciation laboratory assignment notes. Univer-sity of Massechutets, Lowell. http://faculty.uml.edu/Nelson_Eby/87.201/Assignments/Laboratory/Glaciation%20Lab.pdf.
EPA, 1994 EPA 1994. Alternative methods for fluid delivery and recovery. EPA/625/R-94/003. 89 p.
EPA, 1995 EPA. 1995. In Situ Remediation Technology Status Report: Hydraulic and Pneumatic Fracturing. US Environmental Pro-tection Agency, Offfice of Solid Waste and Emergency Re-sponse, Technology Innovation Office, Washington DC, USA.
EPA, 1998 EPA, 1998. Permeable Reactive Barrier Technologies for Con-taminant Remediation. United States Environmental Protection Agency, Office of Research and Development and Office of Solid Waste and Emergency Response, Washington DC 20460, EPA/600/R-98/125, September 1998.
EPA, 1999 EPA, 1999. Cost and Performance Report. Multiphase Extrac-tion at the 328 Site, Santa Clara, California. U.S. Environ-mental Protection Agency, Office of Solid Waste and Emergency Response, Technology Innovation Office.
EPA, 2003 EPA, 2003. Cost and Performance Summary Report - In Situ Chemical Reduction at the Marshall Space Flight Center, Source Area 2, Huntsville, Alabama. U.S. Environmental Pro-tection Agency, Office of Solid Waste and Emergency Re-sponse, Technology Innovation Office.
Ernstsen and Thorling, 1997 Ernstsen, V. and Thorling, L., 1997. Geokemiske miljøer og nitrat i et komplekst opbygget grundvandsmagasin ved Grund-før. ATV møde Forskningsprojekter vedrørende grundvands-forurening. DTU, April 23, 1997.
Fetter, 1993 Fetter, C.W., 1993. Contaminant Hydrology. Macmillian Pub-lishing Co., 458 p.
Flint, 1971 Flint, R.F., 1971. Glacial and Quarternary Geology. John Wiley and Sons, Inc., USA. 892 p.
Forrer et al., 1999. Forrer, I., Kasteel, R., Flury, M. and Flüher, H., 1999. Longitu-dinal and lateral dispersion in an unsaturated field soil. Water Resources Research, Vol. 35, No. 10: 3049-3060.

114 List of references
Forrer et al., 2000 Forrer, I., Papritz, A., Kastell, R., Flühler, H. and Luca, D., 2000. Quantifying dye tracers in soil profiles by image process-ing. European Journal of Soil Science, June 2000, 51: 313-322.
Frank and Barkley, 1994 Frank, U. and Barkley, N., 1994. Remediation of low perme-ability subsurface formations by fracturing enhancement of soil vapor extraction. In Journal of Hazardous Materials 40 (1995): 191-201.
Freeze and Cherry, 1979 Freeze, R.A. and Cherry, J.A., 1979. Groundwater. Prentice Hall, Inc. Englewood Cliffs, New Jersey. 604 p.
FRTR 1995-2005 Federal Remediation Technologies Roundtable. 1995-2005. Abstracts of Remediation - Case Studies. Vol. 1-8. www.frtr.gov.
FRx, 2005 FRx homepage. 2005. www.frx-inc.com.
Fuhr and Liskowitz, 1998 Fuhr Joseph M. and Liskowitz J.J., 1998. Enhancing Hydro-carbon Recovery in a Low Permeability Montmorillonitic Clay Through Pneumatic Fracturing, AEHS, East Coast Conference on Soil and Sediment Issues, Amberst, MA.
Germán-Heins and Flury, 2000 Germán-Heins, J. and Flury, M., 2000. Sorption of Brilliant Blue FCF in soils as affected by pH and ionic strength. Ge-oderma 97 (2000): 87-101.
GEUS, 2005a Elevation map not yet published from GEUS.
GEUS, 2005b Jupiter boreholelog database.
Global drilling supplies, 2005
Global drilling supplies 2005. Homepage: http://www.globaldrilsup.com/
Gonsoulin et al., 2004 Gonsoulin, M. E., Wilson, B. H. and Wilson, J. T., 2004: Bio-degradation of PCE and TCE in landfill leachate predicted fromconcentrations of molecular hydrogen: a case study. Biodegra-dation 15: 475–485.
Hacettepe Univ., 2005 Hacettepe Univ., 2005. Hacettepe University Department of Mining Engineering, Ankara, Turkey. http://www.maden.hacettepe.edu.tr/dmmrt/dmmrt386.html
Hedeselskabet, 2005 Hedeselskabet, 2005. Dalumvej, Fyns Amt. Modelsimuleringer af forureningsspredning tidshorisont for oprensing under for-skellige model- og afværge scenarier. PCE oprensning ved pe-riodisk tilsætning af kaliumpermanganat. Udkast report udarbejdet af Hansen, H.C.L og Broholm, M. 28 April 2005.
Houmark-Nielsen and Kjær, 2001 Houmark-Nielsen, M. and Kjær, K.H., 2001. Southwest Scan-dinavia, 40-15 kyr BP: paleogeography and environmental change. Journal of quarternary science 18(8): 769-786.

List of references 115
Houmark-Nielsen et al., 2005 Houmark-Nielsen, M. Krüger, J. and Klær, K.H., 2005. De se-neste 150.000 år. Geoviden. Nr. 2, 2005. GEOCENTER, Kø-benhavn, Geografforlaget. 20 p.
Iversen and Jacobsen, 2004 Iversen. B.V. and Jacobsen, O.H., 2004. Hydrauliske undersø-gelser - laboratorieundersøgelser. In: Ernstsen, V., (Ed.), KUPArapport Koncept for udpegning af pesticid følsomme arealer. Afprøvning af undersøgelsesmethoder med henblik på etable-ring af et zoneringskoncept for danske lerjorde: Status rapport. Miljøministeriet. Danmarks og grønlands geologiske undersø-gelse.
Jacobs et al., 2001 Jacobs, J.F. et al., 2001. Geologic principles and MTBE. In. Ed. James Jacobs et al., MTBE: Effects on Soil and Groundwater Resources. Boca Raton: CRC press LLC, 2001 42 p.
Jacobsen et al., 2004 Jacobsen, O.S., Elsgaard, L. and Vinter, F.P., 2004. Undersø-gelse af mikrobiologi samt mineralisering og sorption af pesti-cider i et lerjordsprofile ved Højstrup, Stevns. In: (Ed.) Ernstsen, V., KUPA rapport Koncept for udpegning af pesticid-følsomme arealer. Afprøvning af undersøgelsesmethoder med henblik på etablering af et zoneringskoncept for danske lerjor-de: Status rapport. Miljøministeriet. Danmarks og grønlands geologiske undersøgelse.
Jakobsen and Klint, 1999 Jakobsen, P.R. and Klint, K.E.S., 1999. Fracture Distribution and Occurrence of DNAPL in a Clayey Lodgement Till. Nordic Hydrology, 30 (4/5): 285-300.
Jianzhong et al., 2002 Jianzhong, H., Youlboong, S., Dollhopf,M.E., Fathepure, B.Z., Tiedje, J.M. and Löffler, F.E., 2002. Acetate versus Hydrogen as direct electron donors to stimulate the microbial reductive dechlorination process at Chloroethene-contaminated sites. En-vironmental Science and Technology, Vol. 36:3945-3952.
Johnson et al., 1989 Johnson, R.L., Cherry, J.A. and Pankow, J.F., 1989. Diffusive contaminant transport in natural clay: a field example and im-plication for clay-lined waste disposal sites. Environ. Sci. Tech-nol. 1989, 23:340-349.
Jørgensen and Fredericia, 1992 Jørgensen, P.R. and Fredericia, J., 1992. Migration of nutrients, pesticides and heavy metals in fractured clayey till. Géotech-nique 42, March. 67-77.
Jørgensen and Klint, 1992 Jørgensen, P.R. and Klint, K.E., 1992. Migration of nutrients, pesticides and heavy metals in fractured clayey till. Geotech-nique 42, March, pages 67-77.
Jørgensen and Spiid, 1994 Jørgensen, P. and Spiid, N. H., 1994. Transport of opløst stoffer i sprækket moræneler under vandmættede forhold. ATV møde Forskningsprojekter vedrørende grundvandsforurening. DTU, November 3, 1994.
116 List of references
Jørgensen and Spiid, 1998 Jørgensen, P.R. and Spiid, N. H, 1998. Migration and biodeg-radation of pesticides in fractured clayey till. Bekæmpelses-middelforskning fra Miljøstyrelsen Nr. 37, 1998. Miljø- og Energiministeriet. Miljøstyrelsen, København.
Jørgensen et al., 1994 Jørgensen, P., Jensen, M., O'Brien, R. and Refsgaard, A., 1994. Nitrate reduction in oxidized clayey till. ATV møde. Forsk-ningsprojekter vedrørende grundvandsforurening. DTU, No-vember 3, 1994.
Jørgensen et al., 2003 Jørgensen, P.R., Klint, K.E.S. and Kistrup, J.P., 2003. Monitor-ing well interseption with fractures in clayey till. Ground WaterVol. 41 No. 6 November-December 2003: 772-779.
Jørgensen, T. et al., 2003 Jørgensen, T.H., Jepsen, J.D., Skou, H. and Bjerg, P.L., 2003. Oprensning af PCE ved kemisk oxidation med kaliumperman-ganat.Miljøprojekt Nr. 872, 2003. Teknologiudviklingspro-grammet for jord- og grundvandsforurening. Miljøstyrelsen. Miljøministeriet. 92 p.
Jørgensen, 2004 Jørgensen, T.H., 2004. Vidensopsamling om en ny oprens-ningsmetode med nanoscale jern. AVJ Info, Nr. 4 2004, s. 3-4.
Jørgensen et al., 2005 Jørgensen, T.H, Scheutz, C., Durant, N.D., Cox, E., Rasmus-sen, P. and Bjerg, P.L., 2005. Stimuleret in situ reduktic dek-lorering. Vidensopsamling og screening af lokaliteter. Hovedrapport.Miljøpojekt Nr. 983 2005. Miljøministeriet. Mil-jøstyrelsen, København, Danmark 153 p.
Karimi-Fard et al., 2004 Karimi-Fard, M., Durlofsky, L.J. and Aziz, K., 2004. An effi-cient discrete-fracture model application for general-purpose reservoir simulators. Society of Peteroleum Engineers Vol. 9, Number 2, June: 227-236.
Kasteel et al., 2002 Kasteel, R., Vogel, H.J. and Roth, K., 2002. Effect of non-linear adsorption on the transport behaviour of Brilliant Blue in a field soil. European Journal of Soil Science, June 2002, 53: 231-240.
Kasteel et al., 2005 Kasteel, R., Burkhardt, M., Giesa, S. and Vereecken, H., 2005. Characterization of field tracer transport using high-resolution images. Vadose Zone Journal 4: 101-111.
Ketelsen and Meyer-Windel, 1999 Ketelsen, H. and Meyer-Windel, S., 1999. Adsorption of bril-liant blue FCF by soils. Geoderma, 90: 131-145.
Kidd, 2001 Kidd, D.F., 2001. Fracturing. Chapter 10. In In Situ Treatment Technology. Boca Raton: CRC Press LLC. (internet site)
Kjeldsen and Christensen, 1996 Kjeldsen, P. and Christensen, T.H., 1996. Kemiske stoffers op-førsel i jord og grundvand. Bind 1 og 2. Projekt om jord og grundvand fra Miljøstyrelsen Nr. 20, 1996. Miljø- og Ener-giministeriet, Miljøstyrelsen.

List of references 117
Kjeldsen, 2001 Kjeldsen, P,. 2001. A few simple models for evaluating trans-port in soil and groundwater of reactive compounds omitting dispersion. Lecture note for 63370 Soil and Groundwater Pol-lution. Environment and Resources, Technical University of Denmark. February 2001, pp. 1-9.
Kjeldsen, 2004 Kjeldsen, P., 2004. Reaktive vægge og filtre med jernspåner - en sammenfatning. Miljøprojekt No. 916, Teknologiudvikling-sprogrammet for jord- og grundvandsforurening. Miljøstyrel-sen, 2005.
Klint and Fredericia, 1995 Klint, K.E. and Fredericia, J., 1995. Sprækkeparametre i moræ-neler. Vand & Jord.2. årgang, Nr. 5, oktober 1995: 208-214.
Klint and Gravesen, 1999. Klint, K.E.S. and Gravesen, P., 1999. Fractures and biopores in Weichselian clayey till aquitards at Flakkebjerg, Denmark. Nordic Hydrology, 30 (4,5): 267-284.
Klint et al., 2001 Klint, K.E.S., Abildstrup, C.H., Gravesen, P., Jakobsen, P.R. and Vosgerau, H., 2001. Sprækkers oprindelse og udbredelse i moræneler. Vand og Jord. 8. årgang, nr. 3, september, 2001: 111-119.
Klint, 1996 Klint, K.E.S., 1996. Fractures and Depositional Features of the St. Joseph Till and uper part of the Black Shale Till at the Laid-law site, Lambton County, Ontario. Geological Survey of Denmark and Greenland. Report 1996/9 39 p.
Klint, 2001 Klint, K.E.S., 2001. Fractures in Glacigene Diamict Deposits; Origin and Distribution. Ph.D. Thesis, Geological Survey of Denmark and Greenland.
Klint, 2004a Klint, K.E.S. 2004. Den lille sprækketektoniker - Opmåling og karakterisering af opsprækket moræneler, Manual. GEUS, 2004.
Klint, 2004b Klint, K.E.S., 2004. Undersøgelse af de geologiske forhold ved Gjorslev, Højstrup, Mammen og Grundfør. In: (Ed.) Ernstsen, V., KUPA rapport Koncept for udpegning af pesticidfølsomme arealer. Afprøvning af undersøgelsesmethoder med henblik på etablering af et zoneringskoncept for danske lerjorde: Status rapport. Miljøministeriet. Danmarks og grønlands geologiske undersøgelse.
Klint, 2005, personal communication
Knud Erik Klint, GEUS.
Koenigsberg, 1999 Koenigsberg, S.S., 1999. Hydrogen release compound (HRC®): a novel technology for the bioremediation of chlorin-ated hydrocarbons, Proceedings of the 1999 conference on haz-ardous waste research, 1999
KRAK, 2005 KRAK, 2005, electronic map of Vasby. www.krak.dk

118 List of references
Kueper and Reynolds, 2002 Kueper, B.H. and Reynolds, D.A., 2001. DNAPL migration through interbedded clay-sand sequences. Groundwater Qual-ity: Natural and Enhanced Restoration of Groundwater Pollu-tion (Proceedings of the Groundwater Quality 2001 Conference held at Sheffield, UK, June 2001). IAHS Publ. No. 275, 2002.
Københavns Amt, 2005a Københavns Amt, 2005. Indledende forureningsundersøgelse. Tidligere kemikaliefordelingscentral, Vadsbyvej 16A, 2640 He-dehusene. Sagsnr.: 9861248. Arkivkode 8-76-5-169-D0. Hede-selskabet Miljø og Energi as.15p.
Københavns Amt, 2005b Københavns Amt, 2005. Vadsbyvej 16A, Taastrup. Omfattende forureningsundersøgelse. Juni 2005. Foreløbig version. Carl Bro 26 p. plus bilag.
Københavns Amt, 2006 Københavns Amt, 2006. Pneumatic Frakturing. Dokumentation af Pilotforsøg Vasbyvej, 16A, Hedehusene, februar 2006 (in presss).
Larsen et al., 1995 Larsen, G., Frederiksen, J., Villumsen, A., Frederecia, J., Gra-vesen, P., Foged, N., Knudsen, B. and Baumann, J., 1995. Vej-ledning i ingeniørgeologisk prøvebeskrivelse. Danish Geotechnical Society, Aalborg, Denmark. 135 p.
Lindhardt, et al., 2001 Lindhardt, B., Abildtrup, C., Vosgerau, H., Olsen, P., Torp,S., Iversen, B.I., Jørgensen. J.O., Plauborg, F., Rasmussen, P. and Gravesen, P., 2001. The Danish Pesticide Leaching Assessment Programme. Site Characterizatin and Monitoring Design. Geo-logical survey of Denmark and Greenland, Copenhagen, Den-mark.
Major et al., 2002 Major D. W., McMaster M. L., Cox E. E., Edwards E. A., Dworatzek S. M., Hendrickson E. R., Starr M. G., Payne J. A. and Buonamici L. W., 2002. Field demonstration of successful bioaugmentation to achieve dechlorination of tetrachloroethene to ethene. Environmental Science and Technology Vol. 36, No. 23: 5106-5116.
Markesic, 2000 Markesic, S.J., 2000. Field performance assessment of pneu-matic fracturing for permeability enhancement of clay deposits. Masters Thesis in Earth Science. University of Waterloo, Wa-terloo, Ontario, Canada
Marsh and Dozier, 1981 Marsh, W.M.and Dozier, J., 1981. Landscape An Introduction to Physical Geography. Addison-Wesley Publishing Company, Inc. Reading, USA. 637 p.
Marshall and Holmes, 1988 Marshall, T.J. and Holmes, J.W., 1988. Soil Physics. 2nd ed. Cambridge Univ. Press, New York.

List of references 119
Martin et al., 2002 Martin, J.P., Sorensen, K.S., Peterson, L. N. Jr., Brennan, R. A., Werth, C.J., Stanford, R. A., Bures, G.H. and Taylor, C.J., 2002. Enhanced CAH dechlorination in a low permeability, variably-saturated medium. In Remediation of chlorinated and Recalcitrant compounds 2002: Proceedings of the Third Inter-national Conference on Redemiation of Chlorinated and Recal-citrant Compounds. Monterey, CA; May 2002. Paper 2B-54. A.R. Gavaskar and A.S.C. Chen (Eds.). Columbus; OH: Bat-telle Press p 995-1003.
MATLAB, 2005 Help function in MATLAB
McKay et al., 1993a McKay, L.D., Cherry, J.A. and Gillham, R.W., 1993. Field ex-periment in a fractured clay till. 1. Hydraulic conductivity and fracture aperture. Water Resources Research Vol. 29, No. 4: 1149-1162.
McKay et al., 1993b McKay, L.D., Cherry, J.A., Bales, R.C., Yahya, M.T.and Gerba, C.P., 1993. A Field Example of Bacteriophage as tracers of fracture flow. Environ. Sci Technol.27: 1075-1078.
McKay et al., 1993c McKay, L.D., Gillham, R.W. and Cherry, J.A. 1993. Field Ex-periments in a fractured clay till 2. Solute and colloid transport. Water Resources Research, Vol. 29, No. 12: 3879-3890.
McKay et al., 1999 McKay, L., Fredericia, J., Lenczewski, M., Morthorst, J. and Klint, K.E.S., 1999. Spatial variability of contaminant transport in a fractured till, Avedøre Denmark. Nordic Hydrology, 30 (4/5): 333-360.
Merck, 1996 Merck, 1996. Merck Index, 12th edition, Ed. Susan Buclavari. Merck & Co. Inc. Whitehouse Station, N.J.
Metric equipment manufactures, 2005
http://www.memflow.com/conversion.html, 2005.
Myrand et al., 1992 Myrand, D., Gillham, R.W., Suducky, E.A., O'Hannesin, S.F. and Johnson, R.L., 1992. Diffusion of volatile organic com-pounds in natural clay deposits: Laboratory tests. Journal of Contaminant Hydrology, 10: 159-177.
NFEC, 2003 Naval Facilities Engineering Command, 2003. Cost and Per-formance Report. FEROXsm Injection Technology Demonstra-tion - Parcel C, Remedial Unit C4 - Hunters Point Shipyard, San Fransisco, California. DS.A013.10177 Final.
Nilsson et al., 2000 Nilsson, B., Gormsen, C., Blem, B.C., Slack, B. og Murdock, L., 2000. Frakturering Inducerede sprækker ved hydraulisk og pneumatisk fakturering. Miljøprojekt Nr. 541 2000. Miljøsty-relsen Miljø- og Energiministeriet. 116 p.

120 List of references
Nilsson et al., 2001a Nilsson, B., Dahlstrøm, K., Kjær, C.and Nielsen, S. A.V., 2001. Frakturering - Inducerede sprækker med hydraulisk og pneuma-tisk frakturering. Indlæg fra ATV Vintermøde om grundvands-forurening, Vingstedcenteret, 6.-7. marts, 2001.
Nilsson et al., 2001b Nilsson, B., Sidle, R.C., Klint, K.E., Bøggild, C.E., and Bro-holm, K., 2001. Mass transport and scale-dependent hydraulic tests in a heterogeneous glacial till-sandy aquifer system. Jour-nal of Hydrology 243: 162-179.
Nilsson et al., 2003 Nilsson, B., Dahlstrøm, K., Kjær, C. and Nielsen, S.A.V., 2003. Miljøstyrelsens Teknologiprogram - Frakturering. Indlæg fra ATV Vintermøde om grundvandsforurening, Vingstedcenteret, 3.-4. marts, 2003.
Niras, 2004 Niras, 2004. Sag Nr. 05.161.00, 2004. Nørregade 39, Køge - supplerende undersøgelser og risikovurdering.
Nygaard, 1999 Nygaard, E., 1999. Geologi som redskab i design af ventilering.ATV møde. Teknikker til ventilering af forurenet jord og grundvand. DTU, November 9, 1999. 1-10.
O'Hara et al., 2000 O'Hara, S.K., Parker, B.L., Jørgensen, P.R. and Cherry, J.A. 2000. Trichloroethene DNAPL flow and mass distribution in naturally fractured clay: Evidence of aperture variability. Water Resources Research Vol. 36, No. 1: 135-147
Ohio Dept. of Nat. Res., 2005 Ohio Deptartment of Natural Resources 2005 Homepage, Divi-sion of water publications http://www.dnr.state.oh.us/water/pubs/fs_div/fctsht19.htm
Palaia and Sprinkle, 2004 Palaia, T.A. and Sprinkle, C.L., 2004. Results from two pilot tests using pneumatic and chemical oxidant injection technolo-gies. Paper 5B-04, in: A.R. Gavaskar and A.S.C. Chen (Eds.), Remediation of Chlorinated and Recalcitrant Compounds - 2004. Proceedings of the Fourth International Conference on Remediation of Chlorinated Compounds (Monterey, CA; May 2004). ISBN 1-57477-145-0, published by Battelle Press, Co-lumbus, OH, USA.
Parker et al., 1994 Parker, B.L., Gillham, R.W. and Cherry J.A., 1994. Difffusive disappearance of immiscible-phase organic liquids in fractured geologic media. Ground Water Vol. 32, No. 5: 805-820.
Parker et al., 1997 Parker, B.L, McWhorter, D.B. and Cherry, J.A., 1997. Diffu-sive Loss of Non-Aqueous Phase Organic Solvents from Ideal-ized Fracture Networks in Geologic Media. Ground Water Vol. 35, No. 6: 1077-1088.
Parker et al., 2004 Parker, B.L., Cherry, J.A. and Chapman, S.W., 2004. Field study of TCE diffusion profiles below DNAPL to assess aqui-tard integrity. Journal of Contaminant Hydrology No. 74: 197-230.

List of references 121
Ramsay, 1999 Ramsay, L., 1999. Vurdering af stødvis ventilation og pneuma-tisk opsprækning. Miljøstyrelsens teknologiudviklingsprogram for jord- og grundvandsforurening. Miljøprojekt Nr. 491.
Reynolds and Kueper, 2001 Reynolds, D.A. and Kueper, B.H. 2001. Multiphase flow and transport in fractured clay/sand sequences. Journal of Contami-nant Hydrology, 51 (2001): 41-62.
Reynolds and Kueper, 2002 Reynolds, D.A. and Kueper, B.H., 2002. Numerical Examina-tion of the Factors Controlling DNAPL Migration Through a Single Fracture. Ground Water Vol. 40, No. 4: 368-377.
Riser-Roberts, 1998 Riser-Roberts, E., 1998. Remediation of Petroleum Contami-nated soils. Lewis Publishers, Boca Raton CRC Press LLC pp. 103-109.
Roote, 2000 Roote, D.S., 2000. Technology Status Report - Hydraulic, Pneumatic and Blast-Enhanced Fracturing. GWRTAC S-series report TS-00-01. Ground-Water Remediation Technologies Analysis Center, Concurrent Technologies Corporation, USA.
Schnegg and Doerfliger, 1997 Schnegg, P.A. and Doerfliger, N., 1997: An inexpensive flow-through field fluorometer. Proc. of the 6e Colloque d'hydrolo-gie en pays calcaire et milieu fissuré, la Chaux-de-Fonds, Au-gust 1997. (http://www.geol.unine.ch/GEOMAGNETISME/tract.html
Schuring, 2002 Schuring, J.R., 2002. Fracturing Technologies to Enhance Remediation. Technology Evaluation Report TE-02-02 pre-pared for GWRTAC Ground-Water Remediation Technologies Analysis Center, Pittsburg P.A.
Schwartz and Zhang, 2003 Schwartz, F. W. and Zhang, H., 2003. Fundamentals of Ground Water. John Wiley and Sons, New York. 583 p.
Sidle et al., 1998 Sidle, R.C., Nilsson, B., Hansen, M. and Fredericia, J., 1998. Spatially varying hydraulic and solute trensport characteristics of a fractured till determined by field tracer tests, Funen, Den-mark. Water Resources Research, Vol.30, No. 10: 2515-2527.
Siegrist et al., 1999 Siegrist, R.L., Lowe, K.S., Murdoch, L.C., Case, T.L. and Pickering, D.A., 1999. In Situ Oxidation by Fracture Emplaced Reactive Solids. Journal of Environmental Engineering, May 1999: 429-440.
Siegrist et al., 2000 Siegrist, Robert L. et.al., In situ chemical oxidation for reme-diation of contaminated soil and ground water. EPA ground water currents, September 2000 issue, No. 37.
Slough et al., 1999 Slough, K.J., Sudicky, E.A. and Forsyth, P.A., 1999. Impor-tance of rock matrix entry pressure on DNAPL migration in fractured geologic materials. Ground Water Vol. 37, No. 2:237-244.
122 List of references
Smed, 1997 Smed, Per, 1987. Landskabskort over Dan-mark.Geografforlaget.
Sonnenborg et al., 1996 Sonnenborg, T.O., Tofteng, C. and Butts, M.B., 1996. Labora-tory and simulation studies of solute transport in fractured po-rous media. Progress Report 1996. Vol. 76: 49-61. Dept. Hydrodyn. & Water Resources, DTU.
Strong et al., 2004 Strong, M., Sprinkle, C., Ewing, D., Owens, A., Ventura, B., Smith, L. and Liskowitz, J., 2004. Comparison of pneumatic and hydraulic fracturing for emplacement treatment materials in low-permeability formations. Paper 5B-07 In: A.R. Gavaskar and A.S.C Chen (Eds.) Remediation of chlorinated and recalci-trant compounds-2004. Proceedings of the fourth international conference on remediation of chlorinated and recalcitrant compounds (Monterey, CA; May 2004) Battelle Prwess, Co-lombus OH ISBN 1-57477-145-0.
Styczen et al., 2004 Styczeb, M., Petersen, S., Kristensen, M., Jessen, O.Z., Ras-mussen, D. and Andersen, M.B., 2004. Calibration of models describing pesticide fate and transport in lillebæk abd odder bæk catchment. Pesticides Research Nr. 62. 2004. Bekæmpel-sesmiddelforskning fra Miljøstyrelsen. Danish Environmental Protection Agency. Danish Ministry of the Environment.
Suthersan, 1999 Suthersan, S.S., 1999. Hydraulic and pneumatic fracturing. Chapter 9 in Remediation Engineering Design Concepts. Lewis Publishers, USA.
Thornberg, 2005, personal com-mication
Thornberg, D.E. 2005 civilingeniør og afdelingsleder, Kloak afdeling, Helsingør Kommune.
Tuxen, 2002 Tuxen, N., 2002. In situ bioremediation of groundwater con-taminated by herbicides from point sources. PhD thesis, June, 2002. Environment & Resources, Technical University of Denmark. pp. 1-47.
US Dept. of Labor, 2005 US Department of Labor, 2005. Occupational safety and health administration 2005 http://www.osha.gov/pls/oshaweb/owadisp.show_document?p_table=STANDARDS&p_id=10931.
US Dept.of Agr., 2005 US Department of Agriculture, 2005. United States Department of Agriculture Natural Resources Conservation Service. Home-page. Soils Survey Manual, Chapter 3. http://soils.usda.gov/technical/manual/contents/chapter3h.html#69
US DOE, 1998 US Department of Energy, 1998. Subsurface Contaminants Fo-cus Area. Hydraulic and Pneumatic Fracturing. OST reference #1917 (hydraulic fracturing). OST reference # 1916 (Pneumatic fracturing) February, 1998. http://apps.em.doe.gov/ost/pubs/itsrs/itsr1917/begining.html

List of references 123
US DOE, 1996 US Department of Energy, 1996. Case Study Abstract - Hy-draulic and Pneumatic Fracturing, U.S. Department of Energy (Portsmouth Gaseous Diffusion Plant, Ohio), Department of Defense, and Commercial Sites pp.198-213.
US DOE, 2000 US Department of Energy, 2000. Remediation of DNAPLs in Low Permeability Soils. Innovative Technology Summary Re-port DOE/EM-0550 / OST/TMS ID 163. US DOE, Office of Environmental Management, Office of Science and Technol-ogy. September 2000.
Vance, 2005 Vance, David, B., 2005. Nanoscale Iron Colloids – The matur-ing of the technology for field scale application. Pollution En-gineering, July, 2005.
Venkatraman et al., 1998 Venkatraman, S.N., Schuring, J.R., Boland, T.M., Bossert, I.D.,and Kosson, D.S., 1998. Application of Pneumatic Fractur-ing to Enhance In Situ Bioremediation. Journal of Soil Con-tamination, 7 (2): 143-162.
Walsted and Christensen, 2000 Walsted, L. and Christensen, A.G., 2000. Hydraulisk frakture-ring langs vandrette boringer - afværge- og teknologiudvik-lingsprojekt for Storstrøms Amt og Miljøstyrelsen. ATV Vintermøde om grundvandsforurening, Vingstedcenteret, 7.-8. marts, 2000.
Walsted et al., 2002 Walsted, L., Christensen, A.G., Husum, H. and Brock, D., 2002. Hydraulisk frakturering udført ved vandret boreteknik - Design og anlæg. Miljøprojekt Nr. 699 2002. Teknologieudvik-lingsprogrammet for jord- og grundvandsforurening. Miljøsty-relsen, Miljømonisteriet.
www.atsdr.cdc.gov/toxfaq
www.atsdr.cdc.gov/toxfaq, searches on PCE and 1,2-dichloroethane
www.chemfinder.com
www.chemfinder.com search on 1,2-dichloroethane
Zhang, 2003 Zhang, W., 2003. Nanoscale iron particles for environmental remediation: An overview. Journal of nanoparticle research, No. 5: 323-332.