Embed Size (px)
Citation preview

8/7/2019 Print Out Copy
http://slidepdf.com/reader/full/print-out-copy 1/89
A COMPREHENSIVE STUDY ON EMPLOYEE
ATTRITION AND RETENTION AT SUSEE GROUP
OF COMPANIES
(With Special Reference to Madurai)
A Final Project Report
Submitted By,
MURALIDHARAN.G
(9909115070)
IN PARTIAL FULFILMENT OF THE REQUIREMENTS FOR THE DEGREE OF
MASTER OF BUSINESS ADMINISTRATION
UNDER THE GUIDANCE OF
MR.M.SHANMUGASUNDRAM MBA
KALASALINGAM UNIVERSITY
ANAND NAGAR,
KRISHNANKOVIL – 626 190
MAY 2011
8/7/2019 Print Out Copy
http://slidepdf.com/reader/full/print-out-copy 2/89
C HAPTER 1
I NTRODUCTION
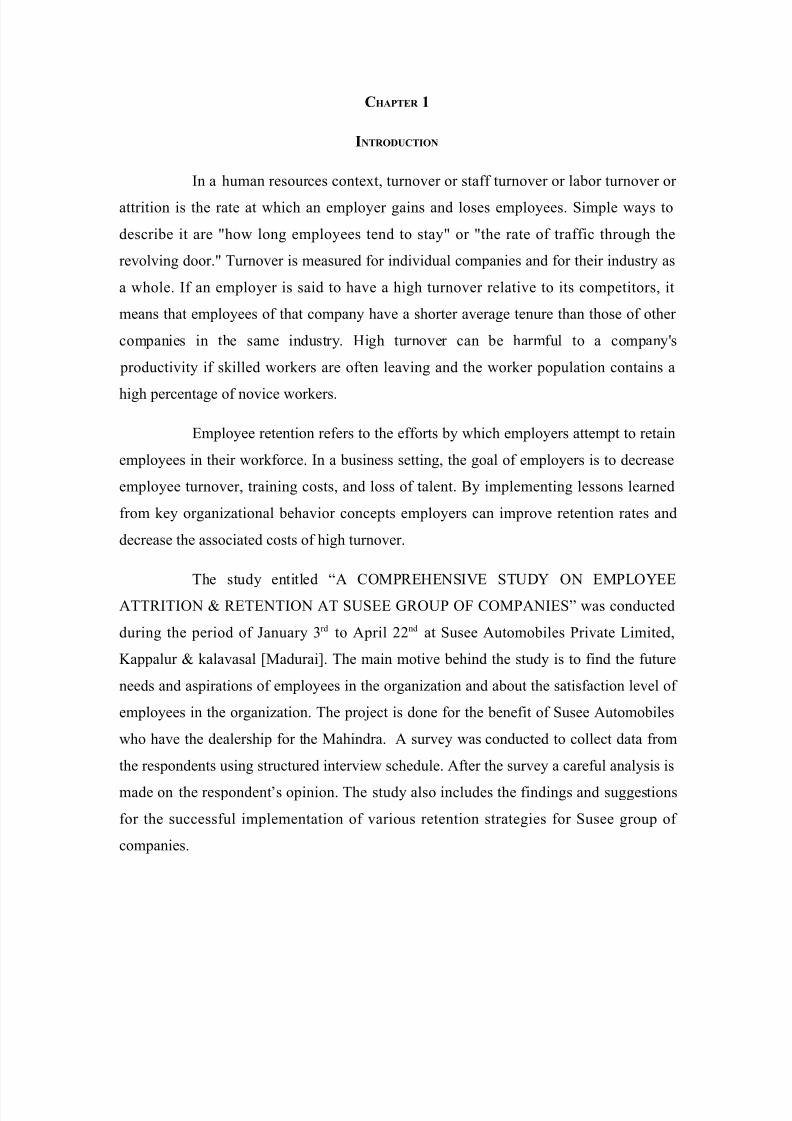
In a human resources context, turnover or staff turnover or labor turnover or attrition is the rate at which an employer gains and loses employees. Simple ways todescribe it are "how long employees tend to stay" or "the rate of traffic through therevolving door." Turnover is measured for individual companies and for their industry asa whole. If an employer is said to have a high turnover relative to its competitors, itmeans that employees of that company have a shorter average tenure than those of other companies in the same industry. High turnover can be harmful to a company's productivity if skilled workers are often leaving and the worker population contains a
high percentage of novice workers.
Employee retention refers to the efforts by which employers attempt to retainemployees in their workforce. In a business setting, the goal of employers is to decreaseemployee turnover, training costs, and loss of talent. By implementing lessons learnedfrom key organizational behavior concepts employers can improve retention rates anddecrease the associated costs of high turnover.
The study entitled “A COMPREHENSIVE STUDY ON EMPLOYEEATTRITION & RETENTION AT SUSEE GROUP OF COMPANIES” was conductedduring the period of January 3rd to April 22nd at Susee Automobiles Private Limited,Kappalur & kalavasal [Madurai]. The main motive behind the study is to find the futureneeds and aspirations of employees in the organization and about the satisfaction level of employees in the organization. The project is done for the benefit of Susee Automobileswho have the dealership for the Mahindra. A survey was conducted to collect data fromthe respondents using structured interview schedule. After the survey a careful analysis is
made on the respondent’s opinion. The study also includes the findings and suggestionsfor the successful implementation of various retention strategies for Susee group of companies.
8/7/2019 Print Out Copy
http://slidepdf.com/reader/full/print-out-copy 3/89
C HAPTER 2
INDUSTRY AND C OMPANY P ROFILE
2.1 I NDUSTRY P ROFILE -A UTOMOBILE INDUSTRY
The history of the automobile begins as early as 1769, with the creation of steam-powered automobilescapable of human transport. In 1806, the first cars powered by internal combustion enginesrunning onfuel gas appeared, which led to theintroduction in 1885 of the ubiquitous moderngasoline- or petrol-fueled internalcombustion engine. Cars powered byelectricitybriefly appeared at the turn of the 20thcentury but largely disappeared from commonality until the turn of the 21st century,
when interest in low- and zero-emissionstransportation was reignited. As such, the earlyhistory of the automobile can be divided into a number of eras based on the prevalentmethod of automotive propulsion during that time. Later periods were defined by trendsin exterior styling and size and utility preferences.
Eras of Invention
Pioneer inventors
German engineer Karl Benz, inventor of numerous car-related technologies,is generally regarded as the inventor of the modern automobile. Thefour-stroke petrol (gasoline) internal combustion enginethat constitutes the most prevalent form of modernautomotive propulsion is a creation of German inventor Nicholas Otto. The similar four-stroke diesel enginewas also invented by a German, Rudolf Diesel. The hydrogenfuel cell, one of the technologies hailed as a replacement for gasoline as an energy source for cars, was discovered in principle by yet another German,Christian Friedrich Schönbein,
in 1838. The batteryelectric car owes its beginnings to HungarianÁnyos Jedlik , one of the inventors of theelectric motor , andGaston Planté, who invented thelead-acid battery in 1859.
8/7/2019 Print Out Copy
http://slidepdf.com/reader/full/print-out-copy 4/89
Early automobiles
Steam automobiles
Ferdinand Verbiest, a member of aJesuit mission in China, built the firststeam- powered vehicle around 1672, designed as a toy for the Chinese Emperor, it being of small scale and unable to carry a driver or passenger but, quite possibly, the first workingsteam-powered vehicle ('auto-mobile').
Electric automobiles
In 1828,Ányos Jedlik , a Hungarian who invented an early type of electric motor ,
created a tiny model car powered by his new motor. In 1834,Vermont blacksmith Thomas Davenport, the inventor of the first American DC electrical motor, installed hismotor in a small model car.
Veteran era
The first production of automobiles was byKarl Benzin 1888 inGermanyand,under license from Benz, inFranceby Emile Roger .
Brass or Edwardian era
Named for the widespread use of brass in the United States, the Brass (or Edwardian) Era lasted from roughly 1905 through to the beginning of World War I in1914. 1905 was asignal year in the development of the automobile, marking the pointwhen the majority of sales shifted from the hobbyist and enthusiast to the average user.
Vintage era
The vintage era lasted from the end of World War I(1919), through theWall Street Crashat the end of 1929. Three years later,Hermann Rieseler of Vulcan Motor invented the firstautomatic transmission, which had two-speed planetarygearbox,torque converter , and lockupclutch it never entered production.

8/7/2019 Print Out Copy
http://slidepdf.com/reader/full/print-out-copy 5/89
Pre-WWII era
The pre-war part of the classic era began with theGreat Depressionin 1930,commonly placed at 1948. It was in this period that integratedfendersand fully-closed
bodiesbegan to dominate sales.
Modern era
The modern era is normally defined as the 25 years proceeding the current year.However, there are some technical and design aspects that differentiate modern cars fromantiques.
After 1880 and Before 1990
• About hundred years ago the first motorcar was imported. Import duty onvehicle was introduced. Indian great royal road was conceived.
• First car brought in India by a princely ruler in 1898.• Simpson and company established in 1840.• They were the first to build a stem car and stem bus to attempt motorcar
manufacture, to build and operate petrol driver passenger service and toimport American chassis in India.
In 1980’s
• The period of liberalized policy and intense completion.• First phase of liberalization announced.• Unfair practices of monopoly, oligopoly etc slowly disappeared.• Liberalization of the protectionism policies of the government.• Lot of new foreign collaborations came up in the eighties. My company
went in for Japanese collaborations.• Andhra Pradesh scooters entered into collaboration with piggio for
manufacture of vesper model
8/7/2019 Print Out Copy
http://slidepdf.com/reader/full/print-out-copy 6/89
• Hindustan motors Ltd., Inc collaboration with Isuzu of Japan, introducedin Isuzu truck in early eighties.
• All entered into collaboration with Leyland vehicles ltd., for developmentof integral busses and with Hino motors of Japan for the manufacturer of W series of Engines.
• TELCO after the expiry of its contract with Daimler Benz indigenouslyimproved the same Benz model and introduced it in market.
• Government approved four new firms in the LCV market, namely, DCM,Eicher, Searaj, and allwyn; they had collaborations with Japanesecompanies namely, Toyota, Mitsubishi, Mazda and Nissan respectively.
• The two-Wheeler market increased, since 1982 the government had
permitted foreign collaborations for the manufacturing of two wheelers upto 100cc engine capacity. Foreign equity up to 4% was also allowed.
• In 1983 Maruti udyog Ltd was started in collaboration with Suzuki, aJapanese firm.
• Other three cars manufactures namely, Hindustan motors Ltd, Premier automobiles Ltd, Standard motor production of Indian Ltd, also introducednew models in the market.
• At that time there were five passenger car manufacturers in India MarutiUdyog Ltd., Hindustan motors Ltd, premier automobiles ltd., standardmotors production of India Ltd, Sipani automobiles.
• Ashok Leyland Ltd and TELCO were strong players in the commercialvehicles sector.
• In 1983-84 Bajaj Tempo Ltd. , entered into collaboration with Daimler Benz of Germany for manufacture for LCV’s
•
Important policy changed like relaxation in MRTP and FERA deli censingof some ancillary products, broad banding of the products, modificationsin licensing policy, concessions to private sector and foreign collaboration policy etc., resulted in higher growth/better performance of the industrythan in the earlier decades.
• Lohia Machines Ltd., entered in collaboration with piggio of Italy.
8/7/2019 Print Out Copy
http://slidepdf.com/reader/full/print-out-copy 7/89
• Kinetic Engineering Ltd entered in to financial and technical collaborationwith Honda motor company of Japan for 100cc scooters.
• In the motorcycle segment firms had shifted their emphasis from heavier models to lighter and fuel-efficient models. Indian market was floodedwith new 100cc models manufactured by different firms with Japantechnology.
• In moped segment there were 23 firms engaged in their production but thevirtual oligopoly of kinetic Engineering Ltd., SCL and Majestic Autoremind intact. This segment had less collaboration
2.2 M AHINDRA & M AHINDRA L IMITED
Mahindra & Mahindra Limited is the flagship company of the MahindraGroup, a multinational conglomerate based in Mumbai, India. The company was set up in1945 in Ludhiana as Mahindra & Mohammed by brothers K.C. Mahindra and J.C.Mahindra and Malik Ghulam Mohammed. After India gained independence and Pakistanwas formed, Mohammed immigrated to Pakistan where he became the nation's firstfinance minister. The company changed its name to Mahindra & Mahindra in 1948.Mahindra & Mahindra was set up as a steel trading company in 1945. It soon expanded
into manufacturing general-purpose utility vehicles, starting with assembly under licenseof the iconic Willys Jeep in India. Soon established as the Jeep manufacturers of India,M&M later branched out into the manufacture of light commercial vehicles (LCV’s) andagricultural tractors.
Today, M&M is the leader in the utility vehicle segment in India with itsflagship UV Scorpio and enjoys a growing global market presence in both the automotiveand tractor businesses. Over the past few years, M&M has expanded into new industries
and geographies. They entered into the two-wheeler segment by taking over KineticMotors in India. M&M also has controlling stake in REVA Electric Car Company andacquired South Korea's SsangYong Motor Company in 2011. The US based ReputationInstitute recently ranked Mahindra among the top 10 Indian companies in its 'Global 200:The World's Best Corporate Reputations' list.Mahindra & Mahindra is a major automobile manufacturer of utility vehicles, passenger cars, pickups, commercial
8/7/2019 Print Out Copy
http://slidepdf.com/reader/full/print-out-copy 8/89
vehicles, and two wheelers. Its tractors are sold on six continents it has acquired plants inChina and the United Kingdom, and has three assembly plants in the USA. M&M has partnerships with international companies like Renault SA, France and InternationalTruck and Engine Corporation, USA. M&M has a global presence and its products areexported to several countries. Its global subsidiaries include Mahindra Europe Srl. basedin Italy, Mahindra USA Inc., Mahindra South Africa and Mahindra (China) Tractor Co.Ltd.M&M made its entry into the passenger car segment with the Logan in April 2007under the Mahindra Renault joint venture. M&M will make its maiden entry into theheavy trucks segment with Mahindra Navistar, the joint venture with International Truck,USA.
M&M's automotive division makes a wide range of vehicles includingMUVs, LCV’s and three wheelers. It offers over 20 models including new generationmulti-utility vehicles like the Scorpio and the Bolero. It formerly had a joint venture withFord called Ford India Private Limited to build passenger cars. At the 2008 Delhi AutoShow, Mahindra executives said the company is pursuing an aggressive productexpansion program that would see the launch of several new platforms and vehicles over the next three years, including an entry-level SUV designed to seat five passengers and powered by a small turbo diesel engine. True to their word, Mahindra & Mahindralaunched the Mahindra Xylo in January 2009, and as of June 2009, the Xylo has soldover 15000 units. Also in early 2008, Mahindra commenced its first overseas CKDoperations with the launch of the Mahindra Scorpio in Egypt, in partnership with theBavarian Auto Group. This was soon followed by assembly facilities in Brazil. Vehiclesassembled at the plant in Bramont, Manaus, include Scorpio Pick Ups in single anddouble cab pick-up body styles as well as SUVs.Mahindra & Mahindra has controllingstakes in Reva electric and has submitted letter of Intent for South Korea's SsangYongMahindra plans to sell the diesel SUVs and pickup trucks starting in late 2010 in NorthAmerica through an independent distributor, Global Vehicles USA, based in Alpharetta,Georgia. Mahindra announced it will import pickup trucks from India in knockdown kit(CKD) form to circumvent the Chicken tax. CKDs are complete vehicles that will beassembled in the U.S. from kits of parts shipped in crates. On 18 October 2010, however,
8/7/2019 Print Out Copy
http://slidepdf.com/reader/full/print-out-copy 9/89
it was reported that Mahindra had indefinitely delayed the launch of vehicles into the North American market, citing legal issues between it and Global Vehicles after Mahindra retracted its contract with Global Vehicles earlier in 2010, due to a decision tosell the vehicles directly to consumers instead of through Global Vehicles. However, a November 2010 report quoted John Perez, the CEO of Global vehicles USA, asestimating that he expects Mahindra’s small diesel pickups to go on sale in the U.S. byspring 2011, although legal complications remain, and Perez, while hopeful, admits thatarbitration could take more than a year. Later reports suggest that the delays may be dueto a Mahindra scrapping the original model of the truck and replacing it with an upgradedone before selling them to Americans.
In 2010, India's Mahindra & Mahindra Limited was named as the preferred bidder to acquire the bankruptcy-protected SsangYong Motor Company.Mahindra is expected to gain a controlling stake in the company by March 2011 and the planned acquisition has been approved by South Korea's Free Trade Commission.M&Mis one of the leading tractor brands in the world by volume. It is also the largestmanufacturer of tractors in India with sustained market leadership of over 25 years. Itdesigns, develops, manufactures, and markets tractors as well as farm implements.Mahindra Tractors (China) Co. Ltd. manufactures tractors for the growing Chinesemarket and is a hub for tractor exports to the USA and other nations. M&M has a 100%subsidiary, Mahindra USA, which assembles products for the American market.
Banking & Finance
Kotak Mahindra Bank
The Kotak Mahindra group is a financial organization established in 1985in India. It was previously known as the Kotak Mahindra Finance Limited, a non-bankingfinancial company. In February 2003, Kotak Mahindra Finance Ltd, the group's flagshipcompany was given the license to carry on banking business by the Reserve Bank of India (RBI). Kotak Mahindra Finance Ltd. is the first company in the Indian bankinghistory to convert to a bank. The bank is headed by K.M. Gherda as Chairman and Uday

8/7/2019 Print Out Copy
http://slidepdf.com/reader/full/print-out-copy 10/89
Kotak as Executive Vice Chairman & Managing Director. Shankar Acharya is thechairman of board of Directors in the company. The Bank has its registered office at Nariman Bhavan, Nariman Point, and Mumbai.
Mahindra Financial Services
Mahindra & Mahindra Financial Services Ltd (Mahindra Finance) is oneof 's leading non-banking finance companies focused on providing finance for utilityvehicles, tractors and cars in the rural and semi-urban sector.Mahindra Finance currentlyhas the largest network of over 436 branches . It has entered into more than 600,000customer contracts and has disbursements of around Rs. 21000crore since inception.
Information Technology
Tech Mahindra and Mahindra Satyam
Tech Mahindra specializes in solutions for communications industry is telecom-focusedsystem integration and IT Solutions Company from India.Mahindra Satyam is a leadingglobal business and information technology services companyBristlecone. It provides a range of services focused on the entire supply chain spectrum,including strategy and process consulting, systems implementation and business processoutsourcing, to leading companies globally. Mahindra is generally a low base company itgets his roots from the Asian companies
Mahindra Navistar
Mahindra Navistar Automotives Ltd is a joint-venture between Navistar International (49%) of the United States and Mahindra & Mahindra (51%).Mahindra Navistar has started its full-fledgedmanufacturing activities for the entire spectrum of commercial vehicles ranging from 3.5 – 49tons GVW/GCW. Huge investments are being made in product development and in setting up of
a Greenfield manufacturing facility at Chakan near Pune, India. The products of MNAL arecurrently sold under the trademark of Cabking, Loading and Tourister.
About Navistar

8/7/2019 Print Out Copy
http://slidepdf.com/reader/full/print-out-copy 11/89
Navistar International Corporation is a U.S. holding company which owns themanufacturer of International brand commercial trucks, MaxxForce brand diesel engines,IC Bus School and commercial buses, Workhorse brand chassis for motor homes and stepvans, and are a private label designer and manufacturer of diesel engines for the pickuptruck, van and SUV markets. The company is also a provider of truck and diesel engine parts and service.
The company's products, parts, and services are sold through a network of nearly 1,000dealer outlets in the United States, Canada, Brazil, and Mexico and more than 60 dealersin 90 countries throughout the world. The company also provides financing for itscustomers and distributors principally through its wholly owned subsidiary, Navistar
Financial Corporation.
2.3 COMPANY PROFILE
The Susee Group of Companies is a family owned business house withinterests in Automobiles, IT and Finance. The groups are on the anvil of celebratingabout four decades of successful business operations. The name "Susee" is a combinationof the Tamil Initials "Su" {Subramanian} and "See" {Seeniyammal} of the founding
parents of the Family. A customer is the most important visitor on our premises. He is notdependent on us. We are dependent on him. He is not an interruption in our work - he isthe purpose of it. We are not doing him a favor by serving him. He is doing us a favor bygiving us the opportunity to serve him.
2.4 VISION & MISSION
"@ ur service... always"
Susee automobiles Pvt Ltd., is an automobile retailer and their vision is that theywill be in the service of customers always. Their motto is service the customer always.
“To provide the best quality of service at affordable prices, in a timely manner using a sustainable and profitable way”
8/7/2019 Print Out Copy
http://slidepdf.com/reader/full/print-out-copy 12/89
The mission of Susee automobiles is to provide the service to the customer atreasonable price. In the automobiles industry the service after sales is very important. SoSusee automobiles are concentrating on service keenly. Thus they kept their mission as to provide the sales at affordable price so that the entire customer can take the service withreasonable cost in the timely manner and profitable way.
2.5 HISTORY
As early as in the 1930's, the founding parents of the group were involved in thetrade of Pulses and Grains in Thirumangalam, Madurai and Tuticorin. From humble beginnings, the group has come a long way with the Automotive Business coveringalmost every spectrum of transport. The IT business is a BPO unit. The Finance businesshas a strong and healthy portfolio. The group has its roots spread across the state of Tamilnadu with aggressive growth plans. The third generation entrepreneurs are now atthe helm of affairs and are poised to be assisted by the fourth generation family membersin making strong strides towards expansion and growth opportunities. The group iscurrently focused on growth engines to drive the business to multiply manifold.
2.6 MANAGEMENT TEAM
Mr.Jeyabalan has a plethora of experience in the automotive business and is adoyen in the Automotive Sector of Tamilnadu. Having played a pivotal role in thefamilies’ automotive business, he now dons the mantle of Chairman and has also beenelected as the President of the Tamilnadu Chamber of Commerce and Industry for theyear 2008-2009.
Mr. Rajiv is an aggressive leader with a vision to grow the business manifold. Hehas spread the roots of the business to include interests in Information Technology andRetail. He has strong global exposure and is widely traveled. He has been instrumental ingrowing the business more than fivefold in the past decade.
Mr. Thenappan is the Chief Operations Officer and has been in the AutomotiveIndustry for well over a decade holding various responsibilities varying from OEM
8/7/2019 Print Out Copy
http://slidepdf.com/reader/full/print-out-copy 13/89
suppliers to Automotive Dealerships across several verticals. He has an ElectronicsEngineering Degree from National Institute of Technology [Formerly Known as RECSurat]. He is a dynamic leader with hands on approach towards business. He holdsoperational responsibility for the Group's Automotive Business.
Mr. J.S. Dominique is a Chartered Accountant with over 20 years of experience inthe field of Accounts, Corporate Finance, Project Finance, Textile and Power Projects.He is the Vice President of Finance for the Susee Group. He is responsible for FinancialPlanning, Accounts, MIS, Audit/Taxation and Fund Management. As head of the Financeand Accounting Function, he controls the fiscal functions of the Susee Group.
MILESTONES
1944 Salt, Pulses and Grains
1955 Tobacco/FMCG Distribution
1966 Gas Stations
1969 Automobiles
1991 Finance
2002 IT/ITES
2.7 AUTOMOBILES
SPARES
Spares - Two Wheeler
They are the authorized genuine spare parts sellers for the following leading twowheeler brands
Spares - Three Wheeler
8/7/2019 Print Out Copy
http://slidepdf.com/reader/full/print-out-copy 14/89
They are the authorized genuine spare parts sellers for the following leading threewheeler brands
Spares - Four Wheeler
They are the authorized genuine spare parts sellers for the Mahindra brands
Spares - Trucks & Multiaxle
They have the exclusive dealer for AMW having good population of vehicle. Wehave all frequent genuine parts availability and we got good relationship withvendor products like Fleet guard, Hyvafilters, Volvo line oil etc... We got all sparesreadily available.
2.8 FINANCE - RETAIL
Susee Finance & Leasing Company private ltd, is an NBFC incorporated in theyear 1991, is part of the Susee Group of Companies. The company caters to thefinancial needs of middle income/lower income group in respect of automotive hire purchase finance. The company has its operations at several locations in Tamilnaduand is based in Madurai. The salient features of our Non-Banking FinanceCompany are:
• Registered NBFC with RBI.• Hassle free financing.• Spot sanctioning of loans to eligible customers.• Easy terms of repayment at competitive interest rates.• Collection of monthly /weekly installments at the doorstep of customers.
2.9 INFORMATION TECHNOLOGY
8/7/2019 Print Out Copy
http://slidepdf.com/reader/full/print-out-copy 15/89
• SUSEE ISYS AT A GLANCE
Susee iSys has been involved in service delivery for domestic and internationalclients for a variety of services with one common underlying building block.”
Providing Efficient, Cost effective and sustainable Business Process Outsourcingand Information Technology Enabled Services". Our range of services focuses onfinding value in Archiving Data for our clients and we focus on releasing the fullvalue of archived Data. We are involved in Data Archiving, Conversion and E-Publishing. We are based in Madurai with satellite offices across the state of Tamilnadu.
2.10 CORPORATE SOCIAL RESPONSIBILITY
The Susee Group provides support to the M.S.Chellamuthu Trust and ResearchFoundation in various methods including providing employment opportunities for thedifferently abled, procuring of products created by the differently abled and providingresources to the various institutes of the Chellamuthu Group. The M.S.ChellamuthuTrust and Research Foundation were established with "Srishti", a half-way home for people with psychiatric disabilities, in September 1992. It now houses 60 residents.
Today the Trust runs half-a-dozen other projects:
Retreat : A long term care centre with 50 beneficiaries.Bodhi : A Half Way Home with 40 beneficiaries.Sakthi : A rehabilitation home.Aakaash : A special school for 60 mentally retarded rural children.Vriksha : A rehabilitation home for 30 women; a home for 60 adults.
Trishul : A de-addiction and after care centre with 30 beneficiaries.
8/7/2019 Print Out Copy
http://slidepdf.com/reader/full/print-out-copy 16/89
C HAPTER 3
R EVIEW OF L ITERATURE
Introduction
Employee turnover is a much studied phenomenon. There is a vast literature on thecauses of voluntary employee turnover dating back to the 1950s. By developing
multivariate models that combine a number of factors contributing to turnover andempirically testing the models researchers have sought to predict why individuals leaveorganizations. Many studies are based on only a small number of variables which oftenonly explain a small amount of variability in turnover. Another criticism of turnover studies is that they do not adequately capture the complex psychological processesinvolved in individual turnover decisions. A recent study of turnover by Boxall et al(2003) in New Zealand confirmed the view that motivation for job change ismultidimensional and that no one factor will explain it.
However, over time there have been a number of factors that appear to beconsistently linked to turnover. An early review article of studies on turnover by Mobleyet al (1979) revealed that age, tenure, overall satisfaction, job content, intentions toremain on the job, and commitment were all negatively related to turnover (i.e. the higher the variable, the lower the turnover). In 1995, a meta-analysis of some 800 turnover studies was conducted by Hom and Griffeth, which was recently updated (Griffeth et al,2000). Their analysis confirmed some well-established findings on the causes of turnover. These include: job satisfaction, organizational commitment, comparison of alternatives and intention to quit. These variables are examined in more detail below, asare a number of other factors where the evidence on the link to turnover is lessconclusive.

8/7/2019 Print Out Copy
http://slidepdf.com/reader/full/print-out-copy 17/89
Comparison of alternatives
Aggregate level economic studies provide consistent and significant evidenceof the impact of labour market conditions on turnover rates at an aggregate level. As
Mobley
8/7/2019 Print Out Copy
http://slidepdf.com/reader/full/print-out-copy 18/89
et al (1979) pointed out, at an aggregate level the relationship between economic factorssuch as employment levels or job vacancies and turnover has been well established. At anindividual level, the labour market approach emphasizes expected utility and rational
economic choice among employees and the perceived availability of alternative jobopportunities.
The relationship between alternatives and turnover on an individual level has been researched widely since March & Simon’s 1958 seminal work on ease of movement. Much of the subsequent research focused on the link between job satisfaction, perceived alternative opportunities and turnover. Later, researchers began to focus on therole of both actual and perceived opportunities in explaining individual turnover decisions.
Subsequent research has indicated that actual alternatives are a better predictor of individual turnover than perceived opportunities. Research on the impact ofunemployment rates as a proxy for actual opportunities in employee turnover revealedthat unemployment rates affected the job-satisfaction/turnover intent relationship but notactual turnover (Kirshenbaum & Mano-Negrin, 1999). They concluded that macro levelanalysis predicted turnover patterns but perceptions of opportunities did not. This pointwas reinforced in their study on medical centers in various locations used measures of perceived and objective opportunities in internal and external labour markets.
The authors concluded that objectives opportunities were a better set of explanations of actual turnover behaviour than either perceived internal or external labourmarket opportunities. Nevertheless, while actual alternatives appear to be a better predictor of turnover, there is also well-established evidence of the link between perceived alternatives and actual turnover. In their most recent meta-analysis, Griffeth etal (2000) confirmed that perceived alternatives modestly predict turnover.
Intentions to quit
Much of the empirical research on turnover is based on actual turnover,although some studies are based on intentions to quit. Apart from the practical difficultyin conducting turnover research among people who have left an organization, some

8/7/2019 Print Out Copy
http://slidepdf.com/reader/full/print-out-copy 19/89
researchers suggest that there is a strong link between intentions to quit and actualturnover. Mobley et al (1979) noted that the relationship between intentions and turnover is consistent and generally stronger than the satisfaction-turnover relationship, although itstill accounted for less than a quarter of the variability in turnover. Much of the researchon perceived opportunities has been found to be associated with intentions to leave butnot actual turnover (Kirshenbaum & Mano-Negrin, 1999). One of the possible reasons isthat intentions do not account for impulsive behaviour and also that turnover intentionsare not necessarily followed through to lead to actual turnover.
Organizational commitment
Many studies have reported a significant association between organizational
commitment and turnover intentions (Lum et al, 1998). Tang et al’s (2000) studyconfirmed the link between commitment and actual turnover and Griffeth et al’s (2000)analysis showed that organizational commitment was a better predictor of turnover thanoverall job satisfaction. Researchers have established that there are different types of organizational commitment. Allen & Meyer (1990) investigated the nature of the link between turnover and the three components of attitudinal commitment: affectivecommitment refers to employees’ emotional attachment to, identification with andinvolvement in the organization; continuance commitment refers to commitment base oncosts that employees associate with leaving the organization; and normative commitmentrefers to employees’ feelings of obligation to remain with the organization. Put simply,employees with strong affective commitment stay with an organization because theywant, those with strong continuance commitment stay because they need to, and thosewith strong normative commitment stay because they feel they ought to. Allen andMeyer’s study indicated that all three components of commitment were a negativeindicator of turnover. In general, most research has found affective commitment to be the
most decisive variable linked to turnover.
Job satisfaction
The relationship between satisfaction and turnover has been consistentlyfound in many turnover studies (Lum et al, 1998). Mobley et al 1979 indicated thatoverall job satisfaction is negatively linked to turnover but explained little of the
8/7/2019 Print Out Copy
http://slidepdf.com/reader/full/print-out-copy 20/89
variability in turnover. Griffeth et al (2000) found that overall job satisfaction modestly predicted turnover. In a recent New Zealand study, Boxall et al (2003) found the mainreason by far for people leaving their employer was for more interesting work elsewhere.It is generally accepted that the effect of job satisfaction on turnover is less than that of organizational commitment.
The link between satisfaction and commitment
Some researchers have established a relationship between satisfaction,organizational commitment and turnover. Lum et al’s (1998) study of pediatrics nursessuggested that organizational commitment has the strongest and most direct impact on theintention to quit whereas job satisfaction has only an indirect influence. They suggestedthat satisfaction indirectly influences turnover in that it influences commitment and henceturnover intentions. (Mueller & Price, 1990 cited in Lum).
Elangovan (2001) noted that the notion of job satisfaction and organizationalcommitment being causally related has not been incorporated in most turnover models.His study indicated there were strong causal links between stress and satisfaction (higher stress leads to lower satisfaction) and between satisfaction and commitment (lower satisfaction leads to lower commitment). He further noted a reciprocal relationship between commitment and turnover intentions (lower commitment leads to greater intentions to quit, which in turn further lowers commitment). In summary, onlycommitment directly affected turnover intentions.
Characteristics of employees
Despite a wealth of research, there appear to be few characteristics thatmeaningfully predict turnover, the exceptions being age and tenure. Age is found to benegatively related to turnover (i.e. the older a person, the less likely they are to leave an
organization). However, age alone explains little of the variability in turnover and as ageis linked to many other factors, alone it contributes little to the understanding of turnover behaviour.Tenure is also negatively related to turnover (the longer a person is with anorganization, the more likely they are to stay). Mangione in Mobley et al concluded

8/7/2019 Print Out Copy
http://slidepdf.com/reader/full/print-out-copy 21/89
That length of service is one of the best single predictors of turnover. Griffeth et al alsofound that age and tenure have a negative relationship to turnover.
There is little evidence of a person’s sex being linked to turnover. Griffeth et
al’s 2000 meta-analysis re-examined various personal characteristics that may be linkedto turnover. They concluded that there were no differences between the quit rates of menand women. They also cited evidence that gender moderates the age-turnover relationship(i.e. women are more likely to remain in their job the older they get, than do men). Theyalso found no link between intelligence and turnover, and none between race andturnover.
Wages and conditions
The research conducted on the link between dissatisfaction with pay andvoluntary turnover appears to be inconclusive. Mobley et al (1979) concluded that resultsfrom studies on the role of pay in turnover were mixed but that often there was norelationship between pay and turnover. Other studies found no significant relationship.On the other hand Campion (1991) cited in Tang suggests that the most important reasonfor voluntary turnover is higher wages/career opportunity. Martin (2003) investigates thedeterminants of labour turnover using establishment-level survey data for the UK. Martin
indicated that there is an inverse relationship between relative wages and turnover (i.e.establishments with higher relative pay had lower turnover).
Pay and performance
Griffeth et al (2000) noted pay and pay-related variables have a modest effecton turnover. Their analysis also included studies that examined the relationship between pay, a person’s performance and turnover. They concluded that when high performers areinsufficiently rewarded, they leave. They cite findings from Milkovich and Newman
(1999) that where collective reward programs replace individual incentives, their introduction may lead to higher turnover among high performers.
Flat-rate versus piece-rate pays systems
Taplin et al (2003) conducted a large-scale turnover study in the British clothing industry.Two factors emerged as the most significant reasons for employees leaving the industry.
8/7/2019 Print Out Copy
http://slidepdf.com/reader/full/print-out-copy 22/89
One was the low level of wage rates in the clothing industry relative to other manufacturing sectors. The other reason referred to industry image with staff leaving because of fears relating to the long-term future of clothing manufacture in the UK. Inthis study, turnover rates were highest among the most skilled workers.
The study also examined the role of payment systems in turnover. The researchers foundthat where there were flat-rate payment systems alone, average turnover exhibited astatistically significant difference from the industry mean (i.e. they were 4.5 per centlower). However, most firms in the clothing industry adhered to piece rate paymentsystems finding it to be the most effective way of regulating the effort-bargain. This is, inthe authors’ view, despite anecdotal evidence that many skilled workers dislike itsunpredictability and new entrants to the workforce lack the skills to maximize their earnings potential.
Attitudes to money
For some individuals pay will not be the sole criterion when people decide tocontinue within an existing job. In their study of mental health professionals, Tang et al(2000), Examined the relationship between attitudes towards money, intrinsic jobsatisfaction and voluntary turnover. One of the main findings of this study is thatvoluntary turnover is high among employees who value money (high money ethicendorsement), regardless of their intrinsic job satisfaction. However, those who do notvalue money highly but who have also have low intrinsic job satisfaction tended to havethe lowest actual turnover. Furthermore, employees with high intrinsic job satisfactionand who put a low value on money also had significantly higher turnover than this secondgroup. The researchers also found that placing a high value of money predicted actualturnover but that withdrawal cognitions (i.e. thinking about leaving) did not.
Training and career development
Martin (2003) detected a complex relationship between turnover and training.He suggested that establishments that enhance the skills of existing workers have lower turnover rates. However, turnover is higher when workers are trained to be multi-skilled,which may imply that this type of training enhances the prospects of workers to findwork elsewhere. The literature on the link between lower turnover and training has found

8/7/2019 Print Out Copy
http://slidepdf.com/reader/full/print-out-copy 23/89
that off-the-job training is associated with higher turnover presumably because this typeof training imparts more general skills (Martin, 2003).
Impact of training on mobility
Shah and Burke (2003) reviewed some of the literature on the relationship between turnover and training. In a British study examining the impact of training onmobility, Green et al (2000) concluded that, in aggregate, training has on average noimpact on mobility. However, training that is wholly sponsored by the individual (or their families) is on balance likely to be a prelude to job search. In contrast, when employers pay for training the downward effect on mobility is more likely.
Lynch (1991, 1992) concluded that both on-the-job and off-the-job training have a
significant effect on job mobility. While formal on-the-job training reduces the likelihoodof mobility, particularly for young women, off-the-job training increases the likelihood of mobility. In a study of six local labour markets in Britain, Elias (1994) found that womenwho received employer-provided and job-related training had a lower probability of changing employer or making the transition to non-employment, but for men trainingmade no significant difference to this type of turnover.
Effect of vocational training
In a study examining the effect of apprenticeships on male school leavers inthe UK, Booth and Satchell (1994) found that completed apprenticeships reducedvoluntary job-to-job, voluntary job-to-unemployment and involuntary job terminationrates. In contrast, incomplete apprenticeships tended to increase the exit rate to thesedestinations relative to those who did not receive any training. Winkelmann (1996)reported that in Germany apprenticeships and all other types of vocational training reducelabour mobility in spite of the fact that the German apprenticeship training is intended to
provide general and thus more transferable training.Career commitment
Chang (1999) examined the relationship between career commitment,organizational commitment and turnover intention among Korean researchers and foundthat the role of career commitment was stronger in predicting turnover intentions. When
8/7/2019 Print Out Copy
http://slidepdf.com/reader/full/print-out-copy 24/89
Individuals are committed to the organization they are less willing to leave the company.This was found to be stronger for those highly committed to their careers. The author alsofound that employees with low career and organizational commitment had the highest
turnover intentions because they did not care either about the company or their currentcareers.
Individuals with high career commitment and low organizational commitmentalso tend to leave because they do not believe that the organization can satisfy their career needs or goals. This is consistent with previous research that high career committers consider leaving the company if development opportunities are not provided by the organization. However, this group is not apt to leave and is likely to contribute tothe company if their organizational commitment is increased. Chang found thatindividuals become affectively committed to the organization when they perceive that theorganization is pursuing internal promotion opportunities, providing proper training andthat supervisors do a good job in providing information and advice about careers.
Rural or remote areas and lifestyle factors
A 2001 study of the factors influencing the recruitment and retention of nurses in rural and remote areas in Queensland found that overall work-related factors
were considered to be more important in decisions by nurses to leave rural and remotenursing practice. The five major factors influencing decisions to leave rural or remotearea nursing practice were management practices, emotional demands of work, workablecommunication, management recognition of work and family responsibilities.
The findings regarding lifestyle factors appear to be mixed. On the one hand,‘rural lifestyle’ was ranked as the third most important factor for staying in rural andremote practice and, similarly, ‘sense of belonging to the community’ was ranked fifth.
However, when respondents were asked to identify the most important factors thatinfluenced them to leave rural and remote health services, just fewer than 40 per cent of respondents cited issues related to the isolation caused by distance from basic amenitiesas one inducement for them to resign. These issues included traveling long distances to basic social and commercial activities, distance from family, friends and medical
8/7/2019 Print Out Copy
http://slidepdf.com/reader/full/print-out-copy 25/89
specialists, the comparatively high cost of living and a lack of communication facilitiessuch as the Internet, which would mitigate personnel and professional isolation.
The employment difficulties of non-metropolitan life were also a contributing reason for
nurses’ decisions to leave practice. For example, unavailability of suitable employment orcareer development opportunities for their spouse was cited by 21 per cent of respondents. Some respondents with children (16 per cent) also identified access tosuitable education, childcare facilities and specialist medical expertise, which are notusually available outside densely populated areas, as factors influencing leavingdecisions.
Other factors contributing to turnover
Turnover studies have highlighted the relationship between turnover and arange of other factors. Some of these findings are presented briefly below.
The role of ‘shocks’
Lee & Mitchell’s (1994) ‘unfolding model’ of employee turnover representeda significant departure from the previous labour market- and psychological-orientedturnover literature. This model is based on the premise that people leave organizations invery different ways and it outlines four decision pathways describing different kinds of
decisions to quit. A notable feature of the unfolding model is its emphasis on an event or ‘shock’ (positive or negative) that prompts some decisions to quit.
Morrell et al (2004) tested the unfolding model by studying the voluntaryturnover of nurses in the UK. Their findings indicated that shocks play a role in manycases where people decide to leave. Furthermore, they found that shocks not only prompted initial thoughts about quitting but also typically had a substantial influence overthe final leaving decision. They also noted that decisions to quit prompted by a shock are
typically more avoidable. The authors suggest that their research illustrates theimportance for managers of understanding avoid ability i.e. the extent to which turnover decisions can be prevented.

8/7/2019 Print Out Copy
http://slidepdf.com/reader/full/print-out-copy 26/89
Organizational size
Kirshenbaum & Mano-Negrin (1999) indicated that turnover is affected byorganizational size, with size being the key mediator of an organization’s internal labour
market. They suggest that organizational size impacts on turnover primarily throughwage rates but also through career progression paths. Developed internal organizationallabour markets produce lower departure rates since promotion opportunities have a strongnegative influence on departures for career-related reasons.
Unionisation
Martin (2003) looked at the effect of unions on labour turnover and foundclear evidence that unionism is associated with lower turnover. He suggested that lower
turnover is a result of the ability of unions to secure better working conditions thusincreasing the attractiveness for workers of staying in their current job. According toMartin, the relationship between lower turnover and unionizations has been wellestablished by researchers using both industry-level and individual data.
Influence of co-workers
A 2002 study by Kirschenbaum and Weisberg of 477 employees in 15 firmsexamined employees’ job destination choices as part of the turnover process. One of their
main findings was that co-workers’ intentions have a major significant impact on alldestination options - the more positive the perception of their co-workers desire to leave,the more employees themselves wanted to leave. The researchers suggest that a feelingabout co-workers’ intentions to change jobs or workplace acts as a form of social pressure or justification on the employee to make a move.
Supervision/management
Mobley et al (1979) concluded that a number of studies offered moderatesupport for a negative relationship between satisfaction with supervision and turnover (i.e. the higher the satisfaction with supervision, the lower the turnover).
8/7/2019 Print Out Copy
http://slidepdf.com/reader/full/print-out-copy 27/89
Retention strategies
IDS (2004) suggest that where there is a general turnover problem within theorganization, companies often takes a holistic approach aimed at fully engaging with
staff. This may encompass a wide range of measures such as:• improving recruitment procedures to ensure candidates receive a realistic impression of
the company and the job
• supporting new recruits during the critical first few weeks in the job
• providing clear career paths, interesting work and support for personal development
• considering work-life balance issues
• keeping pay in line with appropriate market rates
• offering an attractive employee benefits package
• creating a pleasant working environment
• communicating and consulting effectively with employees.
Examples of such measures are illustrated in more detail in the industry andorganizational studies below.
Industry studies
Clothing industry
In Taplin et al’s (2003) study of the British clothing industry, employer initiatives to reduce turnover included a range of measures. Improving remuneration packages was the single most common initiative with changes to the payments systemsmade so that workers could increase their earnings. Also important were more rigorousscreening procedures for new hires, and improved training programs designed to bringnew workers up to speed so that they could maximize their piece rate earnings potential.Various quality of working life initiatives were introduced, such as flexible workinghours and forms of employee participation (e.g. works councils).
8/7/2019 Print Out Copy
http://slidepdf.com/reader/full/print-out-copy 28/89
Accommodation industry
A recent study (Davies et al, 2001) examined the effect of three humanresource strategies (performance appraisal, salary and benefit strategies), and training and
development initiatives in the Western Australian accommodation industry. The authorsconcluded that only training and development indicated a reduced turnover of employees.
Mining
A study of turnover in ‘Fly-In Fly-Out’ (FIFO) mining operations in Australia(Beach et al 2003) showed that turnover rates between mines operating within the samegeneral labour market varied considerably, suggesting that the main drivers of turnover were often internal, rather than external to mine sites. In terms of managing turnover,
sites which had lower turnover, was attributed to a combination of four factors: equitableremuneration; commitment to training and skills development; good management; anddeveloping and maintaining a positive organizational culture. Managers at some sitesindicated they tried to control turnover by recruiting for a good ‘person-organization’ fit.
Case studies of organizations
The retention strategies outlined here are based on organizational-specificinitiatives. One of the problems with organizational-case studies is that their experiencemay not be general sable, given that the causes of turnover and the resulting strategies arelikely to be specific to a particular organization, a site or even a particular group of Employees. Another problem is that where a combination of measures are used (which isoften the case) it is very difficult to attribute success to one particular element of thestrategy. Nevertheless, some common practices can be drawn from these experiences thatappear to be successful in helping to improve retention.
The first two examples are academic studies while the following table summarizes themain features of the retention strategies adopted by a range of UK organizations tosuccessfully improve retention.

8/7/2019 Print Out Copy
http://slidepdf.com/reader/full/print-out-copy 29/89
Hospital
A Canadian study by Lum et al (1998) assessed the impact of certain pay policies uponthe turnover intentions of pediatrics nurses. Two types of salary supplements were
introduced – bonuses to intensive care nurses only and a 5 per cent salary differential for all staff nurses – to reduce turnover. The supplements were structured in such a way as tohave the most favorable influence on the senior staff nurses who were presumed to be themost experienced and those most valuable employees. Satisfaction with pay had bothdirect and indirect effects on turnover intent. They found that although pay satisfaction(unlike job satisfaction) was significantly associated with reducing intended turnover, itsindirect effect upon turnover intent, mediated through job satisfaction and organizationalcommitment was weaker. In particular, nurses with greater experience were moresatisfied with their pay and were less likely to leave, which was the anticipated effect of the salary supplements. The anecdotal evidence showed that the senior nurses perceivedthe pay supplements to be an important recognition of their contribution to theorganization.
Department store
In a study of retail salespeople (Firth et al, 2003) found that job stressors (e.g. work
overload, job ambiguity) are the factors that trigger the chain of psychological states thatlead to intention to quit. They suggested that supervisor support can reduce the impact of stressors on psychological states and intentions to quit. Monitoring workloads andsupervisor-subordinate relationships by management may not only reduce stress butincrease job satisfaction and commitment to the organization.
8/7/2019 Print Out Copy
http://slidepdf.com/reader/full/print-out-copy 30/89
C HAPTER 4
R ESEARCH M ETHODOLOGY
4.1 O BJECTIVE OF THE STUDY
1) To fulfill the future needs and aspirations of employees in the organization.
2) To identify the satisfaction level of employees in the organization.
3) To ensure co-ordination between the employees and the organization.
4) To protect the interest of the employees in the organization.
5) To bring out proper framework between employees and organization to improve thecompany’s image.
4.2 M ETHODOLOGY
4.2.1 C OVERAGE
This research covers the employees of Susee group at Madurai.
4.2.2 D ATA C OLLECTION M ETHOD
The data are collected via survey. In these surveys, the respondents respond to aseries of question based around a number of key
4.2.3 D ATA ANALYSIS
The process of data collection and the sampling technique used in the study are given.The data obtained from the respondents need to be analyzed to understand the underlyingstructure of inter-relationships among variables. The software used is SPSS.
8/7/2019 Print Out Copy
http://slidepdf.com/reader/full/print-out-copy 31/89
4.2.4 SPSS
SPSS is short for Statistical Product and Service Solutions. In the current study thestatistical tools used are:
Frequency analysisCross tabulationChi squareCorrelationOne way annovaReliability analysis.
C HAPTER 5
R ESEARCH DESIGN
5.1 I NTRODUCTION
The research design that is adopted in this study is descriptive design.Descriptive research is used to obtain information concerning the current status of the phenomena to describe, "What exists" with respect to variables or conditions in asituation. Thus it involves Statement of the problem, Identification of informationneeded to solve the problem, Selection or development of instruments for gathering theinformation, Identification of target population and determination of sampling procedure,Design of procedure for information collection, Collection of information, Analysis of information, Generalizations and/or predictions.
5.2 SAMPLING DESIGN
5.2.1P OPULATION
The population for this study is the employees of SUSEE GROUP, [MADURAI-kappalur & kalavasal]
5.2.2 S AMPLING T ECHNIQUE
8/7/2019 Print Out Copy
http://slidepdf.com/reader/full/print-out-copy 32/89
The sampling technique used is census survey method. The sample frame for this study isthe employees of SUSEE GROUP OF COMPANIES who are working at Madurai(Mahindra –prosper and commercial vehicle segment)
5.2.3 P OPULATION & S AMPLE SIZE
The population and sample size for this study is 300 employees of Susee group of companies.
5.2.4 S OURCES OF DATA
Data were collected through both primary and secondary data sources. Primary data was
collected through questionnaires. The research was done in the form of direct personalinterviews.
5.2.4.1 P RIMARY DATA
A primary data is a data, which is collected afresh and for the first time, and thushappen to be original in character. The primary data with the help of questionnaire werecollected from various clients.
5.2.4.2 S ECONDARY DATA
Secondary data consist of information that already exists somewhere, have beencollected. Secondary data is collected from company websites, other websites, companyfact sheets, magazines and brochures.
5.3 Q UESTIONNAIRE DESIGN
Proper care has been taken to ensure that the information needed match theobjectives, which in turn match the data collected through the questionnaire. The basiccardinal rules of Questionnaire design like using simple and clear words, the logical andsequential arrangement of questions has been taken care of.

8/7/2019 Print Out Copy
http://slidepdf.com/reader/full/print-out-copy 33/89
5.4 S TATISTICAL T OOLS
The statistical tools used for this analysis are:
Simple Percentage analysis:
Percentages are calculated and in certain cases percentages along with cross tabulationhas been calculated.
Cross tabulation:
The Cross tabs procedure forms two-way and multi way tables and provides a variety of tests and measures of association for two-way tables. The structure of the table andcategories are ordered determine what test or measure to use.
Correlation Analysis
Bivariate correlation analysis has been conducted to ascertain the relationship between career, recognition, work tasks, pay, benefits, work life balance, business unitand the results are provided in the table 4.5.1.
Pearson’s coefficient of correlation (obtained through multivariate correlationanalysis) is used to assess the strength, direction and probability of the linear association between two interval or ratio variables and varies from -1 to +1.It reflects the ratio of thevariance shared by the two variables. The percentage of variance shared by two variablesis the square of the Pearson’s correlation and is called the coefficient of determination .If the correlation is in the range of .1 to .3 (1% to 9%), then the correlation is said to beweak; correlation in the range of .4 to.6 (16% to 36%) as moderate and in the range of .7to .9 (49% to 81%) as strong (Hair et al .1998).
Reliability Test
Scale reliability is the ratio of true score variance to observed score variance. If there is less error inherent within the scale, then the scale will yield consistent resultsacross observations and research settings. In other words, reliability of an instrument isthe degree to which it yields a true score of the variable under consideration. Reliability is
8/7/2019 Print Out Copy
http://slidepdf.com/reader/full/print-out-copy 34/89
also defined as the extent to which any measuring instruments yields the same results onrepeated trials (Carmines and Zeller, 1990).
ANOVA
In statistics, analysis of variance (ANOVA) is a collection of statistical models,and their associated procedures, in which the observed variance in a particular variable is partitioned into components attributable to different sources of variation. In its simplestform ANOVA provides a statistical test of whether or not the means of several groups areall equal, and therefore generalizest -test to more than two groups.
chi-square
The chi-square distribution is used in the common chi-square tests for goodness of fit of an observed distribution to a theoretical one, the independence of two criteria of classification of qualitative data, and in confidence interval estimation for a populationstandard deviation of a normal distribution from a sample standard deviation. Many other statistical tests also use this distribution, like Friedman's analysis of variance by ranks.
Limitation of the study:
• The employees unwilling to spend sufficient time in answering the questionnaire because of their busy work.
• Fear of Respondents to elicit information in another constraint.
• The sample study at the study is estimated as 300 not the entire employees of theorganization.
• This study is only applicable for Susee group of companies at Madurai locality.

8/7/2019 Print Out Copy
http://slidepdf.com/reader/full/print-out-copy 35/89
C HAPTER 6
ANALYSIS AND INTERPRETATION
Analysis and interpretation plays the most important role in research process. Ithelps to extract findings from the collected data by applying the statistical techniques indiscovering the additional findings. It converts raw data into meaningful data by bridging
the gap between primary and secondary data. Analysis is done with an attempt toorganize and summarize data in order to enhance the effect of results in such a way thatenables to relate critical points with study’s objectives. The analysis and interpretation is based on the option chosen by the employees.
6.1 P ERCENTAGE ANALYSIS
Table 1
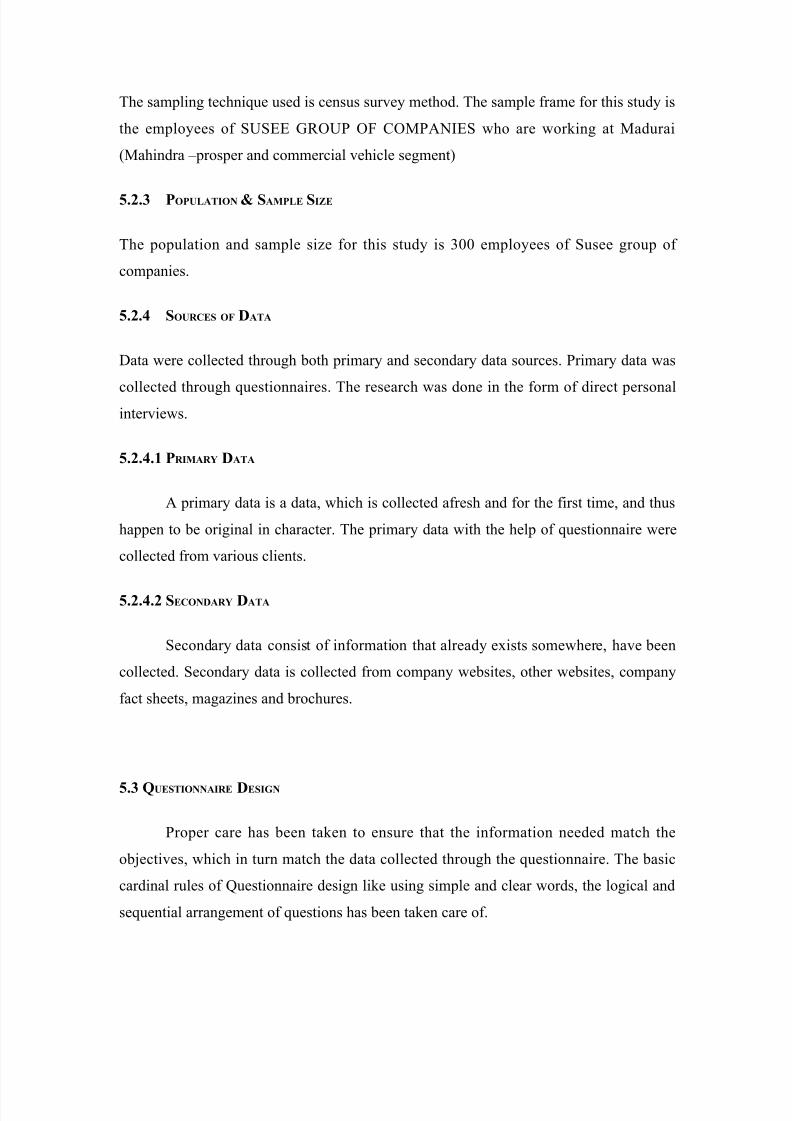
Department of the respondents
Frequency Percent Valid PercentCumulativePercent
Valid Sales 67 22.3 22.3 22.3Service 83 27.7 27.7 50.0HRD 18 6.0 6.0 56.0IT 46 15.3 15.3 71.3Spares 28 9.3 9.3 80.7Accounts 8 2.7 2.7 83.3
Others 50 16.7 16.7 100.0Total 300 100.0 100.0
INTERPRETATION
8/7/2019 Print Out Copy
http://slidepdf.com/reader/full/print-out-copy 36/89
From table-1 It is clear that 27.7% of the respondents are from service departmentfollowed by 22.3% of the respondents are from sales department and 15.3% of therespondents are from IT department.
Chart 1
Table 2
8/7/2019 Print Out Copy
http://slidepdf.com/reader/full/print-out-copy 37/89
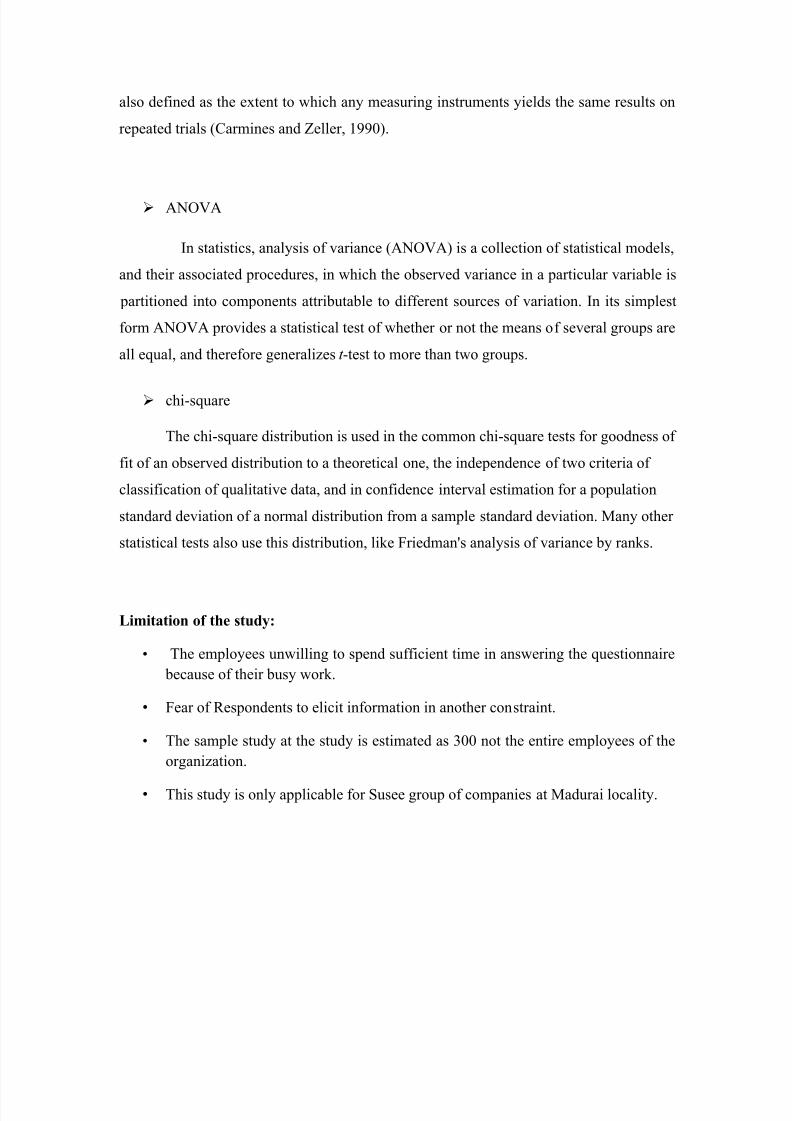
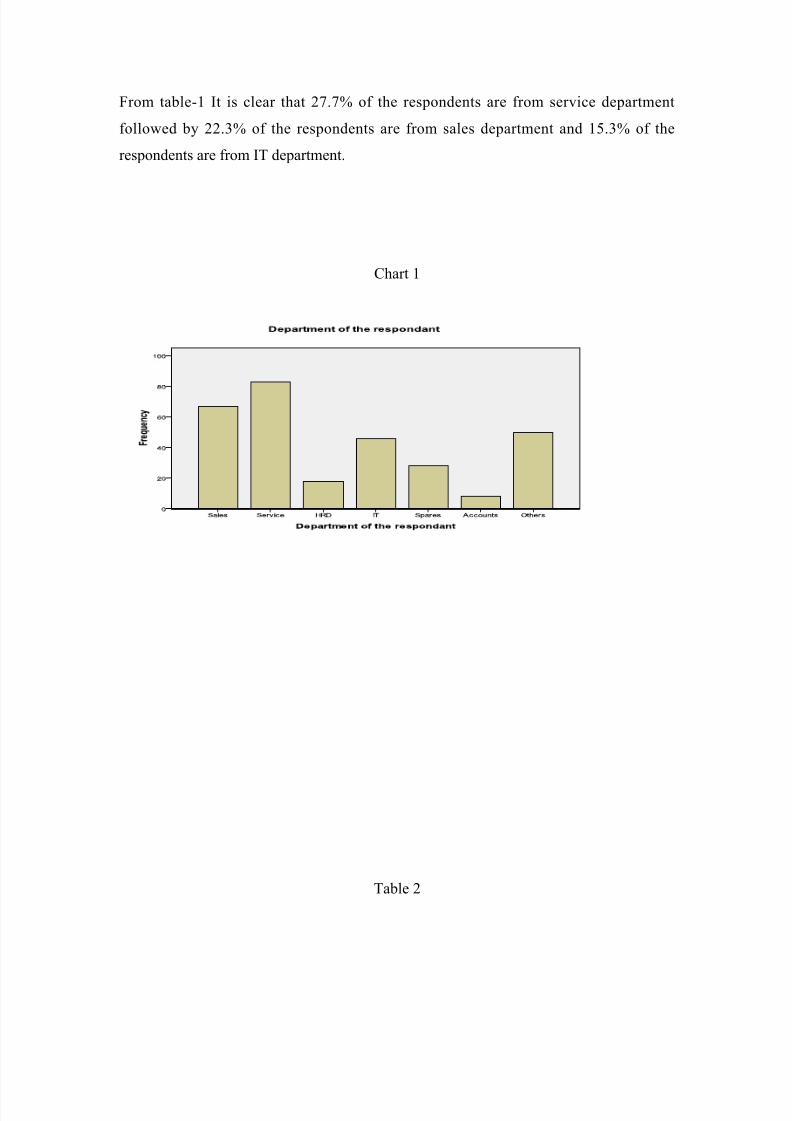
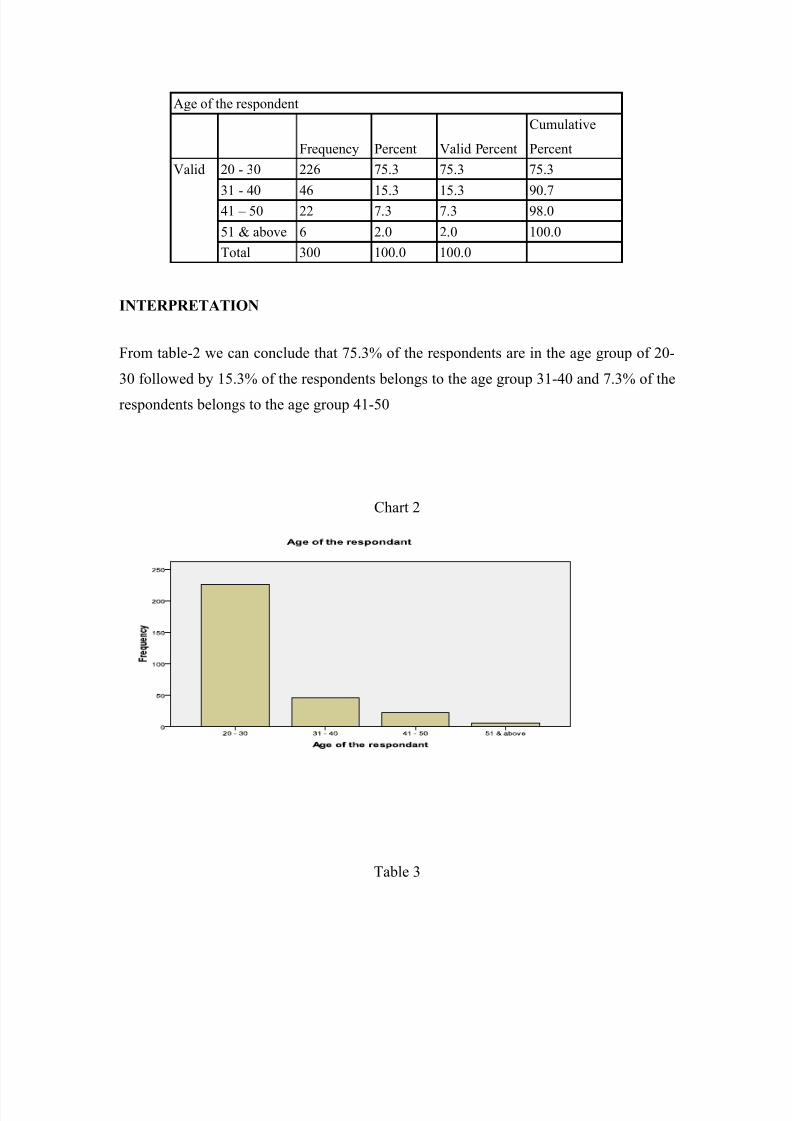
Age of the respondent
Frequency Percent Valid PercentCumulativePercent
Valid 20 - 30 226 75.3 75.3 75.3
31 - 40 46 15.3 15.3 90.741 – 50 22 7.3 7.3 98.051 & above 6 2.0 2.0 100.0Total 300 100.0 100.0
INTERPRETATION
From table-2 we can conclude that 75.3% of the respondents are in the age group of 20-30 followed by 15.3% of the respondents belongs to the age group 31-40 and 7.3% of therespondents belongs to the age group 41-50
Chart 2
Table 3

8/7/2019 Print Out Copy
http://slidepdf.com/reader/full/print-out-copy 38/89
Gender of the respondent
Frequency Percent Valid PercentCumulativePercent
Valid Male 165 55.0 55.0 55.0
Female 135 45.0 45.0 100.0Total 300 100.0 100.0
INTERPRETATION
From table-3 It is clear that 55% of the respondents are male and the remaining 45% of the respondents are female.
Chart 3
Table 4
8/7/2019 Print Out Copy
http://slidepdf.com/reader/full/print-out-copy 39/89
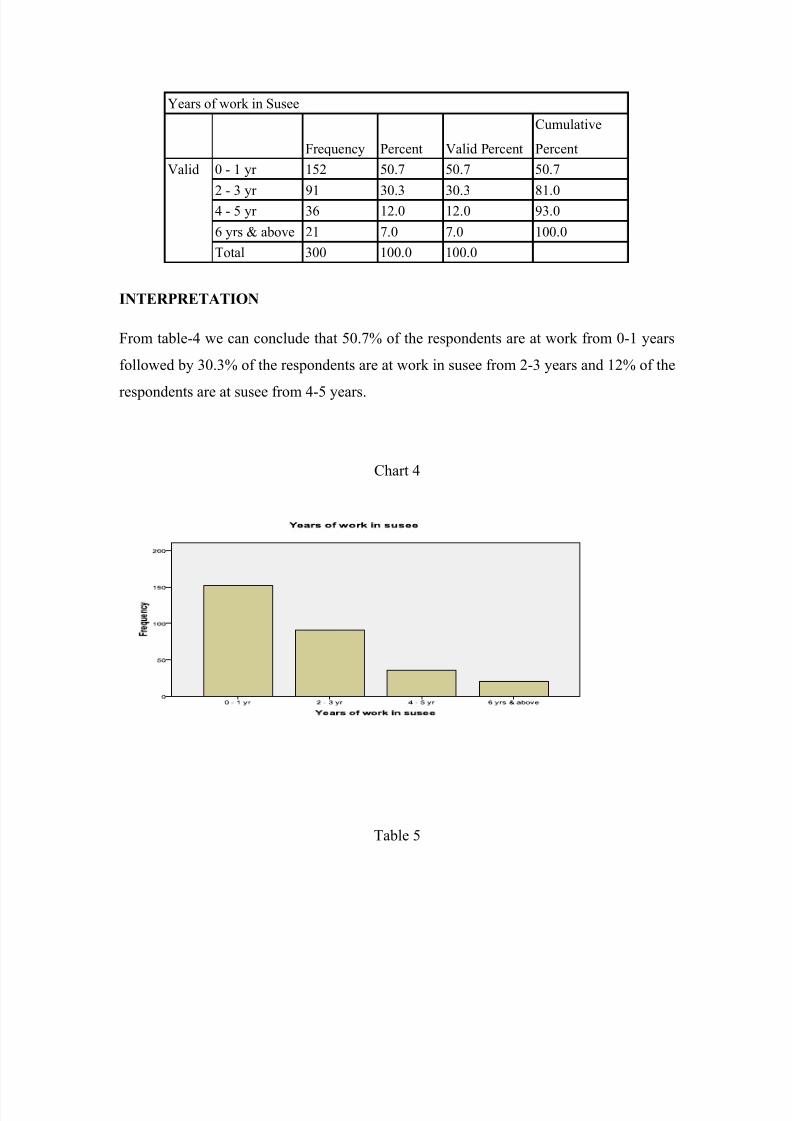
Years of work in Susee
Frequency Percent Valid PercentCumulativePercent
Valid 0 - 1 yr 152 50.7 50.7 50.7
2 - 3 yr 91 30.3 30.3 81.04 - 5 yr 36 12.0 12.0 93.06 yrs & above 21 7.0 7.0 100.0Total 300 100.0 100.0
INTERPRETATION
From table-4 we can conclude that 50.7% of the respondents are at work from 0-1 yearsfollowed by 30.3% of the respondents are at work in susee from 2-3 years and 12% of the
respondents are at susee from 4-5 years.
Chart 4
Table 5
8/7/2019 Print Out Copy
http://slidepdf.com/reader/full/print-out-copy 40/89
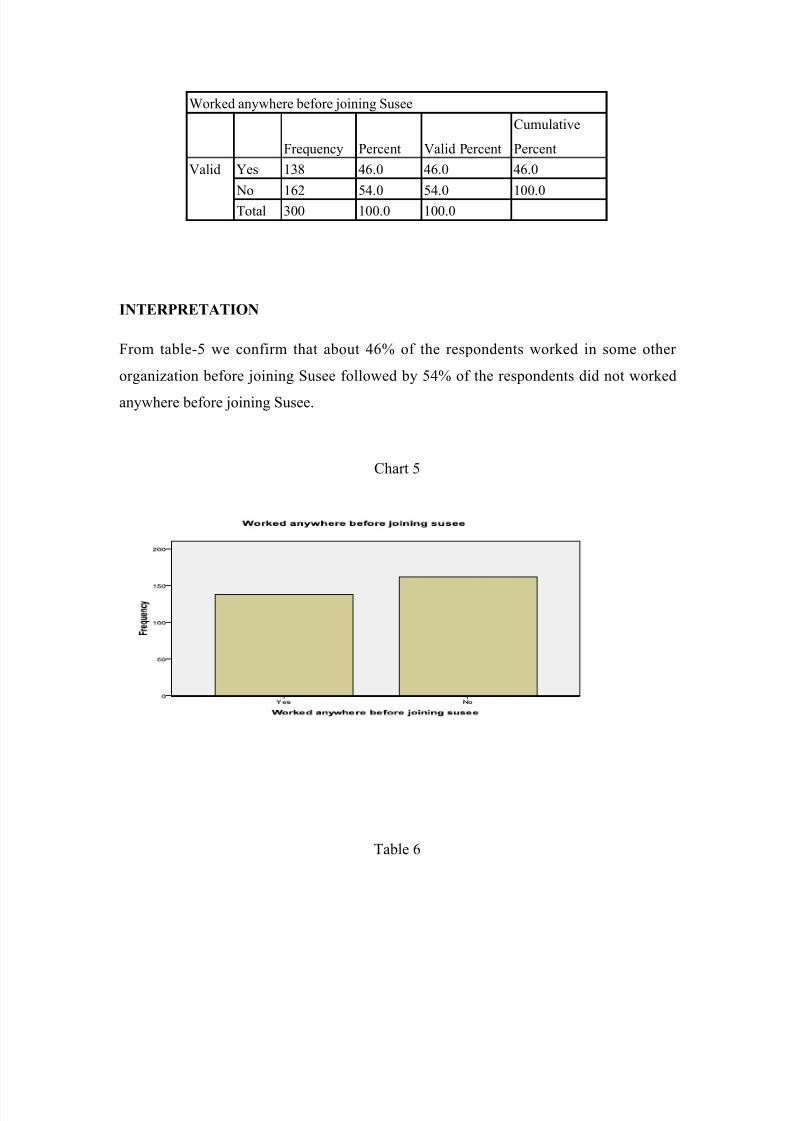
Worked anywhere before joining Susee
Frequency Percent Valid PercentCumulativePercent
Valid Yes 138 46.0 46.0 46.0
No 162 54.0 54.0 100.0Total 300 100.0 100.0
INTERPRETATION
From table-5 we confirm that about 46% of the respondents worked in some other organization before joining Susee followed by 54% of the respondents did not workedanywhere before joining Susee.
Chart 5
Table 6
8/7/2019 Print Out Copy
http://slidepdf.com/reader/full/print-out-copy 41/89
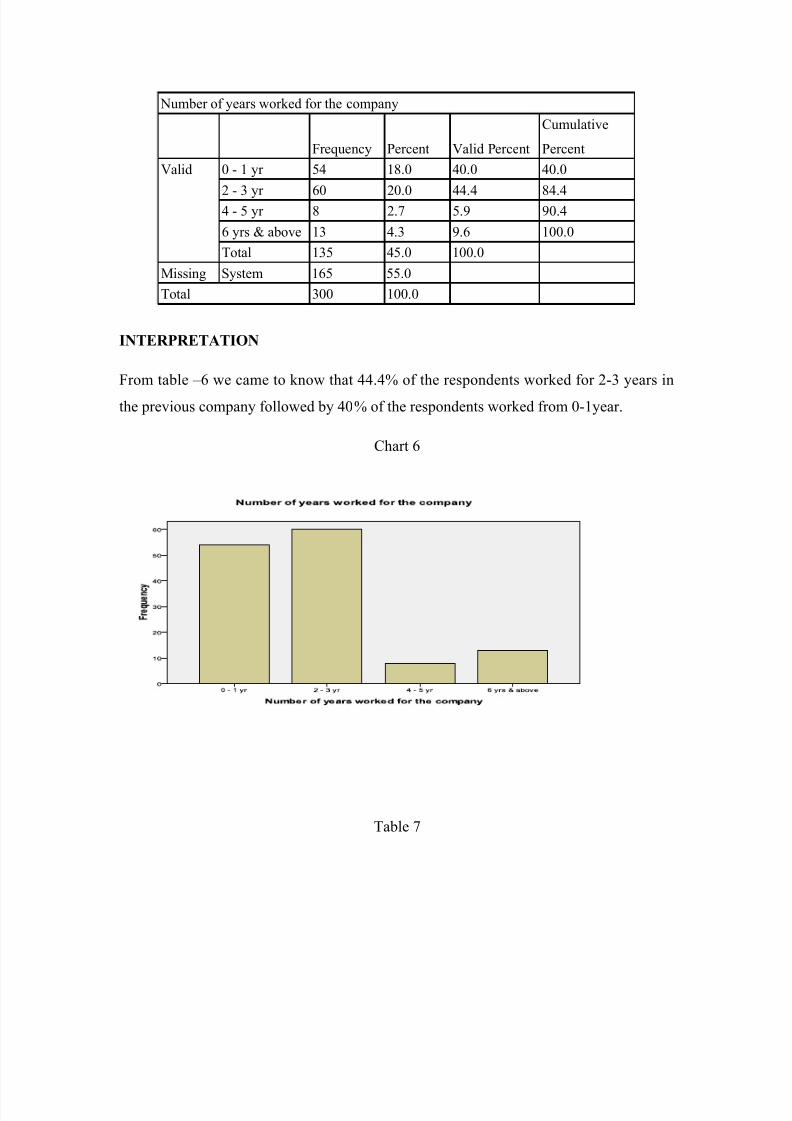
Number of years worked for the company
Frequency Percent Valid PercentCumulativePercent
Valid 0 - 1 yr 54 18.0 40.0 40.0
2 - 3 yr 60 20.0 44.4 84.44 - 5 yr 8 2.7 5.9 90.46 yrs & above 13 4.3 9.6 100.0Total 135 45.0 100.0
Missing System 165 55.0Total 300 100.0
INTERPRETATION
From table –6 we came to know that 44.4% of the respondents worked for 2-3 years inthe previous company followed by 40% of the respondents worked from 0-1year.
Chart 6
Table 7

8/7/2019 Print Out Copy
http://slidepdf.com/reader/full/print-out-copy 42/89
Sort of job doing in Susee
Frequency Percent Valid PercentCumulativePercent
Valid Target oriented 88 29.3 29.3 29.3
Service oriented 72 24.0 24.0 53.3Administration oriented 46 15.3 15.3 68.7System oriented 64 21.3 21.3 90.0Maintenance oriented 22 7.3 7.3 97.3Others 8 2.7 2.7 100.0Total 300 100.0 100.0
INTERPRETATION
From table–7 we can determine that about 29.3% of the respondents job are targetoriented followed by 24% of them are service oriented and 21.3% of the respondent’s jobare system oriented.
Chart 7
Table 8
8/7/2019 Print Out Copy
http://slidepdf.com/reader/full/print-out-copy 43/89
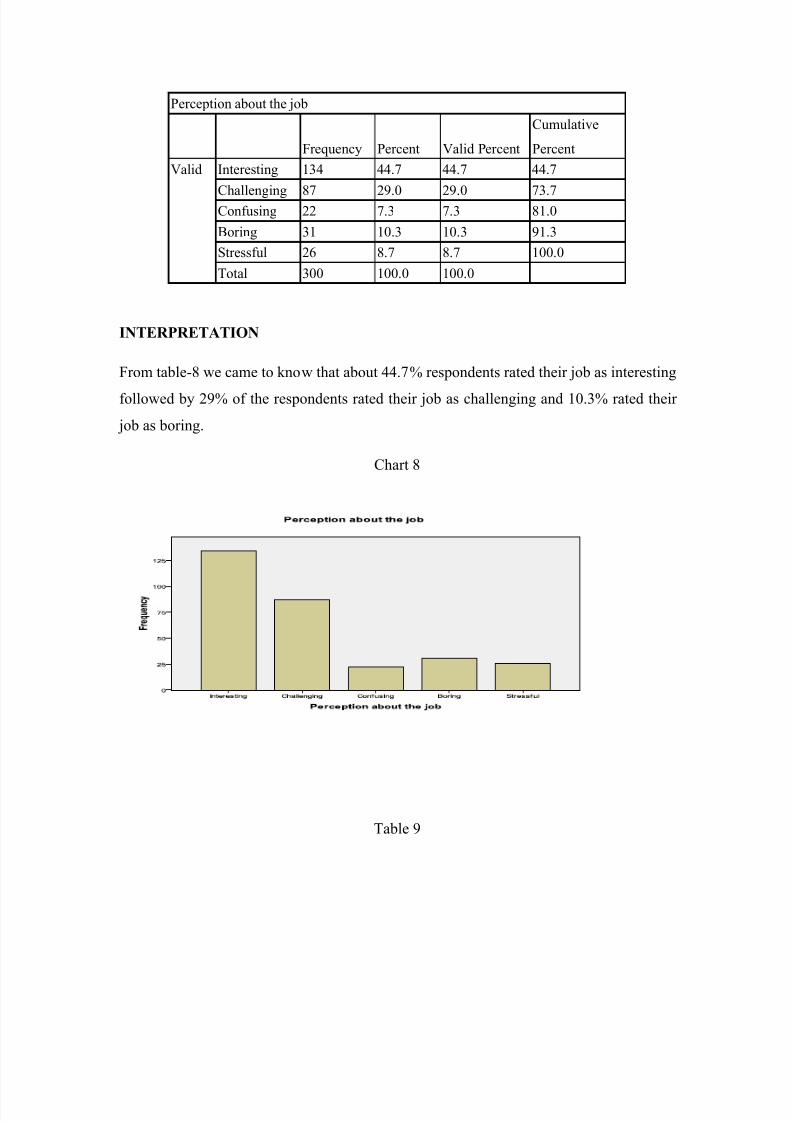
Perception about the job
Frequency Percent Valid PercentCumulativePercent
Valid Interesting 134 44.7 44.7 44.7
Challenging 87 29.0 29.0 73.7Confusing 22 7.3 7.3 81.0Boring 31 10.3 10.3 91.3Stressful 26 8.7 8.7 100.0Total 300 100.0 100.0
INTERPRETATION
From table-8 we came to know that about 44.7% respondents rated their job as interesting
followed by 29% of the respondents rated their job as challenging and 10.3% rated their job as boring.
Chart 8
Table 9
8/7/2019 Print Out Copy
http://slidepdf.com/reader/full/print-out-copy 44/89
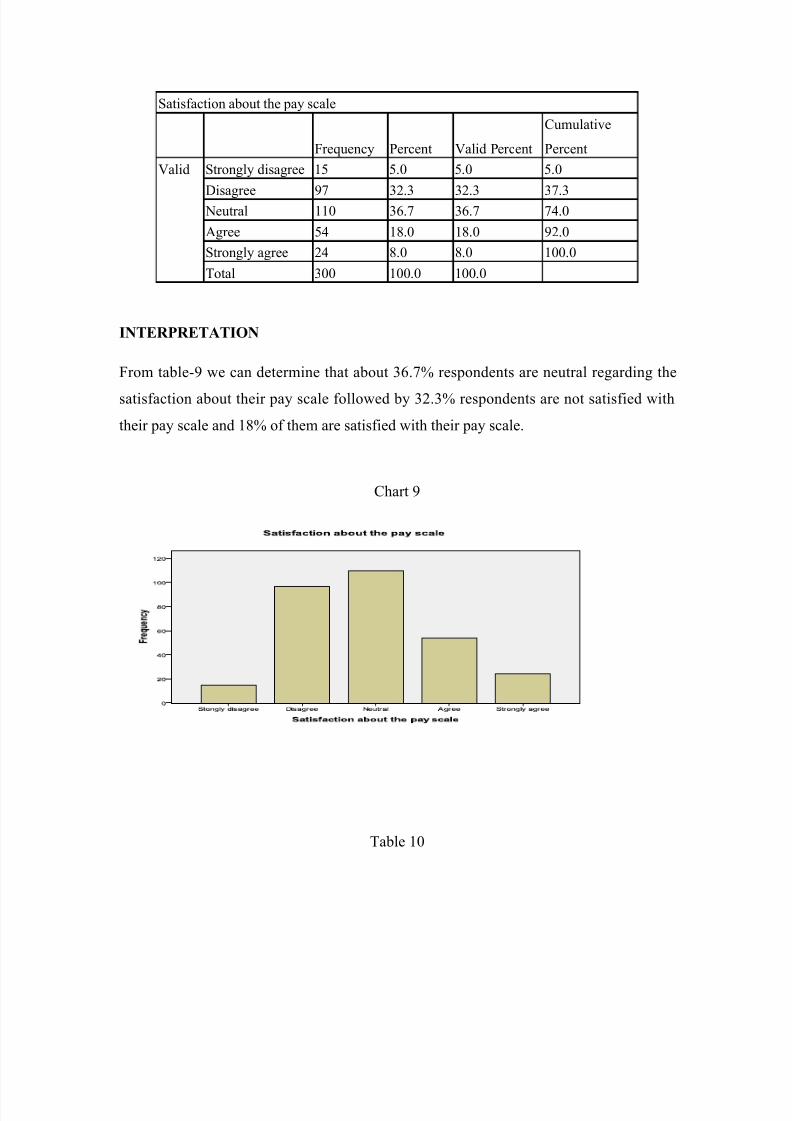
Satisfaction about the pay scale
Frequency Percent Valid PercentCumulativePercent
Valid Strongly disagree 15 5.0 5.0 5.0
Disagree 97 32.3 32.3 37.3 Neutral 110 36.7 36.7 74.0Agree 54 18.0 18.0 92.0Strongly agree 24 8.0 8.0 100.0Total 300 100.0 100.0
INTERPRETATION
From table-9 we can determine that about 36.7% respondents are neutral regarding the
satisfaction about their pay scale followed by 32.3% respondents are not satisfied withtheir pay scale and 18% of them are satisfied with their pay scale.
Chart 9
Table 10

8/7/2019 Print Out Copy
http://slidepdf.com/reader/full/print-out-copy 45/89
Rate of job security in Susee
Frequency Percent Valid PercentCumulativePercent
Valid Strongly disagree 2 .7 .7 .7
Disagree 12 4.0 4.0 4.7 Neutral 105 35.0 35.0 39.7Agree 132 44.0 44.0 83.7Strongly agree 49 16.3 16.3 100.0Total 300 100.0 100.0
INTERPRETATION
From table-10 we can determine that about 44% respondents are agreeing their job as a
secure one followed by 35% of the respondents said their job security as neutral.
Chart 10
Table 11
8/7/2019 Print Out Copy
http://slidepdf.com/reader/full/print-out-copy 46/89
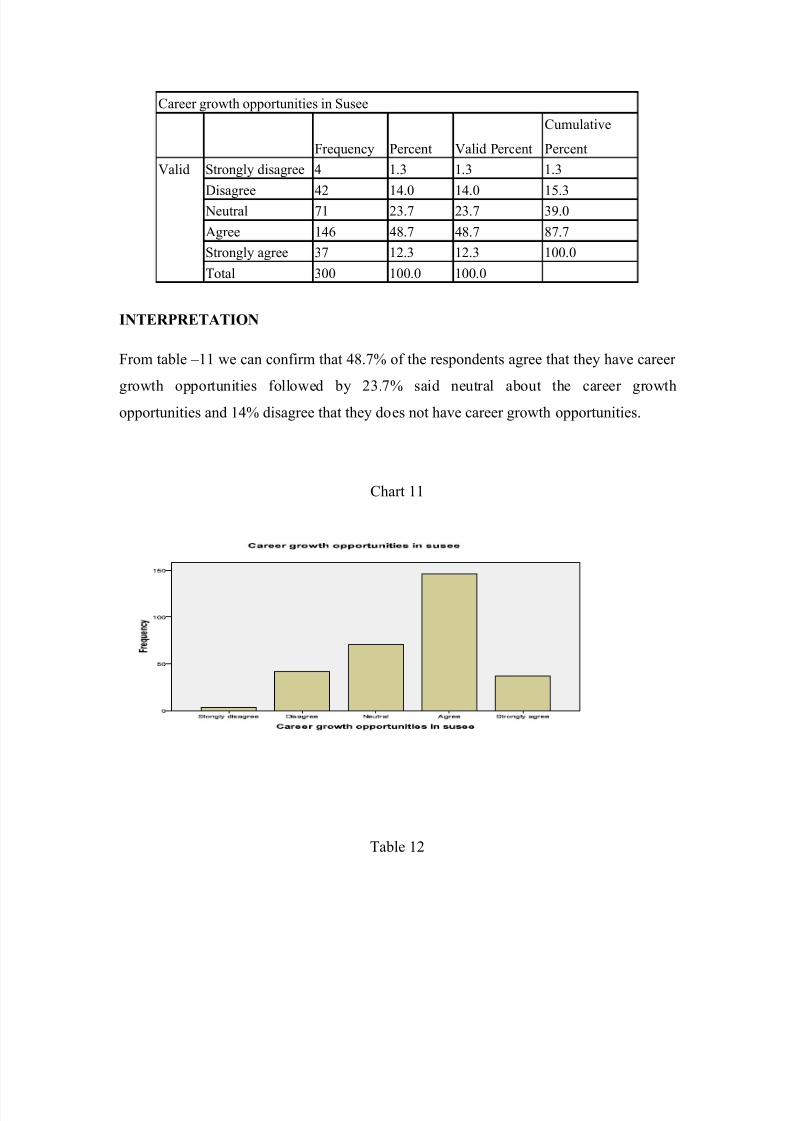
Career growth opportunities in Susee
Frequency Percent Valid PercentCumulativePercent
Valid Strongly disagree 4 1.3 1.3 1.3
Disagree 42 14.0 14.0 15.3 Neutral 71 23.7 23.7 39.0Agree 146 48.7 48.7 87.7Strongly agree 37 12.3 12.3 100.0Total 300 100.0 100.0
INTERPRETATION
From table –11 we can confirm that 48.7% of the respondents agree that they have career
growth opportunities followed by 23.7% said neutral about the career growthopportunities and 14% disagree that they does not have career growth opportunities.
Chart 11
Table 12

8/7/2019 Print Out Copy
http://slidepdf.com/reader/full/print-out-copy 47/89
I feel I am a valued part of this organization
Frequency Percent Valid PercentCumulativePercent
Valid Strongly disagree 2 .7 .7 .7
Disagree 13 4.3 4.3 5.0 Neutral 79 26.3 26.3 31.3Agree 153 51.0 51.0 82.3Strongly agree 53 17.7 17.7 100.0Total 300 100.0 100.0
INTERPRETATION
From table -12 we can confirm that 51% the respondents agree that they feel valued part
of this organization followed by 26.3% feel neutral and 17.7% of the respondentsstrongly agree that they feel valued part of this organization.
Chart 12
Table 13

8/7/2019 Print Out Copy
http://slidepdf.com/reader/full/print-out-copy 48/89
Communication, cooperation among staff members
Frequency Percent Valid PercentCumulativePercent
Valid Strongly disagree 7 2.3 2.3 2.3
Disagree 21 7.0 7.0 9.3 Neutral 87 29.0 29.0 38.3Agree 114 38.0 38.0 76.3Strongly agree 71 23.7 23.7 100.0Total 300 100.0 100.0
INTERPRETATION
From table -13 we came to know that 38% of the respondents agree that communication,
cooperation among staff is good followed by 29% of the respondents said neutral aboutthe communication, cooperation among staff members and 23.7% strongly agree.
Chart 13
Table 14

8/7/2019 Print Out Copy
http://slidepdf.com/reader/full/print-out-copy 49/89
Susee's office has a friendly atmosphere
Frequency Percent Valid PercentCumulativePercent
Valid Strongly disagree 5 1.7 1.7 1.7
Disagree 16 5.3 5.3 7.0 Neutral 54 18.0 18.0 25.0Agree 145 48.3 48.3 73.3Strongly agree 80 26.7 26.7 100.0Total 300 100.0 100.0
INTERPRETATION
From table -14 It is inferred that 48.3% the respondents agree that there is a friendlyatmosphere at Susee followed by 26.7% of the respondents strongly agree there is afriendly relationship exist in the organization.
Chart 14
Table 15
8/7/2019 Print Out Copy
http://slidepdf.com/reader/full/print-out-copy 50/89
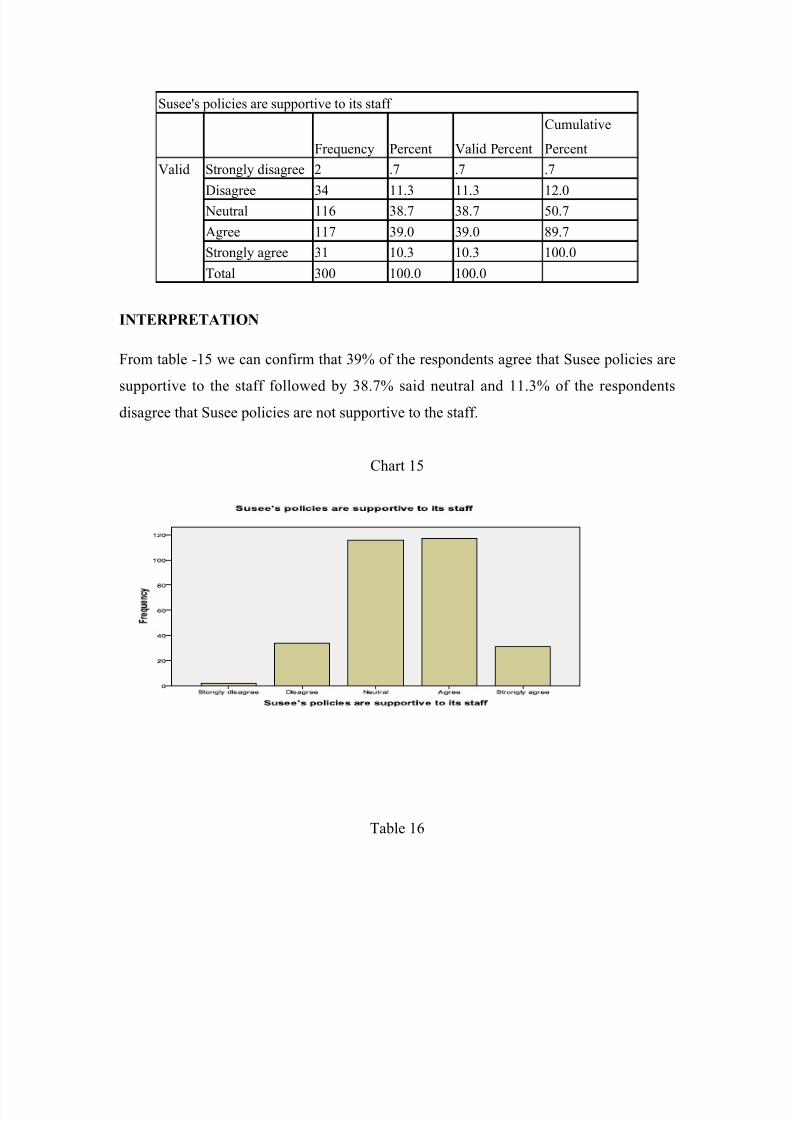
Susee's policies are supportive to its staff
Frequency Percent Valid PercentCumulativePercent
Valid Strongly disagree 2 .7 .7 .7
Disagree 34 11.3 11.3 12.0 Neutral 116 38.7 38.7 50.7Agree 117 39.0 39.0 89.7Strongly agree 31 10.3 10.3 100.0Total 300 100.0 100.0
INTERPRETATION
From table -15 we can confirm that 39% of the respondents agree that Susee policies are
supportive to the staff followed by 38.7% said neutral and 11.3% of the respondentsdisagree that Susee policies are not supportive to the staff.
Chart 15
Table 16

8/7/2019 Print Out Copy
http://slidepdf.com/reader/full/print-out-copy 51/89
My workload and deadlines are reasonable
Frequency Percent Valid PercentCumulativePercent
Valid Strongly disagree 4 1.3 1.3 1.3
Disagree 18 6.0 6.0 7.3 Neutral 109 36.3 36.3 43.7Agree 140 46.7 46.7 90.3Strongly agree 29 9.7 9.7 100.0Total 300 100.0 100.0
INTERPRETATION
From table -16 we can determine that 46.7% the respondents agree that my workload and
deadlines are reasonable followed by 36.3% of the respondents said neutral and 9.7% of the respondents strongly agree that their workload and deadlines are reasonable..
Chart 16
Table 17

8/7/2019 Print Out Copy
http://slidepdf.com/reader/full/print-out-copy 52/89
Employee welfare activities are carried out effectively in Susee
Frequency Percent Valid PercentCumulativePercent
Valid Strongly disagree 4 1.3 1.3 1.3
Disagree 27 9.0 9.0 10.3 Neutral 83 27.7 27.7 38.0Agree 151 50.3 50.3 88.3Strongly agree 35 11.7 11.7 100.0Total 300 100.0 100.0
INTERPRETATION
From table -17 it is inferred that 50.3% of the respondents agree that employee welfare
activities are carried out effectively followed by 27.7% of the respondents rated their views as neutral and 11.7% of the respondents strongly agree that employee welfareactivities are carried out effectively
Chart 17
Table 18
8/7/2019 Print Out Copy
http://slidepdf.com/reader/full/print-out-copy 53/89
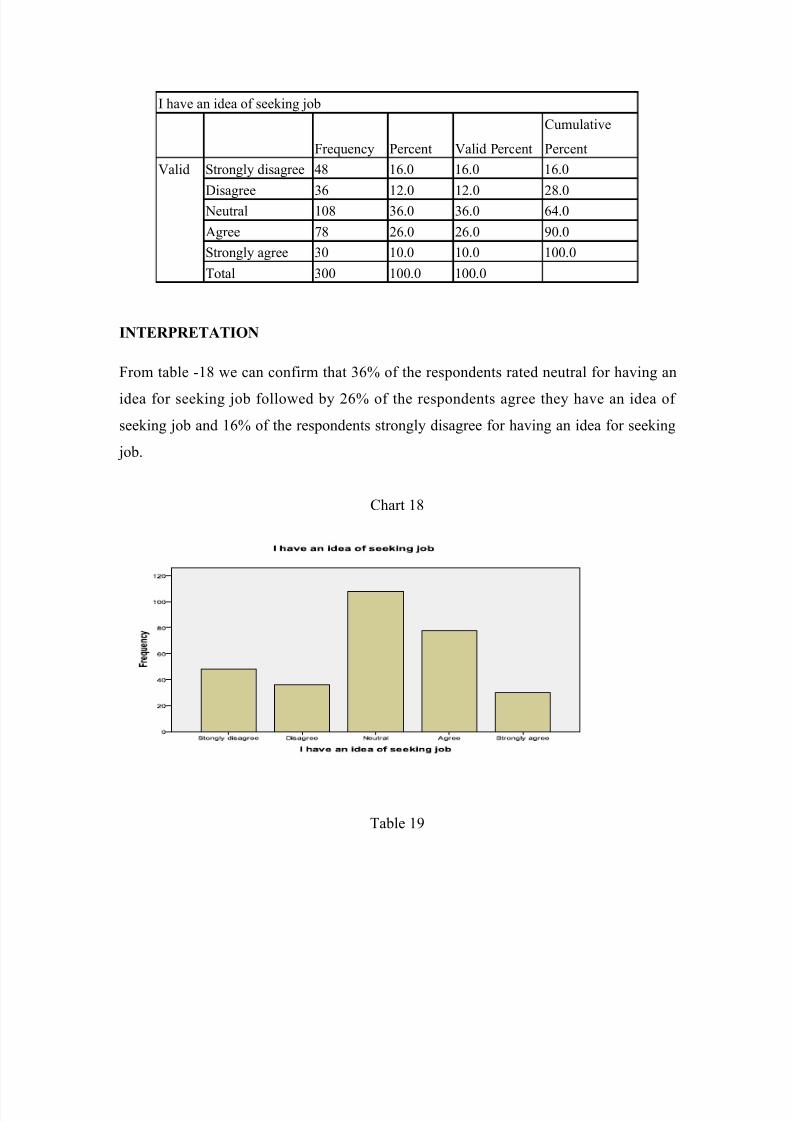
I have an idea of seeking job
Frequency Percent Valid PercentCumulativePercent
Valid Strongly disagree 48 16.0 16.0 16.0
Disagree 36 12.0 12.0 28.0 Neutral 108 36.0 36.0 64.0Agree 78 26.0 26.0 90.0Strongly agree 30 10.0 10.0 100.0Total 300 100.0 100.0
INTERPRETATION
From table -18 we can confirm that 36% of the respondents rated neutral for having an
idea for seeking job followed by 26% of the respondents agree they have an idea of seeking job and 16% of the respondents strongly disagree for having an idea for seeking job.
Chart 18
Table 19

8/7/2019 Print Out Copy
http://slidepdf.com/reader/full/print-out-copy 54/89
I like my job
Frequency Percent Valid PercentCumulativePercent
Valid Strongly disagree 11 3.7 3.7 3.7
Disagree 13 4.3 4.3 8.0 Neutral 76 25.3 25.3 33.3Agree 129 43.0 43.0 76.3Strongly agree 71 23.7 23.7 100.0Total 300 100.0 100.0
INTERPRETATION
From table -19 we can inferred that 43% of the respondents agree that they like their job
followed by 25.3% of the respondents rated neutral and 23.7% of the respondentsstrongly agree that they like their job
Chart 19
Table 20
8/7/2019 Print Out Copy
http://slidepdf.com/reader/full/print-out-copy 55/89
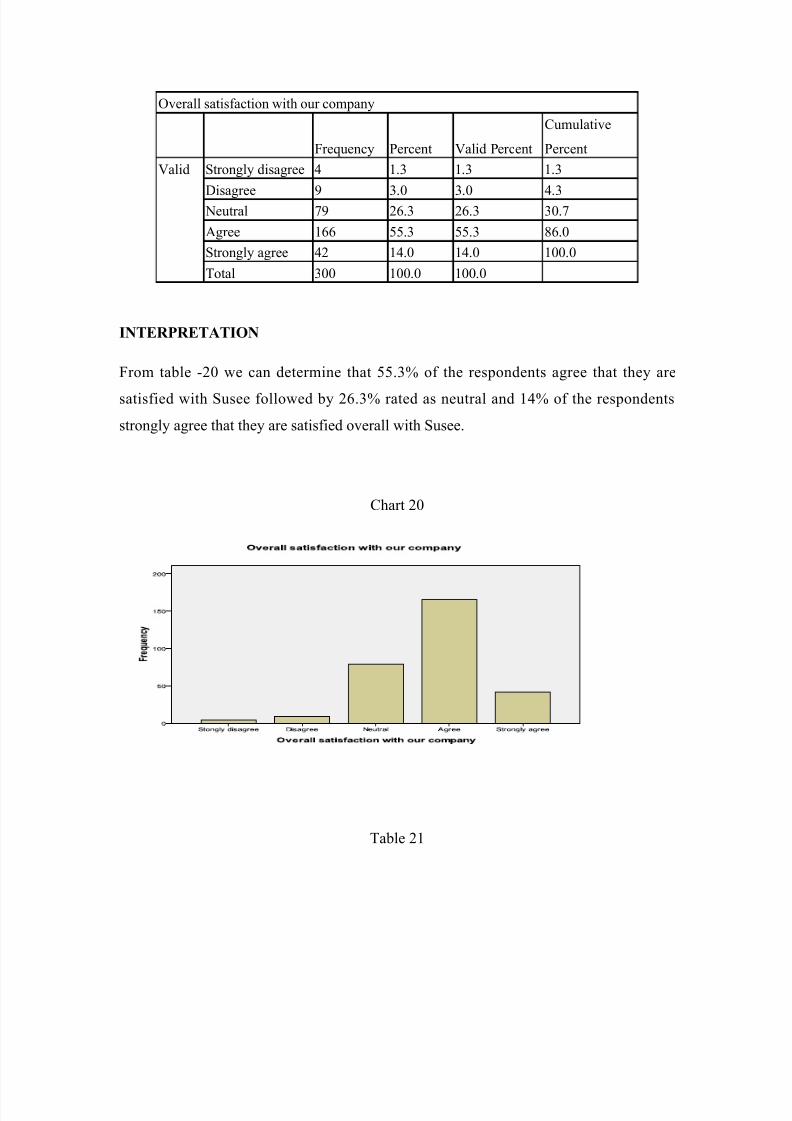
Overall satisfaction with our company
Frequency Percent Valid PercentCumulativePercent
Valid Strongly disagree 4 1.3 1.3 1.3
Disagree 9 3.0 3.0 4.3 Neutral 79 26.3 26.3 30.7Agree 166 55.3 55.3 86.0Strongly agree 42 14.0 14.0 100.0Total 300 100.0 100.0
INTERPRETATION
From table -20 we can determine that 55.3% of the respondents agree that they are
satisfied with Susee followed by 26.3% rated as neutral and 14% of the respondentsstrongly agree that they are satisfied overall with Susee.
Chart 20
Table 21
8/7/2019 Print Out Copy
http://slidepdf.com/reader/full/print-out-copy 56/89
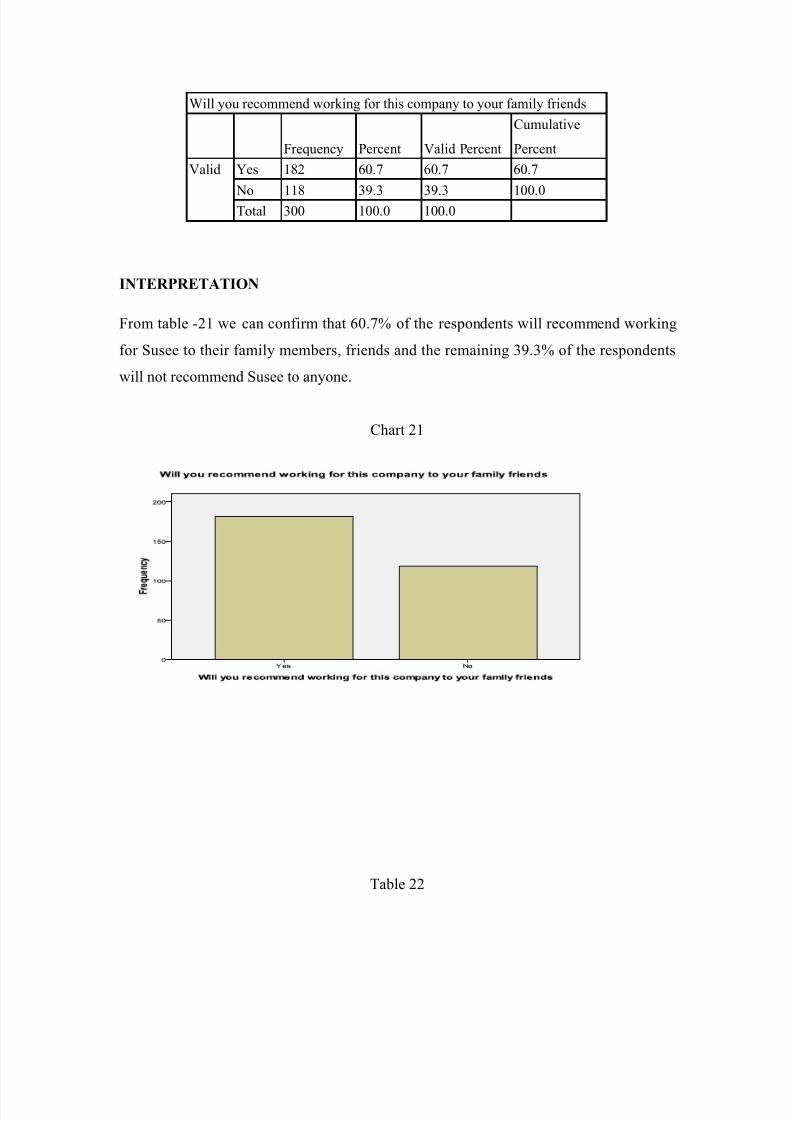
Will you recommend working for this company to your family friends
Frequency Percent Valid PercentCumulativePercent
Valid Yes 182 60.7 60.7 60.7
No 118 39.3 39.3 100.0Total 300 100.0 100.0
INTERPRETATION
From table -21 we can confirm that 60.7% of the respondents will recommend workingfor Susee to their family members, friends and the remaining 39.3% of the respondentswill not recommend Susee to anyone.
Chart 21
Table 22
8/7/2019 Print Out Copy
http://slidepdf.com/reader/full/print-out-copy 57/89
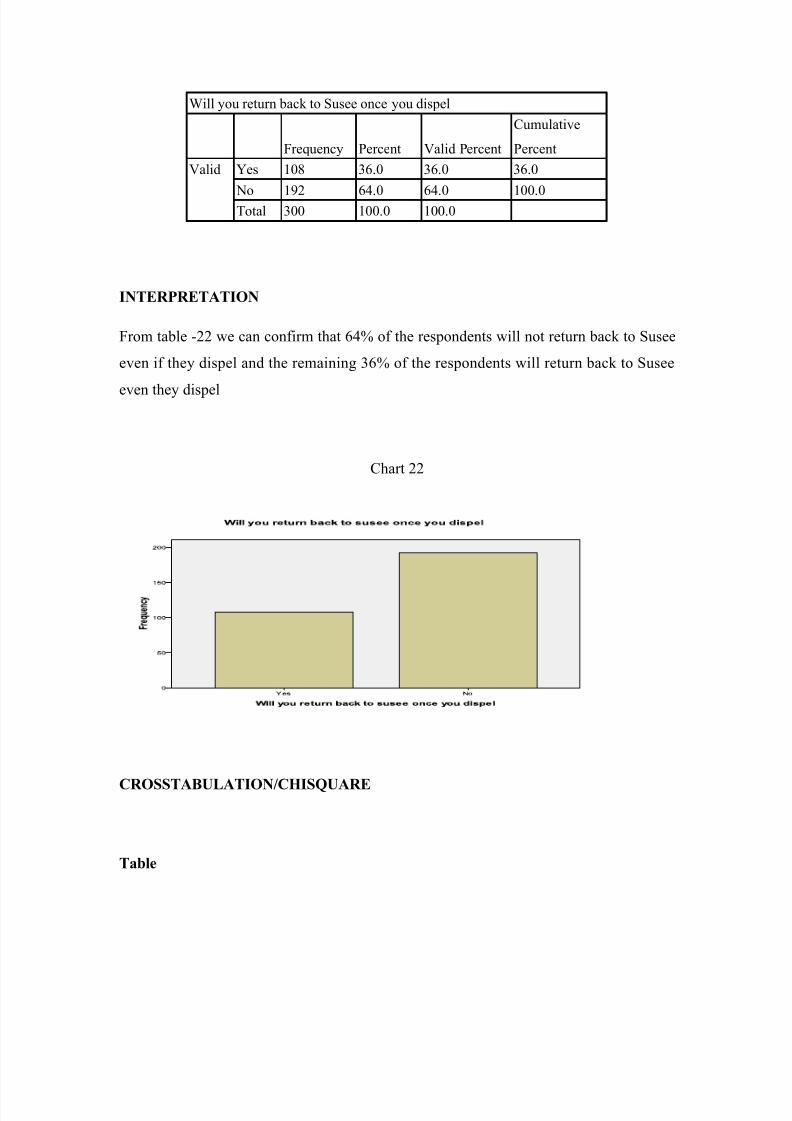
Will you return back to Susee once you dispel
Frequency Percent Valid PercentCumulativePercent
Valid Yes 108 36.0 36.0 36.0
No 192 64.0 64.0 100.0Total 300 100.0 100.0
INTERPRETATION
From table -22 we can confirm that 64% of the respondents will not return back to Suseeeven if they dispel and the remaining 36% of the respondents will return back to Susee
even they dispel
Chart 22
CROSSTABULATION/CHISQUARE
Table
8/7/2019 Print Out Copy
http://slidepdf.com/reader/full/print-out-copy 58/89
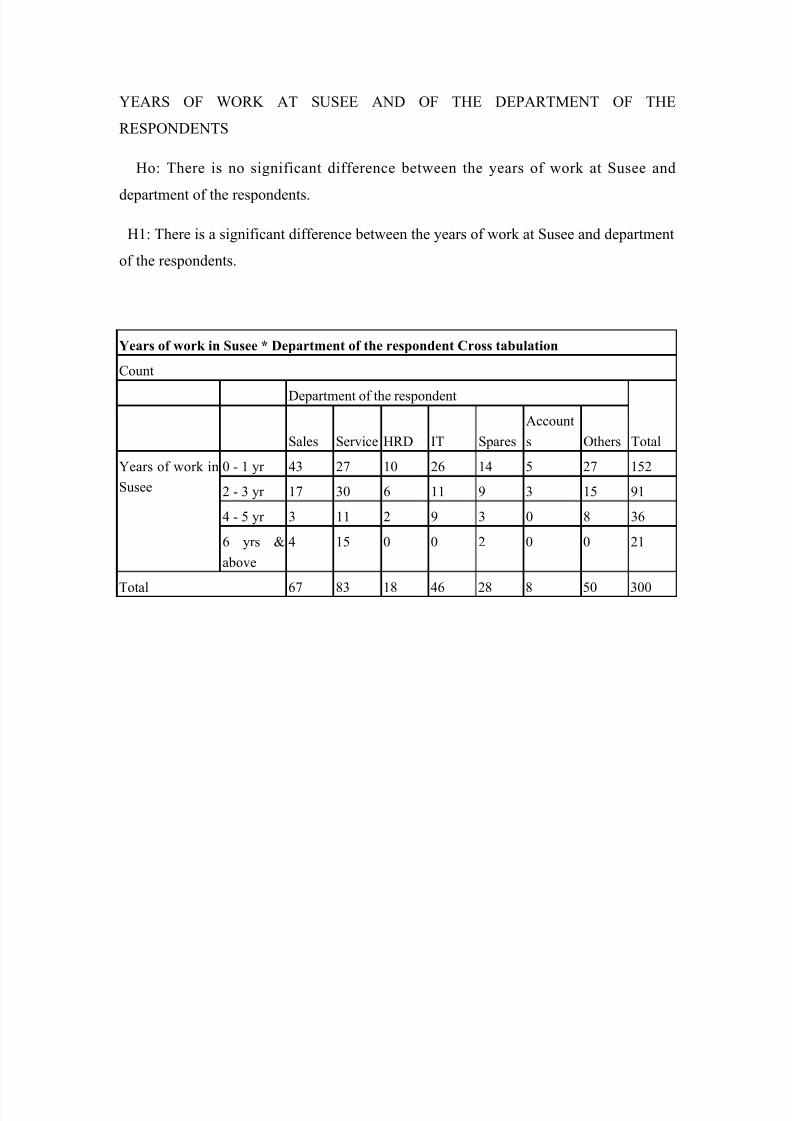
YEARS OF WORK AT SUSEE AND OF THE DEPARTMENT OF THERESPONDENTS
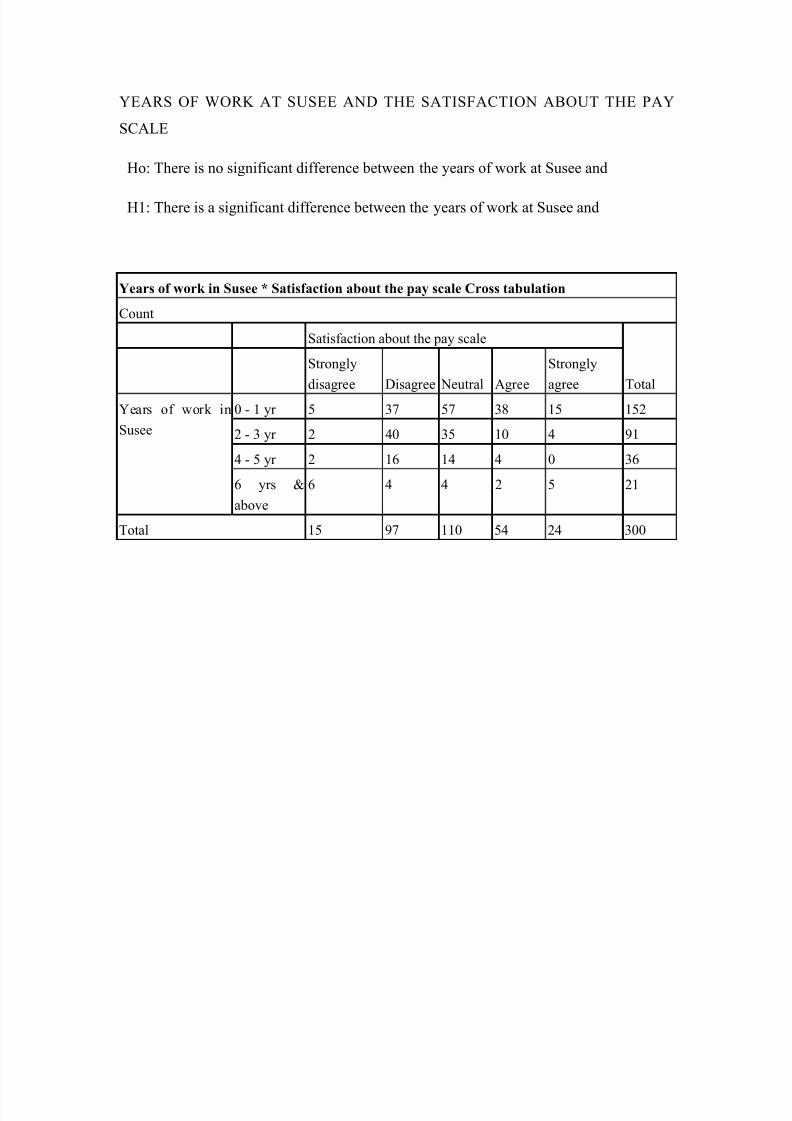
Ho: There is no significant difference between the years of work at Susee and
department of the respondents.
H1: There is a significant difference between the years of work at Susee and departmentof the respondents.
Years of work in Susee * Department of the respondent Cross tabulation
Count
Department of the respondent
TotalSales Service HRD IT SparesAccounts Others
Years of work inSusee
0 - 1 yr 43 27 10 26 14 5 27 1522 - 3 yr 17 30 6 11 9 3 15 914 - 5 yr 3 11 2 9 3 0 8 366 yrs &above
4 15 0 0 2 0 0 21
Total 67 83 18 46 28 8 50 300

8/7/2019 Print Out Copy
http://slidepdf.com/reader/full/print-out-copy 59/89
Chi-Square Tests
Value df Asymp. Sig. (2-sided)
Pearson Chi-Square 41.163a 18 .001
Likelihood Ratio 47.377 18 .000Linear-by-Linear Association
1.788 1 .181
N of Valid Cases 300a. 11 cells (39.3%) have expected count less than 5. The minimumexpected count is .56.
INTERPRETATION:
From the above table it is inferred that the calculated p value .001 is not greater than 0.5.Hence there is no significant difference between the years of work at Susee anddepartment of the respondents.
Table
YEARS OF WORK AT SUSEE AND THE PERCEPTION ABOUT THE JOB

8/7/2019 Print Out Copy
http://slidepdf.com/reader/full/print-out-copy 60/89
Ho: There is no significant difference between the years of work at Susee and perception about the job.
H1: There is a significant difference between the years of work at Susee and perception
about the job.
Years of work in Susee * Perception about the job Cross tabulation
CountPerception about the job
TotalInteresting Challenging Confusing Boring Stressful
Years of work inSusee
0 - 1 yr 93 36 5 7 11 1522 - 3 yr 25 34 11 12 9 914 - 5 yr 12 10 4 8 2 366 yrs &above
4 7 2 4 4 21
Total 134 87 22 31 26 300

8/7/2019 Print Out Copy
http://slidepdf.com/reader/full/print-out-copy 61/89
Chi-Square Tests
Value Df Asymp. Sig. (2-sided)
Pearson Chi-Square 45.831a 12 .000
Likelihood Ratio 46.082 12 .000Linear-by-Linear Association
22.087 1 .000
N of Valid Cases 300a. 6 cells (30.0%) have expected count less than 5. The minimumexpected count is 1.54.
INTERPRETATION:
From the above table it is inferred that the calculated p value .000 is not greater than 0.5.Hence there is no significant difference between the years of work at Susee and perception about the job.
Table
8/7/2019 Print Out Copy
http://slidepdf.com/reader/full/print-out-copy 62/89
YEARS OF WORK AT SUSEE AND THE SATISFACTION ABOUT THE PAYSCALE
Ho: There is no significant difference between the years of work at Susee and
H1: There is a significant difference between the years of work at Susee and
Years of work in Susee * Satisfaction about the pay scale Cross tabulation
CountSatisfaction about the pay scale
TotalStronglydisagree Disagree Neutral Agree
Stronglyagree
Years of work inSusee
0 - 1 yr 5 37 57 38 15 1522 - 3 yr 2 40 35 10 4 914 - 5 yr 2 16 14 4 0 366 yrs &above
6 4 4 2 5 21
Total 15 97 110 54 24 300
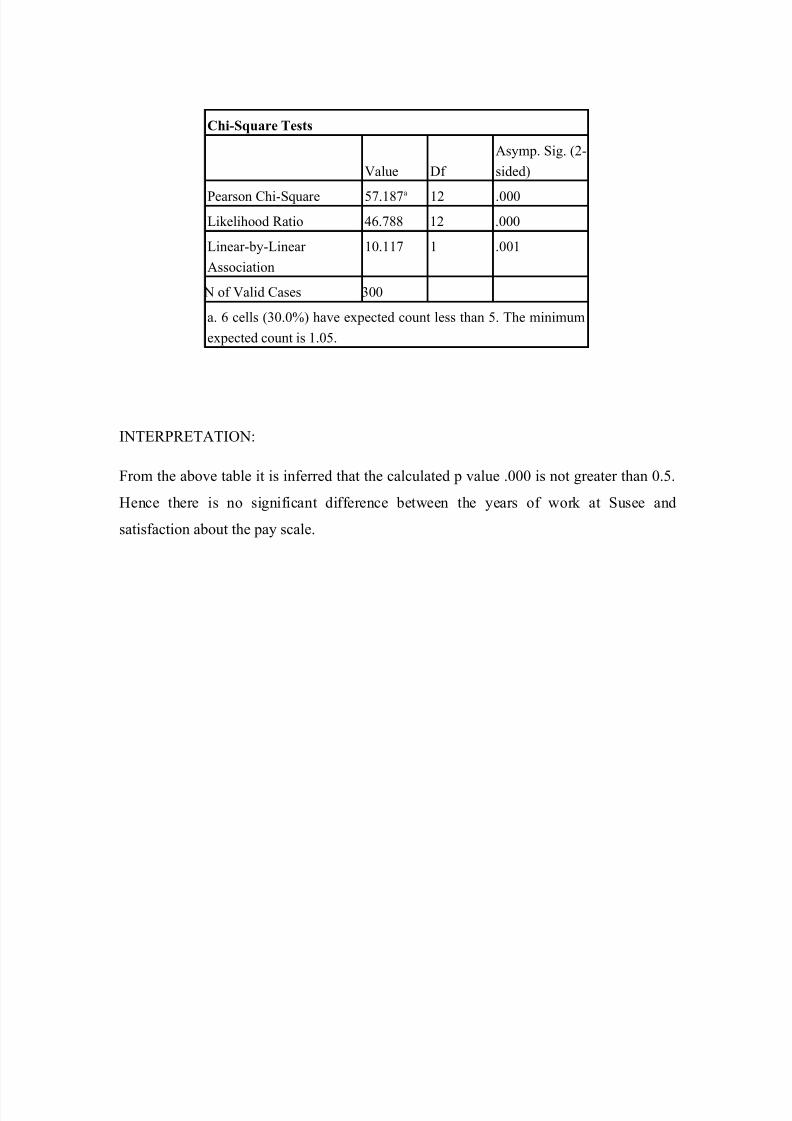
8/7/2019 Print Out Copy
http://slidepdf.com/reader/full/print-out-copy 63/89
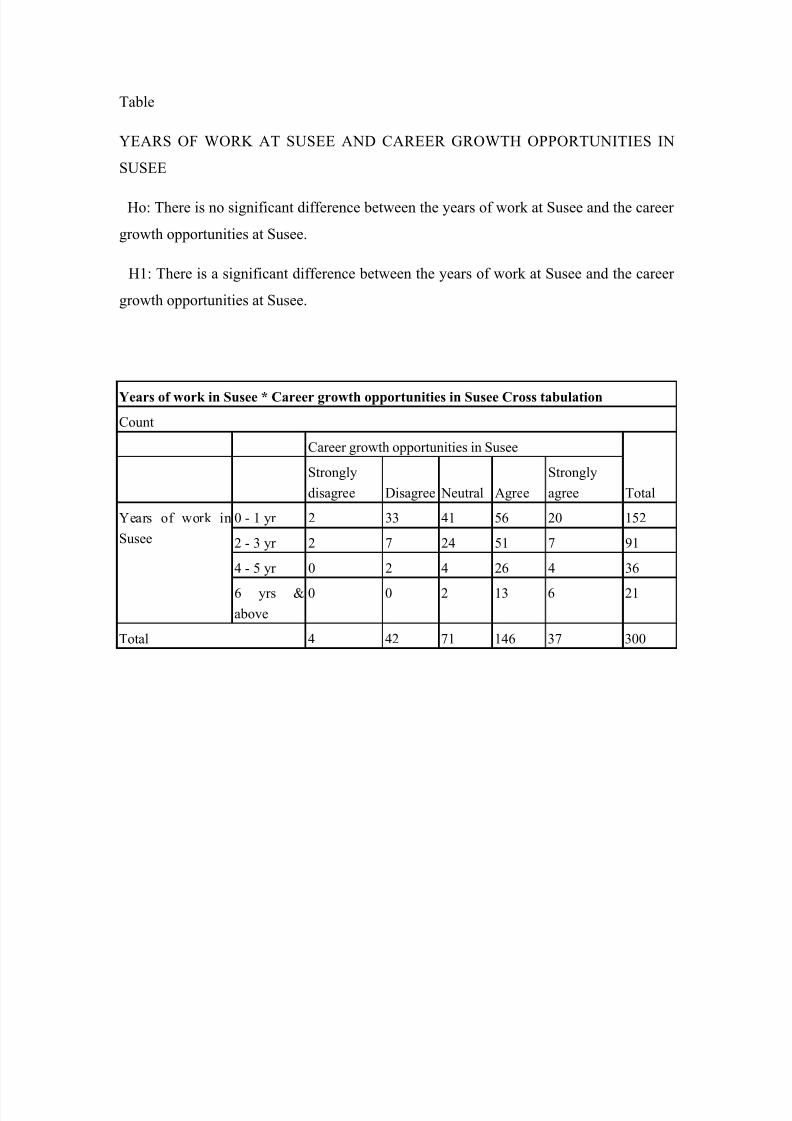
8/7/2019 Print Out Copy
http://slidepdf.com/reader/full/print-out-copy 64/89
Table
YEARS OF WORK AT SUSEE AND CAREER GROWTH OPPORTUNITIES INSUSEE
Ho: There is no significant difference between the years of work at Susee and the career growth opportunities at Susee.
H1: There is a significant difference between the years of work at Susee and the career growth opportunities at Susee.
Years of work in Susee * Career growth opportunities in Susee Cross tabulation
CountCareer growth opportunities in Susee
TotalStronglydisagree Disagree Neutral Agree
Stronglyagree
Years of work inSusee
0 - 1 yr 2 33 41 56 20 1522 - 3 yr 2 7 24 51 7 914 - 5 yr 0 2 4 26 4 36
6 yrs &above
0 0 2 13 6 21
Total 4 42 71 146 37 300
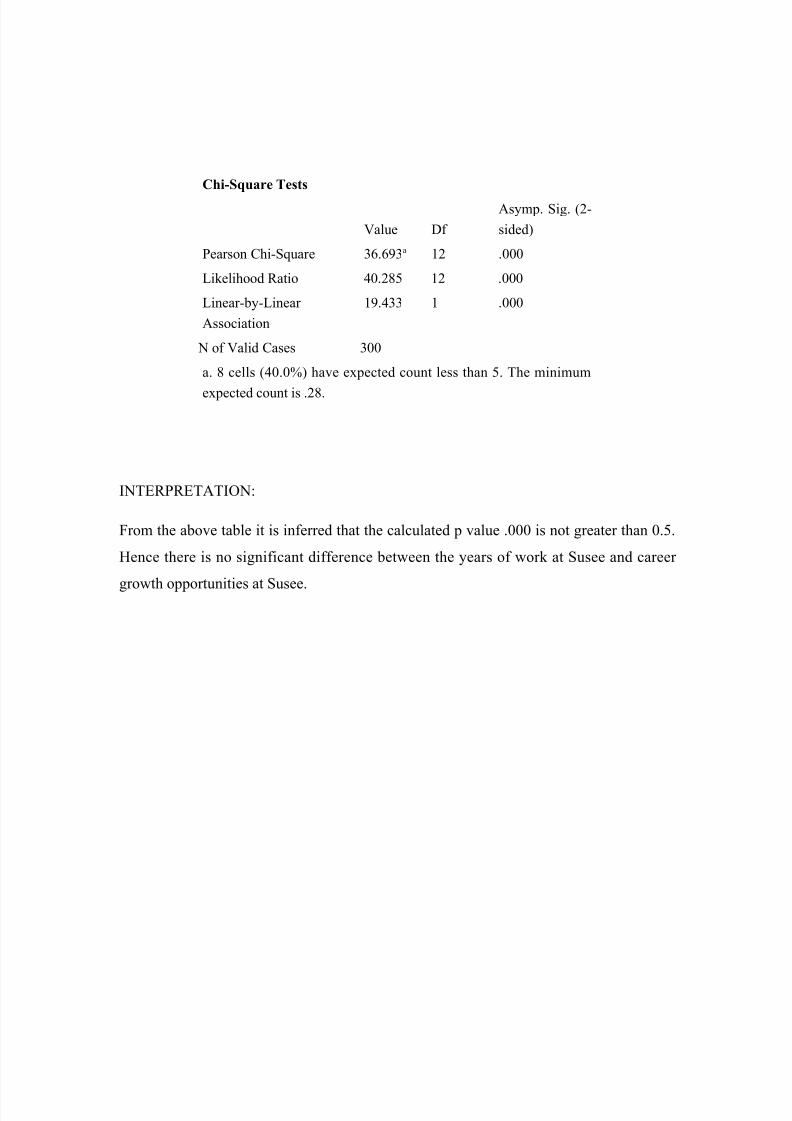
8/7/2019 Print Out Copy
http://slidepdf.com/reader/full/print-out-copy 65/89
Chi-Square Tests
Value Df Asymp. Sig. (2-sided)
Pearson Chi-Square 36.693a 12 .000Likelihood Ratio 40.285 12 .000Linear-by-Linear Association
19.433 1 .000
N of Valid Cases 300a. 8 cells (40.0%) have expected count less than 5. The minimum
expected count is .28.
INTERPRETATION:
From the above table it is inferred that the calculated p value .000 is not greater than 0.5.Hence there is no significant difference between the years of work at Susee and career
growth opportunities at Susee.
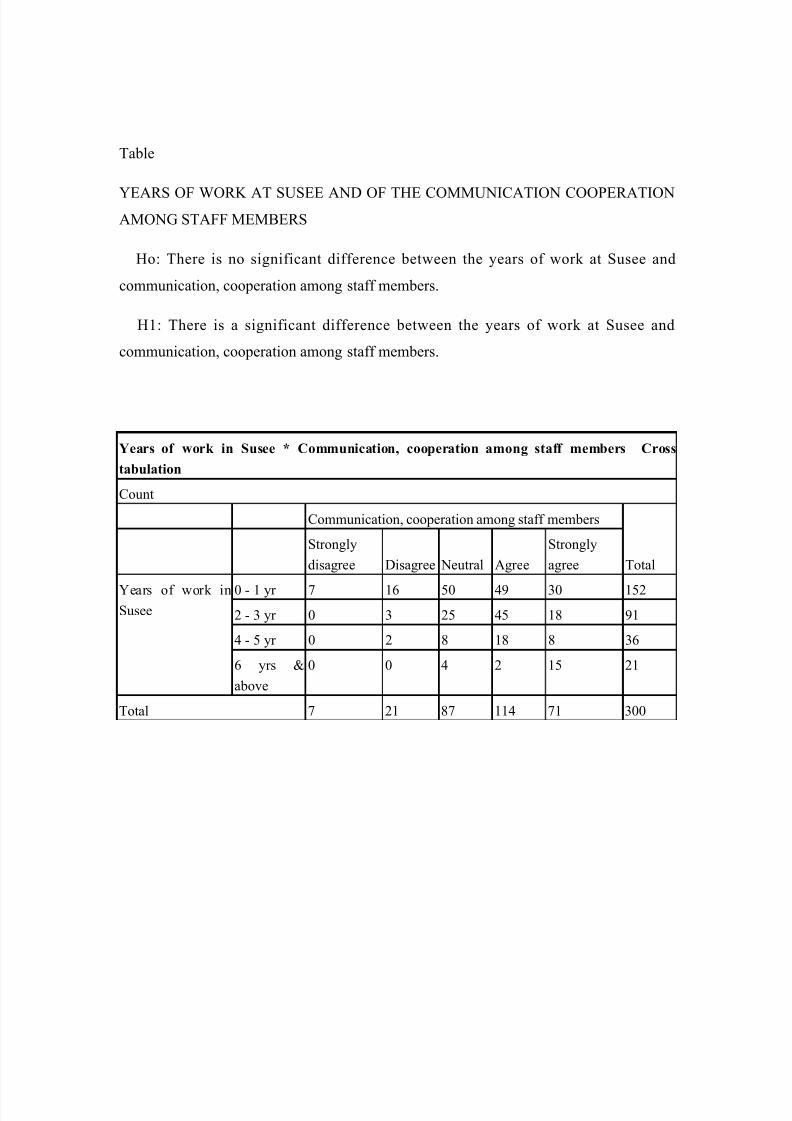
8/7/2019 Print Out Copy
http://slidepdf.com/reader/full/print-out-copy 66/89
Table
YEARS OF WORK AT SUSEE AND OF THE COMMUNICATION COOPERATIONAMONG STAFF MEMBERS
Ho: There is no significant difference between the years of work at Susee andcommunication, cooperation among staff members.
H1: There is a significant difference between the years of work at Susee andcommunication, cooperation among staff members.
Years of work in Susee * Communication, cooperation among staff members Cross
tabulation
CountCommunication, cooperation among staff members
TotalStronglydisagree Disagree Neutral Agree
Stronglyagree
Years of work inSusee
0 - 1 yr 7 16 50 49 30 1522 - 3 yr 0 3 25 45 18 914 - 5 yr 0 2 8 18 8 366 yrs &above
0 0 4 2 15 21
Total 7 21 87 114 71 300
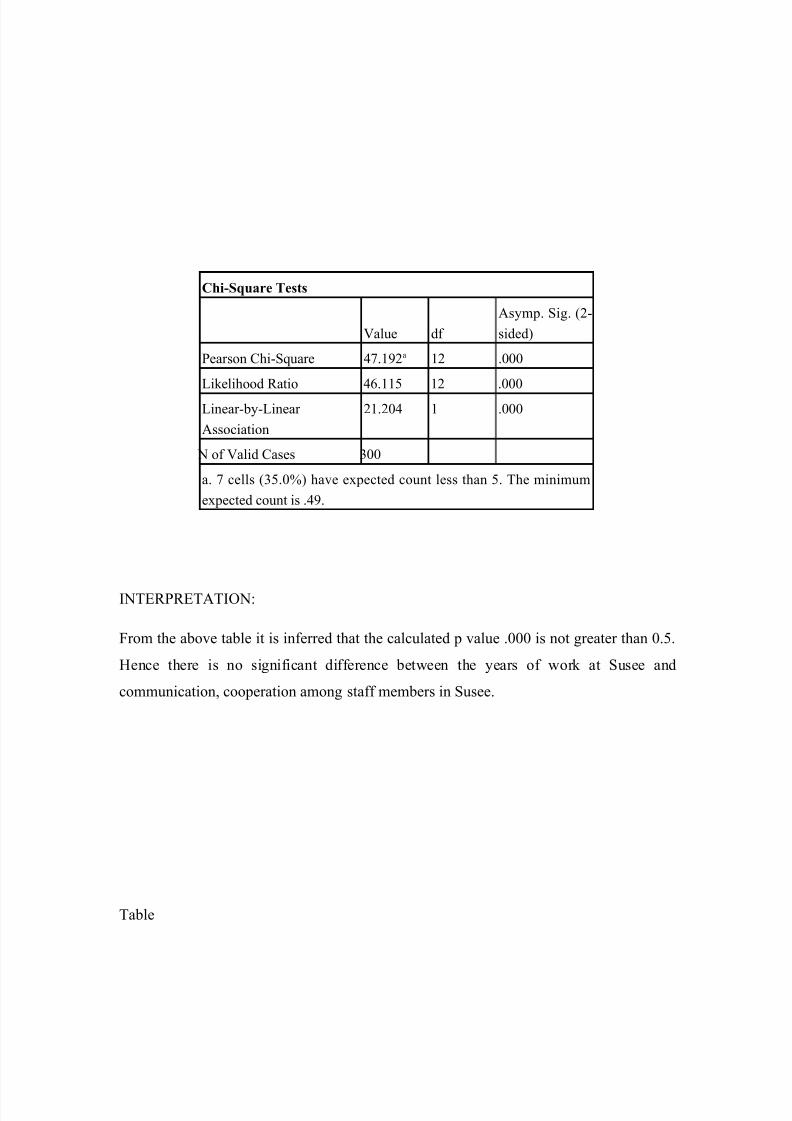
8/7/2019 Print Out Copy
http://slidepdf.com/reader/full/print-out-copy 67/89
Chi-Square Tests
Value df Asymp. Sig. (2-sided)
Pearson Chi-Square 47.192a 12 .000Likelihood Ratio 46.115 12 .000Linear-by-Linear Association
21.204 1 .000
N of Valid Cases 300a. 7 cells (35.0%) have expected count less than 5. The minimumexpected count is .49.
INTERPRETATION:
From the above table it is inferred that the calculated p value .000 is not greater than 0.5.Hence there is no significant difference between the years of work at Susee andcommunication, cooperation among staff members in Susee.
Table

8/7/2019 Print Out Copy
http://slidepdf.com/reader/full/print-out-copy 68/89
YEARS OF WORK AT SUSEE AND MY WORKLOAD AND DEADLINES INSUSEE
Ho: There is no significant difference between the years of work at Susee and my
workload and deadlines in Susee.
H1: There is a significant difference between the years of work at Susee and myworkload and deadlines in Susee.
Years of work in Susee * My workload and deadlines are reasonable Cross tabulation
CountMy workload and deadlines are reasonable
TotalStronglydisagree Disagree Neutral Agree
Stronglyagree
Years of work inSusee
0 - 1 yr 2 10 59 68 13 1522 - 3 yr 2 4 44 37 4 914 - 5 yr 0 2 4 20 10 366 yrs &above
0 2 2 15 2 21
Total 4 18 109 140 29 300

8/7/2019 Print Out Copy
http://slidepdf.com/reader/full/print-out-copy 69/89
Chi-Square Tests
Value df Asymp. Sig. (2-sided)
Pearson Chi-Square 35.746a 12 .000
Likelihood Ratio 36.318 12 .000Linear-by-Linear Association
7.297 1 .007
N of Valid Cases 300a. 8 cells (40.0%) have expected count less than 5. The minimumexpected count is .28.
INTERPRETATION:
From the above table it is inferred that the calculated p value .000 is not greater than 0.5.Hence there is no significant difference between the years of work at Susee and myworkload and deadlines in Susee.
Table
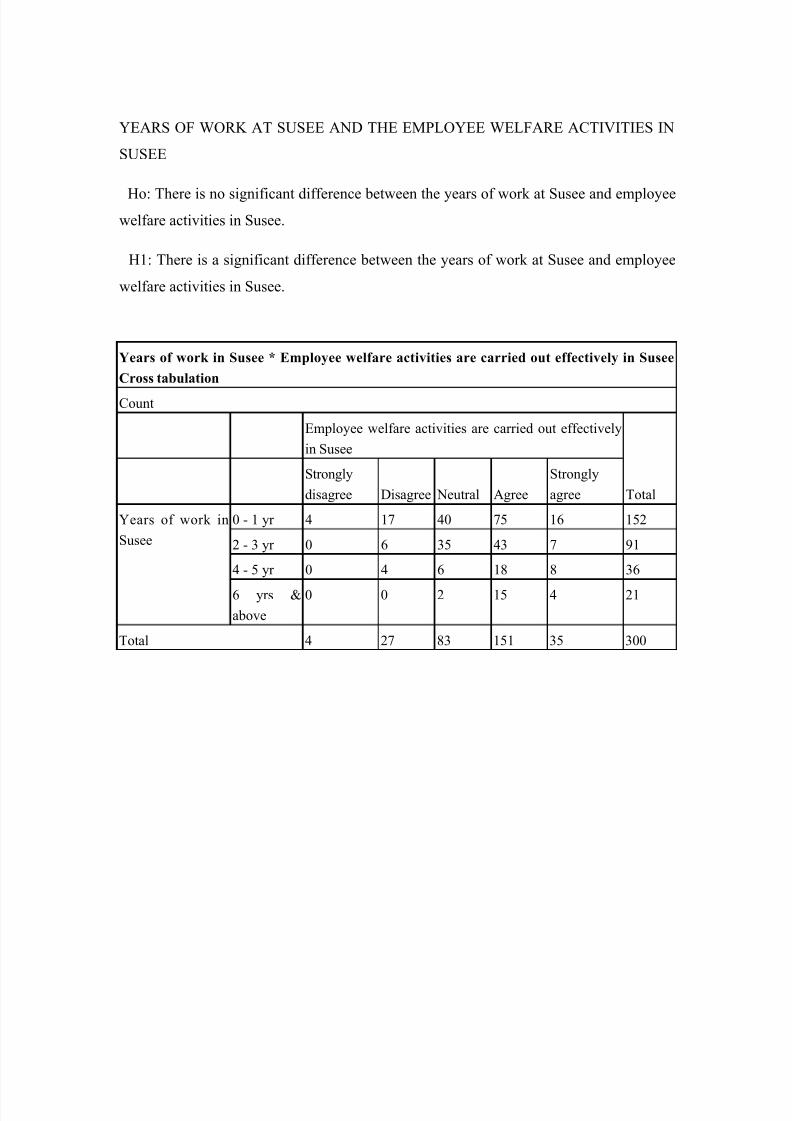
8/7/2019 Print Out Copy
http://slidepdf.com/reader/full/print-out-copy 70/89
YEARS OF WORK AT SUSEE AND THE EMPLOYEE WELFARE ACTIVITIES INSUSEE
Ho: There is no significant difference between the years of work at Susee and employeewelfare activities in Susee.
H1: There is a significant difference between the years of work at Susee and employeewelfare activities in Susee.
Years of work in Susee * Employee welfare activities are carried out effectively in Susee
Cross tabulation
CountEmployee welfare activities are carried out effectivelyin Susee
TotalStronglydisagree Disagree Neutral Agree
Stronglyagree
Years of work inSusee
0 - 1 yr 4 17 40 75 16 1522 - 3 yr 0 6 35 43 7 914 - 5 yr 0 4 6 18 8 36
6 yrs &above
0 0 2 15 4 21
Total 4 27 83 151 35 300

8/7/2019 Print Out Copy
http://slidepdf.com/reader/full/print-out-copy 71/89
Chi-Square Tests
Value df Asymp. Sig. (2-sided)
Pearson Chi-Square 23.239a 12 .026
Likelihood Ratio 26.442 12 .009Linear-by-Linear Association
8.570 1 .003
N of Valid Cases 300a. 8 cells (40.0%) have expected count less than 5. The minimumexpected count is .28.
INTERPRETATION:
From the above table it is inferred that the calculated p value .026 is not greater than 0.5.Hence there is no significant difference between the years of work at Susee and employeewelfare activities in Susee.
Table
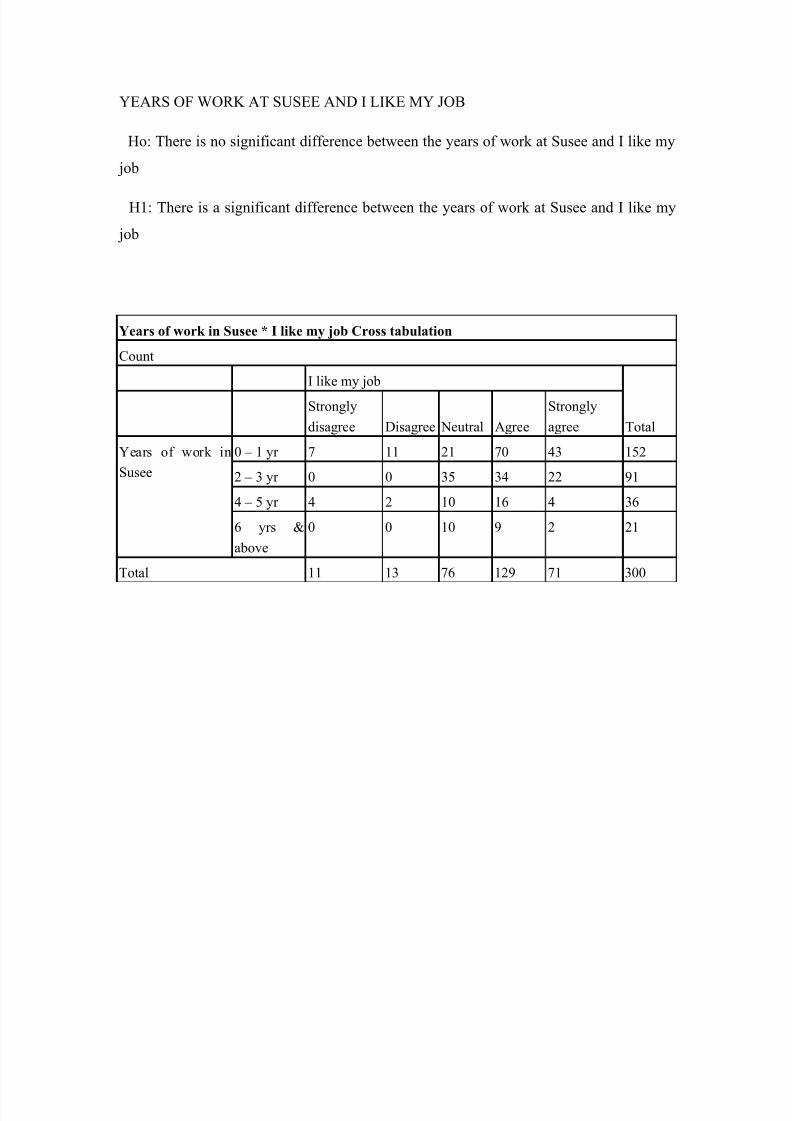
8/7/2019 Print Out Copy
http://slidepdf.com/reader/full/print-out-copy 72/89
YEARS OF WORK AT SUSEE AND I LIKE MY JOB
Ho: There is no significant difference between the years of work at Susee and I like my job
H1: There is a significant difference between the years of work at Susee and I like my job
Years of work in Susee * I like my job Cross tabulation
CountI like my job
TotalStronglydisagree Disagree Neutral Agree
Stronglyagree
Years of work inSusee
0 – 1 yr 7 11 21 70 43 1522 – 3 yr 0 0 35 34 22 914 – 5 yr 4 2 10 16 4 366 yrs &above
0 0 10 9 2 21
Total 11 13 76 129 71 300

8/7/2019 Print Out Copy
http://slidepdf.com/reader/full/print-out-copy 73/89
Chi-Square Tests
Value df Asymp. Sig. (2-sided)
Pearson Chi-Square 42.775a 12 .000Likelihood Ratio 50.198 12 .000Linear-by-Linear Association
4.455 1 .035
N of Valid Cases 300a. 7 cells (35.0%) have expected count less than 5. The minimumexpected count is .77.
INTERPRETATION:
From the above table it is inferred that the calculated p value .000 is not greater than 0.5.Hence there is no significant difference between the years of work at Susee and I like my job.
Table

8/7/2019 Print Out Copy
http://slidepdf.com/reader/full/print-out-copy 74/89
YEARS OF WORK AT SUSEE AND I HAVE AN IDEA OF SEEKINGEMPLOYMENT ANYWHERE
Ho: There is no significant difference between the years of work at Susee and I have anidea of seeking employment.
H1: There is a significant difference between the years of work at Susee and I have anidea of seeking employment.
Years of work in Susee * I have an idea of seeking job Cross tabulation
CountI have an idea of seeking job
TotalStronglydisagree Disagree Neutral Agree
Stronglyagree
Years of work inSusee
0 – 1 yr 16 19 63 34 20 1522 – 3 yr 18 7 33 27 6 914 – 5 yr 8 6 8 10 4 366 yrs &
above
6 4 4 7 0 21
Total 48 36 108 78 30 300
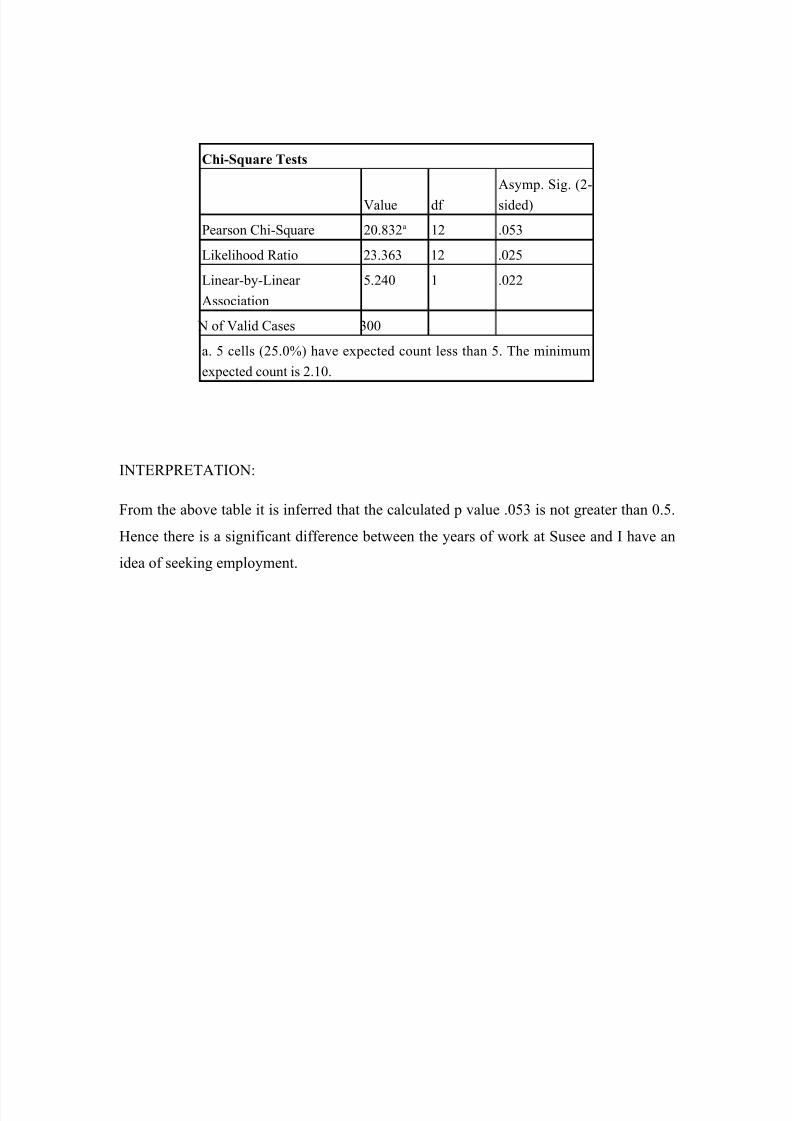
8/7/2019 Print Out Copy
http://slidepdf.com/reader/full/print-out-copy 75/89
Chi-Square Tests
Value df Asymp. Sig. (2-sided)
Pearson Chi-Square 20.832a 12 .053Likelihood Ratio 23.363 12 .025Linear-by-Linear Association
5.240 1 .022
N of Valid Cases 300a. 5 cells (25.0%) have expected count less than 5. The minimumexpected count is 2.10.
INTERPRETATION:
From the above table it is inferred that the calculated p value .053 is not greater than 0.5.Hence there is a significant difference between the years of work at Susee and I have anidea of seeking employment.

8/7/2019 Print Out Copy
http://slidepdf.com/reader/full/print-out-copy 76/89
Table
YEARS OF WORK AT SUSEE AND OVERALL SATISFACTION WITH SUSEE
Ho: There is no significant difference between the years of work at Susee and overallsatisfaction in Susee.
H1: There is a significant difference between the years of work at Susee and overallsatisfaction in Susee.
Years of work in Susee * Overall satisfaction with our company Cross tabulation
CountOverall satisfaction with our company
TotalStronglydisagree Disagree Neutral Agree
Stronglyagree
Years of work inSusee
0 – 1 yr 2 9 48 61 32 1522 - 3 yr 0 0 29 60 2 914 - 5 yr 2 0 0 30 4 366 yrs &above
0 0 2 15 4 21
Total 4 9 79 166 42 300
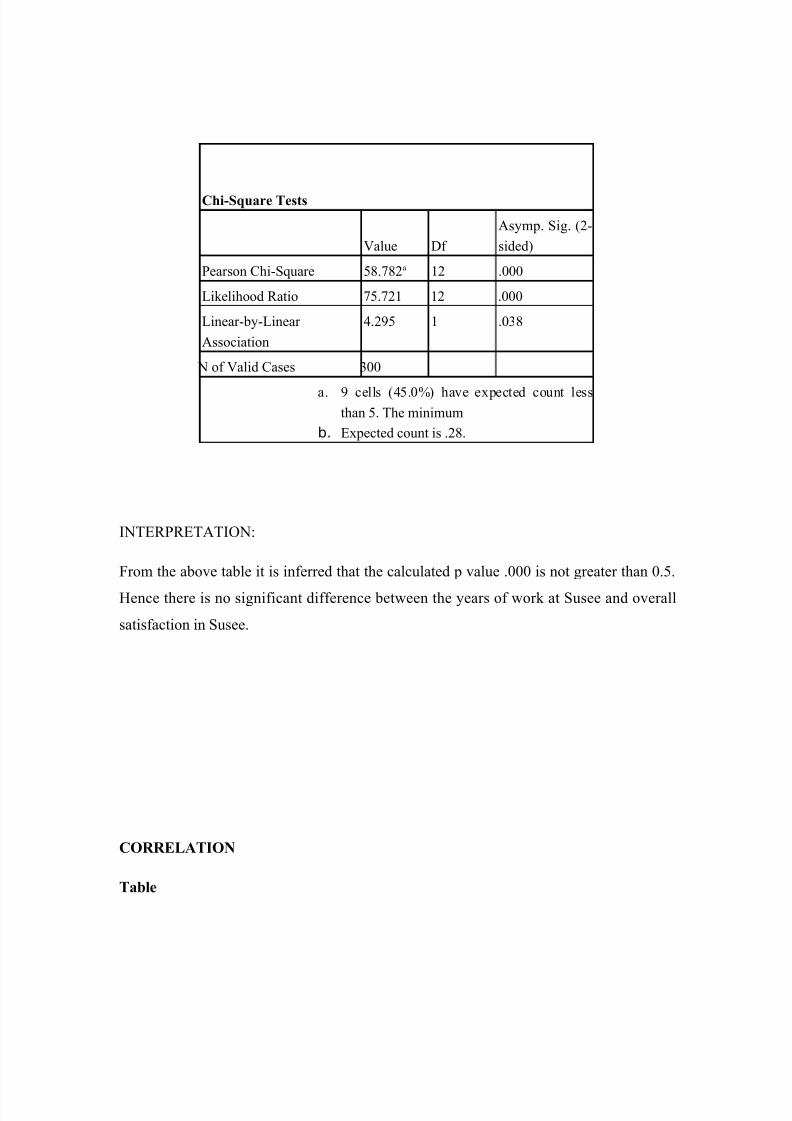
8/7/2019 Print Out Copy
http://slidepdf.com/reader/full/print-out-copy 77/89
Chi-Square Tests
Value Df Asymp. Sig. (2-sided)
Pearson Chi-Square 58.782a 12 .000Likelihood Ratio 75.721 12 .000Linear-by-Linear Association
4.295 1 .038
N of Valid Cases 300
a. 9 cells (45.0%) have expected count lessthan 5. The minimum
b. Expected count is .28.
INTERPRETATION:
From the above table it is inferred that the calculated p value .000 is not greater than 0.5.Hence there is no significant difference between the years of work at Susee and overallsatisfaction in Susee.
CORRELATION
Table
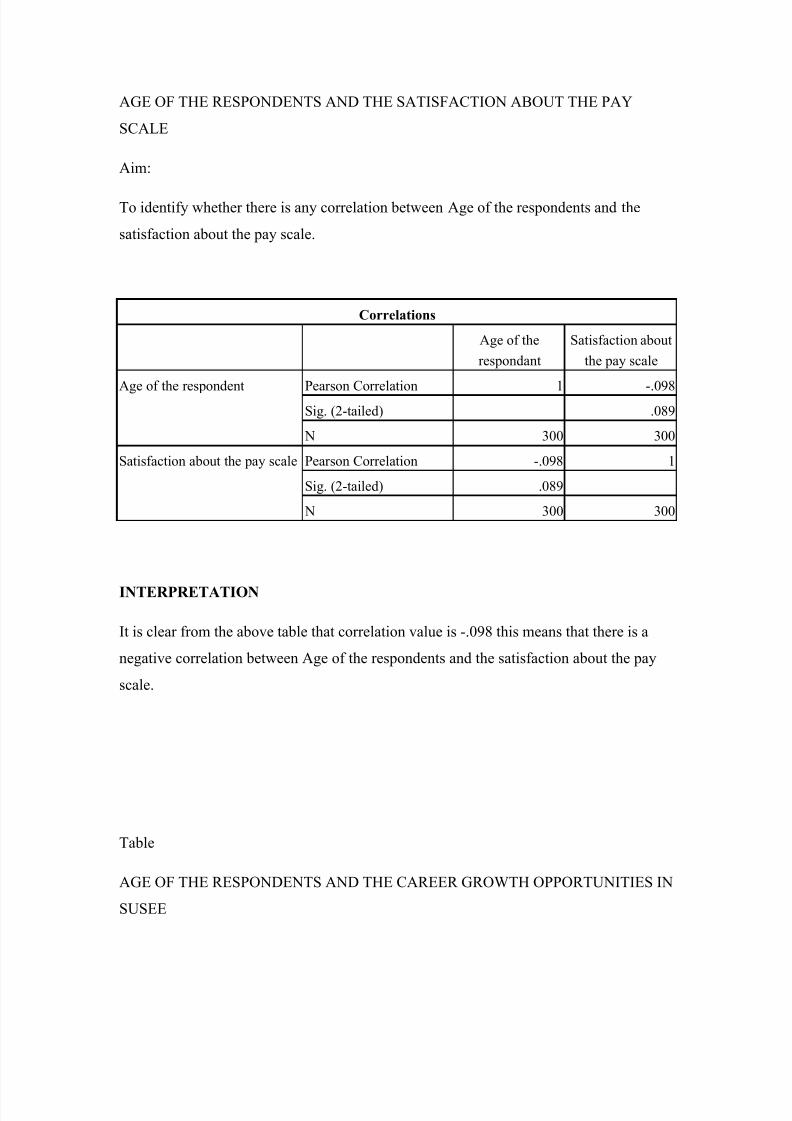
8/7/2019 Print Out Copy
http://slidepdf.com/reader/full/print-out-copy 78/89
AGE OF THE RESPONDENTS AND THE SATISFACTION ABOUT THE PAYSCALE
Aim:
To identify whether there is any correlation between Age of the respondents and thesatisfaction about the pay scale.
Correlations
Age of therespondant
Satisfaction aboutthe pay scale
Age of the respondent Pearson Correlation 1 -.098Sig. (2-tailed) .089 N 300 300
Satisfaction about the pay scale Pearson Correlation -.098 1Sig. (2-tailed) .089 N 300 300
INTERPRETATION
It is clear from the above table that correlation value is -.098 this means that there is anegative correlation between Age of the respondents and the satisfaction about the payscale.
Table
AGE OF THE RESPONDENTS AND THE CAREER GROWTH OPPORTUNITIES INSUSEE
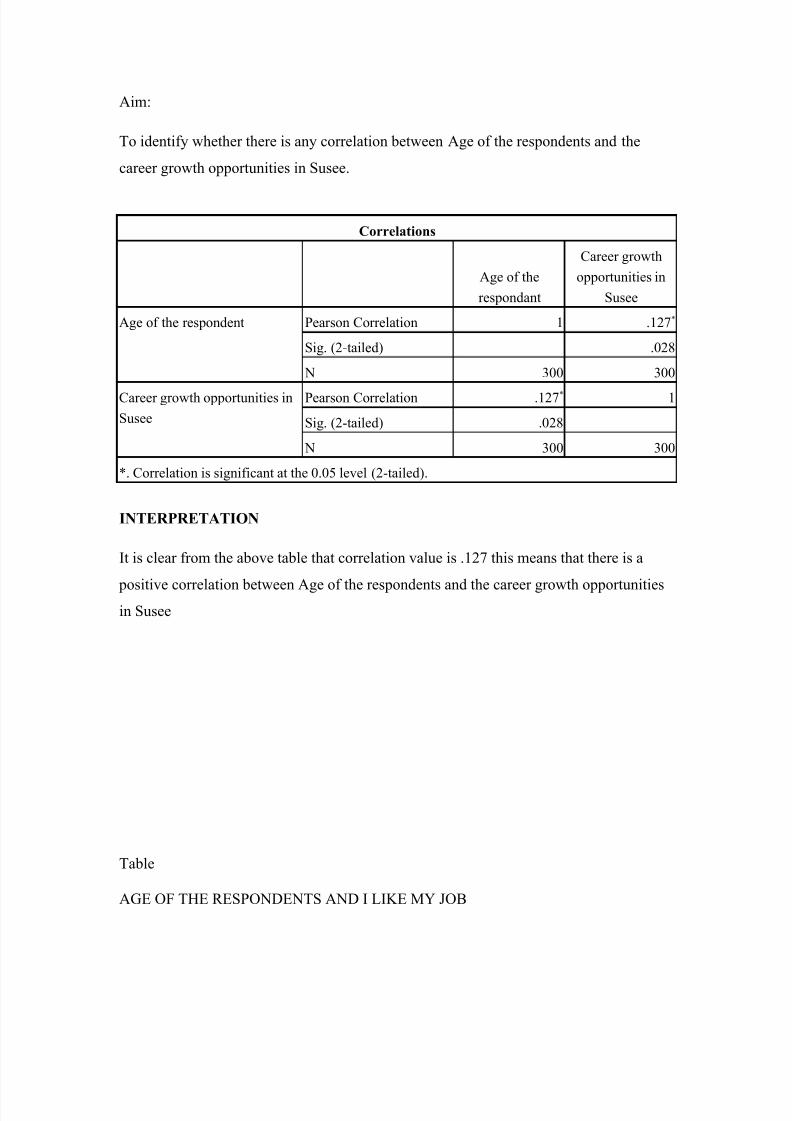
8/7/2019 Print Out Copy
http://slidepdf.com/reader/full/print-out-copy 79/89
Aim:
To identify whether there is any correlation between Age of the respondents and thecareer growth opportunities in Susee.
Correlations
Age of therespondant
Career growthopportunities in
SuseeAge of the respondent Pearson Correlation 1 .127*
Sig. (2-tailed) .028 N 300 300
Career growth opportunities inSusee
Pearson Correlation .127* 1Sig. (2-tailed) .028 N 300 300
*. Correlation is significant at the 0.05 level (2-tailed).
INTERPRETATION
It is clear from the above table that correlation value is .127 this means that there is a
positive correlation between Age of the respondents and the career growth opportunitiesin Susee
Table
AGE OF THE RESPONDENTS AND I LIKE MY JOB
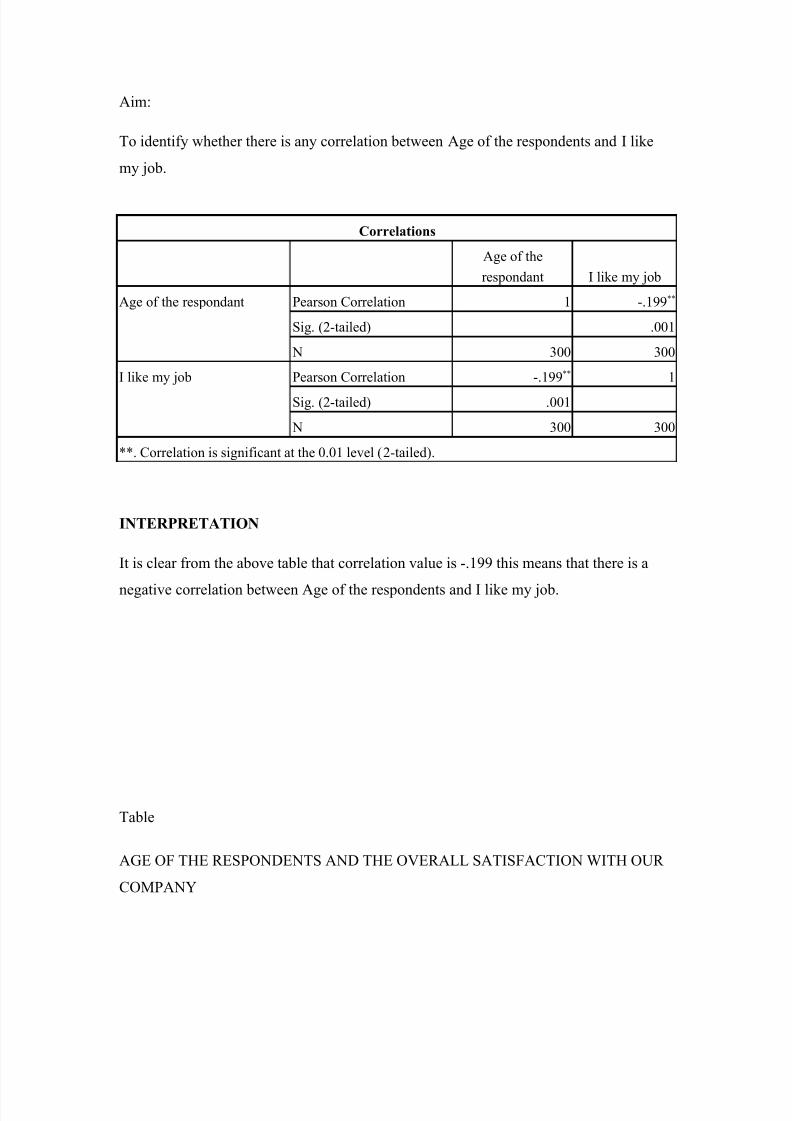
8/7/2019 Print Out Copy
http://slidepdf.com/reader/full/print-out-copy 80/89
Aim:
To identify whether there is any correlation between Age of the respondents and I likemy job.
Correlations
Age of therespondant I like my job
Age of the respondant Pearson Correlation 1 -.199**
Sig. (2-tailed) .001 N 300 300
I like my job Pearson Correlation -.199** 1Sig. (2-tailed) .001 N 300 300
**. Correlation is significant at the 0.01 level (2-tailed).
INTERPRETATION
It is clear from the above table that correlation value is -.199 this means that there is a
negative correlation between Age of the respondents and I like my job.
Table
AGE OF THE RESPONDENTS AND THE OVERALL SATISFACTION WITH OUR COMPANY

8/7/2019 Print Out Copy
http://slidepdf.com/reader/full/print-out-copy 81/89
Aim:
To identify whether there is any correlation between Age of the respondents and theoverall satisfaction with our company.
Correlations
Age of therespondant
Overallsatisfaction with
our companyAge of the respondent Pearson Correlation 1 .074
Sig. (2-tailed) .199 N 300 300
Overall satisfaction with our company
Pearson Correlation .074 1Sig. (2-tailed) .199 N 300 300
INTERPRETATION
It is clear from the above table that correlation value is .074.this means that there is a positive correlation between Age of the respondents and the overall satisfaction with our
company.
ANOVA
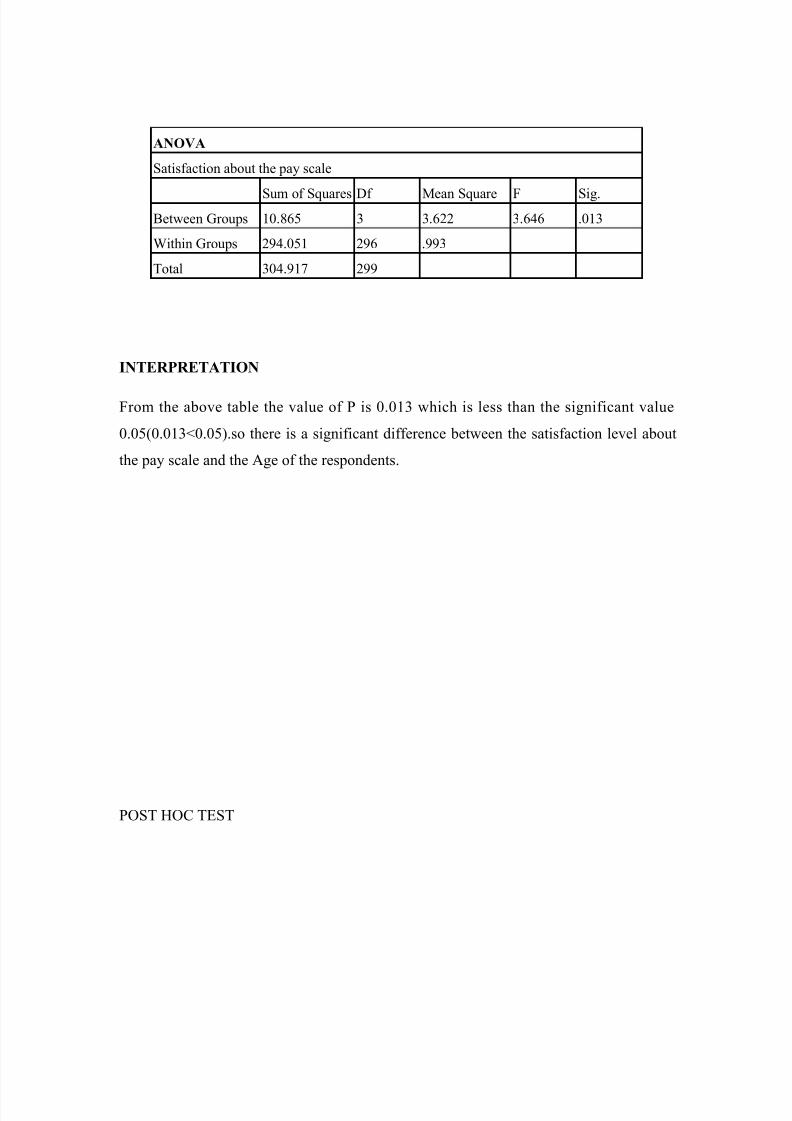
8/7/2019 Print Out Copy
http://slidepdf.com/reader/full/print-out-copy 82/89
ANOVA
Satisfaction about the pay scale
Sum of Squares Df Mean Square F Sig.Between Groups 10.865 3 3.622 3.646 .013Within Groups 294.051 296 .993Total 304.917 299
INTERPRETATION
From the above table the value of P is 0.013 which is less than the significant value0.05(0.013<0.05).so there is a significant difference between the satisfaction level aboutthe pay scale and the Age of the respondents.
POST HOC TEST
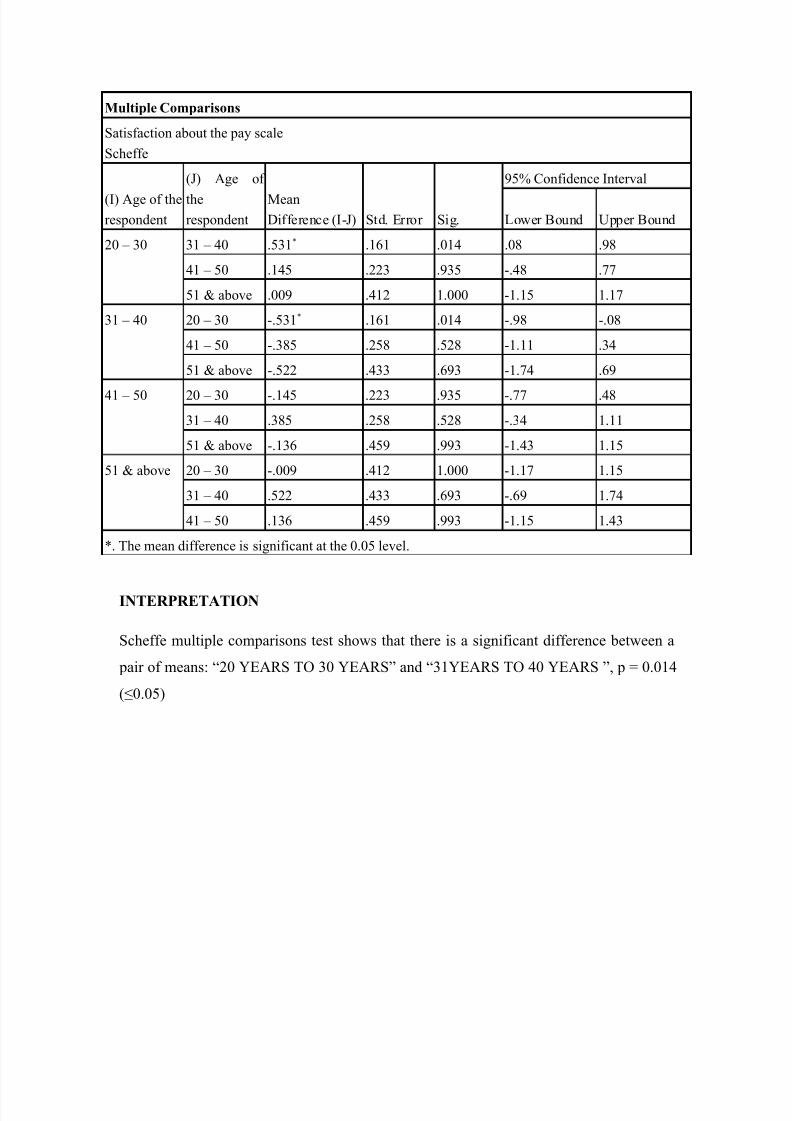
8/7/2019 Print Out Copy
http://slidepdf.com/reader/full/print-out-copy 83/89
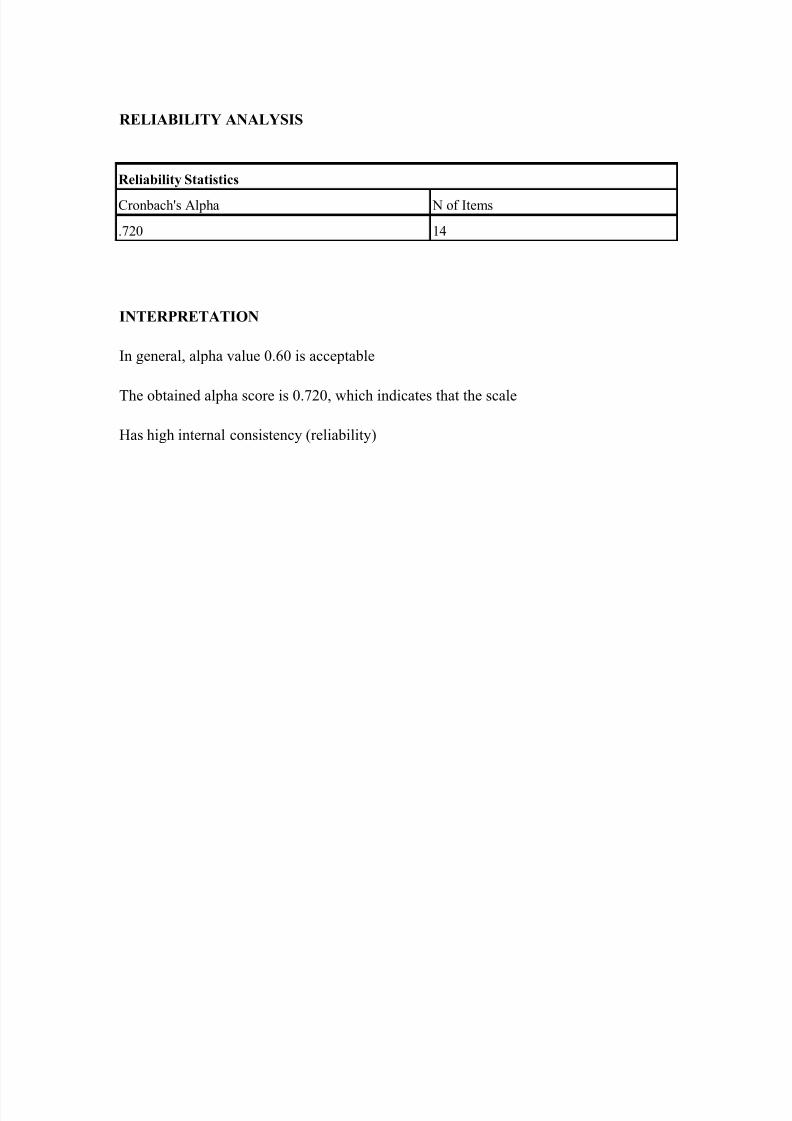
8/7/2019 Print Out Copy
http://slidepdf.com/reader/full/print-out-copy 84/89
RELIABILITY ANALYSIS
Reliability Statistics
Cronbach's Alpha N of Items
.720 14
INTERPRETATION
In general, alpha value 0.60 is acceptable
The obtained alpha score is 0.720, which indicates that the scale
Has high internal consistency (reliability)
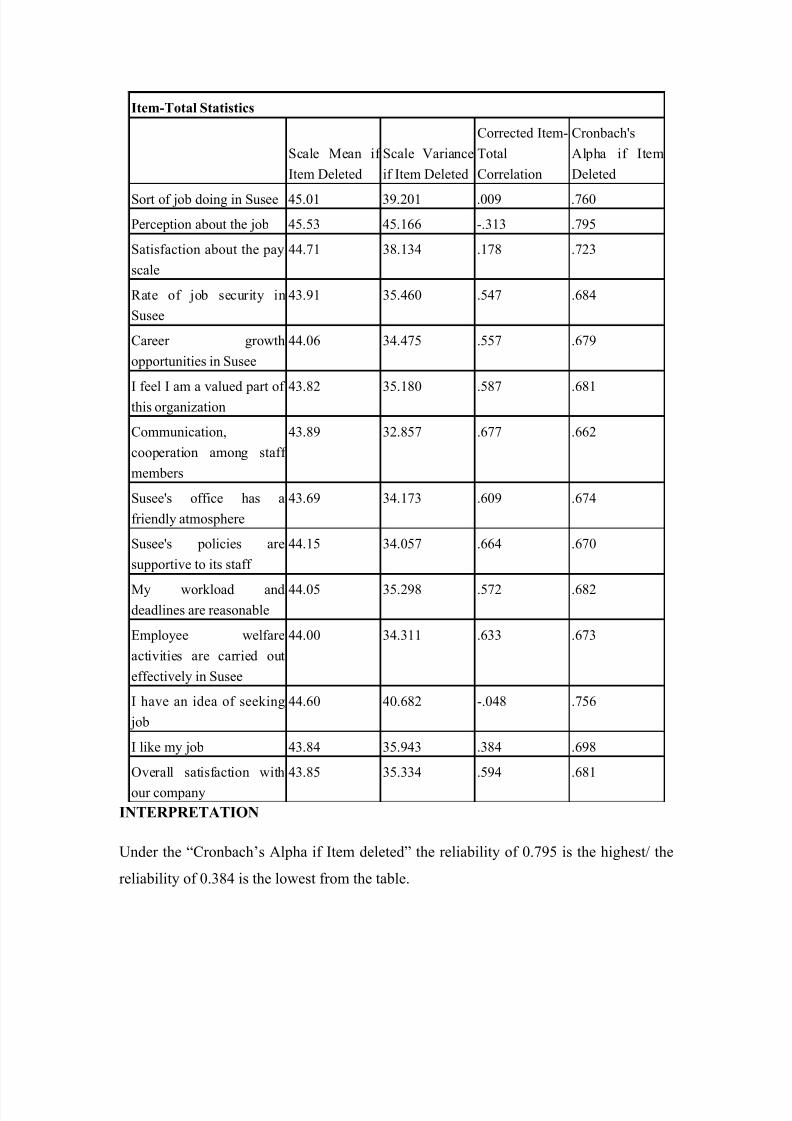
8/7/2019 Print Out Copy
http://slidepdf.com/reader/full/print-out-copy 85/89
Item-Total Statistics
Scale Mean if Item Deleted
Scale Varianceif Item Deleted
Corrected Item-TotalCorrelation
Cronbach'sAlpha if ItemDeleted
Sort of job doing in Susee 45.01 39.201 .009 .760Perception about the job 45.53 45.166 -.313 .795Satisfaction about the payscale
44.71 38.134 .178 .723
Rate of job security inSusee
43.91 35.460 .547 .684
Career growthopportunities in Susee
44.06 34.475 .557 .679
I feel I am a valued part of this organization 43.82 35.180 .587 .681
Communication,cooperation among staff members
43.89 32.857 .677 .662
Susee's office has afriendly atmosphere
43.69 34.173 .609 .674
Susee's policies aresupportive to its staff
44.15 34.057 .664 .670
My workload anddeadlines are reasonable
44.05 35.298 .572 .682
Employee welfareactivities are carried outeffectively in Susee
44.00 34.311 .633 .673
I have an idea of seeking job
44.60 40.682 -.048 .756
I like my job 43.84 35.943 .384 .698Overall satisfaction withour company
43.85 35.334 .594 .681
INTERPRETATION
Under the “Cronbach’s Alpha if Item deleted” the reliability of 0.795 is the highest/ thereliability of 0.384 is the lowest from the table.
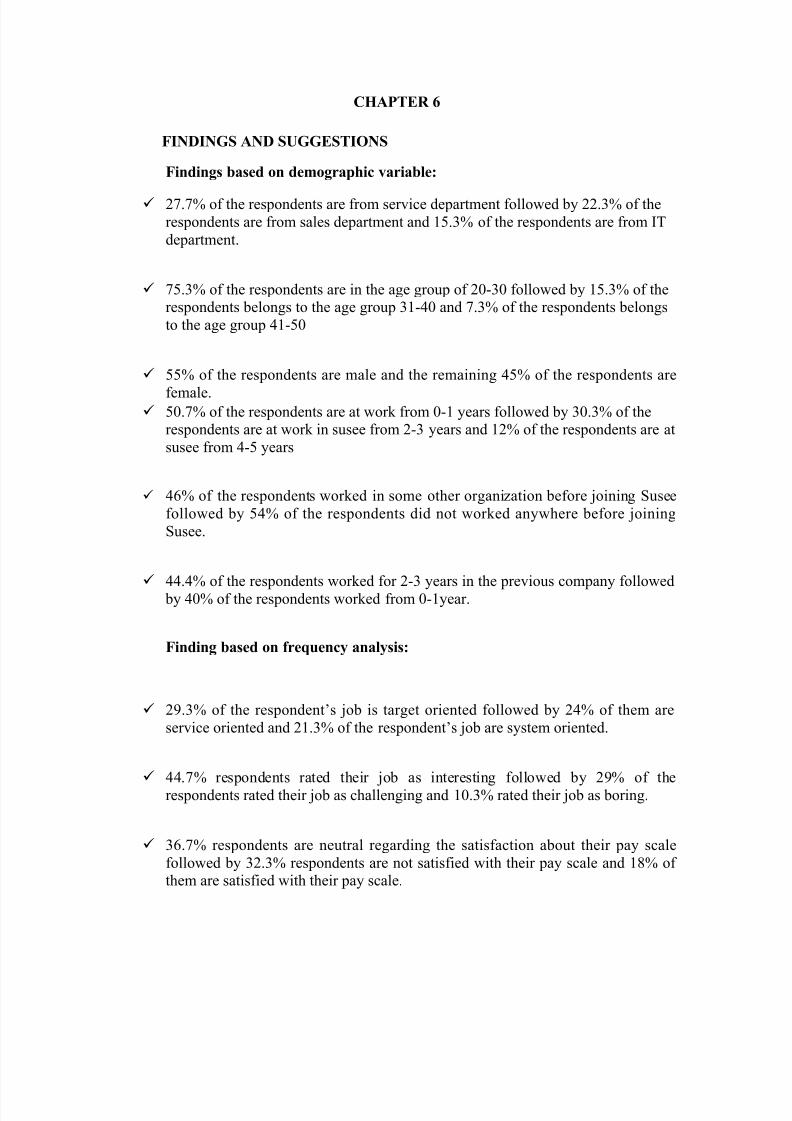
8/7/2019 Print Out Copy
http://slidepdf.com/reader/full/print-out-copy 86/89
CHAPTER 6
FINDINGS AND SUGGESTIONS
Findings based on demographic variable:
27.7% of the respondents are from service department followed by 22.3% of therespondents are from sales department and 15.3% of the respondents are from ITdepartment.
75.3% of the respondents are in the age group of 20-30 followed by 15.3% of therespondents belongs to the age group 31-40 and 7.3% of the respondents belongsto the age group 41-50
55% of the respondents are male and the remaining 45% of the respondents arefemale.50.7% of the respondents are at work from 0-1 years followed by 30.3% of therespondents are at work in susee from 2-3 years and 12% of the respondents are atsusee from 4-5 years
46% of the respondents worked in some other organization before joining Suseefollowed by 54% of the respondents did not worked anywhere before joiningSusee.
44.4% of the respondents worked for 2-3 years in the previous company followed by 40% of the respondents worked from 0-1year.
Finding based on frequency analysis:
29.3% of the respondent’s job is target oriented followed by 24% of them areservice oriented and 21.3% of the respondent’s job are system oriented.
44.7% respondents rated their job as interesting followed by 29% of therespondents rated their job as challenging and 10.3% rated their job as boring.
36.7% respondents are neutral regarding the satisfaction about their pay scalefollowed by 32.3% respondents are not satisfied with their pay scale and 18% of them are satisfied with their pay scale.

8/7/2019 Print Out Copy
http://slidepdf.com/reader/full/print-out-copy 87/89
44% respondents are agreeing their job as a secure one followed by 35% of therespondents said their job security as neutral.
48.7% of the respondents agree that they have career growth opportunitiesfollowed by 23.7% said neutral about the career growth opportunities and 14%disagree that they does not have career growth opportunities.
51% the respondents agree that they feel valued part of this organization followed by 26.3% feel neutral and 17.7% of the respondents strongly agree that they feelvalued part of this organization.
38% of the respondents agree that communication, cooperation among staff isgood followed by 29% of the respondents said neutral about the communication,cooperation among staff members and 23.7% strongly agree.
48.3% the respondents agree that there is a friendly atmosphere at Susee followed by 26.7% of the respondents strongly agrees there is a friendly relationship existsin the organization.
39% of the respondents agree that Susee policies are supportive to the staff followed by 38.7% said neutral and 11.3% of the respondents disagree that Susee policies are not supportive to the staff.
46.7% the respondents agree that my workload and deadlines are reasonablefollowed by 36.3% of the respondents said neutral and 9.7% of the respondentsstrongly agree that their workload and deadlines are reasonable..
50.3% of the respondents agree that employee welfare activities are carried outeffectively followed by 27.7% of the respondents rated their views as neutral and11.7% of the respondents strongly agree that employee welfare activities arecarried out effectively.
36% of the respondents rated neutral for having an idea for seeking job followed by 26% of the respondents agree they have an idea of seeking job and 16% of therespondents strongly disagree for having an idea for seeking job.
43% of the respondents agree that they like their job followed by 25.3% of therespondents rated neutral and 23.7% of the respondents strongly agree that theylike their job

8/7/2019 Print Out Copy
http://slidepdf.com/reader/full/print-out-copy 88/89
55.3% of the respondents agree that they are satisfied with Susee followed by26.3% rated as neutral and 14% of the respondents strongly agree that they aresatisfied overall with Susee.
60.7% of the respondents will recommend working for Susee to their familymembers, friends and the remaining 39.3% of the respondents will notrecommend Susee to anyone.
64% of the respondents will not return back to Susee even if they dispel and theremaining 36% of the respondents will return back to Susee even they dispel
Finding based on CHI SQUARE:
There is no significant difference between the years of work at Susee anddepartment of the respondents.
There is no significant difference between the years of work at Susee and perception about the job.
There is no significant difference between the years of work at Susee andsatisfaction about the pay scale.
There is no significant difference between the years of work at Susee and career growth opportunities at Susee.
There is no significant difference between the years of work at Susee and
communication, cooperation among staff members in Susee.
There is no significant difference between the years of work at Susee and myworkload and deadlines in Susee.
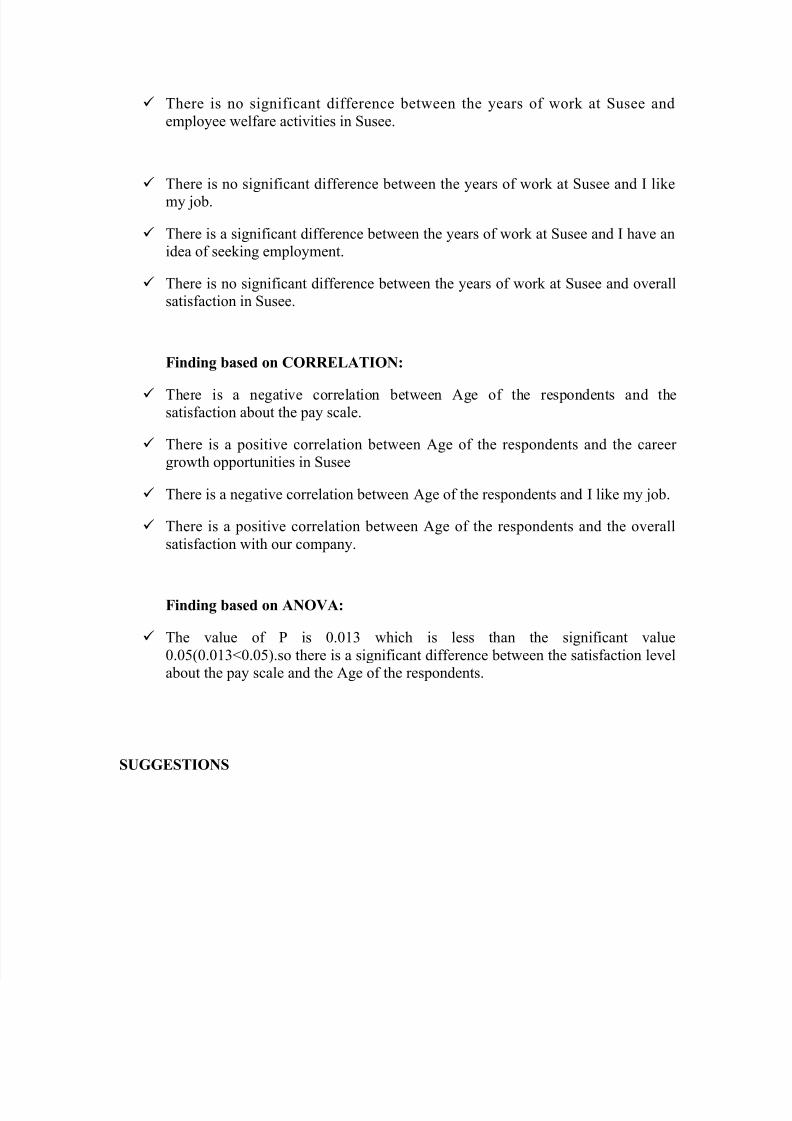
8/7/2019 Print Out Copy
http://slidepdf.com/reader/full/print-out-copy 89/89
There is no significant difference between the years of work at Susee andemployee welfare activities in Susee.
There is no significant difference between the years of work at Susee and I likemy job.
There is a significant difference between the years of work at Susee and I have anidea of seeking employment.
There is no significant difference between the years of work at Susee and overallsatisfaction in Susee.
Finding based on CORRELATION:
There is a negative correlation between Age of the respondents and thesatisfaction about the pay scale.
There is a positive correlation between Age of the respondents and the career growth opportunities in Susee
There is a negative correlation between Age of the respondents and I like my job.
There is a positive correlation between Age of the respondents and the overallsatisfaction with our company.
Finding based on ANOVA:
The value of P is 0.013 which is less than the significant value0.05(0.013<0.05).so there is a significant difference between the satisfaction levelabout the pay scale and the Age of the respondents.