Embed Size (px)
Citation preview

Preparing your Investment Portfolio for the Roaring ‘20s…Skate to where the Puck is going to be!
Presented byTobias E. TimmDirector – InvestmentsCredit Union Investment Strategy GroupOppenheimer & Co. Inc.

I skate to where the puck is going to be, not the where it has been.- Wayne Gretzky

Our Team – Over 120yrs of Experience of Working with CU’s
Credit Union Investment Strategy Group of Oppenheimer & Co. Inc.1400 Abbot RoadEast Lansing, MI 48823(517) 333-7791(844) 616-4431
Mark WickardManaging Director – Investments
Regina WickardDirector – Investments
Kevin LynchDirector – Investments
Elizabeth DuncanGroup Analytical Associate
Tobias TimmDirector – Investments
Isaiah J. TimmFinancial Advisor
Seth KellicutGroup Marketing Associate
Bryan BellGroup Business Associate

The Credit Union Investment Strategy Group

Working Exclusively with Credit Unions since 1990 Educated by John R. Brick, PhD of Brick & Associates in ALM
principles and applications for Investment Portfolio management Educated by Frank J. Fabozzi, PhD, of Fabozzi Associates, and
visiting fellow at Princeton & Yale Universities on development andimplementation of Fixed Income Investing
Graduated from Eli Broad School of Management MSU Educated at The Wharton School University of
Pennsylvania/Investment Management Consultant Association(IMCA)
About Me

Can the U.S. Treasury Curve really trade at NegativeYields?
Managing an investment portfolio with flashbacks to2009-2016, Hope is not a Strategy!
Are my Investment policies preventing me from anOutperforming Investment Portfolio?
Is there any unrealized value to my members beyondmy SimpliCD world?
Veritas…The S-L-Y investment principal was/is amistake… S-Y-L reflects reality! What do I do Now?
Skate to where the Puck is going to be, not where it has been…

Can the U.S. Yield Curve go Negative?

Modern Monetary Theory (MMT) explained…
Can the U.S. Treasury Curve go Negative?

You may have seen similar headlines…

Explaining Negative Interest Rate Policies (NIRPs) A negative interest rate means that the centra bank (and perhaps private banks)
will charge negative interest. Instead of receiving money on deposits, depositors
must pay regularly to keep their money with the bank. This is intended to
incentivize banks to lend money more freely and businesses and individuals to
invest, lend, and spend money rather than pay a fee to keep it safe. This
happens during a negative interest rate environment.
The Theory Behind Negative Interest Rate Policy
(NI RP) Negative interest rates can be considered a last-ditch effort to boost economic
growth. Basically, it's put into place when all else (every other type of traditional
policy) has proved ineffective and may have failed.

Negative Bond Yields
Thirty percent of all investment-grade securities now bear sub-zero yields. Investors are willing to pay a premium—and ultimately take a loss—because they need the reliability and liquidity that government and high-quality corporate bonds provide. Large investors such as pension funds, insurers, and financial institutions may have few other safe places to store their wealth.
Source: Bloomberg

Are Lower Yields a Secular Trend?
• The secular outlook has changed and those applying the thinking fromprevious economic cycles about inflation and real yields concludethese low yields represent a bubble.
• They are not considering aging populations that are buying bonds (thisworks out to roughly $21 trillion saved every year) and pushing yieldsbelow inflation rates driven lower by advances in technology.
• Add aggressive central banks willing to take monetary policy rates intonegative territory and the standard rules that say bubble have notworked for almost a decade.
• Don’t expect this to change anytime soon.– Jim Bianco, Bianco Research

Who Are The Guilty Parties?

Negative Bond Yields
Source: Bloomberg

The 10YR TSY Historical Interplay Between FOMC Activity and the Yield Curve Can be a Predictive Tool for Recessions.
10 YR TSY = Yellow Line
FED FUNDS Target =White Line
Source: Bloomberg

What Can the Spread Between the 2YR/ 10YR Treasury Tell Us About the Economy?
Yield Curve Flattening to Continue? Signal for Pending Recession?
Conclusion: A Flattening Yield Curve Can Signal a Pending Recession

Headlines from 10/30/2019 Chairman Powell Briefing
T-Bill Purchases Shouldn't Be Confused With QE, are Purely TechnicalMeasure
Rates Are at an Accommodative Level We Would Respond if Outlook Materially Changes We'd raise if we saw inflation moving up or likely to move a lot higher,
which is not a risk we really see right now. I think we would need to see a serious move up in inflation that's
persistent before we would raise rates because of inflation concerns. “We’re not thinking about raising rates right now. There obviously will be
times in the future” where that will be appropriate As Long as Our Outlook Holds, Policy Is Appropriate
Sources: Luke Kawa Markets Reporter, Anny Kuo TOPLive Editor, Tal Barak Harif TOPLive Editor, Matthew Boesler Fed Reporter, Andrew Cinko Editor, U.S. Markets, Princeton

FOMC Spectrometer

Fed Fund Futures Probabilities

Inverted Yield Curve & Potential Flat Yield Curve
The Challenge for CU’s in Forecasting Their 2020 Budget
• Pressure on Deposit Pricing (many CU’s have already experienced this)• A Flat or Inverted yield curve can put pressure on a CU’s NIM
Conclusion: The potential for one more rate cut in 2019 may not be enough to normalize the yield curve = Most difficult rate environment for CU’s to operate profitably.
20

Hope Is Not A Strategy: The Yield Curve 2009-2016

US Treasury Yield Curve | SEP 2018 & SEP 2019The last tightening cycle began on DEC 2015 and ended DEC 2018. The Yield Curve has since flattened/inverted
Source: Bloomberg

U.S. Government 2yr TSY
20 bps – 100 bps

U.S. Government 5yr TSY
60 bps – 180 bps

• Formula: Traditional– 10yr Yield = 1.0x(U.S. Inflation Rate + Real U.S. GDP)– Let’s assume that a combination of factors (advances in technology, demographic trends, consequences
of debt loads, central bank easing, etc.) reduce the multiplier of 10yr bond yields to nominal GDP from1.0x to 0.8x.
• Formula: Revised
– 10yr Yield = 0.8x(U.S. Inflation (Y) + Real U.S. GDP (Z))
• X=1.73% (Actual), Y=1.7% (Actual), Z=1.7% (Actual)
• 1.73% = .08(1.7% + 1.7%) 1.73% ≠ 2.72%
Is the 10yr Cheap or Rich?
Source: Seabreeze Partners

Asset Allocation Shift => Lower Yields
• Back in mid-October, data released by Morningstar showed thatinvestors had pulled a net $60 billion out of stock funds in the thirdquarter. This would be the largest quarterly outflow for equity funds in10 years. During this same period, a net $118 billion poured into bondfunds, and a whopping net inflow of $225 billion moved into moneymarket funds.
• On Monday (October 28), a report released by Goldman Sachs showsthat over the past 12 months, U.S. equity funds have suffered netoutflows of $173 billion. This would be while a net $259 billionmoved into bond funds, and again... a net $592 billion moved into cashfunds.

U.S. Government 10yr TSY
150 bps – 400 bps

What Are Interest-Rate Expectations for 2019-2020 & Beyond…
The DOT PLOT indicates that the FED expects the “Fed Funds Rate” to remain flat in 2019.
This does NOTmean all rates across the curve will remain flat.
Source: Bloomberg

• THE FOMC (FED) expects to keep Fed Funds flat in 2019 but raise once in2020 (25 bps). This would drive up short-term rates and put pressure ondeposit pricing.
• If the spread between the 2YR & 10YR Treasuries goes to zero or lower, thiswould signal a recession = Increased potential credit losses in CU loanportfolios. The spread briefly went negative at the end of August 2019 andremains tight (less than 10 bps) in October 2019.
• The SEP 2019 DOT PLOT indicated no further lowering of the monetarypolicy (Fed Funds Rate) through 2021+. A lowering of the FED FUNDS Rateis used by the FED to stimulate growth through a recessionary period.
Result: NIM (Net Interest Margin) could come under pressure in 2019 & 2020.
Take-Aways from the Interest Rate Expectation Section

Conclusion: What are Your CU’s Options to Find
Return in a Zero or Negative Rate Environment?

Investment Policy Constraints and the Fallout:Missing Market Opportunities

• Are my Investment Policies preventing mefrom achieving an OutperformingInvestment Portfolio?
• People don’t resist change…they resist loss.• Loss of:
– What I know how to do– Certainty– Security
The Unrecognized Opportunity Costof Your Investment Policy

Underperformance? Definition of Underperformance. Portfolio Underperformance in the Investment World. Portfolio Underperformance in the CU World.
A. Why Isn’t My Portfolio Doing Better?

Definition of Underperformance?
Source: Dictionary.com
Source: Investopedia.com

Portfolio Underperformance in the Investment World…You May Have Seen Headline like these:
35
Examples:
Performance Standard: Performance over a benchmark = e.g., 2-YR US Treasury
Consequences: Investors leave and/or Manager is removed (PIMCO-Bill Gross)
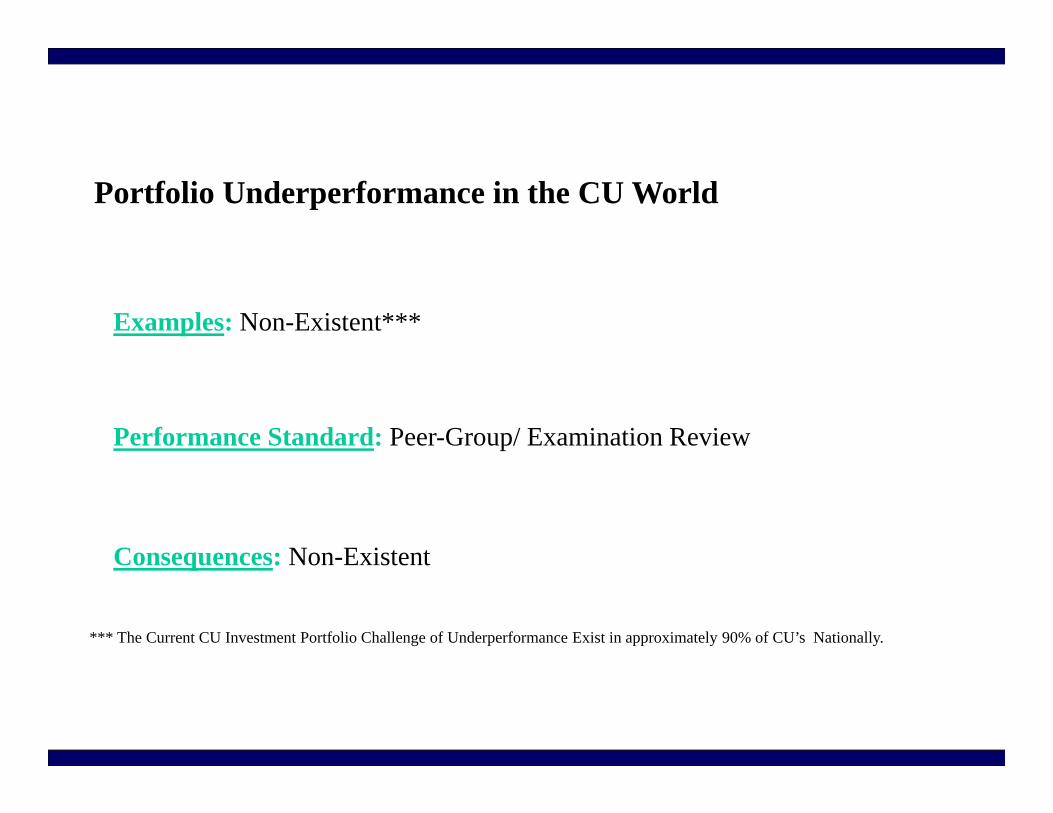
Portfolio Underperformance in the CU World
Examples: Non-Existent***
Consequences: Non-Existent
Performance Standard: Peer-Group/ Examination Review
*** The Current CU Investment Portfolio Challenge of Underperformance Exist in approximately 90% of CU’s Nationally.

But What Are Really the Consequences?
• No reprimand from Management/ BOD• But what about our members… Don’t we owe them a standard?
Let’s Establish a Standard:• We must be GOOD STEWARDS of our Members’ money…
ALL of our Members’ money – not just Members’ money putinto Loans.

Growth Zone
Learning Zone
Fear Zone
Comfort Zone
Feel Safe and in control
“The Comfort Zone”
Lack of Investment Education
Acquire new skills Extend your comfort zone
Members Benefit
Increase Income

Comfort Zone: Recognizing Change is Necessary

• The first thing we teach is to “Understand” in order to “Identify”
• We “Identify” in order to “Adapt”
• We “Adapt” in order to “Overcome”
• Once we “Overcome”, we “Maintain”
• It all stitches together quite nicely in theory, but we can not foolourselves. One must remain thoughtful and diligent in order tologically implement any one of these steps and then cogently usethat step as a building block in order to take down the next.
Managing Portfolio Opportunities and Risk

Understand –Risk and Reward
Identify –Market
Opportunities
Adapt –Policy and Portfolios
Overcome -Inertia
Maintain -Utilizing HTR
Managing Portfolio Opportunities and Risk

The Top Three Mistakes of Investment Portfolio Underperformance in a Falling Rate Environment
42

MISTAKE #1: Too Much Cash in Overnight Account Resulting in Foregone Income for Your CU while Waiting for Rates to Go Up.
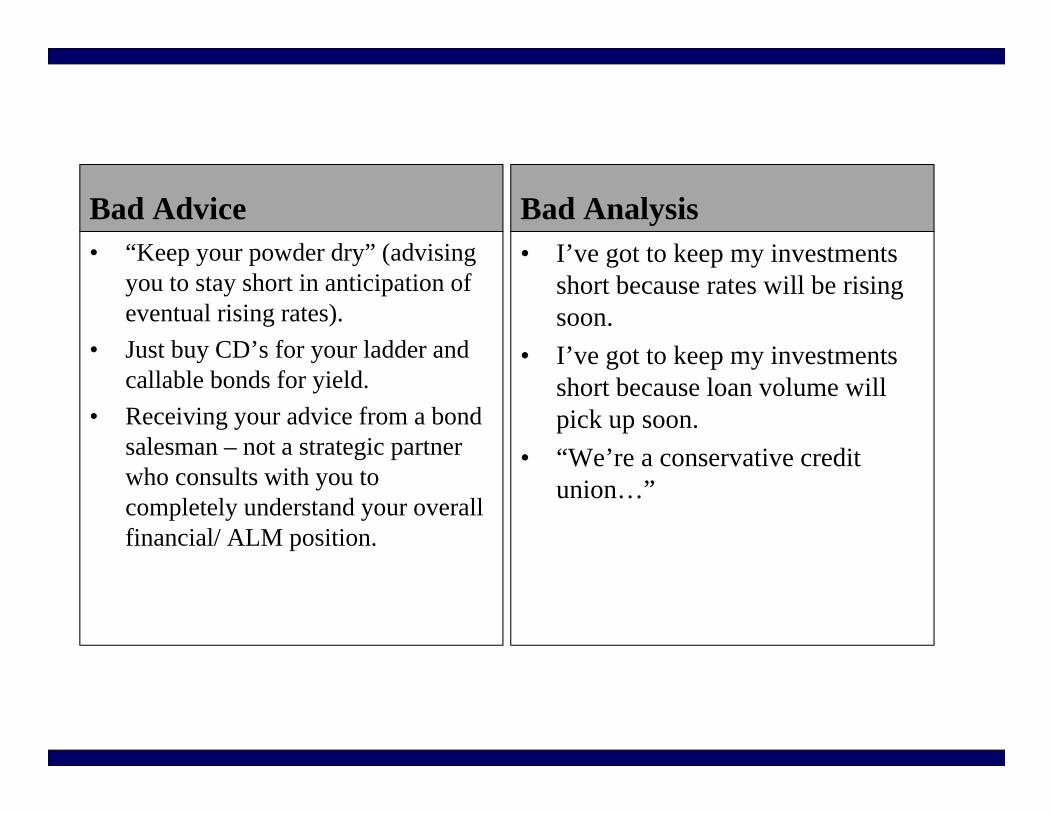
Bad Advice• “Keep your powder dry” (advising
you to stay short in anticipation ofeventual rising rates).
• Just buy CD’s for your ladder andcallable bonds for yield.
• Receiving your advice from a bondsalesman – not a strategic partnerwho consults with you tocompletely understand your overallfinancial/ ALM position.
Bad Analysis• I’ve got to keep my investments
short because rates will be risingsoon.
• I’ve got to keep my investmentsshort because loan volume willpick up soon.
• “We’re a conservative creditunion…”

Fed Funds Target Rate – Since 1999
Source: Bloomberg

How R.O.A. Is Affected By Proper Re-Allocation of Cash – The Cost of “Keeping Your Powder Dry”.
Monthly Annual ROA Affect 2‐YRS 3‐YRS 4‐YRS 5‐YRS0.25% 2,083 25,000 0.025% 50,000 75,000 100,000 125,0000.50% 4,167 50,000 0.050% 100,000 150,000 200,000 250,0000.75% 6,250 75,000 0.075% 150,000 225,000 300,000 375,0001.00% 8,333 100,000 0.100% 200,000 300,000 400,000 500,0001.25% 10,417 125,000 0.125% 250,000 375,000 500,000 625,0001.50% 12,500 150,000 0.150% 300,000 450,000 600,000 750,0001.75% 14,583 175,000 0.175% 350,000 525,000 700,000 875,0002.00% 16,667 200,000 0.200% 400,000 600,000 800,000 1,000,000
Yield Pick Up
Incremental Increase in Investment Income
Yield increase on $10MM of Investments for a CU with $100MM Assets
For illustrative purposes only

Even A Broken Clock Is Right….
2X per Day!

MISTAKE #2: Getting Caught in the “Callable Bond Trap” - Too Much Investing in New Issue Callable Bonds and New Issue Step Up Callable Bonds.

The Callable Bond Trap…
Source: Bloomberg

Good morning <insert client name here>
Take a look at these. Btw, I like this one..!”
The above illustration is for instructional purposes only and is not intended to constitute an offering.
Source: Bloomberg

What Happened? FHLMC 2.625% | 2.5-NC3MO is CALLED in JUL 2019
Source: Bloomberg

Reinvest Called ProceedsNew Issues: 08/01/2019
New Issues: 04/23/2019
46.5 Bps Decline in 3-Months
Source: Bloomberg
Source: Bloomberg

Yield Curve Change Since Original Purchase on 4/23/2019
Source: Bloomberg

Time to Reinvest Again? Our Original 2.625% Coupon is now about to become 1.92%... A Decline of 70.5 Bps!
Source: Bloomberg

Mistake #3Limited Knowledge/ Usage of the CU Investment Universe | Unfamiliarity with Investment Types.
The “ Conservative CU” Mindset Portfolio vs. the “Next Level” CU Portfolio using Strategic Areas of the CU Investment Universe – a Comparative Look at How to Begin to Win for Your CU.

Opportunity Beyond SimpliCD: The Key to Investment Portfolio Outperformance

The CU Investment Universe limits CU’s in the utilization of the “tools” that they can use to generate income from their investment portfolio.
It is essential to work with a strategic partner to learn HOW & WHEN to use those limited tools at the appropriate time depending on the individual CU’s balance sheet structure and the current economic cycle.

Is there Life beyond SimpliCD?
Source: SimpliCD 11/1/19


The Credit D.IOD
.,. _,I,._ ... _� .,,,. __ ..
,· ,.,,.,...,�, ... . �,, ... , ..
_,,;•
· -
niverse of Floating Rate Securities
--• -1-� ... ·-. .... ,
lMO - 3MO RE SET
For Illuslral!ion Purpo-Ses. Only
-·,,..

Educate yourself/align with a strategic partner who will help you understand what is the right approach to outstanding portfolio management?
• Which floating rate alternatives are permissible under §703• How you can realign your portfolio to be ready for changing rates• Which floating rate investments are more advantageous than the
fixed rate investments that you currently hold• The significant positive effects of floating rate investments on:
– Your ALM position– Your future earnings– Your future market value & FAS 115 calculation– Your regulators positive reaction/ view of what you have
strategically accomplishedDoes this sound like the relationship you have with your broker/ advisor?

The “ Conservative CU” Mindset Portfolio vs. the “Next Level” CU Portfolio using Strategic Areas of the CU Investment UniverseA Comparative Look at How to Begin to Win for Your CU.

Conclusion to Mistake #3: Becoming a “Next Level” CU Investor:
• Strategy: Eliminate Brokers Who Over Solicit YourCU and Replace Them With 1 or 2 Firms Who WillEducate You and be a Strategic Partner.
• Reward: Your Increased Knowledge May EmpowerYou To Make Better Decisions With BetterInvestments = Higher Yield = Higher ROA

• Matching strategic opportunities in the Market withopportunistic investment security selection
• Utilizing Investments that are “Pre-Positioned” area Key determinant for “Portfolio Outperformance”
Action: Pre-Positioning for “Future Outlier” Highly Probable Events

What should you do now?

• Is not relying on this:
Strategy and Success
It is based on sound investment strategies refined over120 years of combined Investment Portfolio experience

What is the Value of a Strategy?

Historical Examples of “Pre-Positioned” Investment Strategies (skating to where the puck is going to be)
Bank Notes
WesCorp Floaters
Deeply Discounted Agency CMO Floater
Agency Inverse CMO Floater
Discounted 15yr Agency CMO Support Structure
Deep Discount Agency Callable
SBA Floating Rate Pools
Bank Notes & Discount Agency Callable
Past performance is not indicative of future results. Yields will vary. The above illustrative is forinformational purposes and not intended to reflect the performance of any specific product or investment.
Past performance is not indicative of future results. Yields will vary. The above illustrative is forinformational purposes and not intended to reflect the performance of any specific product or inve

Recent Example of the Value of Strategic Thinking
Purchased Long Term Discounted Callables and 10yr Treasuries
Purchased Long Term Discounted Callables and Longer Term Bank Notes
Purchased Discounted Inverse CMO Floaters
Past performance is not indicative of future results. Yields will vary. The above illustrative is forinformational purposes and not intended to reflect the performance of any specific product or investment.

Some Successful “Next Level” Ideas We Have Utilized
• AUG 2008: Senior Bank Note – Key Bank NA = 10.14%• FEB 2009: Senior Bank Note – Marshall & Ilsley Bank = 15.08%• NOV 2008: Wescorp FCU Floating Rate Note (Senior to Deposits) = 8.89%• APR 2010: Deeply Discounted AGCY CMO Floaters = 4.50% to 7.45%• MAR 2011: Discounted Fixed-Rate 15-YR AGCY CMO (SUP) = 5.84%• NOV 2011: Two-Tiered Index Bond (TTIB) = 5.938%• NOV 2013: AGCY Inverse Floating Rate CMO = 9.66%• JAN 2014: Deep Discounted AGCY Callable = 11.354%• APR 2016: Steeply Discounted Super Floater = 5.598%• NOV 2018: Deep Discounted AGCY Callable = 10.53%• APR 2019: Discounted CMO – Inverse Floater = 19.12% *
* Bond paid-off in OCT 2019… ending return should be higher.
Past performance is not indicative of future results. Yields will vary. The above illustrative is for informational purposes and not intended to reflect the performance of any specific product or investment.

Credit Union Investment Performance as of Q2/2019
Source: Callahan Peer to Peer 6/30/19

Credit Union Investment Performance as of Q2/2019
Source: Callahan Peer to Peer 6/30/19

Top 20% 3.17%
Median2.27%
Bottom 20% 1.82%
Portfolio Composition vs. Yield on Investments
Predominantly Short Term CD ladder
Longer Term CD ladder with some Amortizing Securities
CD Ladder with Larger allocation of Amortizing Securities
Source: Callahan Peer to Peer 6/30/19

• “Dollars don’t lie…” – Dr. Frank J. Fabozzi• HTR vs. TRA
Historical Total Return

Purchase Date Pool Current Face Original Face Coupon Issue Date Maturity Date Security Type Dollars Return
2/27/2019 SBA 510362 1,979,754 0.9898769 2,000,000 6.000 2/1/2019 5/25/2044 SBA FLT 51,908 4.415%
3/26/2019 FHR 4848 QY 1,500,000 SOLD 1,500,000 4.500 11/1/2018 12/15/2048 LOCKOUT 12,379 1.615%
3/26/2019 FNR 2018‐14 TS 390,680 0.3255669 1,200,000 4.374 2/1/2018 3/25/2048 INV, SUP 25,679 8.806%
3/26/2019 GNR 2017‐114 TS 478,350 0.7972498 600,000 4.181 7/20/2017 7/20/2047 INV, SUP 21,128 7.558%
3/28/2019 FFCB 1,000,000 CALLED 8/13/2019 3.000 9/5/2017 9/5/2029 DISC CALL 11,651 2.305%
3/29/2019 GNR 2019‐38 LA 1,259,614 0.8397424 1,500,000 3.000 3/1/2019 3/20/2049 SUPPORT 22,825 3.199%
4/12/2019 COF 1,000,000 NA NA 3.416 1/31/2017 1/30/2023 BKNT 13,781 2.953%
4/15/2019 FNR 2017‐99 YS 0 0.0000000 1,206,080 3.936 11/1/2017 12/25/2047 INV, SUP 64,317 19.128%
4/29/2019 SBA 522546 1,980,153 0.9900765 2,000,000 5.816 4/1/2019 6/25/2044 SBA FLT 41,352 4.956%
4/30/2019 WFC 1,500,000 NA NA 3.000 4/30/2019 4/30/2031 BANK CD 18,986 3.038%
5/17/2019 SBA 522536 1,980,364 0.9901818 2,000,000 6.116 2/1/2019 7/25/2044 SBA FLT 35,953 4.904%
5/31/2019 FNR 2018‐18 KS 539,448 0.9999660 539,466 5.811 2/1/2018 12/25/2046 INV, SUP 6,826 3.796%
5/31/2019 SBA 522546 1,980,153 0.9900765 2,000,000 5.816 4/1/2019 6/25/2044 SBA FLT 32,946 4.974%
5/31/2019 SBA 510362 2,672,668 0.9898769 2,700,000 6.000 2/1/2019 5/25/2044 SBA FLT 46,844 5.246%
6/19/2019 GNR 2013‐22 GA 346,784 0.6935689 500,000 2.500 2/1/2013 10/20/2041 SUPPORT 2,714 2.733%
6/28/2019 GNR 2019‐71 KQ 2,216,950 0.9914801 2,236,000 2.500 6/1/2019 6/20/2049 PAC‐2 14,038 2.471%
7/23/2019 FNR 2018‐87 BS 1,250,369 0.8439293 1,481,604 4.156 11/1/2018 4/25/2048 INV, PAC‐2 8,905 5.101%
7/23/2019 FHR 4905 US 1,956,493 0.9782466 2,000,000 2.969 7/1/2019 8/25/2049 INV, SUP 9,821 4.046%
7/23/2019 SBA 510462 2,991,141 0.9970469 3,000,000 5.825 7/1/2019 9/25/2044 PAC‐2 24,971 4.482%
8/30/2019 SBA 510485 1,996,533 0.9982665 2,000,000 4.825 8/1/2019 8/25/2044 PAC‐2 7,040 #DIV/0!
8/29/2019 SBA 510490 2,496,247 0.9984988 2,500,000 5.825 8/1/2019 7/25/2044 PAC‐2 10,420 9.695%31,515,700 484,484
Source: FIMAC, Bloomberg
2019 Income
Current Face Amount4.887%
Annualized Rate of Return
An Example of an Actual 2019 Investment Strategy in Practice

An Example of an Actual 2019 Investment Strategy in Practice
Purchase Date PoolInterest Accrual
Amort. Exp
Interest Accrual
Amort. Exp
Interest Accrual
Amort. Exp
Interest Accrual
Amort. Exp
Interest Accrual
Amort. Exp
Interest Accrual
Amort. Exp
Interest Accrual
Amort. Exp
Interest Accrual
Amort. Exp
Interest Accrual
Amort. Exp Dollars Return
2/27/2019 SBA 510362 NA NA NA NA NA NA 9,971 ‐1,268 9,957 ‐1,269 9,943 ‐1,271 9,928 ‐1,272 9,913 ‐1,303 9,899 ‐1,320 51,908 4.415%
3/26/2019 FHR 4848 QY NA NA NA NA NA NA 5,625 ‐5,694 5,625 ‐1,146 5,625 ‐2,649 5,625 ‐2,747 3,563 ‐1,448 SOLD SOLD 12,379 1.615%
3/26/2019 FNR 2018‐14 TS NA NA NA NA NA NA 1,544 4,047 1,438 2,183 1,468 832 1,469 1,646 1,380 2,956 1,414 5,302 25,679 8.806%
3/26/2019 GNR 2017‐114 TS NA NA NA NA NA NA 1,122 2,022 1,124 1,247 1,182 638 1,259 3,578 1,400 1,378 1,513 4,664 21,128 7.558%
3/28/2019 FFCB NA NA NA NA NA NA 2,750 34 2,500 34 2,500 34 2,500 34 1,250 17 CALL CALL 11,651 2.305%
3/29/2019 GNR 2019‐38 LA NA NA NA NA NA NA 3,750 29 3,680 176 3,676 19 3,585 234 3,449 348 3,149 730 22,825 3.199%
4/12/2019 COF NA NA NA NA NA NA NA NA 3,214 ‐521 3,111 ‐504 3,197 521 2,941 ‐521 2,846 ‐504 13,781 2.953%
4/15/2019 FNR 2017‐99 YS NA NA NA NA NA NA NA NA 1,941 6,681 1,788 5,541 1,701 12,774 1,521 7,839 322 24,208 64,317 19.128%
4/29/2019 SBA 522546 NA NA NA NA NA NA NA NA 9,681 ‐1,243 9,665 ‐1,243 9,650 ‐1,244 9,612 ‐1,651 9,597 ‐1,473 41,352 4.956%
4/30/2019 WFC NA NA NA NA NA NA NA NA 3,945 0 3,699 0 3,822 0 3,822 0 3,699 0 18,986 3.038%
5/17/2019 SBA 522536 NA NA NA NA NA NA NA NA NA NA 10,137 ‐1,107 10,121 ‐1,109 10,108 ‐1,137 10,093 ‐1,152 35,953 4.904%
5/31/2019 FNR 2018‐18 KS NA NA NA NA NA NA NA NA NA NA 1,387 68 1,510 35 1,612 35 2,078 101 6,826 3.796%
5/31/2019 SBA 522546 NA NA NA NA NA NA NA NA NA NA 9,665 ‐1,236 9,650 ‐1,237 9,612 ‐1,641 9,597 ‐1,464 32,946 4.974%
5/31/2019 SBA 510362 NA NA NA NA NA NA NA NA NA NA 13,425 ‐1,657 13,406 ‐1,659 13,386 ‐1,700 13,366 ‐1,722 46,844 5.246%
6/19/2019 GNR 2013‐22 GA NA NA NA NA NA NA NA NA NA NA NA NA 747 187 743 120 722 194 2,714 2.733%
6/28/2019 GNR 2019‐71 KQ NA NA NA NA NA NA NA NA NA NA NA NA 4,647 40 4,630 60 4,619 42 14,038 2.471%
7/23/2019 FNR 2018‐87 BS NA NA NA NA NA NA NA NA NA NA NA NA NA NA 4,404 20 4,398 83 8,905 5.101%
7/23/2019 FHR 4905 US NA NA NA NA NA NA NA NA NA NA NA NA NA NA 4,273 939 4,517 92 9,821 4.046%
7/23/2019 SBA 510462 NA NA NA NA NA NA NA NA NA NA NA NA NA NA 14,541 ‐2,020 14,520 ‐2,069 24,971 4.482%
8/30/2019 SBA 510485 NA NA NA NA NA NA NA NA NA NA NA NA NA NA NA NA 8,028 ‐987 7,040 #DIV/0!
8/29/2019 SBA 510490 NA NA NA NA NA NA NA NA NA NA NA NA NA NA NA NA 12,117 ‐1,697 10,420 9.695%0 0 0 0 0 0 24,763 ‐831 43,106 6,141 77,269 ‐2,534 82,816 9,781 102,160 2,291 116,493 23,027 484,484
Source: FIMAC, Bloomberg
Jul‐19
22,144,4175.018%
2019 IncomeSep‐19
30,793,4095.437%
Current Face Amount 11,725,698
Jan‐19 Feb‐19 Mar‐19 Apr‐19 May‐19 Jun‐19
4.887%Annualized Rate of Return 0.000% 0.000% 0.000% 3.964% 5.040% 4.529%
19,801,716
Aug‐19
27,245,2604.600%
7,243,758

• CD ladders are Optimal for Liquidity Management, howeverthe Opportunity Cost to the Credit Union and its Members canbe high
• Utilize Strategically placed Amortizing and Floating RateInvestments in order to De-Risk your Balance Sheet ANDIncrease your Interest Income
• Harnessing the Power of Historical Total Return in Managingyour Portfolio by replacing your Underperforminginvestments with Performing investments
Action: Moving from Static to Dynamic Portfolio Management

Safety – Liquidity – Yield was/is a misunderstood truth…Safety – YIELD – Liquidity reflects reality!
• Ignoring Safety is rarely encountered in a properlymanaged investment portfolio
• A properly managed investment portfolio tailoredwithin your ALM parameters & coupled with yourexisting lines of credit mitigate your liquidity risks
• As always…YIELD is Truth!
Veritas

The Impact of Increasing Yield Monthly Annual ROA Impact 2‐YRS 3‐YRS 4‐YRS 5‐YRS
25,000,000 0.50% 10,417 125,000 0.050% 250,000 375,000 500,000 625,00025,000,000 0.75% 15,625 187,500 0.075% 375,000 562,500 750,000 937,50025,000,000 1.00% 20,833 250,000 0.100% 500,000 750,000 1,000,000 1,250,00025,000,000 1.25% 26,042 312,500 0.125% 625,000 937,500 1,250,000 1,562,50025,000,000 1.50% 31,250 375,000 0.150% 750,000 1,125,000 1,500,000 1,875,00025,000,000 1.50% 31,250 375,000 0.150% 750,000 1,125,000 1,500,000 1,875,00025,000,000 1.75% 36,458 437,500 0.175% 875,000 1,312,500 1,750,000 2,187,50025,000,000 2.00% 41,667 500,000 0.200% 1,000,000 1,500,000 2,000,000 2,500,000
Amount InvestedYield
IncreaseIncremental Increase in Investment Income
Monthly Annual ROA Impact 2‐YRS 3‐YRS 4‐YRS 5‐YRS50,000,000 0.50% 20,833 250,000 0.100% 500,000 750,000 1,000,000 1,250,00050,000,000 0.75% 31,250 375,000 0.150% 750,000 1,125,000 1,500,000 1,875,00050,000,000 1.00% 41,667 500,000 0.200% 1,000,000 1,500,000 2,000,000 2,500,00050,000,000 1.25% 52,083 625,000 0.250% 1,250,000 1,875,000 2,500,000 3,125,00050,000,000 1.50% 62,500 750,000 0.300% 1,500,000 2,250,000 3,000,000 3,750,00050,000,000 1.50% 62,500 750,000 0.300% 1,500,000 2,250,000 3,000,000 3,750,00050,000,000 1.75% 72,917 875,000 0.350% 1,750,000 2,625,000 3,500,000 4,375,00050,000,000 2.00% 83,333 1,000,000 0.400% 2,000,000 3,000,000 4,000,000 5,000,000
Amount InvestedYield
IncreaseIncremental Increase in Investment Income
***Hypothetical calculation based on a $250MM Total Asset level

Skating to where the puck will be…If you would like us to perform a Historical Total Return analysis for your Credit Union or you would like to understand more about our current Investment Strategies for our clients –Please visit us at our Exhibit Booth or you can call or email…
Tobias Timm, Director(517) 333 -7791 | [email protected] Credit Union Investment Strategy Group of Oppenheimer & Co. Inc.

The securities mentioned in this commentary may not be suitable for all types of investors. It does not take into account the investment objectives, financial situation or specific needs of any particular client of Oppenheimer. Recipients should consider the commentary as only a single factor in making an investment decision and should not rely solely on its content as a substitution for the exercise of independent judgment of the merits and risks of investments. No representation or warranty, express or implied, is made regarding future performance of any security mentioned in this commentary. The price of the securities mentioned in this commentary and the income they may produce may fluctuate and/or be adversely affected by market variables, and investors may realize losses on investments in such securities, including the loss of investment principal.
The information and statistical data contained herein have been obtained from sources which we believe to be reliable. Past performance is not indicative of future results and we do not undertake to advise you as to any change in figures or our views. Oppenheimer & Co. Inc. (“Oppenheimer”), including any of its affiliates, officers or employees, does not provide legal or tax advice.
© 2019 Oppenheimer & Co. Inc. Transacts Business on All Principal Exchanges and Member SIPC. 2786485.1
Important Disclosures