Embed Size (px)
Citation preview
PREPARATION AND SHELF LIFE STUDY OF HIGH
ENERGY BISCUITS
by
ANUJ NIROULA
Food Technology Instruction Committee
Institute of Science and Technology
Tribhuvan University, Nepal
2012

ii
Preparation and Shelf life Study of High Energy Biscuits
A dissertation submitted to the Food Technology Instruction Committee
in Tribhuvan University in partial fulfillment of the requirements
for the degree of B.Tech. in Food Technology
by
Anuj Niroula
Food Technology Instruction Committee
Institute of Science and Technology
Tribhuvan University
Dharan, Hattisar, Nepal
2012
iii
Tribhuvan University
Institute of Science and Technology
Food Technology Instruction Committee
Central Campus of Technology, Dharan
Approval Letter
This dissertation entitled Preparation and shelf life study of High Energy Biscuits
presented by Anuj Niroula has been accepted as the partial fulfillment of the
requirements for the B. Tech. in Food Technology.
Dissertation Committee
1. Chairperson __________________________
(Assoc. Prof. Basanta K. Rai)
2. External Examiner _________________________
(Dr. Atul Upadhyay)
3. Supervisor __________________________
(Assoc. Prof. Pashupati Mishra)
Date: 17 April, 2012

iv
Acknowledgement
It gives me great pleasure to express my thanks and heartfelt gratitude to my guide, Mr.
Pashupati Mishra, Assoc. prof., CCT, Dharan for his valuable guidance, continuous
encouragement and critical worthy suggestions without which this investigation work entitled
“Preparation and shelf life study of high energy biscuits” would not have been possible.
I sincerely thank Assoc. prof. Mr. Pashupati Mishra, Assistant Dean/Campus chief, CCT, Mr.
Shyam Kumar Mishra (Lecturer and Asst. Campus Chief, CCT, Dharan), Mr. Dhan Bahadur
Karki (H.O.D, Central Dept. of Food Technology, CCT, Dharan) and Mr. Basanta Kumar rai
(Chairperson, Food Technology Instruction Committee) for providing me the opportunity and
facilities to undertake this work.
I would like to express my sense of gratitude to Mr, Homnath Neupane, Mr, Rajendra
Bhattarai and Mr. Santosh Devkota NEBICO Pvt. Ltd, Balaju Industrial District, Kathmandu
for providing me with necessary guidance. I am extremely grateful to members of the
NEBICO Pvt. Ltd, for constant encouragement and help.
I am indebted to M/s Rama Subba Nutritionist, Nepal Army and Praksha Neupane senior food
technologist for providing me with necessary guidance.
I would like to extend my sincere thanks to Prashant Raj Pokheral, Roshan Budhathoki, all my
friends, my classmates, and one and all who have led me to successful completion of this
work.
Finally, I am highly indebted to Almighty for all his blessings, my beloved parents and my
brother for their constant motivation, encouragement and inspiration, without which this
investigation work would not have seen the light of day.
………………………
Anuj Niroula
Tribhuvan University
Institute of Science and Technology
Central Campus of Technology
Hattisar, Dharan, Nepal
2012

v
List of abbrevations
ANOVA Analysis of Variance
BHA Butylated hydroxyanisole
BHT Butylatedhydroxyltoluene
BOPP Biaxial oriented Polypropylene
CCT Central Campus of Technology
EDTA Ethylenediamine Tetraacetic Acid
EMOPs Emergency Operations
FAO Food and Agriculture Organisation
GMO Genetically Modified Organisms
GMP Good Manufacturing Practice
GMS Glycerol Mono Sterate
HDPE High Density Polyethylene
HEB High Energy Biscuit
IDD Iodine Defficiency Disorders
IR-EMOPs Immediate Response Emergency Operations
LACERN Latin American and Caribbean Emergency Response Network
LDPE Low Density Polyethylene
NARC Nepal Agricultural Research Council
NBS Nepal Bureau of Standards
NGA Nordihydro Guaiaretic acid
PG Propyl gallate
PRROs Protracted Relief and Recovery Operations
SMBS Sodium Meta Bi Sulphite
SMP Skimmed Milk Powder
WFP World Food Program
WHO World Health Organisation

vi
List of Figures and Tables
List of Figures
Fig. 2.1 Flow sheet of manufacturing process of biscuit ......................................................... 22
Fig. 3.1 Flow chart for the production of biscuit ..................................................................... 55
Fig. 4.1 Average sensory score for six different formulas ...................................................... 60
Fig. 4.2 Changes in acid value during storage ......................................................................... 65
Fig. 4.3 Changes in peroxide value during storage ................................................................. 66
Fig. 4.4 Changes in color during storage at 40ºC temperature ................................................ 67
Fig. 4.5 Changes in flavor during storage at 40ºC temperature .............................................. 68
Fig. 4.6 Changes in texture during storage at room temperature. ........................................... 69
Fig. 4.7 Changes in crispness during storage at 40ºC temperature ......................................... 69
Fig. 4.8 Changes in taste during storage at 40ºC temperature ................................................. 70
Fig. 4.9 Changes in overall acceptability during storage at 40ºC temperature. ...................... 71
List of Tables
Table 2.1 Chemical composition of biscuit ................................................................................. 9
Table 2.2 Protein specification for various flours .................................................................. 11
Table 2.3 Requirements for flour characteristics.................................................................... 12
Table 2.4 The mandatory standard for biscuits ....................................................................... 20
Table 2.5 Nutritive value of biscuit (values per 100 g) .......................................................... 21
Table 2.6 Temperature related changes in biscuit during baking ............................................ 28
Table 2.7(a) Nutritional value in HEB per 100g. .................................................................... 31
Table 2.7(b) Micronutrient rate and chemical form ................................................................ 31
Table 2.8 Limit of microorganisms in HEB ............................................................................ 32
Table 2.9 Safety parameters .................................................................................................... 32
Table 2.10 Some characteristics of packaging materials ......................................................... 45
Table 2.11 Moisture barrier properties of some important materials. ..................................... 46
Table 2.12 Thermoplastics in packaging ................................................................................. 47
Table 3.1 Recipe formulation for High Energy Biscuit .......................................................... 53
Table 3.2 Baking temperature profile of the oven ................................................................... 54
Table 4.1 Proximate composition of wheat and soy flour ....................................................... 59

vii
Table 4.2 Analysis result of HEB. ........................................................................................... 63
Table 4.3 Microbiological assay of the products ..................................................................... 64
Table B.1.1 Two way ANOVA (no blocking) for color ......................................................... 84
Table B.1.2 LSD for color ....................................................................................................... 84
Table B.1.3 Two way ANOVA (no blocking) for for crispness ............................................. 84
Table B.1.4 LSD for crispness................................................................................................. 85
Table B.1.5 Two way ANOVA (no blocking) for flavor ........................................................ 85
Table B.1.6 LSD for flavor ..................................................................................................... 85
Table B.1.7 Two way ANOVA (no blocking) for taste .......................................................... 86
Table B.1.8 LSD for taste ........................................................................................................ 86
Table B.1.9 Two way ANOVA (no blocking) for texture ...................................................... 86
Table B.1.10 LSD for texture .................................................................................................. 87
Table B.1.11 Two way ANOVA (no blocking) for overall acceptability ............................... 87
Table B.1.12 LSD for overall acceptability ............................................................................. 87
Table C.1.1 Two way ANOVA (no blocking) for AV ............................................................ 88
Table C.1.2 Two way ANOVA (no blocking) for PV ............................................................ 88
Table C.1.3 Two way ANOVA (no blocking) for color ......................................................... 88
Table C.1.4 Two way ANOVA (no blocking) for flavor ........................................................ 89
Table C.1.5 Two way ANOVA (no blocking) for texture ...................................................... 89
Table C.1.6 Two way ANOVA (no blocking) for crispness ................................................... 89
Table C.1.7 Two way ANOVA (no blocking) for taste .......................................................... 90
Table C.1.8 Two way ANOVA (no blocking) for overall acceptance .................................... 90
Table C.1.9 Average sensory score for sample packed in P1 (laminate PET + BOPP) .......... 90
Table C.1.10 Average sensory score for sample packed in P2 (laminate PET + metallic
BOPP) ........................................................................................................................................ 91
Table D Cost calculation of the product (Formula C). ............................................................. 92

viii
Abstract
High Energy Biscuits (HEB) is small baked bread or cakes that are supplemented with a
premix of vitamins and minerals. HEB was prepared with 0, 5, 10, 15, 20 and 25 parts of soy
flour with wheat flour to access the quality and acceptability of the biscuit. Thus prepared
biscuits were subjected for sensory evaluation. The data obtained were statistically analyzed
using two way ANOVA (no blocking) at 5% level of significance which showed there exists
significant difference (P ≤ 0.05) in overall acceptability among the samples. Sample C (wheat
flour: soy flour :: 90:10) got the highest mean sensory score. The best ratio i.e. sample C was
used for final preparation of biscuits and thus prepared biscuits were packaged in P1 (laminate
PET + BOPP) and P2 (laminate PET + metallic BOPP) and stored at 40˚C. The samples were
subjected for sensory analysis and chemical analysis in every two weeks for 12 weeks. There
was no significant difference (F pr.>0.05) in mean sensory score of samples at the zero week
and last week for the color, flavor, crispness and taste of the biscuit with respect to the
packaging material, while the texture and overall appearance were found to have significant
difference (F pr.<0.05). The samples showed significant difference (Fpr.<0.05) in all sensory
parameters with respect to the time of storage. The acid value (AV), showed no significant
difference between the consecutive studies although initial value of 0.12 and the final 0.29 and
0.35 for laminate PET + BOPP and laminate PET + metallic BOPP respectively were different
significantly. The peroxide value (PV) showed significant difference after 4 weeks. The final
12 weeks values of AV, and PV were found to be 0.29 and 0.35 mg KOH/ gm oil in laminate
PET + BOPP and laminate PET + metallic BOPP respectively where as 1.18 and 1.4 meqv
peroxide/kg fat in laminate PET + BOPP and laminate PET + metallic BOPP respectively
which was below the standard unacceptable level. The self-life study through the rate of
increment of acid value and peroxide value, storage life up to 11.5 months and 15.5 months at
40˚C was determined for sample P1 (laminate PET + BOPP) and P2 (laminate PET + metallic
BOPP) respectively. Thus soy flour can be successfully used up to 10 parts with wheat flour.
The iron, magnesium, calcium and ascorbic acid content were higher than specified by WFP.

ix
Table of Contents
Approval Letter ....................................................................................................................... iii
Acknowledgement..................................................................................................................... iv
List of abbrevations ................................................................................................................... v
Abstract .................................................................................................................................. viii
Introduction ............................................................................................................................... 1
1.1 General introduction ........................................................................................................ 1
1.2 Objective of the study ................................................................................................... 2
1.2.1 General objective....................................................................................................... 2
1.2.2 Specific objective ...................................................................................................... 2
1.3 Justification of the work ............................................................................................... 2
1.4 Importance .................................................................................................................... 3
1.5 Limitations of the study ................................................................................................ 4
Literature review ....................................................................................................................... 5
2.1 Biscuits ............................................................................................................................. 5
2.2 Classification of biscuits .................................................................................................. 6
2.2.1 Soft dough biscuits .................................................................................................... 6
2.2.2 Hard dough biscuits ............................................................................................... 7
2.3 Types of biscuits .............................................................................................................. 8
2.3.1 Cream crackers .......................................................................................................... 8
2.3.2 Soda crackers............................................................................................................. 8
2.3.3 Savory crackers ......................................................................................................... 8
2.3.4 Water biscuits and matzos ......................................................................................... 8
2.3.5 Puff biscuits ............................................................................................................... 8
2.3.6 Short dough biscuits .................................................................................................. 9
2.3.7 Deposited soft dough and sponge drop biscuits ........................................................ 9
2.3.8 Wafers ....................................................................................................................... 9
2.3.9 Miscellaneous biscuit-like products .......................................................................... 9

x
2.4 Chemical composition of biscuits .................................................................................... 9
2.5 Raw materials for biscuit making .................................................................................. 10
2.5.1 Major ingredients ...................................................................................................... 10
2.5.2 The minor ingredients ............................................................................................. 16
2.6 General and mandatory requirements of biscuits as published by NBS ........................ 20
2.7 Nutritive value of biscuit ............................................................................................... 20
2.8 Technology involved during biscuit making ................................................................. 21
2.8.1 Preparation of Ingredients ....................................................................................... 22
2.8.2 Metering of ingredients ........................................................................................... 23
2.8.3 Dough mixing .......................................................................................................... 23
2.8.4 Laying of dough ...................................................................................................... 25
2.8.5 Forming and performing ......................................................................................... 25
2.8.6 Baking ..................................................................................................................... 27
2.8.7 Cooling .................................................................................................................... 29
2.8.8 Secondary processing .............................................................................................. 29
2.8.9 Packaging ................................................................................................................ 30
2.8.10 Sensory perception of biscuits............................................................................... 30
2.9 Product specifications of High energy biscuits .............................................................. 31
2.9.1 Nutritional and micronutrient value: ....................................................................... 31
2.10 Raw materials specifications for HEB ..................................................................... 33
2.11 Packaging of HEB .................................................................................................... 34
2.12 Marking specification of HEB ................................................................................. 35
2.13 Supplementation in HEB ............................................................................................. 35
2.14 Packaging ..................................................................................................................... 44
2.14.2 Types of container ................................................................................................. 45
2.14.3 Special feature required for biscuit packing .......................................................... 45
2.14.4 Plastics as packaging materials ............................................................................. 46
2.14.5 Selection of proper packaging materials ............................................................... 49
xi
2.14.6 Safety of food packaging ...................................................................................... 50
2.15 Shelf-life determination .............................................................................................. 50
Materials and methods ............................................................................................................ 52
3.1 Raw Materials ................................................................................................................ 52
3.1.1 Basis of formulation ................................................................................................ 52
3.1.2 Calculation of amounts of ingredients ................................................................. 52
3.2 Method of preparation ................................................................................................... 53
3.3 Evaluation of prepared HEB .......................................................................................... 56
3.3.1 Sensory evaluation .................................................................................................. 56
3.3.2 Physiochemical analysis of product. ....................................................................... 56
3.3.3 Evaluation of microbiological quality ..................................................................... 57
3.3.5 Shelf life prediction ................................................................................................. 57
3.4 Cost calculation .............................................................................................................. 58
3.5 Data analysis .................................................................................................................. 58
Results and discussion ............................................................................................................. 59
4.1 Organoleptic quality of the products ............................................................................. 59
4.1.1 Color ........................................................................................................................ 60
4.1.2 Flavor ...................................................................................................................... 61
4.1.3 Texture .................................................................................................................... 61
4.1.4 Crispness ................................................................................................................. 61
4.1.5 Taste ........................................................................................................................ 62
4.1.6 Overall acceptability ............................................................................................... 62
4.2 Analysis of the best product ........................................................................................... 63
4.3 Microbiological quality of product ................................................................................ 63
4.4 Conformance of best product with WFP specification .................................................. 64
4.5 Shelf life evaluation of the HEB .................................................................................... 64
4.5.1 Changes in acid value .............................................................................................. 64
4.5.2 Changes in peroxide value ...................................................................................... 65

xii
4.6 Rate of increase in the AV and PV and the projected shelf life .................................... 71
4.7 Cost of product ............................................................................................................... 72
Conclusions and recommendations ....................................................................................... 73
5.1 Conclusion ..................................................................................................................... 73
5.2 Recommendations .......................................................................................................... 73
Summary .................................................................................................................................. 74
References ................................................................................................................................ 76
Appendices ............................................................................................................................... 83
Appendix-A ............................................................................................................................... 83
Appendix-B ............................................................................................................................... 84
Appendix C ................................................................................................................................ 88
Appendix-D ............................................................................................................................... 92

PART I
Introduction
1.1 General introduction
Food is essential for human beings. People have different taste of foods and different food
habits depending upon their religion, ethnic, geographical, climatic, seasonal, educational,
economical, rural and urban situations (K.C., 2007). Baking is one of the oldest arts which has
a long history and undoubtedly has a long future. It is hard to imagine a world evolving in
which bakery does not play a part (Cauvain, 2003). Biscuit is kind of crispy dry bread, more or
less hard, variously flavored and usually unleavened, prepared usually in small, flat, thin cakes
(Smith, 1972).
Biscuits and biscuit like products have been made and eaten by man for hundreds of years
(Tannahill, 1975). Biscuits are a traditional type of flour confectionery which were, and can
still be, made and baked in a domestic kitchen. They are small baked products made
principally from flour, sugar and fat. They typically have a moisture content of less than 4%
and when packaged in moisture proof containers have a long shelf life, perhaps six months or
more (Manley, 1983).
During ancient days Biscuit was one of the best and most suitable foods to be carried along
during long voyages especially due to its higher shelf life and nutritive value. Those biscuits
were called as ship‟s Biscuit; Walker‟s dictionary (London, 1848) defines: „Biscuit is a kind of
hard, dry bread, made to be carried to sea as a substitute of bread; it is a composition of fine
flour, almonds and sugar.‟ Based upon these old themes, biscuits have gone through various
modifications through new trials till this date. Nowadays various ranges of biscuits with
distinct identical qualities and composition are found in the market. Biscuits are the low cost,
processed food which offers good taste along with nutritional values at affordable price with
convenient availability. Biscuits have in general, a good shelf life in comparison to most of the
other snack items. Hence, it‟s obvious that it is convenient to be used as a travel snacks item
(Shrestha, 1995).
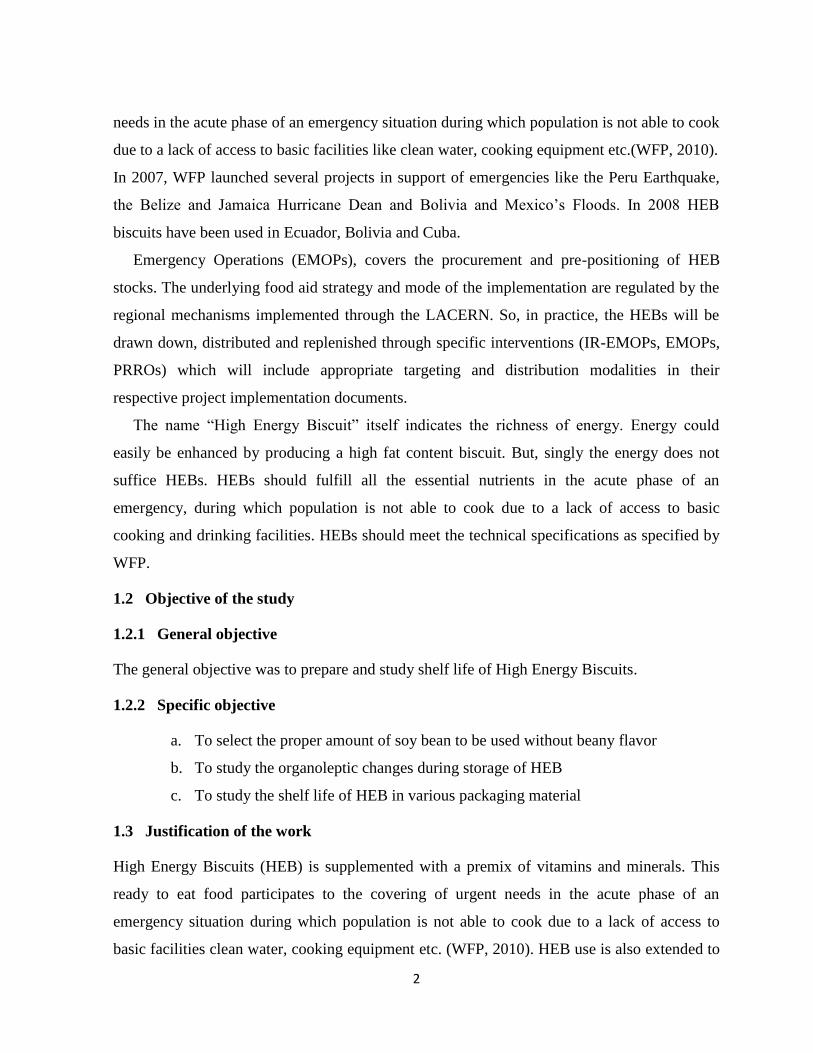
High Energy Biscuits (HEB) is small baked bread or cakes that are supplemented with a
premix of vitamins and minerals. This ready to eat food participates to the covering of urgent
2
needs in the acute phase of an emergency situation during which population is not able to cook
due to a lack of access to basic facilities like clean water, cooking equipment etc.(WFP, 2010).
In 2007, WFP launched several projects in support of emergencies like the Peru Earthquake,
the Belize and Jamaica Hurricane Dean and Bolivia and Mexico‟s Floods. In 2008 HEB
biscuits have been used in Ecuador, Bolivia and Cuba.
Emergency Operations (EMOPs), covers the procurement and pre-positioning of HEB
stocks. The underlying food aid strategy and mode of the implementation are regulated by the
regional mechanisms implemented through the LACERN. So, in practice, the HEBs will be
drawn down, distributed and replenished through specific interventions (IR-EMOPs, EMOPs,
PRROs) which will include appropriate targeting and distribution modalities in their
respective project implementation documents.
The name “High Energy Biscuit” itself indicates the richness of energy. Energy could
easily be enhanced by producing a high fat content biscuit. But, singly the energy does not
suffice HEBs. HEBs should fulfill all the essential nutrients in the acute phase of an
emergency, during which population is not able to cook due to a lack of access to basic
cooking and drinking facilities. HEBs should meet the technical specifications as specified by
WFP.
1.2 Objective of the study
1.2.1 General objective
The general objective was to prepare and study shelf life of High Energy Biscuits.
1.2.2 Specific objective
a. To select the proper amount of soy bean to be used without beany flavor
b. To study the organoleptic changes during storage of HEB
c. To study the shelf life of HEB in various packaging material
1.3 Justification of the work
High Energy Biscuits (HEB) is supplemented with a premix of vitamins and minerals. This
ready to eat food participates to the covering of urgent needs in the acute phase of an
emergency situation during which population is not able to cook due to a lack of access to
basic facilities clean water, cooking equipment etc. (WFP, 2010). HEB use is also extended to
3
a complement food ration i.e. use as snacks to provide vitamins and minerals in
regions/population where diet is subjected to nutritional deficiencies. HEB can be used also to
prevent micronutrients deficiency of young children and school age children.
However, in Nepal, it is considered as the brand product for army and very little is learned
about it by the consumers. There has been lot of controversy in Nepal regarding high energy
biscuit and its micronutrient content and energy value. According to Subba R. (Nutritionist,
Nepal Army), the armies, who are the daily consumers of High energy biscuit are monotonous
of the only beany flavored biscuit produced till in Nepal. So a variety of flavor in HEB is also
the present need. It is also noticed to have soya-bean off flavor during its storage and the shelf
life is not attained as much as High energy biscuit should have (Personal communication,
2011).
This research was aimed in these two prospects. Soy bean flour was variably used with
wheat flour to fulfill the 100 parts of flour, and Butter DRS flavor was used to prepare the
high energy biscuit. These biscuits after sensory evaluation to various persons of Nepal Army,
a best recipe was finalized and necessary analysis was carried out and packaged in two
different wrappers i.e. P1 (laminate PET + BOPP) and P2 (laminate PET + metallic BOPP).
These biscuits were analyzed in every 15 days for 3 months and the shelf life was then
forecasted.
1.4 Importance
a. A new flavored high energy biscuit was prepared, that was acceptable to the daily
users.
b. The shelf life of HEB was forecasted in two different types of wrappers.
c. It provides a duly information about the HEB, which is not known clearly by
consumers.

4
1.5 Limitations of the study
a. Microbial analysis of the product other than total plate count and yeast and mold count
could not be carried out due to time constraints.
b. The shelf life and changes in the biscuit during storage could be studied only up to 6
months due to time constraints.
c. The vitamins content in the biscuit after baking could not be analyzed. But use of
vitamin premix as prescribed by producer for HEB to achieve desired result was
followed.

PART II
Literature review
2.1 Biscuits
The word „biscuit‟ is derived from the Latin „biscoctus‟ or old French „bescoit‟ word (Concise
Oxford Dictionary, 1975), meaning twice cooked, a reference to the practice of first baking the
product in hot oven and then transferring it to a cooler oven to complete drying process.
Biscuits are very popular item prepared on regular basis and these too vary in size, shape,
filling and type of recipe used. While they are simple to make, they require care, attention and
understanding necessary to produce a standard product (Sultan, 1965).
Generally the term biscuit is used in the European countries and cookies in the USA.
Biscuits and biscuit like products have been made and eaten by man for centuries (Hosney,
1986). Biscuits are ideal for nutrient availability, palatability, compactness and convenience.
They differ from other baked products like bread and cakes because of having low moisture
content, comparatively free from microbial spoilage and long shelf life of the product (Wade
and Peter, 1988).
Although the first biscuits were dried-out rusks, useful as long-life food for sea journeys,
early cooks making confections with fat and sugar would have found that if little dough pieces
are baked in a typical hot oven and taken out when they have a good color and a stable
structure they would not have been dry enough to be entirely crisp. Putting them back into a
somewhat cooler oven to dry them out improved their eating qualities and also their shelf life.
Baking from the start in a cooler oven for a longer period allows drying but results in less
coloration and structure development. However, the term biscuit was applied originally to
dried bread pieces. These were also sweetened and flavored with spices. Other products like
our modern biscuits were made but called by more cake-like names for example: shortcake
and shortbread etc. (Manley, 2000).
Now biscuits are made mostly in factories on large production plants. These plants are
large and complex and involve considerable mechanical sophistication. Forming, baking and
packing are largely continuous operations but metering ingredients and dough mixing are
typically done in batches (Manley, 1998).
6
All flour confectionery is developed from human skills in baking and very much research
has been directed to improving our knowledge of the science of what happens when flour is
hydrated, mixed with other materials and baked. It is this research that has been the main
driving force in the development of the biscuit industry. It is therefore correct to say that
without science there is no innovation and without innovation there is no competitiveness
(Manley, 2000).
2.2 Classification of biscuits
Biscuits are generally classified as hard dough and soft dough type of biscuits as per the
protein composition of the flour used. In case of the hard dough biscuits the flour used should
be the weakest possible to obtain and vice versa in case of soft dough biscuit (Smith, 1972).
The soft dough group comprises all the sweet biscuits having many factors in common
whereas the hard dough biscuits fall naturally into three sections: fermented dough, puff dough
and the semi-sweet dough (Whitely, 1971).
2.2.1 Soft dough biscuits
Soft dough biscuits are generally sweet, thin and possess smooth surface with dimensions that
are much more regular and consistence than the hard dough biscuits. Generally they contain
higher fat content (20%-35%) and sugar (30%-45%) and are low in moisture. The higher
gluten network development should be avoided which can be achieved by:
a) Weak flour
b) Lower moisture content
c) Short mixing time
d) Less aerating agents
Soft dough biscuits are less versatile because of the inherent nature of the dough. (Manley,
1983).
7
2.2.2 Hard dough biscuits
Hard dough biscuits generally contain less fat (10%-20%) and low sugar content (10%-18%).
The dough adheres due to its higher water content and relatively lower fat content. This type
of formulation produces an extensive gluten structure. The long mixing time develops the
gluten and the mixer action stretches and orients the gluten strands to a point where much of
the elasticity is destroyed. The water content varies in accordance with the flour strength,
which might be as high as 20% of the flour weight (George, 1981). Further according to the
variance in composition of one or more parameters hard dough biscuits can be further divided
into:
2.2.2.1 Semi sweet biscuits
The flour used in this type of biscuits should be as weak as possible. Its higher water content
and relatively low amount of sugar and fat produces an extensive gluten system and structure.
Many flour formulations contain cornstarch or arrowroot to an extent of 10% of the flour
weight in order to weaken the flour strength. Further to prevent excessive gluten development,
a long mixing time followed by addition of sodium meta bi sulphite is carried out. Rapid
cooling should be avoided as these types of biscuits are highly susceptible to checking (Dunn
and Bailey, 1988).
2.2.2.2 Fermented dough biscuits
This type of biscuits include two groups the cream crackers and the soda crackers. Although
these two types have variations within them in case of composition and process of
manufacture, both of them have basic mode of production as fermentation. Studies show that
the manufacture process of salt crackers is standardized whereas a lot of variations might be
seen in the manufacture process of cream crackers. Ingredients commonly include flour of
medium strength, protein (9.0-9.5) % , shortenings 12% for cream crackers to 14% for salt
crackers, sugar basically is used as yeast food only, salt (2-3)%, malt for rapid fermentation
due to its diastase activating effect (Smith, 1972).
2.2.2.3 Puff dough biscuit
Puff dough is special type of developed dough. In the course of dough piece forming a
laminated structure must be developed and the layers are separated by soft, semi-solid,
8
plasticized fat. The fat must be kept cool which means that the dough must also be cool or
cold. Thus, puff dough must be mixed and must stand so as to maintain low
temperatures (usually around 15°C or less). Iced water is used at dough mixing and a
chilled room is required to hold the dough and in which to make the laminations (Manley,
1998).
2.3 Types of biscuits
2.3.1 Cream crackers
These have a simple recipe of flour, fat and salt, which is always fermented with yeast and the
dough is laminated prior to cutting and baking. These have characteristic flaky and variously
blistered biscuits (Manley, 1983).
2.3.2 Soda crackers
It is a square biscuit about 50 X 50 mm and 4 mm thick. The biscuits are produced with
scrapless cutters so the edges are white and broken after baking. The fermentation is usually in
two stages with a wet sponge lying for 18 hours followed by a dough stage, which is left to
ferment for about 4 hours. It has alkaline reaction after baking hence the name soda crackers
(Manley, 1983).
2.3.3 Savory crackers
These are variously salted, flavored and fat sprayed after baking. Depending upon their size,
because they are made in a very wide range of shapes and sizes, they can be regarded as
Savory snacks (Manley, 1983).
2.3.4 Water biscuits and matzos
Water biscuits have a simple recipe of flour, fat, salt and water in the ratio 100:6.5:1:29. The
dough is undeveloped and crumbly or in balls after mixing. Matzos are a Jewish product and
recipe is about 100 parts of flour to 38 of water (Manley, 1983).
2.3.5 Puff biscuits
Puff biscuits are all made from puffed dough in which there is a non-homogeneous
distribution of fat. When this dough is laminated the fat causes discontinuities between the
layers of dough and during subsequent baking these layers separated to give a flaky structure.
The dough is not fermented and is invariably cold and under developed. Puff biscuits are eaten
cold so the fat used must not have waxy tail after eating (Manley, 1983).
9
2.3.6 Short dough biscuits
These are made from cohesive dough that lacks extensibility and elasticity without the
formation of gluten stands from the wheat flour. The texture of the baked biscuit is attributable
to starch gelatinization and super cooled sugar rather than a protein or starch structure
(Manley, 1983).
2.3.7 Deposited soft dough and sponge drop biscuits
Short dough, which are soft enough to be just pourable, are referred to as soft dough. The
biscuits are rich in fat or based on egg whites whipped to stable foam (Manley, 1983).
2.3.8 Wafers
They are formed from a batter, which is baked between pairs of heated metal plates. The
majority of wafer biscuits are based on the large flat sheets. The wafer sheet itself is baked
from a simple batter containing little or no sugar. It is a tasteless product, which has a smooth
surface and a very open cellular structure within (Manley, 1983).
2.3.9 Miscellaneous biscuit-like products
These include crisp breads, pizza bases, sausage rusk etc. (Manley, 1983).
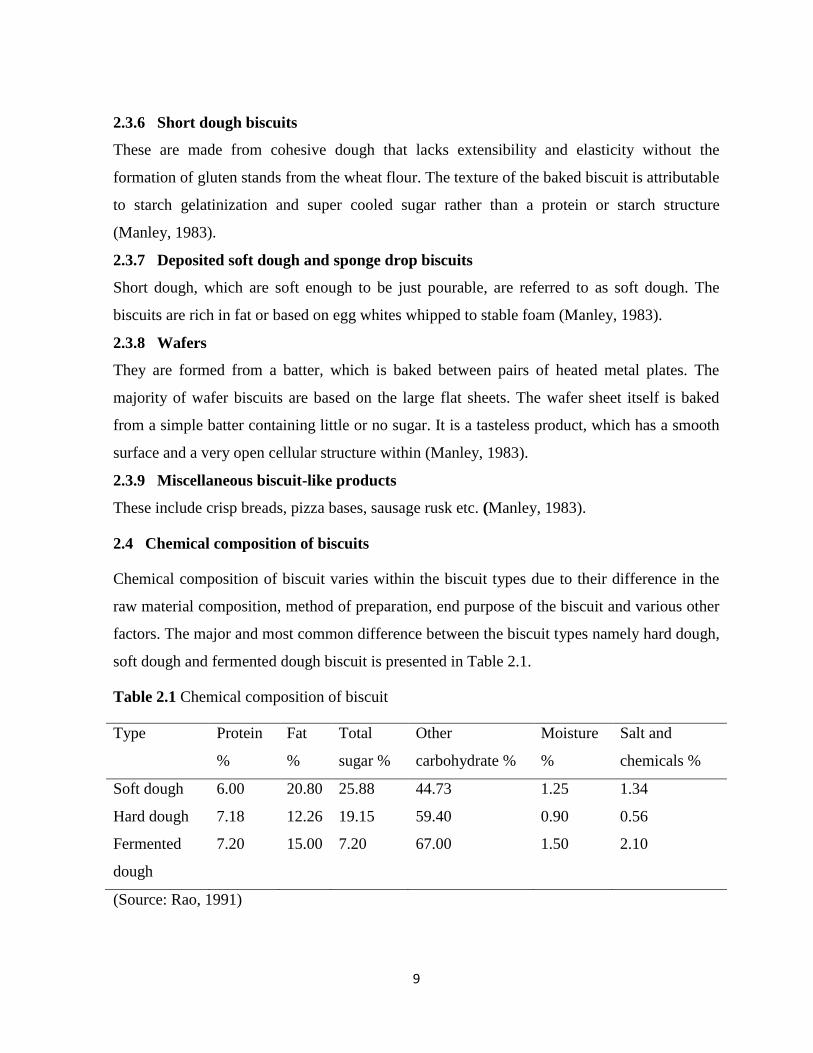
2.4 Chemical composition of biscuits
Chemical composition of biscuit varies within the biscuit types due to their difference in the
raw material composition, method of preparation, end purpose of the biscuit and various other
factors. The major and most common difference between the biscuit types namely hard dough,
soft dough and fermented dough biscuit is presented in Table 2.1.
Table 2.1 Chemical composition of biscuit
Type Protein
%
Fat
%
Total
sugar %
Other
carbohydrate %
Moisture
%
Salt and
chemicals %
Soft dough 6.00 20.80 25.88 44.73 1.25 1.34
Hard dough 7.18 12.26 19.15 59.40 0.90 0.56
Fermented
dough
7.20 15.00 7.20 67.00 1.50 2.10
(Source: Rao, 1991)
10
2.5 Raw materials for biscuit making
Mostly the common raw materials for biscuit making includes wheat flour, water, emulsifiers,
sugar, salt. Raw materials can be divided into major and minor ingredients, those raw
materials which are used in bulk and are a must for biscuit making are considered as major
ingredients. For example, flour, water, sugar and fat are used in bulk in biscuit making
procedure. Salt, skim milk powder (SMP), ammonium bi-carbonate, sodium bi-carbonate,
coloring agents, flavoring agents, emulsifiers, fortifying agents, improvers etc. are used in
small amounts and aren‟t a must for all sort of biscuits. These ingredients are used for
developing the taste, texture, flavor and aesthetic value of the product. Therefore these minor
ingredients are also known as the product improvers (Shrestha, 1995).
2.5.1 Major ingredients
2.5.1.1 Flour
Flour is the basic raw material for biscuit making responsible for the major bulk of biscuit
(Whitely, 1971). The flour used in biscuit and cracker vary in strength and baking
characteristics (Bohn, 1956). Wheat grain is the only grain naturally capable of producing
flour capable of being made into a low density baked product (Kent, 1983). Soy flour is used
in dough due to its emulsifying property and higher level of protein content (Whitely, 1971).
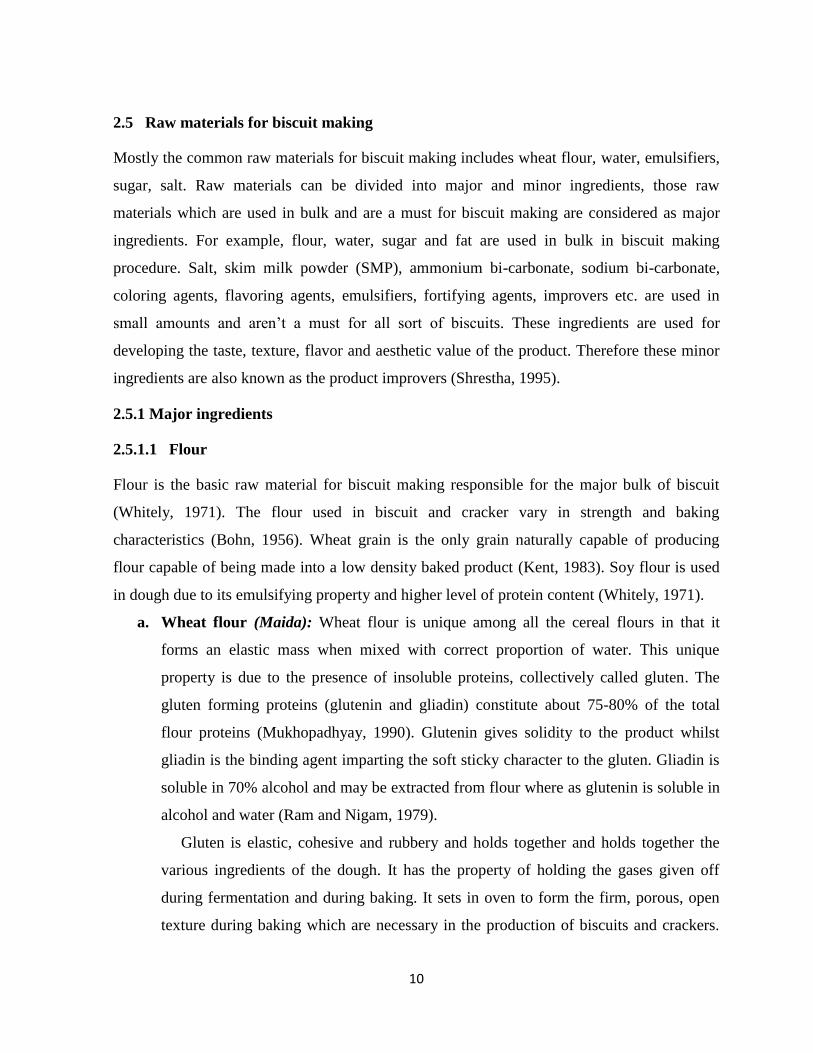
a. Wheat flour (Maida): Wheat flour is unique among all the cereal flours in that it
forms an elastic mass when mixed with correct proportion of water. This unique
property is due to the presence of insoluble proteins, collectively called gluten. The
gluten forming proteins (glutenin and gliadin) constitute about 75-80% of the total
flour proteins (Mukhopadhyay, 1990). Glutenin gives solidity to the product whilst
gliadin is the binding agent imparting the soft sticky character to the gluten. Gliadin is
soluble in 70% alcohol and may be extracted from flour where as glutenin is soluble in
alcohol and water (Ram and Nigam, 1979).
Gluten is elastic, cohesive and rubbery and holds together and holds together the
various ingredients of the dough. It has the property of holding the gases given off
during fermentation and during baking. It sets in oven to form the firm, porous, open
texture during baking which are necessary in the production of biscuits and crackers.
11
Thus gluten is the necessary framework, forming the sustaining wall of the whole
structure of baked products (Bohn, 1956).
Wheat flour used for making biscuit should be the product obtained by milling
cleaned hard or soft wheat or a combination of both types. Flour strength is usually
defined by the percentage of protein present in the flour. Weak flour is casually
accepted as the flour with low percentage of protein. Usually this protein is inferred to
be gluten, which when the flour is made into a dough with water, will become very
extensible under stress, yet when the stress is removed it will not fully return to its
original dimensions. Further, the amount of stress required to facture the dough piece
is less then that required under identical conditions when strong flour is used (Smith,
1972).
The strong flour protein has long links with few bonds while weak flour protein has
short links with many bonds. During biscuit making weak and easy to stretch, soft
wheat flour is found to be better (K.C., 1999). Beside the natural quality of flour, the
modifications in the flour strength can be done by various treatments. Treatment of the
flour with sulphur dioxide reduces the flour strength. Heat treated flour added to
untreated flour is claimed to strengthen the flour. According to Kent (1983), improvers
have some effect upon the nature and character of the gluten and cause it to behave,
during fermentation, like the gluten of the stronger flour. The flour should be free
flowing, dry to touch, should be creamy in color and free from any visible bran
particles. It should also have a characteristic taste and should be free from musty flavor
and rancid taste.
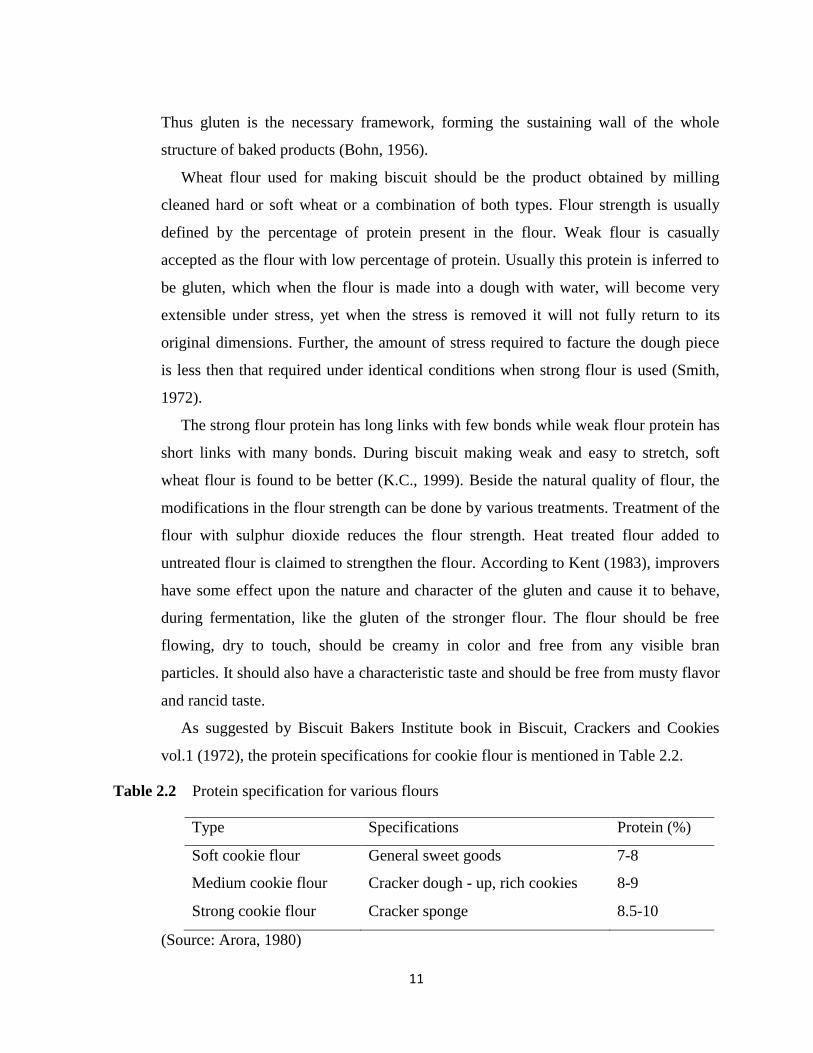
As suggested by Biscuit Bakers Institute book in Biscuit, Crackers and Cookies
vol.1 (1972), the protein specifications for cookie flour is mentioned in Table 2.2.
Table 2.2 Protein specification for various flours
Type Specifications Protein (%)
Soft cookie flour General sweet goods 7-8
Medium cookie flour Cracker dough - up, rich cookies 8-9
Strong cookie flour Cracker sponge 8.5-10
(Source: Arora, 1980)
12
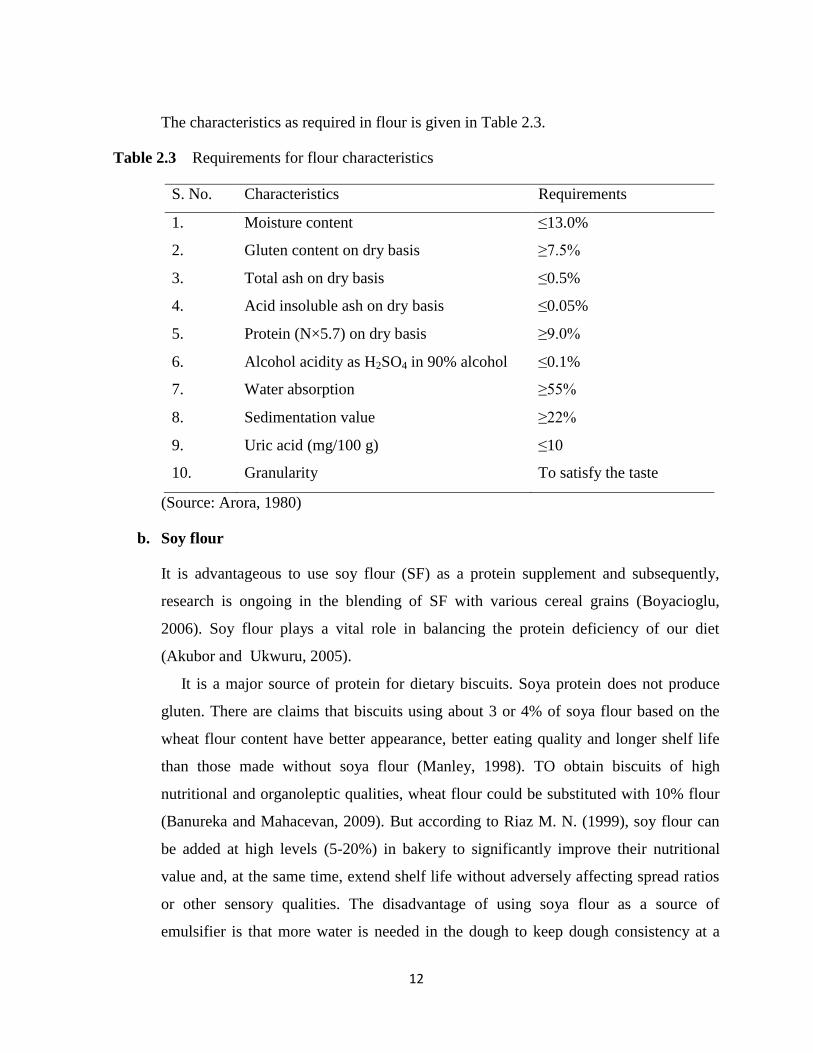
The characteristics as required in flour is given in Table 2.3.
Table 2.3 Requirements for flour characteristics
S. No. Characteristics Requirements
1. Moisture content ≤13.0%
2. Gluten content on dry basis ≥7.5%
3. Total ash on dry basis ≤0.5%
4. Acid insoluble ash on dry basis ≤0.05%
5. Protein (N×5.7) on dry basis ≥9.0%
6. Alcohol acidity as H2SO4 in 90% alcohol ≤0.1%
7. Water absorption ≥55%
8. Sedimentation value ≥22%
9. Uric acid (mg/100 g) ≤10
10. Granularity To satisfy the taste
(Source: Arora, 1980)
b. Soy flour
It is advantageous to use soy flour (SF) as a protein supplement and subsequently,
research is ongoing in the blending of SF with various cereal grains (Boyacioglu,
2006). Soy flour plays a vital role in balancing the protein deficiency of our diet
(Akubor and Ukwuru, 2005).
It is a major source of protein for dietary biscuits. Soya protein does not produce
gluten. There are claims that biscuits using about 3 or 4% of soya flour based on the
wheat flour content have better appearance, better eating quality and longer shelf life
than those made without soya flour (Manley, 1998). TO obtain biscuits of high
nutritional and organoleptic qualities, wheat flour could be substituted with 10% flour
(Banureka and Mahacevan, 2009). But according to Riaz M. N. (1999), soy flour can
be added at high levels (5-20%) in bakery to significantly improve their nutritional
value and, at the same time, extend shelf life without adversely affecting spread ratios
or other sensory qualities. The disadvantage of using soya flour as a source of
emulsifier is that more water is needed in the dough to keep dough consistency at a

13
level to allow good machining on production equipment which can make baking more
critical (Stauffer, 2005).
Soy flour are considered an inexpensive source of high-quality protein (38% to
40%) that are abundantly rich in lysine, an essential amino acid, deficient in most
cereal grains (Dhingra and Jood 2004; Shogren et al 2006). For these reasons, it is
advantageous to use soy flour (SF) as a protein supplement and subsequently, research
is ongoing in the blending of SF with various cereal grains (Boyacioglu, 2006).
However, successful use of soy flour as low cost protein supplements in biscuit is
challenging due to the unpleasant off-flavor compounds found in the soybeans. SPIs, in
particular, can exhibit some flavors often considered to be unappealing for consumers,
including cardboard and brothy flavors (Russell et al 2006). When added to baked
products, SF and isolates contribute beany and astringent notes to bread (King et al,
2001). The beany note is also found in other soy-based products and has also been
further characterized to be a raw soy and green flavor (Day N‟Kouka et al, 2004).
From a chemistry perspective, this beany flavor is associated with volatile compounds
that develop due to flavor reversion of soybean oil, a phenomenon observed during
oxidation of oils rich in linolenic acid (Liu, 1999). It is the presence of this sensory
characteristic in general that is found to be unacceptable to some consumers,
presenting a limiting factor for acceptance and widespread use of soybeans in the
Western diet (Shogrenet al 2006; Heenan et al 2008). King et al (2001) have
demonstrated that a 20% replacement of wheat flour with defatted regular and
lipoxygenase free SF leads to significantly higher beany flavor.
2.5.1.2 Fat or shortening
Fat is one of the major ingredients in biscuit making. Shortening function of fat during biscuit
making is a must step without which the baked product will be a solid mass held firmly
together by strands of gluten (Griswold, 1962). Fat itself being insoluble in water prevents the
extra cohesion of the gluten strands during mixing. The greatest attribute a shortening can
possess is that it should have a plastic nature over a wide range of temperatures as it is likely
to be encountered in its use for biscuit making (Smith, 1972).
14
The main action of the fat or shortening during mixing is to avoid the gluten forming
proteins to come in contact with water by insulating the gluten forming protein molecules due
to its hydrophobic nature. Hence, less tough dough with desired amount of gluten formation
can be obtained. Thus shortened baked products possess less hard, crispier nature and can
easily melt in mouth (Mukhopadhyay, 1990).
During mixing fat also helps in entrapment and retention of the air, which is highly
necessary for a product for its good texture. Fat also lubricates the formed gluten molecules to
distribute it to various sites during sheeting and hence preventing the agglomeration of the
gluten molecules. Fat also plays a vital role in the softness, texture, palatability and keeping
quality of the product (Menon, 1988-89).
In the earlier days of biscuit making animal lard was used for biscuit making which has
now been totally replaced by hydrogenated vegetable oils. The molecules that exist in oil are
built up of unsaturated fatty acid chains, some of which are loosely joined together by double
bonds which are weak bonds hence, making the fat prone to easy oxidative rancidity of the oil.
During hydrogenation the added hydrogen replaces the double bonds present to convert it to
single bonds hence a stable solid fatty acid molecule is formed from weak bonded liquid fatty
acid molecule (Smith, 1972).
Hydrogenated Vegetable fat are superior to the lards recently used in various aspects.
Further in order to obtain the best product the hydrogenated vegetable oil to be used for
biscuit making should possess the following properties:
a. It should possess good white to creamy color.
b. After keeping the fat at 50˚c for 24 hrs and filtering, its color should be comparable
with the control sample of oil.
c. The fat should have a smooth, uniform texture, free from any oil separation and large
grains.
d. The fat should have a bland „clear‟ odour and taste.
e. The fat should have a wide plastic range to suit particular production techniques and
the product.
f. The crystalline structure of fat should be stable during mixing and after baking.
g. The fat should possess reasonable shelf life on its own without the addition of
antioxidants.

15
h. The fat should be prepared from the blend of oils, which will not cause fat bloom
during the storage of biscuit.
(Source: Mukhopadhyaya, 1990).
However, only shortening agent allowed in HEB is palm oil. Palm Oil has got natural
antioxidant s called tocotrienols which helps in protecting body against ill effects of oxidation,
giving long shelf life to the product then others. It does not have trans-fat i.e. zero trans-fat. It
is composed of Palmitic acid and oleic acid. Palm oil is naturally semi solid at room
temperature (melting point is 39°C) which makes it an excellent shortening for food
application. Palmitic acid imparts creamy texture to the shortening which is important for
baked products.
2.5.1.3 Sweetening agents
Sugar is another major ingredient in biscuit making. Sugar generally used in biscuit making is
obtained from sugarcane and sugar beet. The sugarcane consists of 16-22% of sucrose while
sugar beet consists of 8-9% of sucrose. During biscuit making various forms of sugar namely
crystalline, pulverized, liquid, brown or soft sugar are used as per product requirement.
Generally most commonly used form of sugar in biscuit making is pulverized sugar. The
reason behind this may be due to its readily soluble characteristic which causes the palate to be
deceived in sweetness. The crystalline size also has effect on sweetness, shortness and better
spread capacity of biscuit (Whitely, 1971).
Use of crystal size varies according to the final product. Medium fine powdered sugar, with
or without very fine granulation is more suitable for rotary dough; while a coarser sugar is
tolerable in hard semi-sweet dough because of the larger quantities of water used, the longer
mixing time and higher final dough temperature. Use of coarser sugar gives fissured tops or
cracks which is desirable in case of crunches and ginger biscuits. Apart from these sugar
types, lactose sugar from milk, and brown sugar which gives both color and delicious flavor to
the product also are used.
Another type of sugar used in biscuit making is invert sugar syrup or simply invert syrup.
Due to its lower caramelization temperature compared to sucrose the crust coloration of the
biscuit takes on a browner appearance much quickly which is desirable in many products. If
the crust coloration becomes too darker than requirement then a part of invert syrup can be
16
replaced with glucose syrup. Experiments also show that use of invert syrup also reduces the
baking time. Invert syrup also helps in preventing checking problem in biscuits. It also helps
in moisture retention in biscuits. As a whole, sugar may be of any form helps in imparting
sweetness, increasing tenderness, maintaining volume, crust color development, flavor
improvement, moisture retention and proper spread of the biscuit (Smith, 1972).
2.5.2 The minor ingredients
2.5.2.1 Emulsifying agents
Emulsifying agents are surface-active agents promoting the formulation and stabilization of
emulsions during biscuit making. It helps proper mixing of lipid and aqueous fraction and
helps in maintaining good texture of the product. The unifying property of emulsion is due to
the presence of a hydrophobic and a lipophilic group on the same molecule.Various recipes in
biscuit making include those from high fat recipe to that of low fat recipe with low water and
high water respectively. In the low fat recipes, process problems are associated with gluten
development and dough machinability but in high fat recipes, there is more concern for the fat,
to give maximum textural effects, dough stickiness and control of spread while baking
(Manley, 2000).
Most commonly used emulsifiers are lecithin, eggs, mono and diglycerides etc. In creaming
stage where the fat, sugar etc. are combined with all or no part of water, lecithin does exert an
emulsifying action to give a smooth homogeneous mixture. Lecithin may be much more useful
as an antioxidant also (Smith, 1972).
2.5.2.2 Leavening agents
Leavening are the gassing agents which causes the dough to spring off or puff up to give a
porous open texture to the final product. Ammonium and sodium bicarbonate are the major
chemical leaveners, while yeasts are the biological leaveners. Similarly, mechanical leavening
can be done by incorporating the air within the dough matrix by mechanical agitation.
Reaction of two or more chemicals also leads to production and incorporation of gas, mainly
the reaction takes place between bicarbonates of ammonia as well as sodium with acidulants.
To discuss about the major and most common leavening agent the baking powder, it should
possess the following properties:
a. Maximum gas strength-greatest volume of gas for least weight of the product.
17
b. Proper balance of ingredients to prevent any impairment of the taste or appearance of
the biscuit.
c. Innocuous ingredients and residues.
d. Optimum velocity of reaction to be susceptible to control.
e. Keeping quality under diverse and extreme conditions to remain unimpaired over
reasonable periods of time.
f. Minimum cost of production, economical in use.
(Source: Smith, 1972)
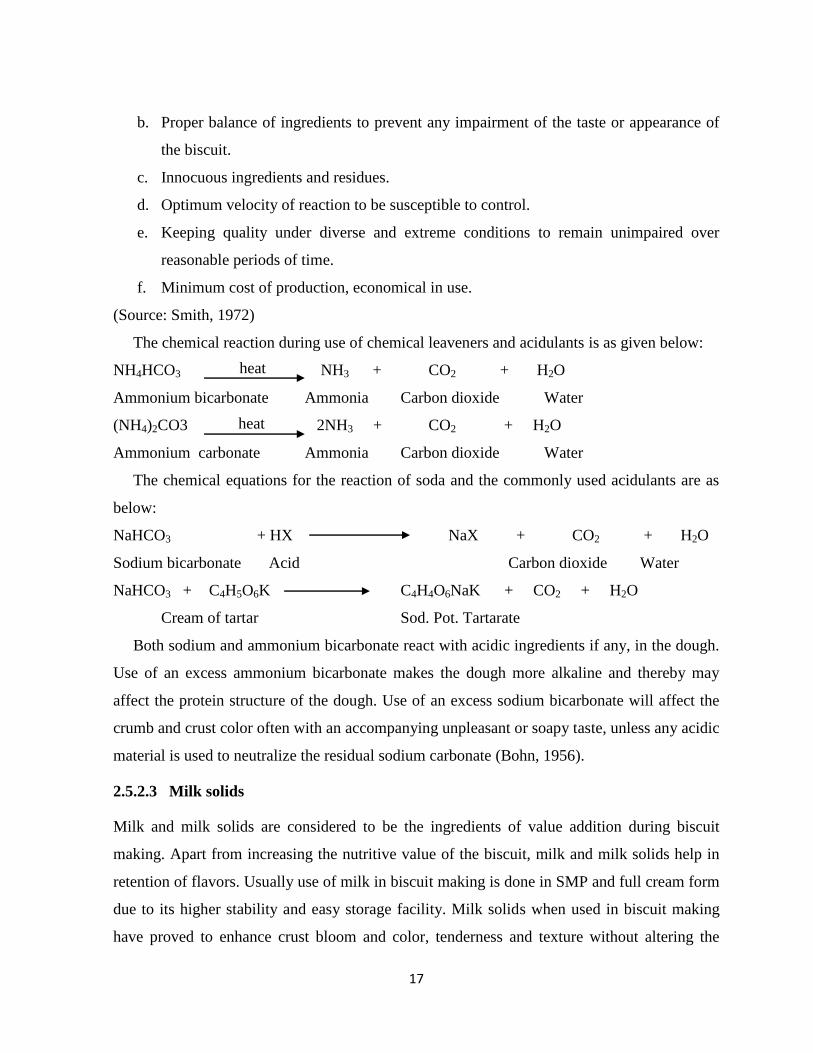
The chemical reaction during use of chemical leaveners and acidulants is as given below:
NH4HCO3 NH3 + CO2 + H2O
Ammonium bicarbonate Ammonia Carbon dioxide Water
(NH4)2CO3 2NH3 + CO2 + H2O
Ammonium carbonate Ammonia Carbon dioxide Water
The chemical equations for the reaction of soda and the commonly used acidulants are as
below:
NaHCO3 + HX NaX + CO2 + H2O
Sodium bicarbonate Acid Carbon dioxide Water
NaHCO3 + C4H5O6K C4H4O6NaK + CO2 + H2O
Cream of tartar Sod. Pot. Tartarate
Both sodium and ammonium bicarbonate react with acidic ingredients if any, in the dough.
Use of an excess ammonium bicarbonate makes the dough more alkaline and thereby may
affect the protein structure of the dough. Use of an excess sodium bicarbonate will affect the
crumb and crust color often with an accompanying unpleasant or soapy taste, unless any acidic
material is used to neutralize the residual sodium carbonate (Bohn, 1956).
2.5.2.3 Milk solids
Milk and milk solids are considered to be the ingredients of value addition during biscuit
making. Apart from increasing the nutritive value of the biscuit, milk and milk solids help in
retention of flavors. Usually use of milk in biscuit making is done in SMP and full cream form
due to its higher stability and easy storage facility. Milk solids when used in biscuit making
have proved to enhance crust bloom and color, tenderness and texture without altering the
heat
heat

18
symmetry and crumb color. The coloration may be due to the fact that the lactose in milk solid
remains as lactose in the biscuit because it is not fermentable by yeast. Lactose helps in the
formation of melanoids, the principle crust coloring substances, formed by the reaction of
sugars and amino acids from the proteins under the influence of heat. Probably this reaction
takes place in all biscuit dough baking (Smith, 1972).
According to USDEC, skim milk powder is an economical source of milk solids for
developed bakery flavors. Flavor development occurs during the baking process when the
amine group of the protein reacts with lactose and other reducing sugars as a function of the
Maillard browning reaction. The protein and lactose are available for crust color development.
High-heat skim milk powder provides structure and body to biscuits, resulting in a light biscuit
with good height.
Higher milk flavor can be obtained by the use of condensed milk during biscuit making.
Similarly among all the milk products butter is the potent product for better flavor
development but due to economical aspect their use have nearly completely been replaced by
butter flavors. Other milk products that are also sometimes used are cheese, whey, butter milk
etc. (Shrestha, 1995).
2.5.2.4 Salt (Sodium Chloride)
Use of salt during biscuit making is not mainly to increase saltiness except in some salty
biscuits. It helps to enhance the natural or other added flavors. Salt can reduce the sourness of
acids and increase the sweetness of sugars in their effect in the palate (Fabriani, 1977).
In fermented dough salt helps to develop the gluten of the flour besides acting as a
fermentation rate controller. Flours which lack a bit of ageing can be readily used with good
gluten fermentation by use of a little bit higher dosage of salt. Salt to be used during biscuit
making should be magnesium and calcium chloride free as the minerals may cause rancidity.
Use of salt in the range of 1.0-1.5% of the flour weight is thought to be best but above 2.5% it
may become objectionable or even nauseous (Mukhopadhyay, 1990).
2.5.2.5 Flavoring and coloring agents
Flavor is the quality of the thing that affects the sense of taste and smell. The majority of the
flavors used in biscuit making are derived from natural sources and these are in many ways
19
most satisfactory. To get good distribution in a dough, the flavor should be creamed with the
sugar and shortening at the beginning of mixing. Except from the added flavors, flavor can
also be obtained from the various ingredients such as nuts, fruits etc. Most commonly used
flavoring agents are common salt, yeast, extracts, spices and essences (Whitely, 1971).
Coloring agents are mostly not added externally during biscuit making. Other ingredients
like sugar, invert syrup, milk solids etc. provide color to the product mainly due to
caramelisation. Coloring agents not only include the synthetic as well as natural colors only
but various ingredients used during biscuit making also serve to provide appealing color to the
product (George, 1981).
2.5.2.6 Water
Water is one of the most important ingredients during biscuit making. Quality of water used
has a great effect on the product. Dissolved minerals and organic matters present in water can
affect the flavor, color and physical attributes of the finished baked product (Smith, 1972).
The water used in the baking product should be potable and odorless if required, although
no significant effect has been noticed due to the hardness, but demineralization is
recommended if the mineral content is too higher which might cause a adverse in product
color (Arora, 1980).
2.5.2.7 Anti-oxidants
Anti-oxidants act as a retarding or inhibiting agent in the onset of oxidation rancidity. As
biscuit is rich in nutrients and fat content, it is highly prone to oxidative rancidity, so role of
antioxidant is essential for prolonging the shelf life of the product. There are a number of
naturally occurring substances as well as many man-made chemicals which possess anti-
oxidant properties which can be used during biscuit making. Use of antioxidants should be
done in the early stage of biscuit making as antioxidants cannot hide or remove the incipient
rancidity (Ottaway, 1958).
Most commonly used antioxidants are, BHA (Butylatedhydroxyanisole), BHT
(Butylatedhydroxyltoluene), PG (Propyl gallate), NGA (Nordihydroguaiaretic acid). Nearly all
the added antioxidants are added with the shortenings for use.
An antioxidant should possess the following properties,
20
a. Non-toxic
b. Very little or effect on color, flavor or odour of the fat or the product.
c. Be readily incorporated- soluble in fat and oil.
d. Be effective in as low a concentration as possible.
e. Be stable to baking or frying temperatures.
f. Be stable to heat, even in alkaline media, such as biscuit dough.
Apart from all these major and minor ingredients sodium metabisulphite and potassium
metabisulphite are used as conditioning agents. Special fortifying agents like protein, vitamins,
fruits, nuts, chocolates etc. can also be mixed with biscuit (Smith, 1972).
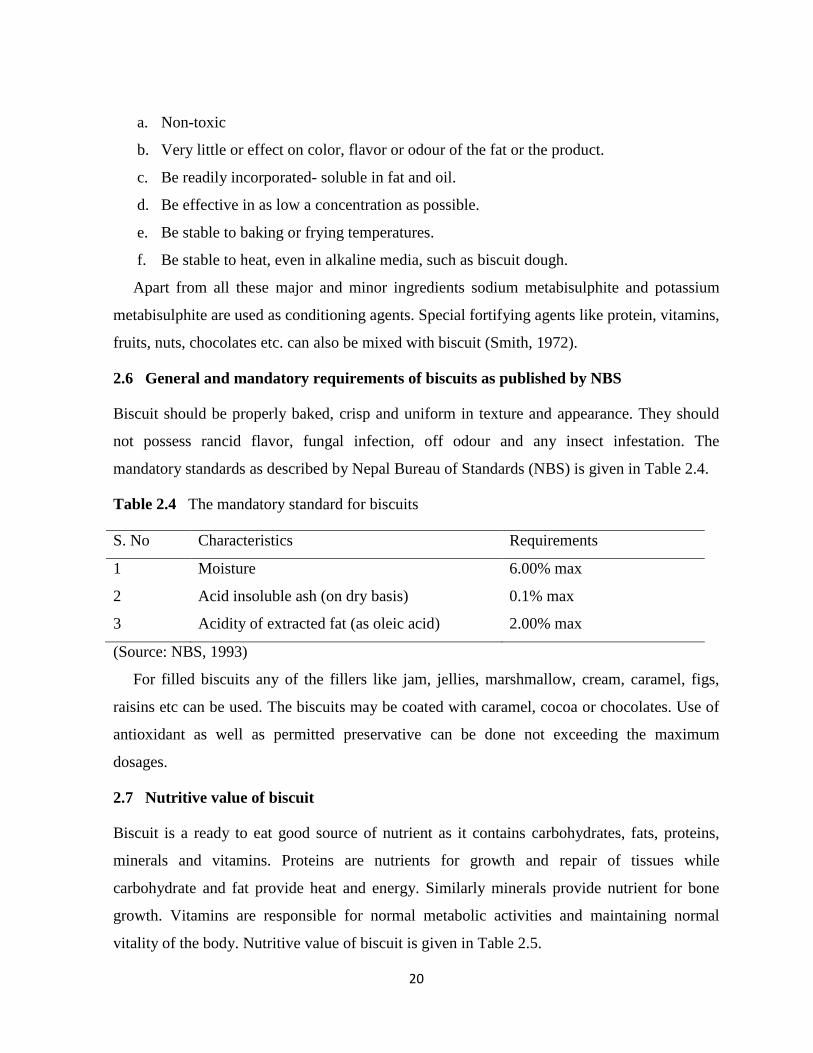
2.6 General and mandatory requirements of biscuits as published by NBS
Biscuit should be properly baked, crisp and uniform in texture and appearance. They should
not possess rancid flavor, fungal infection, off odour and any insect infestation. The
mandatory standards as described by Nepal Bureau of Standards (NBS) is given in Table 2.4.
Table 2.4 The mandatory standard for biscuits
S. No Characteristics Requirements
1 Moisture 6.00% max
2 Acid insoluble ash (on dry basis) 0.1% max
3 Acidity of extracted fat (as oleic acid) 2.00% max
(Source: NBS, 1993)
For filled biscuits any of the fillers like jam, jellies, marshmallow, cream, caramel, figs,
raisins etc can be used. The biscuits may be coated with caramel, cocoa or chocolates. Use of
antioxidant as well as permitted preservative can be done not exceeding the maximum
dosages.
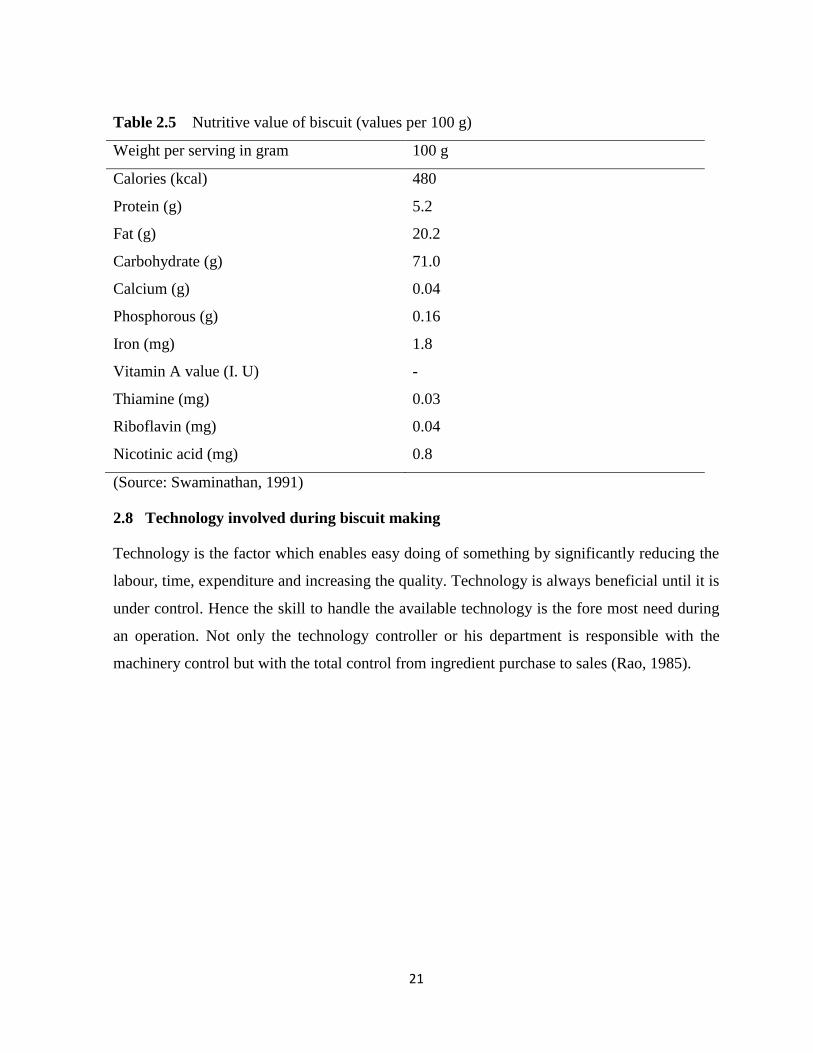
2.7 Nutritive value of biscuit
Biscuit is a ready to eat good source of nutrient as it contains carbohydrates, fats, proteins,
minerals and vitamins. Proteins are nutrients for growth and repair of tissues while
carbohydrate and fat provide heat and energy. Similarly minerals provide nutrient for bone
growth. Vitamins are responsible for normal metabolic activities and maintaining normal
vitality of the body. Nutritive value of biscuit is given in Table 2.5.
21
Table 2.5 Nutritive value of biscuit (values per 100 g)
Weight per serving in gram 100 g
Calories (kcal) 480
Protein (g) 5.2
Fat (g) 20.2
Carbohydrate (g) 71.0
Calcium (g) 0.04
Phosphorous (g) 0.16
Iron (mg) 1.8
Vitamin A value (I. U) -
Thiamine (mg) 0.03
Riboflavin (mg) 0.04
Nicotinic acid (mg) 0.8
(Source: Swaminathan, 1991)
2.8 Technology involved during biscuit making
Technology is the factor which enables easy doing of something by significantly reducing the
labour, time, expenditure and increasing the quality. Technology is always beneficial until it is
under control. Hence the skill to handle the available technology is the fore most need during
an operation. Not only the technology controller or his department is responsible with the
machinery control but with the total control from ingredient purchase to sales (Rao, 1985).

22
The technology of biscuit production is shown in Fig. 2.1.
Preparation of ingredients
(Weighing, recipe calculation and
fermentation of dough in case of
fermented biscuits.)
Creaming and mixing
(Performing is done for hard dough
and fermented dough biscuits.)
Laying the dough
Dough forming
(Moulding in case of soft dough biscuit,
Sheeting for other types)
Baking
(Temp. 176˚c to 204˚c for 4 to 6 minutes)
Cooling
(For 6 to 7 minutes)
Wrapping and packaging
Labeling and Storage (RH 40 to 59% at room temp.)
(Source: KC, 1999)
Fig. 2.1 Flow sheet of manufacturing process of biscuit
2.8.1 Preparation of ingredients
2.8.1.1 Wheat flour
Flour is taken from the bottom of a silo, or after a sieving system, via rotary seal into a stream
of air and is blown to a hopper which is mounted on a weighing system, probably above a
mixer.

23
2.8.1.2 Fat soluble ingredients
GMS, Lecithin, BHA, Sugar and Coconut Powder are to be mixed with melted
semisolid/liquid shortening.
2.8.1.3 Water soluble ingredients
Golden Syrup, Glucose Syruph, Malt and SMP are to be mixed with some water together and
color (if used) and SMBS both separately in some water.
2.8.2 Metering of ingredients
Metering is probably the most important aspect of process control. Errors in metering may
have an effect throughout the rest of the manufacturing process. In most plants insufficient is
known about the precision of metering and deviations from standard are not recorded
systematically so comparison with biscuit size and quality is difficult or impossible. So, it is
important that metering is done properly. In most factories ingredients are metered to mixers
by a combination of automatic (for bulk-handled materials) and manual (for small ingredients)
methods. (Manley, 2000)
2.8.3 Dough mixing
Mixing is the major step during biscuit making. Properly mixed dough has a great influence in
the final quality of the product. Mixing of the dough can be done in various ways as per
requirement. Mixing in industries is carried out by use of electrical mixers, most commonly
used mixers are two speed mixers. In top speed, the creaming up time is 3-5 minutes in two
speed mixer types, while the flour should be mixed for 10 minutes on slow speed (Whitely,
1971).
In the context of biscuit doughs, biscuit sandwich creams and batters, the term „mixing‟
covers a number of distinct operations. It includes:
a. the blending of ingredients to form a uniform mass
b. the dispersion of a solid in a liquid, or liquid in a liquid
c. the solution of a solid in a liquid
d. the kneading of the mass to impart development of gluten from flour proteins which
have been hydrated at an earlier stage of the mixing
e. build up of temperature as a result of work imparted

24
f. aeration of a mass to give a lower density.
One or more of these actions is required in the formation of dough for the very many types
of products that are called biscuits (Manley, 2000).
2.8.3.1 Creaming up method
This method of mixing up of dough mixing includes two steps, during first step the sugar and
fat are blended together to fine dissolution after that other ingredients like milk powder, water,
invert syrup, lecithin, color, essence, salt are mixed up for around 3-5 min. to form a
homogeneous cream. Now the flour along with the aerating agents is mixed up with the cream
and mixed at slow speed in the mixing machine for around 10 min. If other type of flour are to
incorporated than care must be taken that they must be pre-mixed into the shortenings and the
water before adding the other ingredients if the true attribute of thus added flour is to be
achieved (Smith, 1972).
This type of mixing method holds the water in a more or less stable state so that it is
prevented from making a wide spread attack on the flour to form any significantly higher
amount of gluten network. Mostly short cake rotary and wire cut doughs are mixed by this
method, in order to control flow and volume during baking. A significant factor in such
mixings is the amount of water used (Whitely, 1971).
2.8.3.2 All in one method
As the name suggests, all the ingredients are mixed together and fed in the mixing machine.
This method is straight forward where all the ingredients along with major part of water is fed
into the mixing machine which some part of water is used to dissolve the aerating chemicals,
flavors, colors and salt which is alter on mixed with the dough and is mixed until a satisfactory
dough is produced. This type of mixing method is widely applied with hard, semi-sweet
doughs. Due to the relatively higher water content in these doughs it results in very
satisfactory gluten production and formation.
In fermented dough an important step apart from the above described methods is used
which is known as punch back or knock back. This helps to break down the pockets formed by
the carbon dioxide during fermentation. The accumulated carbon dioxide might otherwise be
poisonous for the yeast cells (Smith, 1972).
25
2.8.4 Laying of dough
Lay time refers to the halt of the dough between mixing and machining. Lay time for various
products is variable. Lay time for fermented dough is highly necessary and is long while in
case of sulphited doughs it is avoided. A minimum of 15 minutes of lay off time should be
given to the dough for the achievement of good surface gloss, color, and weight. It also makes
the dough easily machinable (Bana et.al, 1996).
2.8.5 Forming and performing
The shaping or forming of the dough into various shapes and to the required thickness before
baking is one of the major steps in biscuit making. In case of hard dough and fermented dough
forming is done by using sheeters and laminators, which reduces the thickness of the dough to
convert it into a thin sheet. Occluded air is eliminated from the dough. It also helps in proper
spread of fat, salts which helps in producing a product with short eating and layered
appearance.
Soft dough is directly fed into moulding or embossment disc which cuts them into required
size, shape and appearance (Shrestha, 1991).
2.8.5.1 Sheeting, gauging and cutting
Of the various means of forming pieces for baking from a mass of dough, sheeting, gauging
and cutting is the most versatile and commonly used method. The integrated set of machines
that form dough pieces from a mass of dough are commonly referred to as a „cutting machine‟.
A cutting machine represents a straightforward mechanization of the old manual method
whereby a mass of dough was rolled out and then dough pieces were cut with a cutter of the
desired shape and size.
Within the sheeter the dough is compressed and worked to remove air and it is inevitable
that some stresses are built up in the gluten structure. There is also a small increase in dough
bulk density. Flanges at the ends of the rolls prevent the dough being extruded from the ends
of the rolls and ensure that the emerging sheet is always of the desired width. The new sheet of
dough then passes to one or more sets of gauge roll pairs which reduce the thickness to that
required for cutting. Like the sheeter, there are flanges on one of the gauging rolls to prevent
the dough extruding sideways and to maintain a full width of dough sheet. Sometimes, having

26
been reduced in thickness, the sheet is folded or cut and piled up to form many laminations
before being further gauged to a final desired thickness (Manley, 2000).
2.8.5.2 Rotary moulding
Principally, the dough is forced into moulds which are the negative shape of the dough pieces
complete with patterns, name, type and docker holes. The excess dough is scraped off with a
knife bearing upon the mould and thereafter the piece is extracted from the moulds onto a web
of cotton canvas or other fabric.
Short dough may be sheeted, gauged and cut with an embossing type cutter in a similar
way as for extensible dough, but the advantages of a moulder are:
a. It is not necessary to form and support a dough sheet
b. Difficulties of gauging are eliminated
c. There is no cutter scrap dough which must be recycled.
Until recently only short dough could be formed with a rotary moulder. That is because, as
is explained below, the scraper knife drags back cohesive dough so the mould is not filled and
the resulting dough piece is incomplete (Manley, 2000).
2.8.5.3 Extruding and depositing (Wire cutting)
These basically consist of a hopper over a system of two or three rolls which force the dough
into a pressure/balancing chamber underneath. The rolls may run continuously or
intermittently and may be capable of a short period of reverse motion to relieve the pressure
and cause a suck back at the dies or nozzles at the base of the pressure chamber. This means
that dough can be forced continuously or intermittently out of the pressure chamber.
The machine spans the width of the plant and is usually situated over the oven band. In the
case of certain drier, wire cut dough and rout types (continuously extruded) which are
subsequently cut into lengths before baking, the machine is over a normal canvas conveyor
and not the oven band. Dough pieces formed on a conveyor may be spaced out as they are
transferred onto the oven band.
Wire cutting gives attractive product appearance but production efficiency is not as good as
with other methods of dough piece forming (Manley, 2000).
27
2.8.6 Baking
The baking and drying of dough is the essence of biscuit making. Baking involves heating the
dough. The physics of heat transfer, heat flux, includes convection, conduction and radiation
which are difficult concepts to appreciate and evaluate where only the temperature at selected
places can be measured in an oven (Manley, 2000). Major part of heat transfer to the dough
pieces is by radiation while the heat transfer by convection is very low as long as the air
velocity in the tunnel is not higher than 5 feet per second, after which the heat transfer by
convection tends to be higher. Apart from these three modes of heat transfer, high frequency
heating is also used which has a higher rate of moisture removal (Petty, 1958).
During baking, the product is cooked, flavor and color is developed and the raw dough is
converted into an edible snack named biscuit. The main objective of baking is to remove the
moisture present in the dough pieces by gradual heating. The dough contains more than 25%
moisture, a part of which is bound water present in the flour and other ingredients while other
part is the free water added externally for dough making and easy machinability (Dutta, 1985).
Every oven used till date consists of four basic parts:
a. A heat source
b. A base (sole or hearth), capable of being heated, on which the dough piece is
placed.
c. A cover over the base, making up a chamber in which to retain the heat.
d. A closable opening through which the dough piece can be put into and taken from
the baking chamber.
During baking the dough undergoes gradual changes physically as well as chemically.
Physical changes include:
a. Formation of a film crust on the dough.
b. Melting of the fat in the dough.
c. Gas release and volume expansion.
d. Conversion of water into steam.
e. Escape of carbon dioxide, other gases and steam.
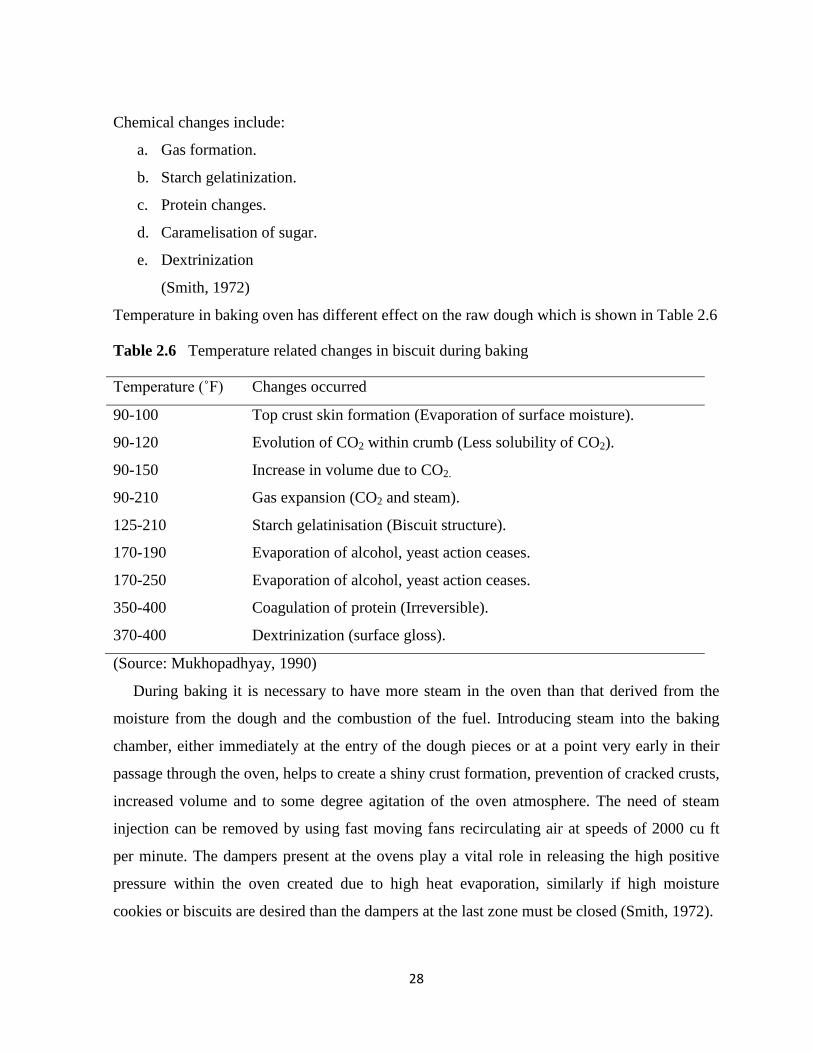
28
Chemical changes include:
a. Gas formation.
b. Starch gelatinization.
c. Protein changes.
d. Caramelisation of sugar.
e. Dextrinization
(Smith, 1972)
Temperature in baking oven has different effect on the raw dough which is shown in Table 2.6
Table 2.6 Temperature related changes in biscuit during baking
Temperature (˚F) Changes occurred
90-100 Top crust skin formation (Evaporation of surface moisture).
90-120 Evolution of CO2 within crumb (Less solubility of CO2).
90-150 Increase in volume due to CO2.
90-210 Gas expansion (CO2 and steam).
125-210 Starch gelatinisation (Biscuit structure).
170-190 Evaporation of alcohol, yeast action ceases.
170-250 Evaporation of alcohol, yeast action ceases.
350-400 Coagulation of protein (Irreversible).
370-400 Dextrinization (surface gloss).
(Source: Mukhopadhyay, 1990)
During baking it is necessary to have more steam in the oven than that derived from the
moisture from the dough and the combustion of the fuel. Introducing steam into the baking
chamber, either immediately at the entry of the dough pieces or at a point very early in their
passage through the oven, helps to create a shiny crust formation, prevention of cracked crusts,
increased volume and to some degree agitation of the oven atmosphere. The need of steam
injection can be removed by using fast moving fans recirculating air at speeds of 2000 cu ft
per minute. The dampers present at the ovens play a vital role in releasing the high positive
pressure within the oven created due to high heat evaporation, similarly if high moisture
cookies or biscuits are desired than the dampers at the last zone must be closed (Smith, 1972).
29
2.8.7 Cooling
Cooling is one of the most important part of biscuit production. As biscuits emerge from the
oven they are very hot nearly at a range of 210-214˚F, very soft and moist. Therefore cooling
of the biscuit prior to packaging must be done to maintain the proper structure of the biscuits.
Immediately after the biscuits are released from the oven they possess a very high moisture
content which signifies that the flour starch is still in some form of gelatinous paste and the
dextrin still in partial solution. Similarly the sugar as well as fat will also be in its liquid form,
protein although firmer than other ingredients is also pliable. Hence, almost all ingredients are
in unset state.
Cooling helps in consequent loss of moisture and slowly sugars start to crystallise out and
the dextrin grow tougher, then only the biscuit grow tougher and set. Cooling should be
gradual and slow (Dutta, 1985).
Checking is the most common defect which occurs in the biscuits after they are prepared
and not noticeable during processing. Checking refers to the hair like structure which might
refer to weakening of the structure and breakage might occur after 24 hrs of packaging. Hard,
semi-sweet biscuits are prone to checking rather than rotary moulded soft types which is due
to its low fat and low sugar content leading to higher gluten development. As gluten has
higher affinity towards water, it will extract it from the gelatinised starch present in the hot
biscuit and so cause stresses to be set up. This problem is supposed to be further aided by
rapid shrinkage of the biscuit due to rapid cooling. Hence, checking can be reduced or
eliminated if the baking is slow and the cooling is gradual rather than rapid (Manley, 1983).
2.8.8 Secondary processing
In many cases biscuits which have been baked and cooled are subjected to further treatment in
the form of coatings or sandwiching with flavored materials. These treatments are known as
secondary processes. The additions include chocolate, fat-based creams, water icing,
marshmallow, caramel toffee and jam or jelly. There may be a single addition such as
chocolate or a combination of two or more materials. In the latter case each addition is usually
made separately and a cooling or drying period allowed between each.
Secondary processing allows a much greater variety of flavors, textures and appearance to
be achieved than by baking alone. The additions may result in a biscuit becoming a

30
confectionery product and the materials used are more akin to the sugar confectionery industry
than flour confectionery. It may be that chocolate enhances a biscuit or a biscuit fills out and
enhances a chocolate product.
In-line secondary processing is not always the case and in many factories baked and cooled
biscuits are collected in tins or trays to be coated or sandwiched, etc., at a later time.(Manley,
1983).
2.8.9 Packaging
Biscuits are low moisture content food. Their mandatory standards state them to be of low
moisture content, mainly below 6%. The relative humidity of freshly baked biscuit is very low
so in order to prevent rapid uptake of moisture from the atmosphere, the biscuits must be
packed in a water vapor resistant packaging material. Packaging materials are those materials
which contain the product within them providing necessary conditions and protection to the
product inside to keep them safe and consumable over a long period of time. Packaging in
case of biscuits must be close up together in order to provide a mutual reinforcing effect which
prevents them from breakage. Packaging of biscuits at commercial level is generally done in
triple laminates consisting of polyethylene, aluminum foil and paper (Paine and Paine, 1983).
The primary pack is the moisture proof unit which is to be offered for sale to the consumer.
Secondary packaging into groups of 10, 20 or more in boxes or cases is for ease of storage and
transportation, but as this packaging may have a significant effect on the mechanical
protection afforded to the primary packs, it should be designed carefully (Manley, 2000).
2.8.10 Sensory perception of biscuits
Before launching the biscuit in the market, a panel of experts evaluate the overall acceptability
of the final product which is known as sensory perception or evaluation. Many basis of
evaluation include appearance, crispiness, crumb color, flavor and finally the overall
acceptability. The evaluation is marked on the score cards which is later on discussed in order
to find out the best product. Consumer research, case history research is also some of the
factors that need to be included while drawing conclusions from the analysis (Dawadi, 2008).
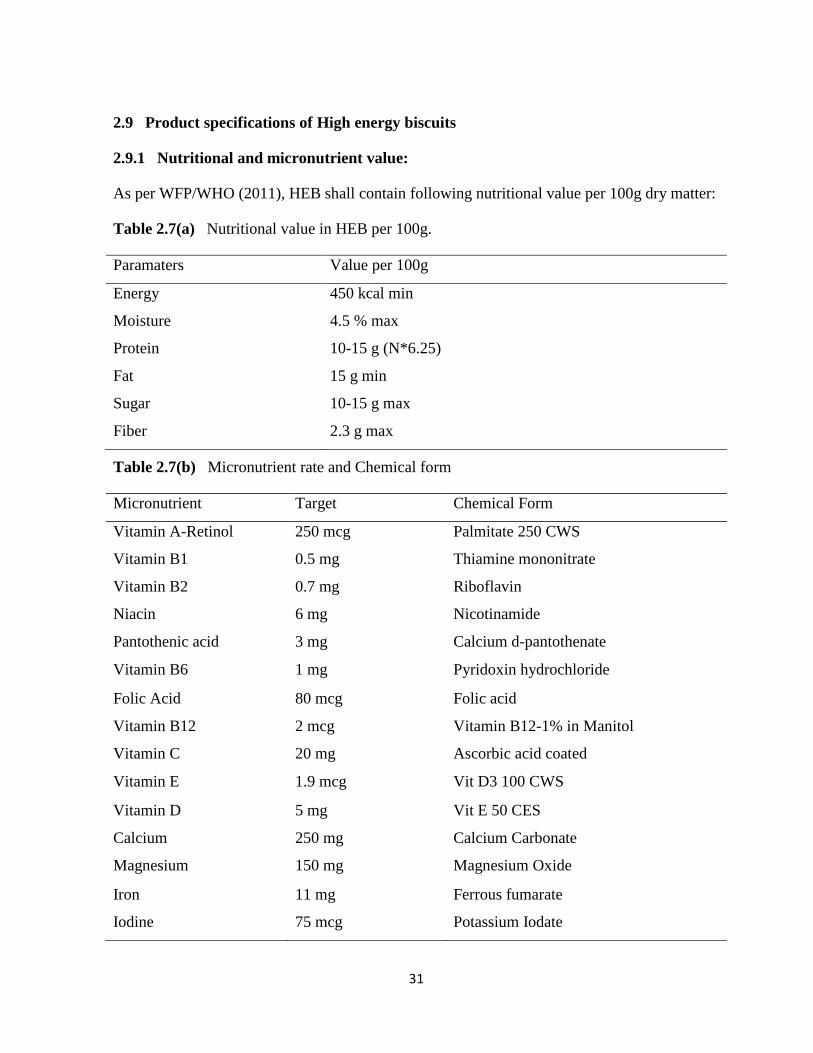
31
2.9 Product specifications of High energy biscuits
2.9.1 Nutritional and micronutrient value:
As per WFP/WHO (2011), HEB shall contain following nutritional value per 100g dry matter:
Table 2.7(a) Nutritional value in HEB per 100g.
Paramaters Value per 100g
Energy 450 kcal min
Moisture 4.5 % max
Protein 10-15 g (N*6.25)
Fat 15 g min
Sugar 10-15 g max
Fiber 2.3 g max
Table 2.7(b) Micronutrient rate and Chemical form
Micronutrient Target Chemical Form
Vitamin A-Retinol 250 mcg Palmitate 250 CWS
Vitamin B1 0.5 mg Thiamine mononitrate
Vitamin B2 0.7 mg Riboflavin
Niacin 6 mg Nicotinamide
Pantothenic acid 3 mg Calcium d-pantothenate
Vitamin B6 1 mg Pyridoxin hydrochloride
Folic Acid 80 mcg Folic acid
Vitamin B12 2 mcg Vitamin B12-1% in Manitol
Vitamin C 20 mg Ascorbic acid coated
Vitamin E 1.9 mcg Vit D3 100 CWS
Vitamin D 5 mg Vit E 50 CES
Calcium 250 mg Calcium Carbonate
Magnesium 150 mg Magnesium Oxide
Iron 11 mg Ferrous fumarate
Iodine 75 mcg Potassium Iodate

32
The variation of the final product with respect to contents of fat shall not minus 5% and the
moisture and fiber should not exceed 5% of the specified values. The permitted variation in
premix content is -10 to +15 % for added vitamins and +/- 10% for added minerals.
Note: Variable levels of micronutrients (i.e. iron, zinc, calcium etc.) naturally present in raw
materials may lead variable of micronutrients in finished product.
2.9.2 Microbiology
The microbiological contamination level for HEB is mentioned in Table 2.8
Table 2.8 Limit of microorganisms in HEB
Microorganisms Maximum levels
Mesophyllic aerobic bacteria 10,000 cfu per g
Coliforms 10 cfu per g
Escherichia coli 0 per 10 g
Salmonella 0 per 25 g
Staphylococcus 0 per 10 g
Bacillus cereus 10 per g
Enterobacter sakazakii 0 per 10 g
Yeasts and moulds 100r g
Source: (WFP/WHO, 2011)
2.9.3 Safety requirements
HEB shall be free from objectionable matter, not contain any substances originating from
micro-organisms or any other poisonous or deleterious substances, heavy metals or pesticide
residues, in amounts which may represent a hazard to health (Table-2.9).
Table 2.9 Safety parameters
Toxins Value
Arsenic (As) < 0.10 ppm
Cadmium (Cd) < 0.10 ppm
Lead (Pb) < 0.02 ppm
Mercury (Hg) < 0.20 ppm

33
Pesticide residues
Carbamate < 10 ppb
Organochlorine < 10 ppb
Organophosphorus < 10 ppb
Pyrethroid < 10 ppb
Melamine 2.5 mg/kg max
Source: (WFP/WHO, 2011)
2.9.4 Additional requirements
a. Organoleptic: HEB shall have a pleasant smell and palatable taste.
b. Weight: One biscuits should weigh between 5g and 10 gm.
c. Shelf Life: HEB shall retain above qualities for 24 months from date of manufacture when
stored dry at ambient temperatures prevalent in the country/state of destination.
d. Other Requirements
Free from radioactivity
Free from Genetically Modified Organisms (GMO) (if required by the contract)
(WFP/WHO, 2011)
2.10 Raw materials specifications for HEB
2.10.1 Main ingredients
HEBshall be manufactured from fresh and good quality, free from foreign materials,
substances hazardous to health, excessive moisture, insect damage and fungal contamination
and shall comply with all relevant national food laws and standards (WFP/WHO, 2011)
Requirements for the raw materials are:
a) Wheat flour should conform to Codex STAN 152-1985.
b) Soy flour/soy protein should conform to Codex STAN 171-1989 (for soy) or Codex STAN
175-1989 (for soy protein).
c) Sugar should conform to Codex STAN 212-1999.
d) Skimmed milk powder should conform to Codex STAN 207-1999.
It shall be accompanied by a „melamine-free‟ certificate.
Maximum level aflatoxin M1: < 0.5 mcg/kg milk (recommended methods ISO
34
14501/IDF 171:20071 or ISO 14674/IDF 190:20052).
e) Additives
Lecithin shall be in proportion as specified in the Codex STAN 074-1981.
Raising (Soda) agent as specified in the codex STAN 074-1981, the maximal
value is determined by the GMP principles.
Shortening: the only shortening agent allowed is palm oil as per codex STAN
074-1981.
Artificial flavoring agents are not allowed except ethyl vanillin and vanillin: 7
mg/100 g
Raw materials must be stored under dry, ventilated and hygienic conditions. Only safe
insecticides (i.e. phosphine) may be used for fumigation control. Where needed, fumigation
must be performed by certified operators, as per SOP for contracted fumigation /WFP, revised
Nov. 2003.
2.10.2 Vitamins and minerals
Complete premixes must be purchased from a WFP approved supplier. The composition of
premix is presented in product specification. Suppliers of WFP‟s micronutrient premixes are
DSM, Fortitech, Nicholas Piramal and Hexagon Nutrition or their authorized dealer (addresses
of suppliers are in annex) Micronutrient premixes must be delivered to the processor of HEB
with a complete Certificate of Analysis as well as with a Proof of purchase of premixes. The
two documents must be presented with other documents for payment. Premixes must be stored
in a dry, cool and clean place where the temperature is a maximum of 25ºC (WFP/WHO,
2011).
2.11 Packaging of HEB
To be used for WFP, HEB should be packaged in strong cardboard cartons suitable for
multiple handling, individual packages of 100 g each or 250 g each (individual packages of
100 g or 250 g each packed in metalized laminate OPP 20micron/PR 3C/DRY/VMCPP
25micron), 100 of these or 40 of those respectively to be stuffed in one carton box of 10kg
with necessary marking (WFP/WHO, 2011)

35
N.B. about 15-20 bags of silica gel of at least 1kg each should be placed in each container
in order to absorb moisture. In addition craft paper should be laid to all sides of the container.
Individual Biscuit Packaging should include the following Information (WFP/WHO, 2011):
a. Production date (month/year)
b. Best before date (month/year)
c. Nutritional information per 100g
d. “This product contains no lard”
e. “Not for individual sale”
f. “World Food Program + WFP logo”
2.12 Marking specification of HEB
Cartoons shall be marked at seller‟s expense with the following information, in letters
measuring 1.0 to 1.5 cm on the cartons:
a. Net weight
b. Month and year of production
c. Full name or code of the production enterprise
d. Ingredients, nutritional information
e. WFP logo (in letters of 5 cm), or the Contract authority name/logo.
2.13 Supplementation in HEB
Supplementation is the term used to describe the provision of relatively large doses of
micronutrients, usually in the form of pills, capsules or syrups. It has the advantage of being
capable of supplying an optimal amount of a specific nutrient or nutrients, in a highly
absorbable form, and is often the fastest way to control deficiency in individuals or population
groups that have been identified as being deficient (Allen et al, 2006).
Vitamins are essential organic compounds that the body requires to maintain life and which
it cannot synthesize itself, meaning they have to be in the food supply. Vitamins are either
water-soluble (vitamin C and all the B vitamins) or fat soluble (vitamins A, D, E and K)
(Wesley and Ranum, 2004). Most of the vitamin losses ocur during baking, which is the most
common process all wheat flour products go through. Although baking temperatures are high
(over 200°C), the temperature inside the product is significantly lower, and over 70 percent of

36
the vitamins remain unaltered (F. Hoffmann - La Roche, Unpublished Data, Basel). Minerals
supplemented are calcium, magnesium, iron and iodine. Supplementation in HEB is carried
commonly in the form of premixes. Supplements in HEB are described as follows:
2.13.1 Vitamin A
In vivo, this vitamin is generally found as the free alcohol or esterified with a fatty acid. The
vitamin is available in pure form by chemical synthesis as vitamin A palmitate or the acetate,
or recovered from molecularly recovered fish oil. It is a yellowish oily material which may
crystallize into needlelike crystals (Parman and Salinard, 1981). Stable forms of vitamin A
palmitate have existed for at least 30 years and have significantly increased the number and
kind of foods that can be fortified with vitamin A, particularly cereal grain products.
Commercial forms of dry vitamin A as palmitate or acetate are available embedded in a water-
soluble matrix (e.g., gelatin, gum acacia, starch) and stabilized with antioxidants (Klemm et
al., 2010).
Provitamins which are then converted to their active form, serve not only as nitrifying
compounds but also as colorants and anti-oxidants. The most common of these is beta-
carotene. Vitamin A is quite stable when heated to moderate temperatures in the absence of
oxygen and light. Overall loss of activity during anaerobic heating may range from 5-50%,
depending on time, temperature and nature of the carotenoids (Tannenbaum et al. 1987). In
the presence of oxygen and light, there can be extensive loss of vitamin A activity through
oxidation. The presence of trace metals accelerates this reaction.
In dehydrated foods, vitamin A and provitamin A are highly susceptible to loss by
oxidation (Labuza et al., 1978). The extent of this loss depends on the severity of the drying
process, protection provided by packaging materials and conditions of storage. Vitamin A in
pure form is unstable in the presence of mineral acids but stable in the presence of alkali.
Naturally occurring vitamin A is insoluble in water but soluble in oil. In this form the
vitamin has limited applicability. Vitamin A fortificants are commercially available in a wide
range of forms adapted for use under various conditions. For mixing with dry products, a dry
form of the fortificant was required with the appropriate size and density. Encapsulation of the
vitamin in a more hydrophilic coat is commonly practiced in order to achieve a more water
dispersible product. Two materials used in encapsulation are gum acacia and gelatin. These
37
dry forms of the vitamin are also stabilized using tocopherols or phenolic antioxidants (Clarke,
1995).
2.13.2 Vitamin B1 (Thiamine)
Vitamin B1, or thiamine, is a white crystalline solid with a characteristic yeast-like odor and a
slight bitter taste. Thiamine is produced by chemical synthesis as the hydrochloride and
mononitate salts. The hydrochloride is soluble to the extent of 50% in water as compared with
2.7% for the mononitrate (Bailey, 1991).
Thiamine is one of the most unstable vitamins. Its stability to heat and oxidation is greatest
at a pH range of 6 and below. At higher values of pH it becomes increasingly unstable.
Thiamine is susceptible to nucleophilicattack, therefore it is degraded by some mineral salts in
aqueous foods (Clarke, 1995). Thiamin can be added as either thiamin mononitrate or thiamin
hydrochloride. The mononitrate form is preferred because it is considered more stable. Both
are white powders and add no color to the flour. There are no known functional problems in
adding thiamin and the cost of thiamin fortification is not very high (Wesley and Ranum,
2004). Thiamine hydrochloride is the fortificant of choice in cases where dissolution in
aqueous media is required. In most other cases the mononitrate is used due to its lower
hygroscopicity. Thiamine is also commercially available in a coated form using mono- and di-
glycerides of edible fatty acids (Clarke, 1995). However, antioxidant systems will help
vitamin B1 remain heat stable (Baking Management, 2005)
2.13.3 Vitamin B2 (Riboflavin)
Vitamin B2, riboflavin, is of an intense orange color and low water solubility. A commercially
available more water soluble form of this vitamin is the sodium salt of riboflavin 5'-phosphate.
Riboflavin is generally stable under most processing conditions, but is unstable in alkaline
medium. It is very sensitive to light, particularly in the presence of ascorbic acid (Clarke,
1995).
2.13.4 Vitamin B6 (Pyridoxine)
Pyridoxine hydrochloride is a white powder and is not known to cause any problems when
added to cereals. While whole grains are good sources of this vitamin, but refined wheat flour
38
are not. But because it is found in a variety of foods, overt B6 deficiency is uncommon
(Wesley and Ranum, 2004).
There is some suggestion that pyridoxine, along with folic acid and vitamin B12, can help
lower homocysteine levels and thereby reduce the incidence of heart disease and stroke (Duell
1997; Jacques 2001; Kelly 2003).
Vitamin B6, pyridoxine, is available commercially as the hydrochloride. Coated forms are
also available as with all of the B-vitamins. This vitamin is quite stable to heat and
atmospheric oxygen and heat, but degradation is catalyzed by metal ions (Clarke, 1995).
2.13.5 Vitamin B 12 (Cyanocobalamine)
Cereals contain no vitamin B12. It is present only in animal products. Deficiencies occur
mainly in the elderly. The main justification for adding vitamin B12 is so that high levels of
folic acid can be added without risk of masking B12 deficiencies (Ray, 2000) but it is also
implicated along with some other B vitamins in reducing serum homocysteine levels (Bower,
1995).
Cyanocobalamin, the most important compound with vitamin B12 activity, is commercially
available as a crystalline, dark red, hygroscopic powder. Human requirements for this vitamin
are very low and it is commonly sold highly diluted by a carrier. In the preparations sold by
Hofmann-La Roche, for instance, it can be purchased diluted with mannitol or a mixture
containing modified starches, citrate, citric acid, benzoate, sorbic acid and silicon dioxide. The
selection of preparation depends, of course, on the end use. In solution it is most stable
between pH values 4-7. It is unstable to oxidizing and reducing agents and exposure to
sunlight, but is fairly stable to heat (Bailey, 1991).
2.13.6 Niacin (Vitamin B 5)
Niacin is low in refined flours .is relatively expensive and could be added at a lower rate to
wheat flour, or even excluded from flour fortification programs in wheat consuming
populations. One reason for excluding Niacin is tryptophan, an amino acid in proteins that acts
as a niacin precursor. When tryptophan content is considered even refined wheat flour
becomes a fairly good source of niacin (Wesley and Ranum, 2004).

39
Niacin in the form of either nicotinic acid or nicotinamide can be used in nutrient addition
to foods. At very high levels, nicotinic acid has been shown to cause unpleasant side effects
such as flushing and 'pins and needles'. This has led to some preference for nicotinamide. Both
forms of the vitamin are stable to atmospheric oxygen, heat and light in the dry state as well as
in solution (Clarke, 1995).
2.13.7 Folic Acid
Folic acid is a yellow-orange, odorless, tasteless crystalline substance. It is moderately stable
to heat and atmospheric oxygen. In neutral solution it is quite stable, but instability increases
with a shift in pH in either direction. Folic acid is unstable to heat, light, sunlight, oxidizing
and reducing agents (Clarke, 1995).
There is growing evidence that folic acid fortification will reduce the incidence of elevated
homocysteine levels (Jacques, 1999), considered a major factor in cardiovascular disease and
strokes. A study in Chile showed that the national folic acid fortification program reduced
serum homocysteine levels in the elderly (Hirsch 2002).
To avoid any possible risk of adverse effects, folic acid fortification should be designed to
limit regular daily intakes to a maximum of 1000 µg. Folic acid should be used in
combination with vitamin B-12, especially in those countries with large proportion of elderly
or where the consumption of eggs and milk products is low (Allen et al., 2003)
2.13.8 Pentothenic Acid
Pantothenic acid is a pale yellow, viscous, hygroscopic liquid which is very unstable. The
most commonly used commercially available form is calcium pantothenate. This is a slightly
hygroscopic white powder with no smell but a slightly bitter taste. Stability of this compound
is greatest at pH values between 5 and 7(Clarke, 1995).
2.13.9 Biotin
Biotin is a white crystalline powder of low water solubility. It is generally commercially
available in diluted form as the physiological requirement for this vitamin is so low.
Hoffmann-La Roche sells a 1 % mixture of this vitamin with di-calcium phosphate di-hydrate.
Biotin is fairly stable to heat, air and light (Clarke, 1995).
2.13.10 Vitamin C

40
Vitamin C or ascorbic acid is an odorless, white, crystalline compound which is stable in its
dry form. Due to its high water solubility, losses due to leaching can be a problem in some
processing procedures. Ascorbic acid is readily oxidized. In dehydrated citrus juices the
degradation is dependent on both temperature and water activity. Other factors as well can
influence the degradation behavior of vitamin C, these include salt and sugar concentration,
pH, oxygen, metal catalysts and ratio of ascorbic: dehydroascorbic acid.
Vitamin C addition to foods is commonly practiced for reasons other than fortification.
Commercially available forms of this vitamin include the free acid and the sodium and
calcium salts of these, in powder as well as crystalline or granular form. For mixing with dry
products, particle size and density are of course important considerations. A fat coated form of
ascorbic acid is also available for enrichment purposes. Ascorbyl palmitate is a form of the
vitamin used for purposes other than fortification. It is used as an antioxidant in fats and oils
and has also emulsifying properties (Anon, 1985). Other areas of food processing for which
vitamin C has application are the prevention of browning in fresh and canned fruit and
vegetables, acidification, curing of meat and prevention of haze formation in brewed products
(Borenstein, 1987).
2.13.11 Vitamin D
The principal forms of the vitamin are D3 and D2. They are white, crystalline fat-soluble
vitamins, formed by irradiation of the appropriate sterol followed by purification procedures.
These compounds are sensitive to oxygen and light, with the D3 form of the vitamin being
slightly more stable. Trace metals such as Cu and Fe act as pro-oxidants.
As with vitamin A, commercially available forms include fat-soluble crystals for use in high
fat content foods, and encapsulated, stabilized versions of the fortificant, suitable for use in
dry products to be reconstituted with water. As was stated for vitamin A, at the levels of water
activity which exist in dehydrated foods, these fat-soluble vitamins are most susceptible to
oxidative loss (Clarke, 1995).
Vitamin D is an important regulator of calcium metabolism. People who are exposed to
sunlight will not need much vitamin D, but adult deficiencies have been shown to exist, with a
higher prevalence in older subjects (Yan, 2000).
2.13.12 Vitamin E

41
Vitamin E is a slightly viscous, pale-yellow oily liquid obtained from molecular distillation of
by-products from vegetable oil refining or by chemical synthesis. The naturally occurring
form of the vitamin is the d-isomer. The synthetic compound is a racemic mixture of the d and
1 isomers. The 1-isomer doesn't have the full biological activity of the d-isomer, but due to the
stability of the racemic mixture and the ease of purification, the IU of vitamin E has been
defined as 1 mg dl-a tocopheryl acetate (Clarke, 1995).
Refined palm oil contains about 350-450ppm vitamin E, present as the RRR-tocopherol
(30%) and tocotrienol (70%) isomers. In contrast, other oils such as corn, soyaand sunflower
are good sources of the tocopherols but contain no tocotrienols (Sundram, 2003).
Vitamin E content in Crude palm oil is 708–1141ppm and Refined palm oil is 378–890ppm
(Gapor 1990). The free alcohol form of the vitamin is highly unstable to oxidation and is
therefore widely used in foods as an antioxidant to stabilize the lipid component of foods.
Esterified forms of the vitamin, commonly the acetate, are much more stable. For this reason,
fortificants are usually of this form. As with the other fat soluble vitamins, cold water soluble
forms have been produced by encapsulation within a suitable matrix (Clarke, 1995).
2.13.13 Iron
Iron compounds used in food fortification are commonly classified according to their
solubility. Selection of an appropriate iron fortificant for any given application is based on the
following criteria: organoleptic considerations, bioavailability, cost and safety (Hurrell and
Cook, 1990).
The use of more soluble iron compounds often leads to the development of off-colors and off-
flavors due to reactions with other components of the food material. Infant cereals have been
found to turn grey or green on addition of ferrous sulphate. Off-flavors can be the result of
lipid oxidation catalyzed by iron. The iron compounds themselves may contribute to a metallic
flavor. Some of these undesirable interactions with the food matrix can be avoided by coating
the fortificant with hydrogenated oils or ethyl cellulose.
Bioavailability of iron compounds is normally stated relative to a ferrous sulphate standard.
The highly water soluble iron compounds have superior bioavailability. Bioavailability of the
insoluble or very poorly soluble iron compounds can be improved by reducing particle size.
Unfortunately this is accompanied by increased reactivity in deteriorative processes.

42
Sodium iron EDTA is less well absorbed than ferrous sulphate from foods which contain
few inhibitors to absorption. In the presence of these inhibitors, however, the EDTA complex
is better absorbed. Sodium iron EDTA also participates to a lesser extent in deteriorative
reactions. The use of this compound reduces the problem of precipitate formation in foods
such as fish sauces and tea. The use of this compound is not advised in developed countries
where the population already receives close to the recommended acceptable daily intake of
EDTA (Hurrell and Cook, 1990).
The problem of low bioavailability of some of the less reactive forms of iron is often
circumvented by the use of absorption enhancers added along with the fortificant. Examples of
such enhancers are ascorbic acid, sodium acid sulphate and orthophosphoric acid.
2.13.14 Iodine
Iodine fortification is usually reserved for salt. There are no countries that currently require
iodine to be added. However, there can be situations where salt iodization is not adequate and
additional measures are needed to prevent the occurrence of IDD. Biscuit is normally made
with 2% salt on a flour basis. This has been reduced in recent years due to concerns on high
sodium levels, but it normally stays above 1.5%. U.S. standards of iodized salt is77 mg/kg
(Wesley and Ranum, 2004).
The most commonly used compounds in the iodization of foods are the iodides and iodates
of sodium and potassium. These are the additives allowed by Codex Alimentarius in the
iodisation of salt. The iodide compounds (Bauernfeind, 1991) are cheaper, more soluble and
have a higher iodine content (so that less is needed to achieve the same level of iodisation)
than the corresponding iodates. Iodates are more stable under conditions of high moisture,
high ambient temperature, sunlight, aeration and the presence of impurities. The use of iodate
is therefore recommended for use in developing countries. Potassium iodide is well suited in
cases where the salt is dry, free from impurities and has a slightly alkaline pH. Otherwise the
iodide may be oxidized to molecular iodine and lost through evaporation. If excess water is
present the iodide may be separated from the salt in the water film (FAO/WHO, 1991). Loss
of iodide can be reduced through the addition of stabilizers such as 0.1% sodium thiosulphate
and 0.1% calcium hydroxide combined or 0.04% dextrose and 0.006% sodium bicarbonate.

43
Calcium salts have been used with some report of off-flavor due to the calcium ions (Kuhajek
and Fiedelman, 1973).
2.13.15 Calcium
The main calcium sources used in cereal fortification are calcium sulphate (gypsum) and
calcium carbonate (limestone). Both are white and bland in flavor. Calcium sulphate is
produced from mined gypsum by a precipitation process and is available either as the
dihydrate with 23% calcium or the anhydrous form with higher calcium content (27%) but
generally a higher price as well. Calcium carbonate used in cereal fortification is normally
made by grinding limestone mined from very pure deposits.
There is a considerable variation in the particle sizes available, from very fine to
coarse.Because of the large bulk of the calcium source that needs to be added, it is not
normally included in the fortification premix and its addition is done separately from the rest
of the fortification. Calcium fortification has no effect on the color or taste of flour or bread,
even at the high levels used.
Calcium carbonate has a slight pH raising and buffering action on flour. Added calcium is
generally believed to be beneficial for yeast-leavened baking. Calcium fortification will
greatly increase the ash content, making ash levels unusable as a way of measuring quality or
extraction when enriched in flour (Wesley and Ranum, 2004).
2.13.16 Magnesium
Magnesium does not appear to be severely limiting in most diets. However, provision of
calcium supplementation of foods without magnesium is highly controversial. A ratio of 4:1 or
lower (by weight) of calcium to magnesium has been advocated. Although the overall risk and
benefit of this addition cannot be evaluated at this time, the addition of 40–60 mg/d of
magnesium to a supplement (as a food fortificant) is very unlikely to have side effects. Until
further data are available demonstrating low magnesium intakes or inadequate magnesium
status, the addition of magnesium to a complementary food supplement would be a safe but
not a necessary step (Abrams and Atkinson, 2003).

44
2.14 Packaging
Packaging is defined as “a coordinated system of preparation of goods for shipment,
distribution, storage and marketing at optimum cost, compatible with the requirement of the
product” (Kennedy, 1955). Packaging is an essential part of processing and distributing foods.
Whereas preservation is the major role of packaging, there are several functions for packaging,
each of which must be understood by the food manufacturer (Potter and Hotchkiss, 2006).
According to Paine and Paine (1983), definitions of packaging;
a. A coordinated system of preparing goods for transport, distributions, storage, retailing
and end-use.
b. A means of ensuring safe delivery to the ultimate consumer in sound condition at
minimum cost.
c. A techno-economic function aimed at minimizing costs of delivery while maximizing
sales (and hence profits).
2.14.1 Food packaging materials and forms
There are relatively few materials used in food packaging; metal, glass, paper and paperboard,
plastics, and minor amounts of wood and cotton fiber. However, within each of these
categories many types of packaging materials or combination of materials are available. In the
case of polypropylene film alone, there are dozens of types of films and laminates varying in
moisture permeability, gas permeability, flexibility, stretch, burst strength, and so on. Often, a
new food product requires its own special package since optimum protection, economic
considerations, and merchandising requirements change rapidly with variations in product
composition, weight and form, and performance demands (Potter and Hotchkiss, 2006).
According to Potter and Hotchkiss (2006), packaging material are found in a wide variety of
forms including the following: Rigid metal cans and drums; flexible aluminum foils; glass jars
and bottles; rigid and semi rigid plastics can and bottles; flexible plastics made from many
different films used for bags, pouches, and wraps; paper, paperboard, and wood products in
boxes, pouches and bags; and laminates or multilayer in which paper, plastic, and foil are
combined to achieve properties unattainable with any single component.
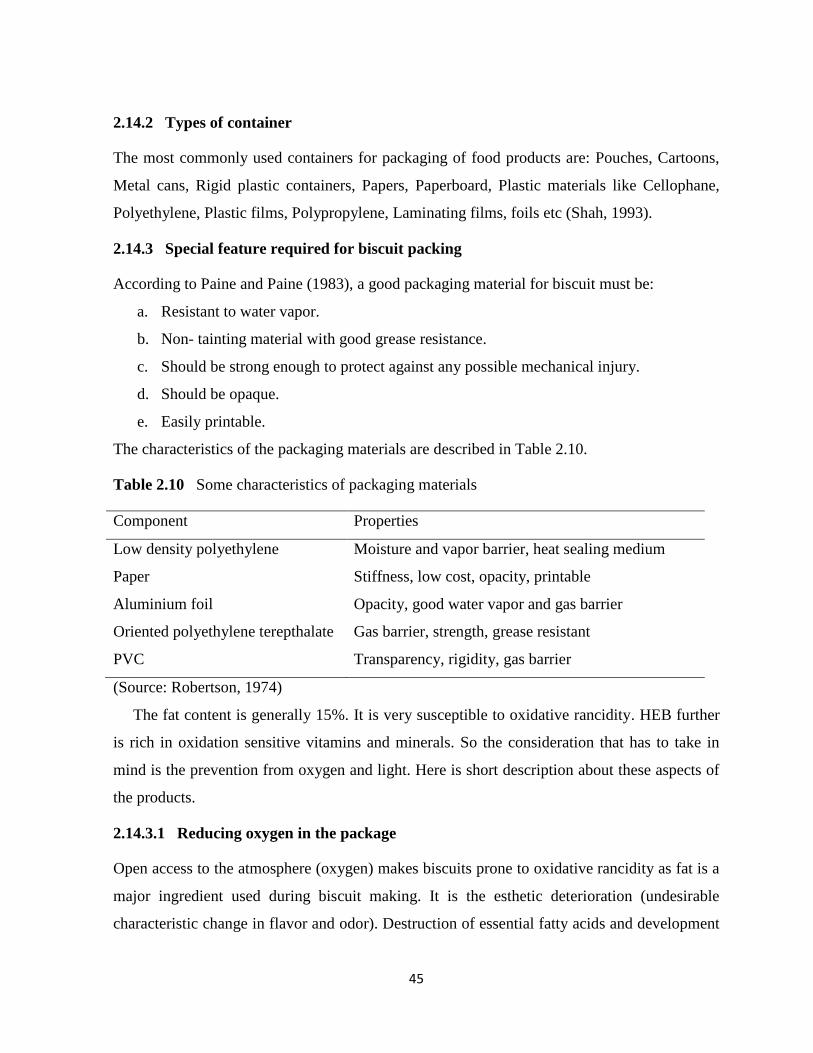
45
2.14.2 Types of container
The most commonly used containers for packaging of food products are: Pouches, Cartoons,
Metal cans, Rigid plastic containers, Papers, Paperboard, Plastic materials like Cellophane,
Polyethylene, Plastic films, Polypropylene, Laminating films, foils etc (Shah, 1993).
2.14.3 Special feature required for biscuit packing
According to Paine and Paine (1983), a good packaging material for biscuit must be:
a. Resistant to water vapor.
b. Non- tainting material with good grease resistance.
c. Should be strong enough to protect against any possible mechanical injury.
d. Should be opaque.
e. Easily printable.
The characteristics of the packaging materials are described in Table 2.10.
Table 2.10 Some characteristics of packaging materials
Component Properties
Low density polyethylene Moisture and vapor barrier, heat sealing medium
Paper Stiffness, low cost, opacity, printable
Aluminium foil Opacity, good water vapor and gas barrier
Oriented polyethylene terepthalate Gas barrier, strength, grease resistant
PVC Transparency, rigidity, gas barrier
(Source: Robertson, 1974)
The fat content is generally 15%. It is very susceptible to oxidative rancidity. HEB further
is rich in oxidation sensitive vitamins and minerals. So the consideration that has to take in
mind is the prevention from oxygen and light. Here is short description about these aspects of
the products.
2.14.3.1 Reducing oxygen in the package
Open access to the atmosphere (oxygen) makes biscuits prone to oxidative rancidity as fat is a
major ingredient used during biscuit making. It is the esthetic deterioration (undesirable
characteristic change in flavor and odor). Destruction of essential fatty acids and development

46
of toxic compounds may accompany rancidity. If the film is opaque, the light induced damage
is essentially nil. Oxidative rancidity will develop at a rate which depends on the percentage of
oxygen in the head space. Oxygen level above 2% in head space will be sufficient to allow
rancidity development. For controlling this effect, inert filling is practiced e.g. nitrogen,
carbon dioxide or vacuum pack is profitable for long time storage (Shah, 1993).
2.14.3.2 Reducing moisture vapor transfer
Moisture is the most important agent for hydrolysis of fat of the product. Up take of moisture
by biscuit also makes them prone to microbial attack. So, the moisture barrier type material
should be necessary. This property is simply tested by weighing the sample at certain interval
and gain or loss in weight is observed, it indicates bad barrier properties (Shah, 1993).The
moisture barrier properties of some important materials are shown in Table 2.11,
Table 2.11 Moisture barrier properties of some important materials.
S.N. Film
Water vapour transmission rate
(g/100in sq./24 hr/mm thickness)
1 Aluminum foil 0.01-0.02
2 Oriented polypropylene 0.2-0.4
3 Nitrocellulose-coated cellophane 0.7-1.0
4 Polymer coated cellophane 0.5-0.8
5 Unoriented polypropylene 0.6-0.9
6 Low Density Polyethylene 1.0-2.0
7 Polymer coated oriented poly propylene 0.3-0.4
Source: (Shah, 1993)
2.14.4 Plastics as packaging materials
The share of plastics in the packaging market has been growing at remarkable pace, partially
replacing paper, glass, and metal. Because of their unique combination of properties, plastics
have expanded the packaging industry to sophisticated levels. Plastics containers are light
weight, breakage resistant, transparent, flexible, squeezable, moldable in complex shapes,
easily colored and printed, retortable, sterilizable, reusable, and recyclable. Plastics have many
positive tradeoffs within their array of versatile properties, including easy processing, good
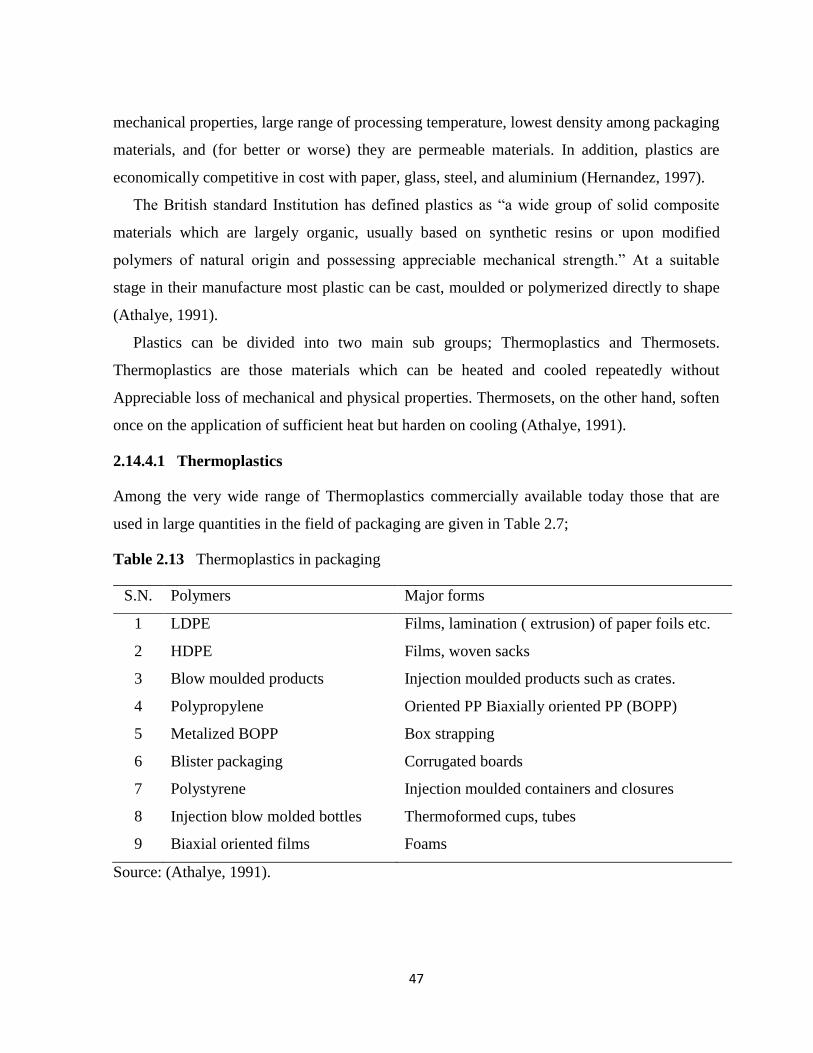
47
mechanical properties, large range of processing temperature, lowest density among packaging
materials, and (for better or worse) they are permeable materials. In addition, plastics are
economically competitive in cost with paper, glass, steel, and aluminium (Hernandez, 1997).
The British standard Institution has defined plastics as “a wide group of solid composite
materials which are largely organic, usually based on synthetic resins or upon modified
polymers of natural origin and possessing appreciable mechanical strength.” At a suitable
stage in their manufacture most plastic can be cast, moulded or polymerized directly to shape
(Athalye, 1991).
Plastics can be divided into two main sub groups; Thermoplastics and Thermosets.
Thermoplastics are those materials which can be heated and cooled repeatedly without
Appreciable loss of mechanical and physical properties. Thermosets, on the other hand, soften
once on the application of sufficient heat but harden on cooling (Athalye, 1991).
2.14.4.1 Thermoplastics
Among the very wide range of Thermoplastics commercially available today those that are
used in large quantities in the field of packaging are given in Table 2.7;
Table 2.13 Thermoplastics in packaging
S.N. Polymers Major forms
1 LDPE Films, lamination ( extrusion) of paper foils etc.
2 HDPE Films, woven sacks
3 Blow moulded products Injection moulded products such as crates.
4 Polypropylene Oriented PP Biaxially oriented PP (BOPP)
5 Metalized BOPP Box strapping
6 Blister packaging Corrugated boards
7 Polystyrene Injection moulded containers and closures
8 Injection blow molded bottles Thermoformed cups, tubes
9 Biaxial oriented films Foams
Source: (Athalye, 1991).
48
2.14.4.2 Thermosets
These are rarely used in the field of packaging except in a small way for threaded closures
made out of phenol formaldehyde and urea formaldehyde (Athalye, 1991).
Some of the distinct advantages that plastic materials offer (Athalye, 1991) are;
a. Plastics are light and less bulky than other packaging materials.
b. They have excellent barrier properties to moisture, odor, oxygen and other gases so
that they can maintain the desired shelf-life for various products.
c. They are resistant to most chemicals that are non-toxic in nature and absolutely safe to
use even in direct contact with food products, medicines etc.
d. Plastics can be processed into any desired shape or form such as films, sheets, bottles,
tubes, pouches, crates etc.
e. They are safe in use as they do not break easily and the broken pieces are not harmful
as those of glass and metal.
f. They save costs of storage and transportation because of lower volume and less
secondary packaging.
g. They do not promote any bacterial growth and can be sterilized by all conventional
methods and hence provide wide application in food, medical and chemical packaging.
h. Single serve packs for food items such as ketchups, condiments etc and small unit
packs can be made available at low costs.
i. Plastic packages are temperature proof, break resistant, corrosion resistant and leak
proof.
j. Plastic packaging does not possess any major disposal problems or environmental
hazards since almost all of plastics can be recycled for reuse.
Although plastic packages have tremendous advantages, they have some limitations (Athalye,
1991). These include;
a. Some chemicals do attack particularly on some plastics.
b. They are not a total barrier to gases and water vapor, although some new barrier
c. Plastics have greatly improved oxygen, gas and odor permeability.
d. Abrasion resistance is not always adequate.

49
e. When stretched PVC/PET is used instead of glass for bottles, consumers may get the
impression that there is less quantity because of reduced thickness.
2.14.5 Selection of proper packaging materials
Description of packaging materials is very complicated subject because in the modern
development of plastic technology additional developments in design, use, merits and demerits
are added day by day. Detail information is not possible here so on the basis of requirement of
the product and the availability of packaging material and other technical constraints, only two
types of packaging materials are preferred. So plastic packages that is going to be used in the
work is described here in short, they are;
a. Poly Ethylene Terephthalate (PET)
b. Biaxial oriented Polypropylene (BOPP)
2.14.5.1 Poly Ethylene Terephthalate (PET)
PET has good sparkle and clarity. Density ranges from 1.38-1.395 gm/cc. Due to its high
softening point of 245-270ºC, it performs well over a wide range of temperature ranging from
-60 to +150 ºC, so it can be used for boil in the bag. It is not good for heat sealing and if this is
required, it is usually coated with a layer of PE, BOPP etc. Film thicknesses range from
thinner than 12 mcg for most polyster films to around 200 mcg for laminated composites.
Main properties of PET are:
a. Good barrier properties
b. High Strength
c. Grease Resistance
d. Low and high temperature performance
(Kirwan and Strawbridge, 2003)
2.14.5.2 Biaxially oriented polypropylene (BOPP)
BOPP is the lowest density polymer (0.90g/cc) and extremely versatile because of its excellent
process ability, mechanical and physical properties and high distortion resistance. Main
properties of BOPP are,
a. They are good resistance to strong acid and alkalis.
b. Not affected by most solvent at room temperature.

50
c. It resists oil and grease and does not crack under any condition.
d. Good barrier of moisture and gases.
(Kirwan and Strawbridge, 2003)
For best WVTR and barrier properties, the preferences are (Athalye, 1991);
a. Aluminum foil and metallized films for the best barrier
b. PVDC and EVOH for the best non-foil barrier
c. PP, HDPE, LDPE for good protection
d. Polycoated paper for limited protection
e. Paper or permeable cellulose film for allowing the product to breathe.
2.14.6 Safety of food packaging
2.14.6.1 Migration from plastics
It is important to know that plastics are not completely inert to foods. Aside from the
permeation of gases and vapors, it is also possible that components of the plastics can migrate
to the food and would then be consumed with the food. This raise concern for the safety of
some plastics. For this reason, all plastics used in food contact must have specific approval
from regulatory agencies for the intended use. Food manufacturers must get written assurance
from the plastic manufacturer that their container wrap meets all requirements for use in food
contact (Potter and Hotchkiss, 2006).
2.14.6.2 Contamination
It is primarily which acts as a barrier to contamination of foods. Preventing recontamination of
thermally processed low-acid food which are stored at room temperature is especially serious.
Recontamination with pathogens bacteria such as Clostridium botulinumcan lead to outbreaks
of food-borne disease. One example occurred when fish had been processed in defective metal
cans which contained small holes. Several people ended up with botulism, which is often fatal
(Potter and Hotchkiss, 2006).
2.15 Shelf-life determination
The shelf-life of the product in the package under specified conditions can be confirmed by
several methods, viz., (1) weight gain or loss method, (2) method based on testing the
performance of the product, and (3) chemical (acid value, peroxide value) changes during
51
storage. All these tests are related to water vapor and oxygen permeability of the packaging
material, which in turn indicates the increase of acid value and peroxide value of the product
overtime. All shelf-life assessment methods use accelerated and controlled conditions so that
an accurate prediction of shelf-life can be possible within a short time (Kumar, 2001).
Peroxide value and free fatty acid tests are analytical methods typically used for fats and
oils. If the fat must first be extracted from food products in order to run these tests, the
following statements must be true to ensure valid results (Sewald and DeVries, 2000).
1. The fat extracted must be representative of the fat in the food.
2. No non-fat compounds, which would interfere with the test, should be extracted with the
fat.
3. No active fat compounds can be either produced or destroyed during the extraction process.
4. The solvents used must be free of any active substances.
Storage temperature conditions should then be chosen which fit the product and give
reliable results in a reasonable amount of time. Common temperatures used would be 20, 30,
40, and 55°C (68, 86, 104, and 131°F). A control, stored at 0°F, can also be used. The
frequency of the analytical testing is the next important decision. The higher the storage
temperature, the more frequent should be the testing. Weekly tests are common for most
products (Sewald and DeVries, 2000).

PART III
Materials and methods
3.1 Raw materials
Himal chap wheat flour in the form of maida used for biscuit making was obtained from Salt
Trading Co-operation, Sundhara, Kathmandu. Soy flour was obtained from local flour mill.
Both wheat and soy flour was shifted to a 44 size mesh. Malaysian red palm oil, Malaysia was
used as shortening agent. Mayur Brand Sugar obtained from Mahalaxmi Sugar Pvt. Ltd.
,Adarsanagar, Parsa, in the form of pulverized sugar was used. Rahul Skimmed milk powder
(SMP) of Chitwan Milk Pvt. Ltd, Chitwan was used. Vitamin Premix and Mineral Premix
produced by Hexagon Nutrition was used. Other raw materials like common salt, invert syrup,
sodium and ammonium bi-carbonate, lecithin and Flavor were used from the regular store. P1
(laminate PET + BOPP) (12+25µ) and P2 (laminate PET + metallic BOPP) (12+25µ) were
used for the packaging of the product.
3.1.1 Basis of formulation
The preparation of high energy biscuits was done on the basis of minimum (basic) nutrient
requirement as specified by WFP (2006). Table 2.7 (a) and (b) shows the basic nutrient
requirement for HEB.
3.1.2 Calculation of amounts of ingredients
For the formulation of HEB, the amounts of ingredients were calculated on dry weight basis.
Legumes were taken as the source of protein, the cereals as the staple source. Mineral salts for
mineral source, Sugar as a sweetening agent as well as flavoring agent, Ascorbic acid as the
source of vitamin C, Oil as a source of energy and to maintain the level of essential fatty acids.
Amount of vitamin and mineral premix was added to achieve vitamins and mineral
required level in HEB. Finally, from the calculation three formulae mixes was developed.
The recipe formulation for the HEB was carried out as given in Table 3.1.

53
Table 3.1 Recipe Formulation for High energy biscuit
Ingredients Quantity (Parts) A B C D E F
Wheat flour 100 100 95 90 85 80 75
Soya flour (SF) 0, 5, 10, 15, 20, 25 0 5 10 15 20 25
Fat 18 18 18 18 18 18 18
Pulverised sugar 14 14 14 14 14 14 14
Milk powder (Full cream) 2.5 2.5 2.5 2.5 2.5 2.5 2.5
Salt 1.15 1.15 1.15 1.15 1.15 1.15 1.15
Sodium bicarbonate 0.9 0.9 0.9 0.9 0.9 0.9 0.9
Ammoniuim bicarbonate 2 2 2 2 2 2 2
Soya lecithin 0.2 0.2 0.2 0.2 0.2 0.2 0.2
Vitamin and Mineral Premix 0.2 0.2 0.2 0.2 0.2 0.2 0.2
Ascorbic acid 0.02 0.02 0.02 0.02 0.02 0.02 0.02
Flavor 0.25 0.25 0.25 0.25 0.25 0.25 0.25
Water 10 10 10 10 10 10 10
3.2 Method of preparation
Raw materials were weighed as per the calculated recipe as given in Table 3.1. Then after
creaming up of shortening, pulverized sugar, syrups, milk powder, part of water, lecithin and
half of buckwheat flour was done till the mixture appeared as a creamy mass. The mixing was
done in mixing machine at top speed for 3-5 minutes as per requirement. Addition of
buckwheat flour early in the mixture was to enhance its naturally borne emulsifying capacity
as described by Smith (1972).
Now to the creamy mass remaining buckwheat flour, wheat flour and chemical leaveners
dissolved in water was added. Now the remaining water was also added and the mixing was
carried out on two speed mixer on low speed for 10 minutes. The adequacy of mixing was
checked by studying the adhering nature of the dough in the dye.
Now, thus prepared dough was left for 15 minutes for laying, in order to achieve maturity
of dough for easy machinability and good surface gloss as described by Bana et.al (1966). The
matured dough was then fed in the embossing dye or moulders directly.

54
The dough was then conveyed to continuous baking oven where it was baked for 5 minutes
with the last damper open. Baked biscuits were now cooled for 20 minutes and then packed in
poly propylene bags and stored in a cool and dry place for further analysis. The standard
baking temperature profile set for the study was as given in Table 3.2.
Table 3.2 Baking temperature profile of the oven
Zone No. 1 2 3 4 5
Top Heat (ºC) 230 240 240 250 200
Bottom Heat(ºC) 230 250 250 210 200
Damper Position Half- Open Half-open Closed Closed Closed
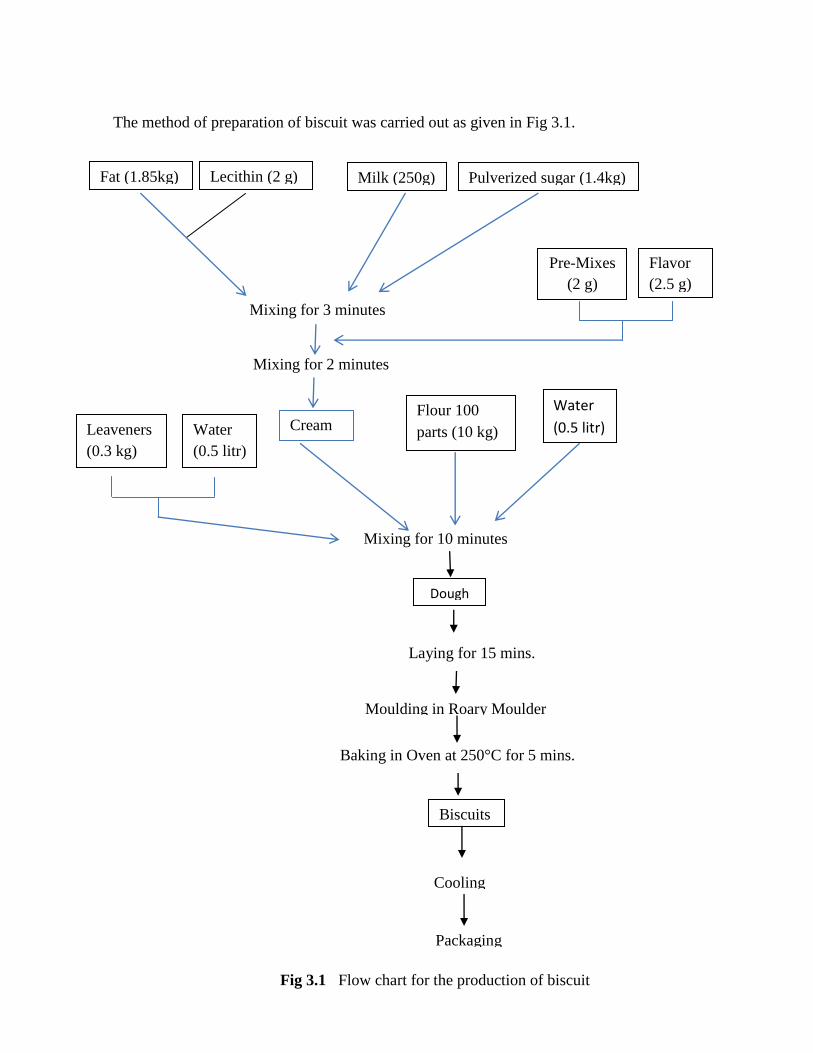
55
The method of preparation of biscuit was carried out as given in Fig 3.1.
Dough
Biscuits
Pre-Mixes
(2 g)
Flavor
(2.5 g)
Lecithin (2 g)
gm)
Fat (1.85kg) Milk (250g)
gg))
Pulverized sugar (1.4kg)
Mixing for 3 minutes
Mixing for 2 minutes
Cream Flour 100
parts (10 kg) Water
(0.5 litr)
Mixing for 10 minutes
Leaveners
(0.3 kg)
Water
(0.5 litr)
Laying for 15 mins.
Moulding in Roary Moulder
Baking in Oven at 250°C for 5 mins.
Packaging
Fig 3.1 Flow chart for the production of biscuit
Cooling

56
3.3 Evaluation of prepared HEB
3.3.1 Sensory evaluation
Sensory evaluation was performed by 9 point hedonic scoring test (9 = like extremely, 1=
dislike extremely) for color, texture, flavor, taste and overall acceptance from 0 weeks to 12
weeks in every 2 weeks. The evaluation was carried out by 10 panelists comprising of
members of Nepal Army, each of them the regular consumer of HEB. Sensory evaluation was
carried out in individual both with adequate light and free from obnoxious odors. Each
panelist was provided with 5 samples coded random numbers and evaluation card (Appendix
A). They were provided with potable water for rinsing between the samples. Verbal
communication among the panelist was prohibited. They were asked to evaluate the samples
individually using score card.
3.3.2 Physiochemical analysis of product.
3.3.2.1 Moisture content
Moisture content was determined using hot air oven (Ambassador, working temperature 0 to
300ºC, UK) as per Ranganna (2001).
3.3.2.2 Crude protein
Crude protein was determined by Micro Kjeldahl method as per Ranganna (2001).
3.3.2.3 Crude fat
Fat content in the product was determined by soxhlet extraction method as per Ranganna
(2001).
3.3.2.4 Total ash
Total ash was determined by ashing in electric muffle furnace (Ambassador, working
temperature-900ºC, UK) as per Ranganna (2001).
3.3.2.5 Crude fiber
Crude fiber was determined as per Ranganna (2001).
57
3.3.2.6 Total carbohydrate
Total carbohydrate was determined by difference method.
Total carbohydrate (%) =100-(moisture + protein + fat + crude fiber + ash) %
3.3.2.7 Calcium
Calcium content was determined by precipitation method as per Eagan et al. (1981).
3.3.2.8 Magnesium
Magnesium content was determined by Spectrophotometric method as per Ranganna (2001).
3.3.2.9 Iron
Iron content was determined by Spectrophotometric method as per Ranganna (2001).
3.3.2.10 Vitamin C
Vitamin C content was determined as per K.C. and Rai (2007).
3.3.3 Evaluation of microbiological quality
3.3.3.1 Total plate count (TPC)
TPC was carried out using the method of AOAC (2005).
3.3.3.2 Yeast and mold
Yeast and Mold was determined according to AOAC (2005).
3.3.5 Shelf life prediction
Following chemical and sensory analysis were carried out in each interval of 15 days.
3.3.1 Chemical analysis
3.3.1.1 Acid value
Acid value was determined according to Ranganna (2001).
3.3.1.2 Peroxide value
Peroxide value was determined according to Ranganna (2001).

58
3.4 Cost calculation
The cost of the best HEB formulations was calculated including a profit of 10% (Appendix D).
3.5 Data analysis
Data on sensory analysis were tabulated for comparison and were graphically represented
using Microsoft Excel-2007. Data were statistically processed by GenStat Discovery Edition
3, GenStat Procedure Library Release PL15.2, Version 7.22 DE (Copyright 2008, VSN
International Ltd) for Analysis of Variance (ANOVA). Means of the data were separated
whether they are significant or not by using LSD (least significance difference) method at 5%
level of significance.
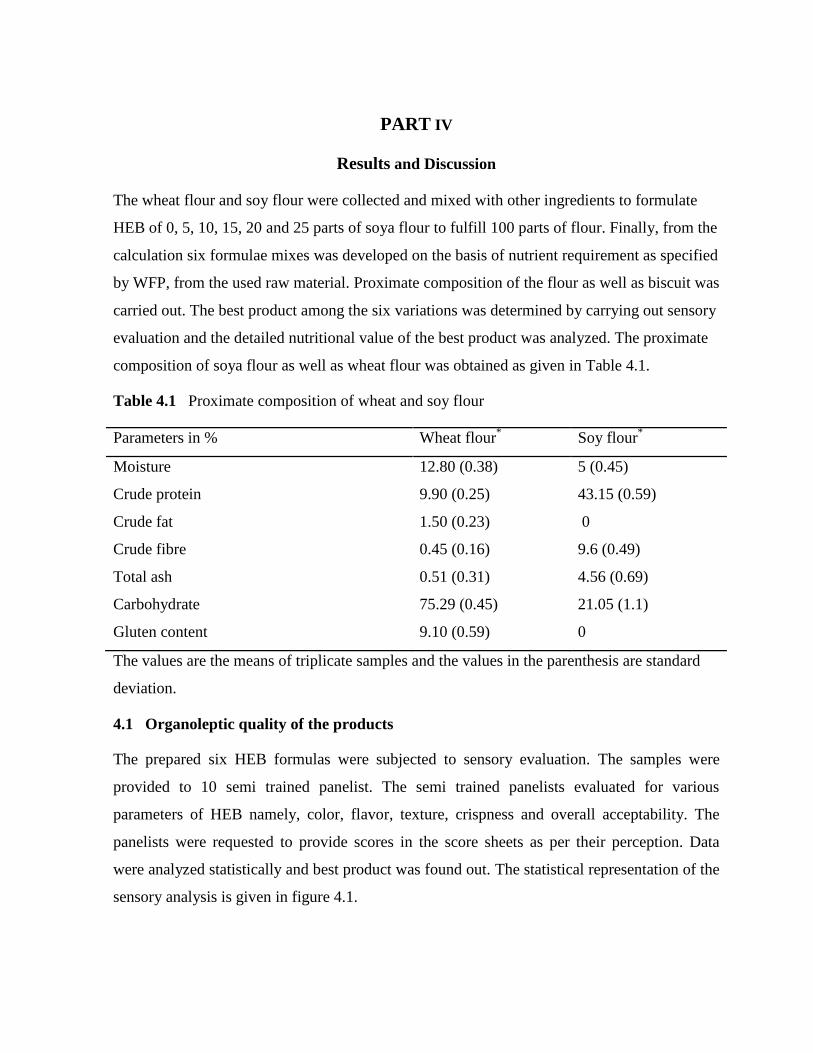
PART IV
Results and Discussion
The wheat flour and soy flour were collected and mixed with other ingredients to formulate
HEB of 0, 5, 10, 15, 20 and 25 parts of soya flour to fulfill 100 parts of flour. Finally, from the
calculation six formulae mixes was developed on the basis of nutrient requirement as specified
by WFP, from the used raw material. Proximate composition of the flour as well as biscuit was
carried out. The best product among the six variations was determined by carrying out sensory
evaluation and the detailed nutritional value of the best product was analyzed. The proximate
composition of soya flour as well as wheat flour was obtained as given in Table 4.1.
Table 4.1 Proximate composition of wheat and soy flour
Parameters in % Wheat flour* Soy flour
*
Moisture 12.80 (0.38) 5 (0.45)
Crude protein 9.90 (0.25) 43.15 (0.59)
Crude fat 1.50 (0.23) 0
Crude fibre 0.45 (0.16) 9.6 (0.49)
Total ash 0.51 (0.31) 4.56 (0.69)
Carbohydrate 75.29 (0.45) 21.05 (1.1)
Gluten content 9.10 (0.59) 0
The values are the means of triplicate samples and the values in the parenthesis are standard
deviation.
4.1 Organoleptic quality of the products
The prepared six HEB formulas were subjected to sensory evaluation. The samples were
provided to 10 semi trained panelist. The semi trained panelists evaluated for various
parameters of HEB namely, color, flavor, texture, crispness and overall acceptability. The
panelists were requested to provide scores in the score sheets as per their perception. Data
were analyzed statistically and best product was found out. The statistical representation of the
sensory analysis is given in figure 4.1.

60
The similar alphabet above the error bars indicate that the samples are not significantly
different (p>0.05) and the error bar represents the standard deviation.
Fig. 4.1 Average sensory score for six different formulas
The ANOVA at 95% level of confidence (p > 0.05) showed that the formula- A, B, C, D, E
and F were significantly different from each other in sensory attributes.
4.1.1 Color
The average sensory score for color was 6.9, 7.2, 7.7, 7.1, 7.0 and 6.6 for sample A, B, C, D, E
and F respectively. The analysis of variance showed that in case of color, sample A, B, C and
D showed significant difference with sample E and F (p>0.05).
The soy enrichment in biscuits had significant effect in color, as was observed by Akubor
and Ukwuru (2005). The color of the biscuit changed from creamy to dark brown, with an
increase in sensory score from 6.9 to 7.7 and then decrease up to 6.6, when soy flour was
enriched from 0% to 25%. The biscuit with 10 parts soy flour had the highest sensory score.
The darker color may be due to Maillard reaction between reducing sugar and protein
(Dhingra and Jood 2000). In this case, an increase in protein content, especially the higher
lysine, from soy flour probably caused the darker crust color (Bertram, 1953).
a ab aab a
cda a a a a c
ab ab a a aa
a abc ab ab a bb bc b b b deb
cc b
b e
0123456789
Colour Flavour Texture Crispness Taste Overall Acceptability
Aver
age
Sen
sory
Sco
re
Sensory parameters
A B C D E F
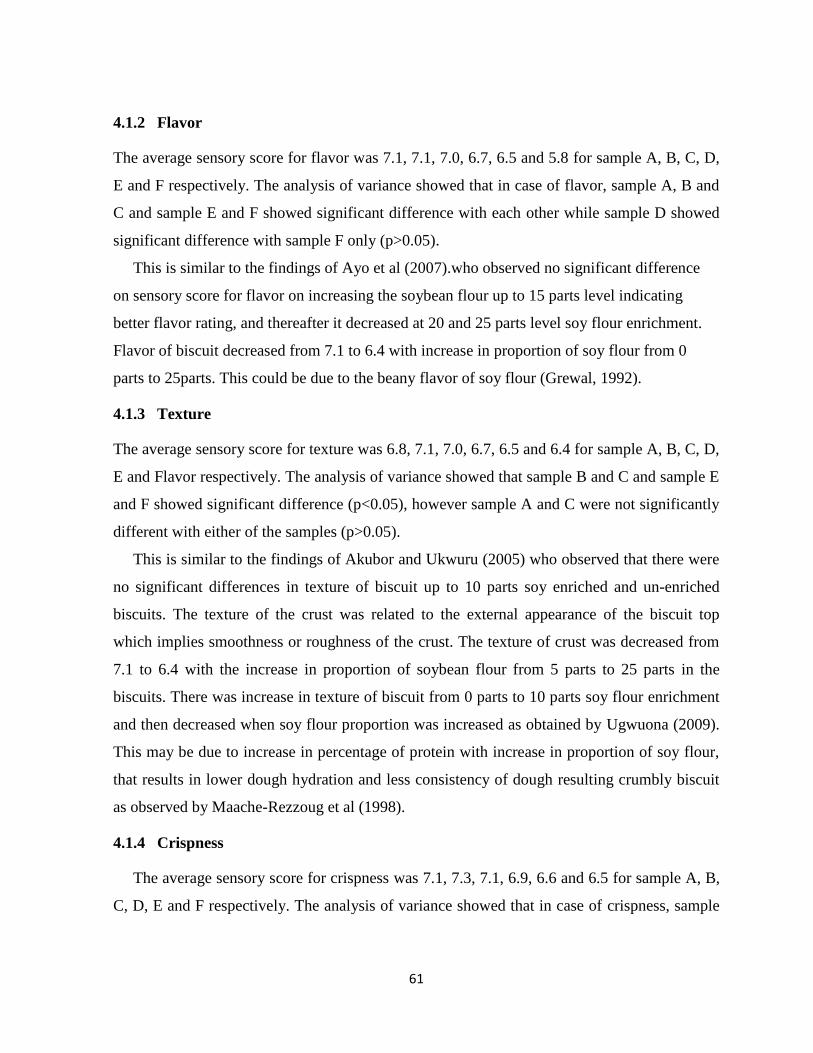
61
4.1.2 Flavor
The average sensory score for flavor was 7.1, 7.1, 7.0, 6.7, 6.5 and 5.8 for sample A, B, C, D,
E and F respectively. The analysis of variance showed that in case of flavor, sample A, B and
C and sample E and F showed significant difference with each other while sample D showed
significant difference with sample F only (p>0.05).
This is similar to the findings of Ayo et al (2007).who observed no significant difference
on sensory score for flavor on increasing the soybean flour up to 15 parts level indicating
better flavor rating, and thereafter it decreased at 20 and 25 parts level soy flour enrichment.
Flavor of biscuit decreased from 7.1 to 6.4 with increase in proportion of soy flour from 0
parts to 25parts. This could be due to the beany flavor of soy flour (Grewal, 1992).
4.1.3 Texture
The average sensory score for texture was 6.8, 7.1, 7.0, 6.7, 6.5 and 6.4 for sample A, B, C, D,
E and Flavor respectively. The analysis of variance showed that sample B and C and sample E
and F showed significant difference (p<0.05), however sample A and C were not significantly
different with either of the samples (p>0.05).
This is similar to the findings of Akubor and Ukwuru (2005) who observed that there were
no significant differences in texture of biscuit up to 10 parts soy enriched and un-enriched
biscuits. The texture of the crust was related to the external appearance of the biscuit top
which implies smoothness or roughness of the crust. The texture of crust was decreased from
7.1 to 6.4 with the increase in proportion of soybean flour from 5 parts to 25 parts in the
biscuits. There was increase in texture of biscuit from 0 parts to 10 parts soy flour enrichment
and then decreased when soy flour proportion was increased as obtained by Ugwuona (2009).
This may be due to increase in percentage of protein with increase in proportion of soy flour,
that results in lower dough hydration and less consistency of dough resulting crumbly biscuit
as observed by Maache-Rezzoug et al (1998).
4.1.4 Crispness
The average sensory score for crispness was 7.1, 7.3, 7.1, 6.9, 6.6 and 6.5 for sample A, B,
C, D, E and F respectively. The analysis of variance showed that in case of crispness, sample

62
A, B and C and sample E and F showed significant difference with each other. However,
sample D was not significantly different with any of the samples (p>0.05).
The sensory score showed no significance difference in crispness, with soy flour up to
15%, however gradual decrease in the crispness was observed. This might have been due to
the effect of the oil in the soy flour (Oluwamukomi et al, 2010).
4.1.5 Taste
The average sensory score for taste was 7.4, 7.2, 7.2, 7.0, 6.3 and 5.9 for sample A, B, C, D, E
and F respectively. The analysis of variance showed that in case of taste, sample A, B, C and
D and sample E and F showed significant difference with each other (p>0.05).
This is similar to the findings of Banureka and Mahendran (2009) who observed that there
were no significant differences in taste of biscuit up to 15 parts soy enriched and un-enriched
biscuits. The score for taste is decreased from 7.4 to 6 with the increase in the level of
substitution of soy flour. Biscuit containing 25 parts soybean flour was rated poorest in taste.
The biscuit with 0 parts soy flour has the highest mean value and 25 parts soy flour added
biscuit has the least mean value. This change in taste may be due to combined effect of
Maillard reaction between reducing sugar and protein (Dhingra and Jood, 2000) and beany-
flavor of soybean (Rastogi and Singh, 1989).
4.1.6 Overall acceptability
The average sensory score for overall acceptance was 6.7, 6.9, 7.8, 7.3, 6.6 and 6.4 for sample
A, B, C, D, E and F respectively. Sample C was significantly different from other samples and
had the highest sensory score.
As obtained by Banureka and Mahendran (2009), from the overall acceptance rating, 10%
soybean flour incorporated biscuit obtained the highest preference compared to others. At this
level of soy flour incorporation, biscuits had higher scores for all the sensory attributes
evaluated. Above and below this level, biscuits received lower sensory scores with the least
score at 25 parts soy flour incorporation. This may be because of higher sensory scores for
other sensory attributes at this level. The higher levels from 10 parts of soy flour let to the
increase in the acceptability of the product declined due to compact texture of the crumb and
the strong flavor (Dhingra and Jood, 2004).
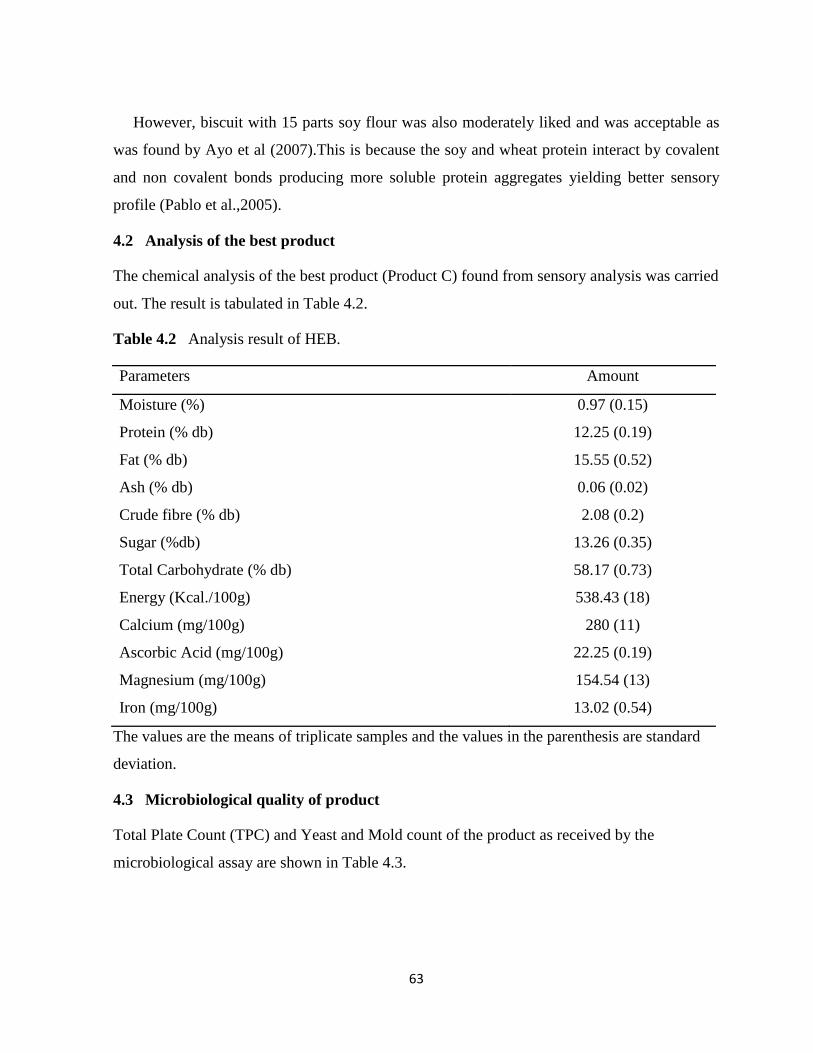
63
However, biscuit with 15 parts soy flour was also moderately liked and was acceptable as
was found by Ayo et al (2007).This is because the soy and wheat protein interact by covalent
and non covalent bonds producing more soluble protein aggregates yielding better sensory
profile (Pablo et al.,2005).
4.2 Analysis of the best product
The chemical analysis of the best product (Product C) found from sensory analysis was carried
out. The result is tabulated in Table 4.2.
Table 4.2 Analysis result of HEB.
Parameters Amount
Moisture (%) 0.97 (0.15)
Protein (% db) 12.25 (0.19)
Fat (% db) 15.55 (0.52)
Ash (% db) 0.06 (0.02)
Crude fibre (% db) 2.08 (0.2)
Sugar (%db) 13.26 (0.35)
Total Carbohydrate (% db) 58.17 (0.73)
Energy (Kcal./100g) 538.43 (18)
Calcium (mg/100g) 280 (11)
Ascorbic Acid (mg/100g) 22.25 (0.19)
Magnesium (mg/100g) 154.54 (13)
Iron (mg/100g) 13.02 (0.54)
The values are the means of triplicate samples and the values in the parenthesis are standard
deviation.
4.3 Microbiological quality of product
Total Plate Count (TPC) and Yeast and Mold count of the product as received by the
microbiological assay are shown in Table 4.3.

64
Table 4.3 Microbiological assay of the products
Parameters cfu/g
TPC <1000
Yeast & Molds 48
4.4 Conformance of best product with WFP specification
The analytical results of the best product showed conformance with the WFP specification.
However, some toxicological test analysis and vitamin analysis could not be performed due to
laboratory and time constrictions.
4.5 Shelf life evaluation of the HEB
The shelf life of the HEB was studied for 12 weeks. The product was packed in P2 (laminate
PET + metallic BOPP) and P1 (laminate PET + BOPP) bags and stored at room temperature.
The acid value and peroxide value of extracted fat of the product was evaluated from the date
of manufacture up to 12 weeks, and sensory evaluation was done in each week till 12th week
to check the acceptability.
4.5.1 Changes in acid value
In general, the acid value is the indication of free fatty acid content in the product. The
increment in the free fatty acid of the product was found increased with storage time and also
depends on packaging material. After twelve weeks of storage, the acid value increment was
found minimum in P2 (laminate PET + metallic BOPP) while maximum oxidation of fat
obtained in P1 (laminate PET + BOPP). The acid value (AV) of the product was observed to
be 0.12 at initial which reached 0.29 in P2 (laminate PET + metallic BOPP) and 0.35 in P1
(laminate PET + BOPP) within 12 weeks. The value of extracted fat acidity obtained was far
below the unacceptable level of maximum 1 mg KOH/ gm oil till the last date of analysis. The
changes in the acid value is shown in figure 4.2.

65
Fig. 4.2 Changes in acid value during storage
From the result of statistical analysis (Appendix C), variation in packaging material had no
significant effect on acid value but storage time had significant effect on acid value of product.
According to Hamilton (1983), rancidity can be the subjective organoleptic appraisal of the off
flavor quality of food. Rancid off-flavors are concerned with the changes that result from
reaction with atmospheric oxygen i.e. oxidative rancidity or by hydrolytic reactions catalyzed
by lipases from food or from microorganisms. The change of acid value increment of the
sample could easily be evaluated by Fig. 4.2.
4.5.2 Changes in peroxide value
Peroxide value is a very sensitive indicator of the early stages of oxidative deterioration of fats
and oils. PV therefore provides a means of predicting the risk of the development of flavor
rancidity. After twelve weeks of storage, the peroxide value increment was found minimum in
P2 (laminate PET + metallic BOPP) while maximum increment of peroxide was obtained in
P1 (laminate PET + BOPP).
The peroxide value (PV) of the product was observed to be 0.87 at initial which reached
1.18 and 1.4 in P2 (laminate PET + metallic BOPP) and P1 (laminate PET + BOPP) at 40ºC
respectively within 12 weeks. The value of PV obtained was far below the unacceptable level
0
0.1
0.2
0.3
0.4
0.5
0 2 4 6 8 10 12
Aci
d V
alu
e
Weeks
P1 P2
66
of maximum 3 meqv peroxide/kg fat. The change in peroxide value of the product is shown in
Fig. 4.3.
Fig. 4.3 Changes in peroxide value during storage
According to Hudson (1983), peroxide values are very sensitive indications of the early
stage of oxidative deterioration. Though peroxides and hydro-peroxides of oils and fats are
themselves tasteless, their presence is a sure indicator of flavor deterioration to come, since
they are comparatively unstable. They will break down inevitably at ambient temperature to
yield a range of off-flavors in the form of small molecules, especially carbonyl compounds.
4.5.3 Sensory analysis
4.5.3.1 Changes in color
Average sensory scores given by the 10 panelists were tabulated in Table C.1.9 and Table
C.1.10 and the changes in color of the product was used for the comparative study between
two packaging materials stored at 40ºC temperature with increase in storage time.
0.5
0.7
0.9
1.1
1.3
1.5
0 2 4 6 8 10 12
Per
ox
ide
Val
ue
Weeks
P1 P2

67
Fig. 4.4 Changes in color during storage at 40ºC temperature
Color, which can be judged by the eye, is the first importance in food selection (Ranganna,
2001). In the study (Fig. 4.4) the mean sensory for color at first was found to be slightly
increased then afterward were found to be decreasing within the time. From the result of
statistical analysis (Table C.1.3) it can be concluded that variation in packaging material had
no significant (p>0.05) effect on the color of the product, but the storage time significantly
affected (P<0.05) its color.
4.5.3.2 Changes in flavor
Flavor is the second important attributes of the product. Flavor embraces the senses of taste,
smell and feeling. As far as human beings are concerned, it is generally agreed that the sense
of taste is limited to sweet, sour, salty and bitter.
Average sensory scores given by the 10 panelists were tabulated in Table C.1.9 and Table
C.1.10 and the changes in flavor of the product was used for the comparative study between
two packaging materials stored at 40ºC temperature with increase in storage time. From the
analysis (Fig. 4.5), it can be summarized that there is gradual reduction of mean sensory score
of all the samples at both the condition. From the result of statistical analysis (Table C.1.4) it
can be concluded that variation in packaging material had no significant (p>0.05) effect on the
mean sensory score for flavor of the product, but the storage time significantly affected
(P<0.05) its flavor.
123456789
0 2 4 6 8 10 12
Aver
age
senso
ry s
core
Weeks
P1 P2

68
Fig. 4.5 Changes in flavor during storage at 40ºC temperature.
The major factor responsible for the flavor changes in the product are all the chemical
parameters simultaneously occurred during the period of storage. Increased moisture content
can lower the flavorings ability of product and similarly formation of free fatty acid and
peroxides can give the off-rancid flavor to the product.
4.5.3.3 Changes in texture
Texture is another important sensory attribute, which evaluates the product with perception of
tongue and acceptance of body.
Average sensory scores given by the 10 panelists were tabulated in Table C.1.9 and Table
C.1.10 and the changes in texture of the product was used for the comparative study between
two packaging materials stored at 40ºC temperature with increase in storage time.
From the analysis (Fig. 4.6) it was found that there is also gradual decrease in sensory score
for texture. From the statistical analysis (Table C.1.9) it was found that, variation in packaging
material had no significance difference in taste (p>0.05) but only the effect of storage time.
123456789
0 2 4 6 8 10 12
Aver
age
senso
ry s
core
Weeks
P1 P2

69
Fig. 4.6 Changes in texture during storage at room temperature.
4.5.3.4 Changes in crispness
Crispness is another important sensory attribute, which evaluates the product with bite and
perception of tongue.
Fig. 4.7 Changes in Crispness during storage at 40ºC temperature.
Average sensory scores given by the 10 panelists were tabulated in Table C.1.9 and Table
C.1.10 and the changes in taste of the product was used for the comparative study between
two packaging materials stored at 40ºC temperature with increase in storage time.
From the analysis (Fig. 4.7) it was found that there is also gradual decrease in sensory score
for crispness. From the statistical analysis (Table C.1.8) it was found that, variation in
123456789
0 2 4 6 8 10 12
Aver
age
senso
ry s
core
Weeks
P1 P2
123456789
0 2 4 6 8 10 12
Aver
age
senso
ry s
core
Weeks
P1 P2
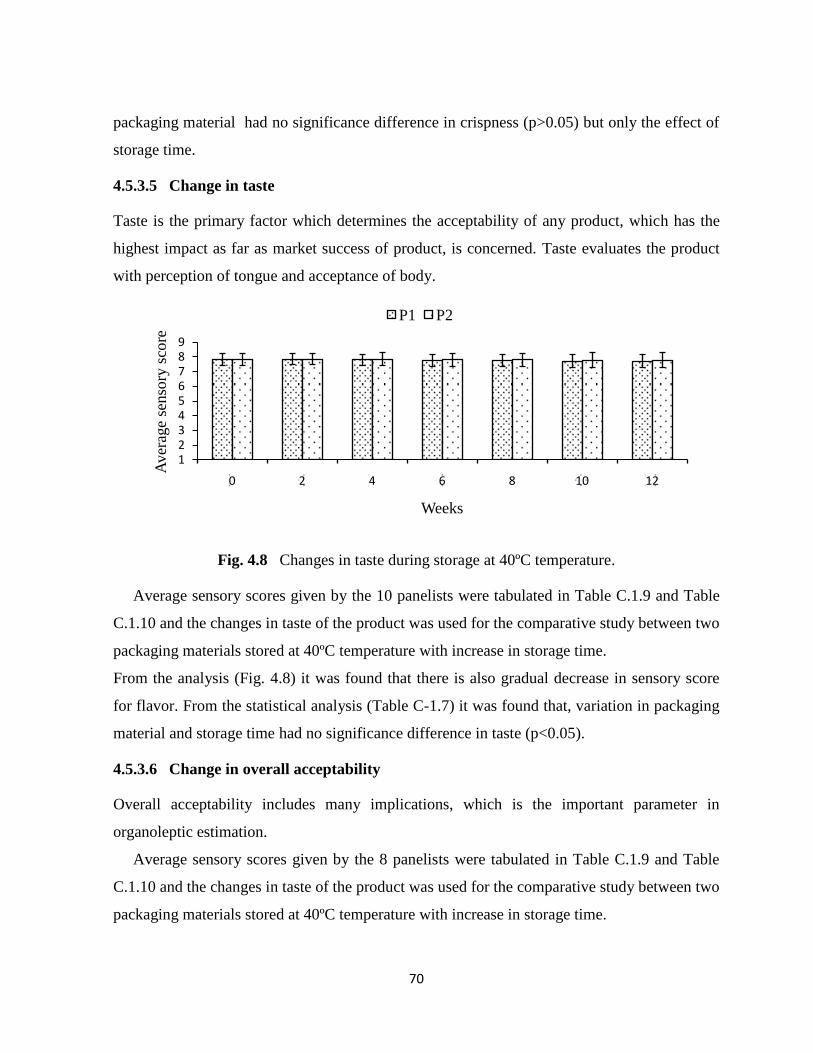
70
packaging material had no significance difference in crispness (p>0.05) but only the effect of
storage time.
4.5.3.5 Change in taste
Taste is the primary factor which determines the acceptability of any product, which has the
highest impact as far as market success of product, is concerned. Taste evaluates the product
with perception of tongue and acceptance of body.
Fig. 4.8 Changes in taste during storage at 40ºC temperature.
Average sensory scores given by the 10 panelists were tabulated in Table C.1.9 and Table
C.1.10 and the changes in taste of the product was used for the comparative study between two
packaging materials stored at 40ºC temperature with increase in storage time.
From the analysis (Fig. 4.8) it was found that there is also gradual decrease in sensory score
for flavor. From the statistical analysis (Table C-1.7) it was found that, variation in packaging
material and storage time had no significance difference in taste (p<0.05).
4.5.3.6 Change in overall acceptability
Overall acceptability includes many implications, which is the important parameter in
organoleptic estimation.
Average sensory scores given by the 8 panelists were tabulated in Table C.1.9 and Table
C.1.10 and the changes in taste of the product was used for the comparative study between two
packaging materials stored at 40ºC temperature with increase in storage time.
123456789
0 2 4 6 8 10 12
Aver
age
senso
ry s
core
Weeks
P1 P2
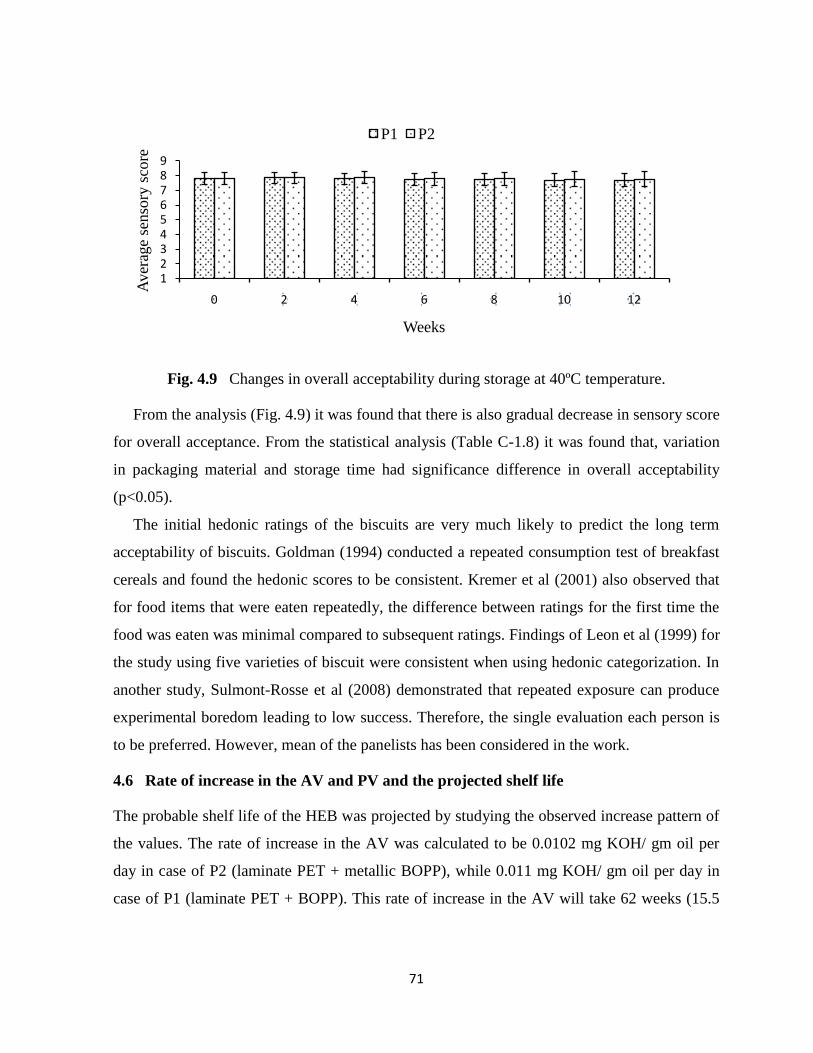
71
Fig. 4.9 Changes in overall acceptability during storage at 40ºC temperature.
From the analysis (Fig. 4.9) it was found that there is also gradual decrease in sensory score
for overall acceptance. From the statistical analysis (Table C-1.8) it was found that, variation
in packaging material and storage time had significance difference in overall acceptability
(p<0.05).
The initial hedonic ratings of the biscuits are very much likely to predict the long term
acceptability of biscuits. Goldman (1994) conducted a repeated consumption test of breakfast
cereals and found the hedonic scores to be consistent. Kremer et al (2001) also observed that
for food items that were eaten repeatedly, the difference between ratings for the first time the
food was eaten was minimal compared to subsequent ratings. Findings of Leon et al (1999) for
the study using five varieties of biscuit were consistent when using hedonic categorization. In
another study, Sulmont-Rosse et al (2008) demonstrated that repeated exposure can produce
experimental boredom leading to low success. Therefore, the single evaluation each person is
to be preferred. However, mean of the panelists has been considered in the work.
4.6 Rate of increase in the AV and PV and the projected shelf life
The probable shelf life of the HEB was projected by studying the observed increase pattern of
the values. The rate of increase in the AV was calculated to be 0.0102 mg KOH/ gm oil per
day in case of P2 (laminate PET + metallic BOPP), while 0.011 mg KOH/ gm oil per day in
case of P1 (laminate PET + BOPP). This rate of increase in the AV will take 62 weeks (15.5
123456789
0 2 4 6 8 10 12
Aver
age
senso
ry s
core
Weeks
P1 P2
72
months) in P2 (laminate PET + metallic BOPP) and 46 weeks (11.5 months) in P1 (laminate
PET + BOPP) to cross the unacceptable value of AV which is 1 mg KOH/ gm oil per day.
Similarly, the rate of increase in the PV was calculated to be 0.0579 meqv peroxide/kg fat
per day in case of P2 (laminate PET + metallic BOPP), while 0.0625 meqv peroxide/kg fat per
day in case of P1 (laminate PET + BOPP).
This rate of increase in the PV will take 82 weeks (20.5 months) in P2 (laminate PET +
metallic BOPP) and 48 weeks (12 months) in P1 (laminate PET + BOPP) to cross the
unacceptable value of PV which is 3 mg KOH/ gm oil per day. Although this is just a
theoretical value, a slight increase in the shelf life of the HEB.
4.7 Cost of product
The cost of most preferred HEB (sample C) is NRs. 11.91 per 100gm including overhead cost
and profit of 10%. (Calculation is given in Appendix D).

Part V
Conclusions and recommendations
5.1 Conclusion
On the basis of the study carried out, the following conclusions were drawn.
a. High energy biscuit prepared by using wheat: soy flour in the ratio 90:10 was found to
be the best in terms of sensory analysis and showed that it meets the minimal
nutritional requirements of a person during catastrophic conditions as specified by
WFP.
b. The sample packaged in two different packaging materials i.e. P1 (laminate PET +
BOPP) and P2 (laminate PET + metallic BOPP) at 40ºC temperature, gradual increase
of acid value and peroxide value. However the values were far below the standard
unacceptable range during the study for 12 weeks. Similarly decrease in color, flavor,
taste and texture sensory scores was found with storage time.
c. The total cost of HEB was calculated and found to be NRs. 11.91 per 100gm.
5.2 Recommendations
This study can be further continued with the following recommendations,
a. Study of the vitamin retention after baking should be carried out.
b. HEB can be a distinct nutritional supplement. Evaluation of nutritional quality (e.g.
PER, NPU, Digestibility etc) of the product should be studied.
c. Study of the amino acid profile and fatty acids composition of the prepared products
d. If HEB could be produced on an industrial scale for open market, children with severe
acute malnutrition will be greatly benefited in its use due to its comparatively low cost
with rich nutrients content.
e. Shelf life study using different packaging material and its optimization.
f. The shelf life of the HEB was found to be satisfactory in P2 (PET+ metallic BOPP).
Further studies on combination of packaging material can be done eg. metalized
laminate OPP 20micron/PR 3C/DRY/VMCPP 25micron.
g. Study for various flavored HEB production.
PART VI
Summary
Biscuits are the low cost, processed food which offers good taste along with nutritional values
at affordable price with convenient availability. Biscuits have in general, a good shelf life in
comparison to most of the other snack items. It is no more only viewed as a luxury tea item
snack, but as an essential daily food composition of an average Nepalese household. Since
biscuit is a kind of dry food having a long shelf life, the problem of deterioration is very low in
comparison to other bakery products. Biscuits owing to their shelf- life can be beneficial for
feeding programs and other immediate catastrophic conditions.
The present work is mainly focused on the preparation of High Energy Biscuit, used for as
food at emergency situations and at other times as nutritional supplement, considering the
problems of malnutrition and micronutrient deficiency and popular snack item amongst
people.
Wheat flour and soy flour was screened through sieve of pore size 0.046mm diameter and
proximate analysis was done. The moisture, fat, crude fiber, ash, protein, and gluten content
were found to be 12.80, 1.50, 0.45, 0.51, 9.90, 9.10 and 5.0, 19.5, 9.6, 4.56, 43.15, 0 gm per
100gm of wheat flour and soy flour respectively. The wheat flour and soy flour were mixed in
different proportions to make up 100 parts of flour i.e. A (100% wheat flour), B (95:5), C
(90:10), D (85:15), E (80:20) and F (75:25). The other ingredients palm oil, pulverized sugar,
salt, lecithin, invert sugar, sodium and ammonium bicarbonate and butter flavor were taken
constant. The six different biscuits samples were prepared and subjected to sensory evaluation.
The data obtained were statistically analyzed using two way ANOVA (no blocking) at 5%
level of significance which showed there exists significant difference (P ≤ 0.05) in overall
acceptability among the samples. Sample C (wheat flour: soy flour :: 90:10) got the highest
mean sensory score. According to Dhingra and Jood (2004), higher levels from 10% of soy
flour lead the acceptability of the product to decline due to compact texture of the crumb and
the strong flavor. Proximate analysis of sample C was then carried out and the moisture, fat,
crude fiber, protein, and ash content of HEB were found to be 0.97, 15.55, 2.08, 12.25 and
0.06 respectively.

75
The best ratio i.e. sample C was used for final preparation of biscuits and thus prepared
biscuits were packaged in P1 (laminate PET + BOPP) and P2 (laminate PET + metallic BOPP)
and stored at 40˚C. The samples were subjected for sensory analysis in every two weeks for 12
weeks. There was no significant difference (F pr.> 0.05) in mean sensory score of samples at
the zero week and last week for the color, flavor, crispness and taste of the biscuit with respect
to the packaging material, while the texture and overall appearance were found to have
significant difference (F pr.< 0.05). The samples showed significant difference (F pr.< 0.05) in
all sensory parameters with respect to the time of storage.
The chemical analysis i.e. AV and PV of the samples P1 (laminate PET + BOPP) and P2
(laminate PET + metallic BOPP) was done and the data were statistically analyzed by using
two way ANOVA (no blocking) at 5% level of significance. This showed that both the
packaging material shows the significant difference in AV of the product whereas there was
no significant difference in packaging material in case of PV of the product. Similarly, storage
time also showed the significant effect on the acid value, peroxide value, flavor and flavor and
texture of the product. From the self-life study through the rate of increment of acid value and
peroxide value, storage life up to 11.5 months and 15.5 months at 40˚C was determined for
sample P1 (laminate PET + BOPP) and P2 (laminate PET + metallic BOPP) respectively. The
rate of chemical changes was quite slower in sample packaged by P2 (laminate PET + metallic
BOPP) as well as most of the sensory attributes were also preserved.
The cost of the product was calculated on the basis of raw materials, ingredients used and
10% overhead cost of total ingredients and was found to be NRs. 11.91 per 100gm. These
costs vary with time and season.

References
Abdul Gapor, M.T. (1990) Content of vitamin E in palm oil and its antioxidant activity. Palm
Oil Devel.,12, 25–27.
Akubor P.I. and Ukwuru M.U. (2005) Functional properties and biscuit making potential of
soybean and cassava flour blends, Plant Foods for Human Nutrition, 58 (3): 1-12.
AOAC (2005). Official Method of Analysis of AOAC International, 18th eds. Edited by
Dr.William Horwitz, Dr. George W. Latimer.
Allen, L., De Benoist, B., Dary, O. & Hurrell, R. (2003). Guidelines on food fortification
withmicronutrients for the control of micronutrient malnutrition, Department of
nutrition for health and development, World health organization, Geneva.
Anon. (1995a). Indicators for tracking progress in IDD elimination. IDD Newsletter 10:4 pp.
38-40.
Anon. (1995b). Calcium fortification monitoring. Food labeling news 3:24 p. 9.
Anon. (1995c). Vitamin E fortification of fat-modified foods predicted, Food chemical news;
37:42, 39-40.
Arora, S.M. (1980). Handbook of baking products, 1st ed. SIRI world renowned institute for
industrial publications, Roopnagar, Delhi.
Arroyave, G. (1987). Alternative strategies with emphasis on food fortification, in ACC/SCN
state-of-the-art series, discussion paper No. 2, pp. 87-91.
Austin, J. E., Belding, T. K., Pyle, D., Solon, F. S., Fernandez, T. 1., Latham, M. C. and
Hopkin, B. M. (1981). Nutrtion intervention in developing countries - Study III:
Fortification. Oelgeschlager, Gunn and Hain Publishers, Cambridge, MA.
Ayo J.A., Ayo V.A., Nkama I., Adewori R. (2007). Physical, in-vitro digestibility and
organoleptic evaluation of “Acha” wheat biscuit supplemented with soybean flour.
Niger. Food J., 25: 77- 89.
Bailey, L. (1991). Vitamin and amino acid additives. In Nutrient Additions to Food. ed. J. C.
Bauernfeind and P. A. Lachance. Food and Nutrition Press, Connecticut.
Bansal S. (2009). Preparation of high protein biscuits from additional ingredients: soycurd, B.
Tech. (Food) Dissertation, Central Campus of Technology, T.U., Nepal
77
Banureka V.D. and Mahendran T. (2009). Formulation of wheat - soybean biscuits and its
quality characteristics, Tropical agricultural research & extension 12(2).
Bertram, G. L. (1953). Studies on crust color, I, The importanse of the browning reaction in
determining the crust of bread. Cereal Chem. 30:127.
Bohn, R.M. (1956). Biscuit and cracker production; A manual on the Technology and Practice
of biscuit, cracker and cookie manufacture including formulas, 1st
ed. American Trade
publishing company, New York.
Borenstein, B. (1987). The role of ascorbic acid in foods. Food Technology, 41 (11) 98-99.
Bower, C. & N. J. Wald (1995). "Vitamin B12 deficiency and the fortification of food with
folic acid." Eur J Clin Nutr 49(11): 787-93.
Boyacioglu M.H. (2006). Soy ingredients in baking. In: Riaz MN, editor. Soy applications in
food. Boca Raton : CRC Press. p 63–81.
Briggs & Mark Wahlqvist, (1988). Food Facts, Penguin Books Australia.
Cauvain, S.P., (2003). Introduction. In: Cauvin, S. P. (Ed.), Bread Making: Improving Quality.
CRC Press, New York. p.6
Clark R. (1995). FAO Technical consultation on Food Fortification: Technology and Quality
Control Rome, Italy, 20-23 November.
Day N‟Kouka K., Klein B.P., Lee S-Y. (2004). Developing a lexicon for descriptive analysis
of soymilks. J Food Sci 69(7):S259–63.
Dawadi, G. and V. Prakash. 2008. In: The Fifth National Conference on Sceince and
Technology (Abstracts), Nov. 10-12, 2008. Nepal Academy of Science Technology
(NAST), Kathmandu, Nepal
Dhingra S. and Jood S. (2000). Organoleptic and Nutrition Evaluation of wheat breads
supplemented with soybean and barley flour. Food Chem. 77:479-488.
Dhingra S. and Jood S. (2004). Effect of flour blending on functional, baking and organoleptic
characteristics of bread, International journal of food science & technology Vol.
39(2), pp. 213–222.
Duell, P. B. & M. R. Malinow (1997). "Homocyst(e)ine: an important risk factor for
atherosclerotic vascular disease." Curr Opin Lipidol 8(1): 28-34.
Dunn, J. A., & Bailey, C. H. (1928). Factors influencing checking in biscuits. Cereal Chem.,
5(5), 395±430.

78
Egan, H. Kirk R. S. and Saviyar R. (1981). Pearson's Chemical Analysis of Foods. 8th
Edn.
London: Churchill Livingstone, pp. 26 -28
FAO/WHO (1992). International Conference on Nutrition World Declaration and Plan of
Action for Nutrition
FAO/WHO (1994). Codex Alimentarius, Volume 4, 2nd edition.
Goldman, A. (1994). Predicting product performance in the market place by immediate and
extended use sensory testing. Food Technolol. 48 (10): 103-106
Grewal R.B. (1992) Nutritional Improvement of soybean through fermentation and its
utilization in Traditional foods of India Ph. D Thesis, CCS HAU, Itisar, India.
Hirsch, S., de la Maza, P., Barrera, G., Gattas, V., Petermann, M. & Bunout, D. (2002). "The
Chilean flour folic acid fortification program reduces serum homocysteine levels and
masks vitamin B-12 deficiency in elderly people." J Nutr 132(2): 289-91.
Heenan S. P., Dufour J. P., Hamid N., Harvey W., Delahunty C.M. (2008). The sensory
quality of fresh bread: descriptive attributes and consumer perceptions. Food Res
Intl 41(10):989–97.
Hoffpauer, D. W. and Wright, S. L. (1994). Enrichment of rice. In Rice Science and
Technology. ed., W. E. Marshall and J. I. Wadsworth. Marcel Rekker, New York, NY.
Hoseney, R. C. (1985). The mixing phenomenon. Cereal Food World. 30, 453.
Hurrell, R. F., Furniss, D. E., Burn, J., Whittaker, P., Lynch, S. R. and Cook, J. D. (1989). Iron
fortification of infant cereals. Am. J. Clin. Nutr. 49 (6) 1274-1282.
Hurrell, R. F. and Cook, J. D. 1990. Strategies for iron fortification of foods. Trends in Food
Science and Technology, (9), 56-60.
Jacques, P. F., Selhu, J., Bostom, A. G., Wilson, P. W. F. and Rosenberg, I. H. (1999). "The
Effect of Folic Acid Fortification on Plasma Folate and Total Homocysteine
Concentrations." N. Engl. J. of Med. 340(19): 1449-54.
Jacques, P. F., Bostom, A. G., Wilson, P. W., Rich, S., Rosenberg, I. H.& Selhub, J. (2001).
"Determinants of plasma total homocysteine concentration in the Framingham
Offspring cohort." Am J Clin Nutr 73(3): 613-21.
K.C. J. B. (2007). Traditional foods. In: “Technology Involved and Growth of Traditional and
Modern Food Industries of Dharan”. Vol. I, pp. 5-7.
K.C. J. B. and Rai B. K. (2007). Basic Food analysis Handbook pp.76-82
79
Kirwan M. J. and Strawbridge J. W. (2003). Plastics in food packaging. In: Food Packaging
Technology. (Coles R., McDowell D. and Kirwan M. J., eds) Pp 189-208. Blackwell
Publishing CRC Press
Kramer, F. M., Lesher, L. L., and Meiselman, H. L. (2001). Monotony and choice: Reported
serving of the same item to soldiers under field conditions. Appetite 36:239-240.
Kelly, P. J., Shih, V. E., Kistler, J. P., Barron, M., Lee, H., Mandell, R. & Furie, K. L. (2003).
"Low Vitamin B6 but Not Homocyst(e)ine Is Associated With Increased Risk of
Stroke and Transient Ischemic Attack in the Era of Folic Acid Grain Fortification."
Stroke, May 8.
Kent, N.L. (1983). Technology of Cereals, 3rd ed., p. 4. Pergamon Press Ltd., London.
King J.M., Chin S.M., Svendsen L.K., Reitmeier C.A., Johnson L.A., Fehr
W.R. (2001). Processing of lipoxygenase-free soybeans and evaluation in foods. J Am
Oil Chem Soc 78(4):353–60.
Kuhajek, E. J. and Fiedelman, H.W. (1973). Nutritional iodine in processed foods. Food
Technology, 27 (1) 52-53
Kumar, K.R. (2001). Selection of Packaging Materials Based on Product Characteristics and
Shelf Life Ealuation Methods. Short Term Training Programme. Human Resources
Development Department. Central Food Technological Research Institute. Mysore,
570:13, 16-40.
Labuza, T. P., Tannenbaum, S. R. and Karel, M. (1970). Water content and stability of
intermediate-moisture foods. Food Technol. 24:5, pp. 35-40.
Lachance, P. A. and Bauernfeind, J.C. (1991). Concepts and practices of nitrifying foods. In
Nutrient Additions to Food, ed. J. C. Bauernfeind and P. A. Lachance. Food and
Nutrition Press, Connecticut.
Leon, F., Couronnr, T., Marcuz, M. C., and Koster, E. P. (1999). Measuring food liking in
children: Allied Shruti Traders, Adarsanagar, Birganj comparisation of non-verbal
methods. Food Qual. Pref. 10:93-100.
Liu K.S. (1999). Soybeans: chemistry, technology and utilization. Gaithersburg , Aspen
Publishers Inc. p 356–7.

80
Maache-Rezzoug, Z., Bouvier, J. M., Allaf, K., & Patras, C. (1998). Effect of principal
ingredients on rheological behaviour of biscuit dough and on quality of biscuits.
Journal of Food Engineering, 35, 23–42.
Manley, D. (1983). Technology of biscuits, crackers and cookies. Ellis Horwood Limited.
West Sussex, England.
Manley, D. (1998). Biscuits, cookie and cracker manufacturing manuals. Woodhead
publishing limited, Cambridge England.
Manley, D. (2000). Technology of biscuits, cracker and cookies. Woodhead publishing
limited, Cambridge England
Manley, D. (2001). Biscuit, cracker and cookie recipes for the food industry .Woodhead
publishing limited, Cambridge England
Mukhopadhyay, M. (1990). A seminar paper on process of manufacturing quality biscuits and
new product development, Britannia Industries Limited., Calcutta.
Oluwamukomi M. O., Oluwalana I. B., and Akinbowale O.F. (2010). Physicochemical and
sensory properties of wheat cassava composite biscuit enriched with soy flour,
Department of Food Science and Technology, Federal University of Technology,
Akure, Nigeria.
Pablo, D., Ribotta, Alberto Edel Leon, Gabriet, T. Perez and Maria Cristin Anon, (2005).
Eletrophoresis studies for determining wheat soy protein ineractions in dough and
bread. European Food Res. Technol., 221: 48-53.
Paine, F.A., Paine, H.Y. (1983). A hand book of food packaging, Dried and Chemically
preserved foods, The council of the institute of packaging.
Parman, G. K. and Salinard, G. J. (1981). Vitamins as ingredients in food processing. In
Fundamentals of Food Processing Operations, ed. J. L. Heid and M. L. Joslyn, AVI
Publishing Co., Westport, Connecticut, pp. 188-208.
Ranganna, S. (2001). Handbook of Analysis and Quality Control for Fruit and Vegetable
Products. TaTa McGraw-Hill Publishing Co. Ltd.
Rao, S. K., Rajendran, S., Rajeshwara, A.N. and Prakash, V. (1991). Journal of Protein
Chemistry. 10, 291–299.
81
Rastogi A. and Singh G. (1989). Effect of addition of full fat soybean flour of different
varieties in quality characteristics and bread making quality of white flour Bulletin of
Grain Technology 27:26, 34.
Ray, J. G., Cole, D. E., Boss, S. C. (2000). "An Ontario-wide study of vitamin B12, serum
folate, and red cell folate levels in relation to plasma homocysteine: is a preventable
public health issue on the rise?" Clin Biochem 33(5): 337-43
Riaz M. N. (1999). Healthy baking with soy ingredients.
Russell T.A., Drake M.A., Gerard P.D. (2006). Sensory properties of whey and soy proteins. J
Food Sci 71(6):S447–55
Shogren R.L., Hareland G.A., Wu Y.V. (2006). Sensory evaluation and composition of
spaghetti fortified with soy flour. J Food Sci 71:S428–32.
Shrestha, R. (1995). Preparation of high protein biscuits from additional ingredients: soycurd,
B. Tech. (Food) Dissertation, Central Campus of Technology, T.U., Nepal
Smith, W.H., (1972). Biscuits, Crackers and Cookies Vol 1: Technology, Production and
Management. Applied Science Publishers, London.
Stauffer C.E. (2005). Soy protein in baking, 2nd
ed.
Sulmont-Rosse, C., Chabanet, C., Issanchou, S., and Koster, E.P. (2008). Impact of the arousel
potential of uncommon drinks on the reported mexposure effect. Food Qual. Pref.
19:412-420.
Sultan, W.J. (1965). 'Recipes for biscuits and muffins' in practical baking. pp 194-207. The
AVI publishing company, Westport
Tannenbaum, S. R., Young, V. R. and Archer, M. (1985). Vitamins and minerals. In Food
Chemistry. 2nd edition, ed. 0. R. Fennema, Marcel Dekker Inc., NY. pp. 477-543
Tannahil, R. 1975. Food in history, Granada/Paladin, St. Albans, U.K.
Ugwuona, F. U. (2009). Chemical and sensory evaluation of soy-fortified cassava wheat
biscuit, Journal of tropical agriculture, Food, environment and extension, vol. 8(1) pp.
55-59.
USDEC. Bakery applications for milk powders.
http://www.usdec.org/files/pdfs/USMP59-70.pdf
Wade and Peter. (1988). Biscuits, Cookies and Crackers, Volume 1, The principles of the
Craft. Elsevier Applied Science, London and New York

82
WFP/WHO (2010). Technical Specifications of: High Energy Biscuits
WFP/WHO (2006). EMOP 10487.0 “Regional Emergency Preparedness Operation to Pre-
position High Energy Biscuits in Latin America and the Caribbean”
Whitely, P.R. (1971). Biscuit Manufacture, Applied Science Publishers Ltd., England
Wesley, A, and P. Ranum, (2004). Fortification Handbook: Vitamin and mineral fortification
of wheat flour and maize meal. Ottawa: Micronutrient Initiative.
http://www.micronutrient.org/resources/publications/Fort handbook.pdf
Yan, L., Prentice, A., Zhang, H., Wang, X., Stirling, D. M. & Golden, M. M. (2000). "Vitamin
D status and parathyroid hormone concentrations in Chinese women and men from
north-east of the People's Republic of China." Eur J Clin Nutr 54: 68-72.

Appendices
Appendix-A
1. Sensory Evaluation Card
Sensory Evaluation Sheet
Of High Energy Biscuit
Prepared By: AnujNiroula
Purpose: Dissertation for the partial fulfillment of the requirements for the degree Of
Bachelor‟s Degree in Food Technology (B. Tech. Food)
Name of Panelist:
Age:
Dear Panelist, you are given 6 sample of HEB, please conduct the sensory analysis based on
the following parameter using the table given
Sample Color Flavor Taste Texture Overall
acceptance
A
B
C
D
E
F
Comment (if any)
………………………………………………………………………………..…………………
…………………………………………………………………………...........
…………………...
Signature
Thank You!!!
Like Extremely 9
Like Very much 8
Like Moderately 7
Like Slightly 6
Neither like nor dislike 5
Dislike Slightly 4
Dislike Moderately 3
Dislike very much 2
Dislike Extremely 1

84
Appendix-B
1. Sensory evaluation of the product
Table B.1.1 Two way ANOVA (no blocking) for color
Source of variation d.f. s.s. m.s. v.r. F pr.
Formulation 5 9.483 1.8967 9.47 <.001
Panelist 9 2.483 0.2759 1.38 0.227
Residual 45 9.017 0.2004
Total 59 20.98
Since F pr. < 0.05, there is significant difference between the samples so LSD testing is
necessary.
Table B.1.2 LSD for color
Sample Mean score LSD at 0.05 Mean difference Remarks
A 6.9 0.4032 B-A= 0.3 A-F= 0.5* >LSD*
B 7.2 C-B= 0.5* B-D= 0.1 <LSD
C 7.7 C-D= 0.6* B-E= 0.4
D 7.1
D-E= 0.3 B-F= 0.8*
E 6.8
E-F= 0.4 C-E= 0.9*
F 6.4
C-A= 0.8* C-F= 1.3*
D-A= 0.2 D-F= 0.7*
A-E= 0.1
(* = Significantly different)
Table B.1.3 Two way ANOVA (no blocking) for for crispness
Source of variation d.f. s.s. m.s. v.r. F pr.
Sample 5 4.8833 0.9767 4.14 0.004
Panelist 9 1.0833 0.1204 0.51 0.859
Residual 45 10.6167 0.2359
Total 59 16.5833
Since F pr. < 0.05, there is significant difference between the samples so LSD testing is
necessary.

85
Table B.1.4 LSD for crispness
Sample Mean score LSD at 0.05 Mean difference Remarks
A 7.1 0.4375 A-B= -0.2 A-F= 0.6* >LSD*
B 7.3 B-C= 0.2 B-D= 0.4 <LSD
C 7.1 C-D= 0.2 B-E= 0.7*
D 6.9
D-E= 0.3 B-F= 0.8*
E 6.6
E-F= 0.1 C-E= 0.5*
F 6.5
A-C= 0 C-F= 0.6*
A-D= 0.2 D-F= 0.4
A-E= 0.5*
(* = Significantly different)
Table B.1.5 Two way ANOVA (no blocking) for flavor
Source of variation d.f. s.s. m.s. v.r. F pr.
Sample 5 12.6 2.52 12.51 <.001
Panelist 9 2.9333 0.3259 1.62 0.139
Residual 45 9.0667 0.2015
Total 59 24.6
Since F pr. < 0.05, there is significant difference between the samples so LSD testing is
necessary.
Table B.1.6 LSD for flavor
Sample Mean score LSD at 0.05 Mean difference Remarks
A 7.1 0.4043 A-B= 0 A-F= 1.3 >LSD*
B 7.1 B-C= 0.1 B-D= 0.4 <LSD
C 7 C-D= 0.3 B-E= 0.6*
D 6.7
D-E= 0.2 B-F= 1.3*
E 6.5
E-F= 0.7* C-E= 0.5*
F 5.8
A-C= 0.1 C-F= 1.2
A-D= 0.4 D-F= 0.9*
A-E= 0.6*
(* = Significantly different)
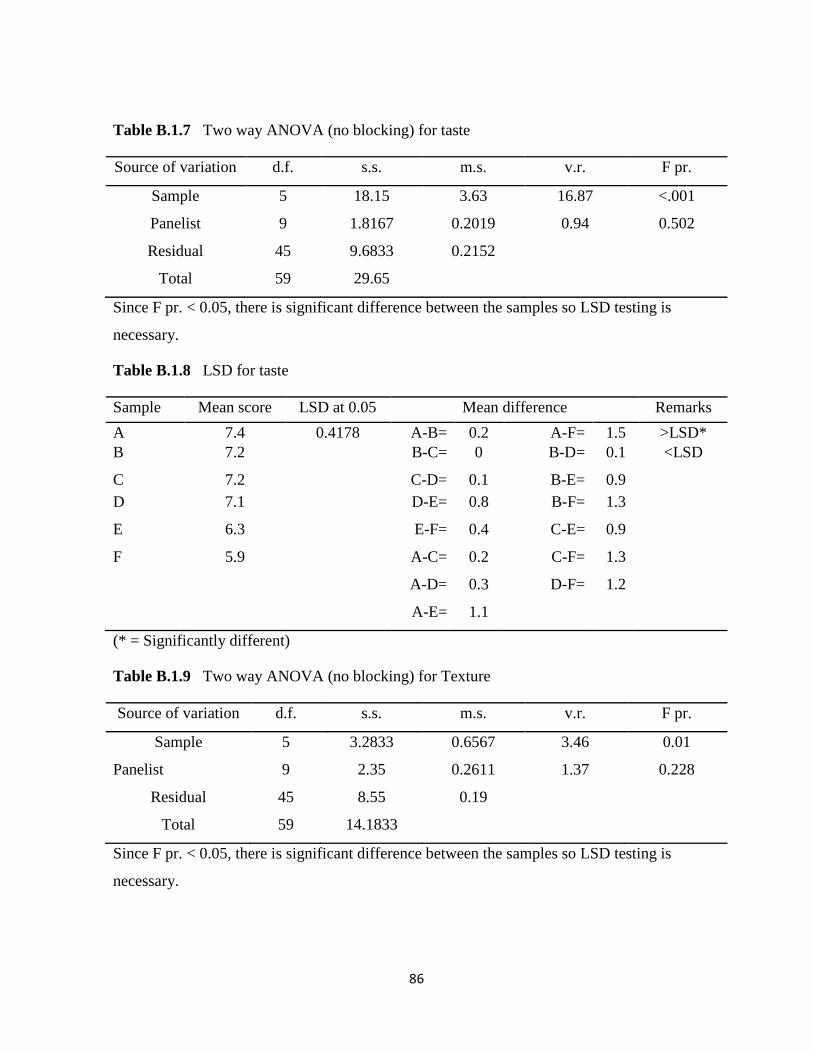
86
Table B.1.7 Two way ANOVA (no blocking) for taste
Source of variation d.f. s.s. m.s. v.r. F pr.
Sample 5 18.15 3.63 16.87 <.001
Panelist 9 1.8167 0.2019 0.94 0.502
Residual 45 9.6833 0.2152
Total 59 29.65
Since F pr. < 0.05, there is significant difference between the samples so LSD testing is
necessary.
Table B.1.8 LSD for taste
Sample Mean score LSD at 0.05 Mean difference Remarks
A 7.4 0.4178 A-B= 0.2 A-F= 1.5 >LSD*
B 7.2 B-C= 0 B-D= 0.1 <LSD
C 7.2 C-D= 0.1 B-E= 0.9
D 7.1
D-E= 0.8 B-F= 1.3
E 6.3
E-F= 0.4 C-E= 0.9
F 5.9
A-C= 0.2 C-F= 1.3
A-D= 0.3 D-F= 1.2
A-E= 1.1
(* = Significantly different)
Table B.1.9 Two way ANOVA (no blocking) for Texture
Source of variation d.f. s.s. m.s. v.r. F pr.
Sample 5 3.2833 0.6567 3.46 0.01
Panelist 9 2.35 0.2611 1.37 0.228
Residual 45 8.55 0.19
Total 59 14.1833
Since F pr. < 0.05, there is significant difference between the samples so LSD testing is
necessary.

87
Table B.1.10 LSD for texture
Sample Mean score LSD at 0.05 Mean difference Remarks
A 6.8 0.3926 B-A= 0.3 A-F= 0.4* >LSD*
B 7.1 B-C= 0.1 B-D= 0.3 <LSD
C 7 C-D= 0.2 B-E= 0.5*
D 6.8
D-E= 0.2 B-F= 0.7*
E 6.6
E-F= 0.2 C-E= 0.4*
F 6.4
C-A= 0.2 C-F= 0.6*
A-D= 0 D-F= 0.4*
A-E= 0.2
(* = Significantly different)
Table B.1.11 Two way ANOVA (no blocking) for Overall Acceptability
Source of variation d.f. s.s. m.s. v.r. F pr.
Sample 5 15.2833 3.0567 16.74 <.001
Panelist 9 3.0833 0.3426 1.88 0.08
Residual 45 8.2167 0.1826
Total 59 26.5833
Since F pr. < 0.05, there is significant difference between the samples so LSD testing is
necessary.
Table B.1.12 LSD for Overall acceptability
Sample Mean score LSD at 0.05 Mean difference Remarks
A 6.7 0.3849 B-A= 0.2 A-F= 0.4* >LSD*
B 6.9 C-B= 0.9* D-B= 0.4* <LSD
C 7.8 C-D= 0.5* B-E= 0.4*
D 7.3
D-E= 0.8* B-F= 0.6*
E 6.5
E-F= 0.2 C-E= 1.3*
F 6.3
C-A= 1.1* C-F= 1.5*
D-A= 0.6* D-F= 1*
A-E= 0.2
(* = Significantly different)
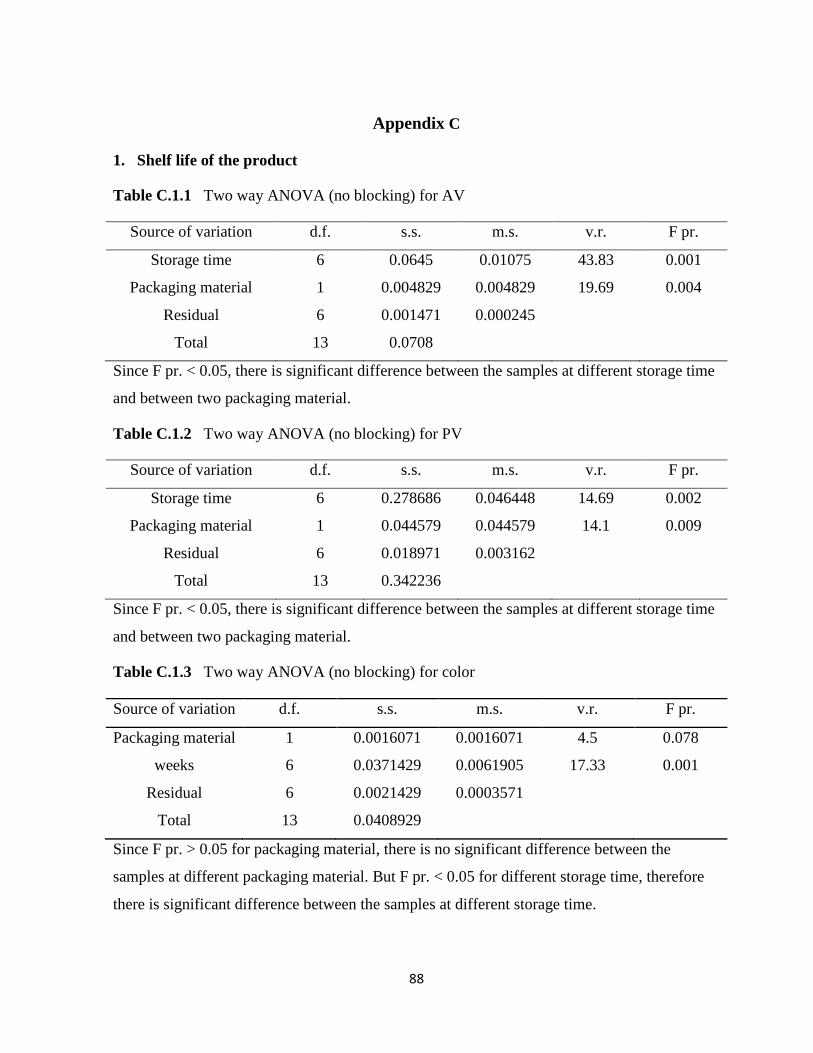
88
Appendix C
1. Shelf life of the product
Table C.1.1 Two way ANOVA (no blocking) for AV
Source of variation d.f. s.s. m.s. v.r. F pr.
Storage time 6 0.0645 0.01075 43.83 0.001
Packaging material 1 0.004829 0.004829 19.69 0.004
Residual 6 0.001471 0.000245
Total 13 0.0708
Since F pr. < 0.05, there is significant difference between the samples at different storage time
and between two packaging material.
Table C.1.2 Two way ANOVA (no blocking) for PV
Source of variation d.f. s.s. m.s. v.r. F pr.
Storage time 6 0.278686 0.046448 14.69 0.002
Packaging material 1 0.044579 0.044579 14.1 0.009
Residual 6 0.018971 0.003162
Total 13 0.342236
Since F pr. < 0.05, there is significant difference between the samples at different storage time
and between two packaging material.
Table C.1.3 Two way ANOVA (no blocking) for color
Source of variation d.f. s.s. m.s. v.r. F pr.
Packaging material 1 0.0016071 0.0016071 4.5 0.078
weeks 6 0.0371429 0.0061905 17.33 0.001
Residual 6 0.0021429 0.0003571
Total 13 0.0408929
Since F pr. > 0.05 for packaging material, there is no significant difference between the
samples at different packaging material. But F pr. < 0.05 for different storage time, therefore
there is significant difference between the samples at different storage time.
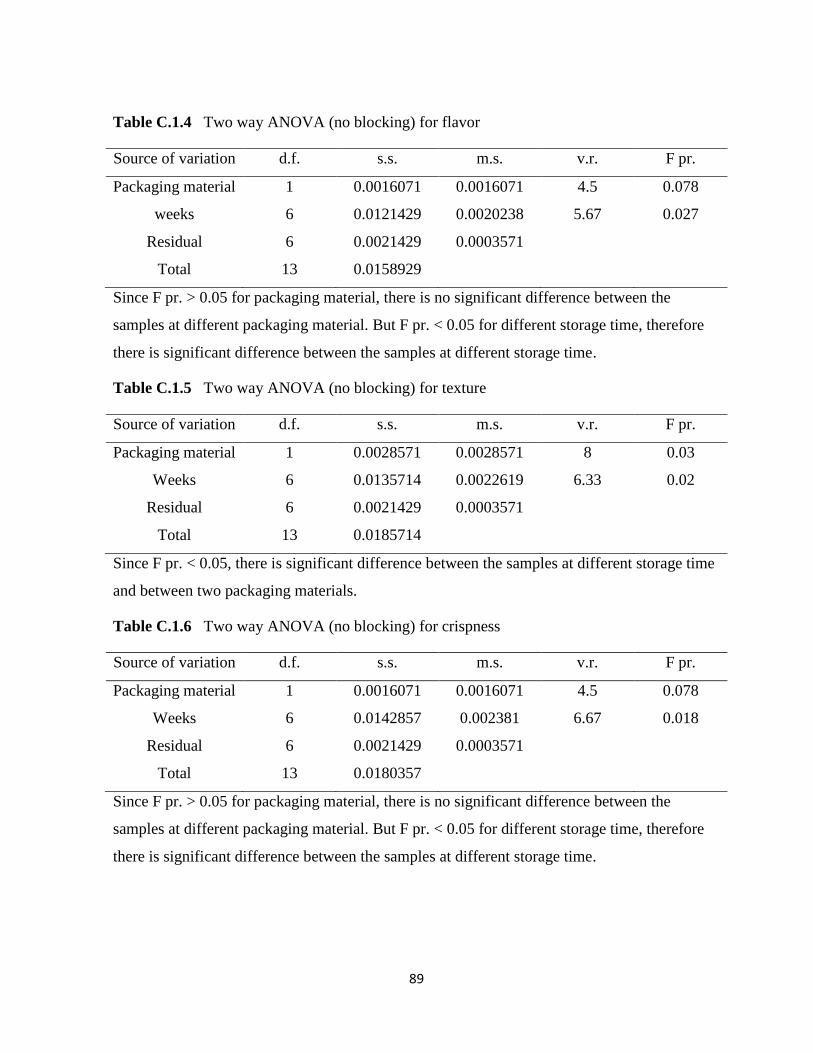
89
Table C.1.4 Two way ANOVA (no blocking) for flavor
Since F pr. > 0.05 for packaging material, there is no significant difference between the
samples at different packaging material. But F pr. < 0.05 for different storage time, therefore
there is significant difference between the samples at different storage time.
Table C.1.5 Two way ANOVA (no blocking) for texture
Source of variation d.f. s.s. m.s. v.r. F pr.
Packaging material 1 0.0028571 0.0028571 8 0.03
Weeks 6 0.0135714 0.0022619 6.33 0.02
Residual 6 0.0021429 0.0003571
Total 13 0.0185714
Since F pr. < 0.05, there is significant difference between the samples at different storage time
and between two packaging materials.
Table C.1.6 Two way ANOVA (no blocking) for crispness
Source of variation d.f. s.s. m.s. v.r. F pr.
Packaging material 1 0.0016071 0.0016071 4.5 0.078
Weeks 6 0.0142857 0.002381 6.67 0.018
Residual 6 0.0021429 0.0003571
Total 13 0.0180357
Since F pr. > 0.05 for packaging material, there is no significant difference between the
samples at different packaging material. But F pr. < 0.05 for different storage time, therefore
there is significant difference between the samples at different storage time.
Source of variation d.f. s.s. m.s. v.r. F pr.
Packaging material 1 0.0016071 0.0016071 4.5 0.078
weeks 6 0.0121429 0.0020238 5.67 0.027
Residual 6 0.0021429 0.0003571
Total 13 0.0158929

90
Table C.1.7 Two way ANOVA (no blocking) for taste
Source of variation d.f. s.s. m.s. v.r. F pr.
Packaging material 1 0.0007143 0.0007143 1 0.356
Weeks 6 0.0142857 0.002381 3.33 0.084
Residual 6 0.0042857 0.0007143
Total 13 0.0192857
Since F pr. > 0.05, there is no significant difference between the samples at different storage
time and between two packaging material.
Table C.1.8 Two way ANOVA (no blocking) for overall acceptance
Source of variation d.f. s.s. m.s. v.r. F pr.
Packaging material 1 0.0044643 0.0044643 15 0.008
Weeks 6 0.0267857 0.0044643 15 0.002
Residual 6 0.0017857 0.0002976
Total 13 0.0330357
Since F pr. < 0.05, there is significant difference between the samples at different storage time
and between two packaging materials.
YTable C.1.9 Average sensory score for sample packed in P1 (laminate PET + BOPP)
Weeks Color Flavor Texture Crispness Taste Overall Acceptability
0 7.7(0.48) 7(0.44) 7.1(0.44) 7.1(0.44) 7.2(0.52) 7.8(0.42)
2 7.8(0.42) 7.05(0.31) 7.1(0.55) 7.1(0.44) 7.3(0.57) 7.85(0.36)
4 7.75(0.36) 7.05(0.51) 7.1(0.44) 7.1(0.44) 7.25(0.55) 7.8(0.42)
6 7.7(0.31) 7(0.44) 7.05(0.31) 7.05(0.51) 7.25(0.55) 7.75(0.44)
8 7.7(0.48) 7(0.44) 7.05(0.51) 7.05(0.31) 7.2(0.52) 7.75(0.44)
10 7.65(0.47) 6.95(0.31) 7(0.55) 7(0.45) 7.2(0.52) 7.7(0.48)
12 7.6(0.44) 6.95(0.31) 7(0.55) 7(0.45) 7.15(0.36) 7.7(0.48)
Values in the Parenthesis are the standard deviation.
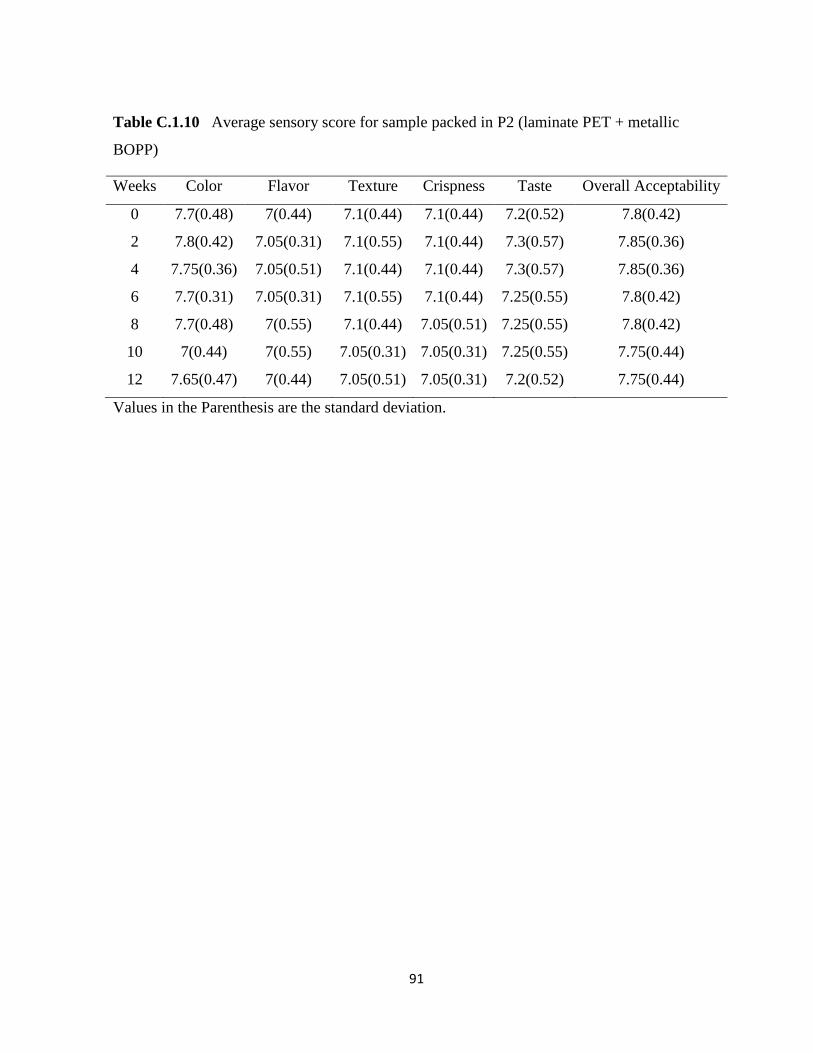
91
Table C.1.10 Average sensory score for sample packed in P2 (laminate PET + metallic
BOPP)
Weeks Color Flavor Texture Crispness Taste Overall Acceptability
0 7.7(0.48) 7(0.44) 7.1(0.44) 7.1(0.44) 7.2(0.52) 7.8(0.42)
2 7.8(0.42) 7.05(0.31) 7.1(0.55) 7.1(0.44) 7.3(0.57) 7.85(0.36)
4 7.75(0.36) 7.05(0.51) 7.1(0.44) 7.1(0.44) 7.3(0.57) 7.85(0.36)
6 7.7(0.31) 7.05(0.31) 7.1(0.55) 7.1(0.44) 7.25(0.55) 7.8(0.42)
8 7.7(0.48) 7(0.55) 7.1(0.44) 7.05(0.51) 7.25(0.55) 7.8(0.42)
10 7(0.44) 7(0.55) 7.05(0.31) 7.05(0.31) 7.25(0.55) 7.75(0.44)
12 7.65(0.47) 7(0.44) 7.05(0.51) 7.05(0.31) 7.2(0.52) 7.75(0.44)
Values in the Parenthesis are the standard deviation.

92
Appendix-D
Table D Cost calculation of the product (Formula C).
Particulars Cost (NRs/kg) weight (gm) (wet basis) Cost (NRs/100gm)
Wheat flour 30 70 2.1
Soybean 70 11 0.77
SMP 445 0.2 0.089
Shortening (palm Oil) 155 14 2.17
Sugar 70 13 0.91
Ammonium Bicarbonate 400 1.4 0.56
Sodium Bicarbonate 200 0.7 0.14
Others
3 0.5
Vitamin & Mineral premix 8500 0.2 1.7
Raw material Cost 113.5 8.939
Processing and labor Cost
0.8939 (10% of raw material cost)
Packaging cost
1
Profit (10%)
1.08329
Grand Total Cost 11.91619
Cost of raw materials varies with season.