Embed Size (px)
Citation preview
DMD#15644
1
Prediction of Human Pharmacokinetics Using
Physiologically Based Modelling: A Retrospective Analysis
of 26 Clinically Tested Drugs
Stefan S. De Buck1, Vikash K. Sinha, Luca A. Fenu, Marjoleen J. Nijsen, Claire E.
Mackie and Ron A. H.J Gilissen
Johnson & Johnson Pharmaceutical Research and Development, Discovery ADME-
Tox department, Turnhoutseweg 30, B-2340 Beerse, Belgium [S.S.DB, V.K.S, L.A.F,
M.J.N, C.E.M, R.A.H.J.G]
DMD Fast Forward. Published on July 9, 2007 as doi:10.1124/dmd.107.015644
Copyright 2007 by the American Society for Pharmacology and Experimental Therapeutics.
This article has not been copyedited and formatted. The final version may differ from this version.DMD Fast Forward. Published on July 9, 2007 as DOI: 10.1124/dmd.107.015644
at ASPE
T Journals on M
arch 1, 2022dm
d.aspetjournals.orgD
ownloaded from

DMD#15644
2
Running title: Prediction of human pharmacokinetics
1To whom correspondence should be addressed to: Stefan S. De Buck, Ablynx nv,
Technologiepark 4, B-9052 Ghent/Zwijnaarde, Belgium. E-mail address:
Text pages: 50
Tables: 8
Figures: 6
References: 38
Words in abstract: 251
Words in introduction: 750
Words in discussion: 1497
ABBREVIATIONS
ACAT, advanced compartmental absorption and transit model; ADME, absorption
distribution metabolism excretion; AUC, area under the plasma concentration-time
profile; AUMC, area under first moment curve; BCS, Biopharmaceutical
Classification Scheme; CL, total body clearance from plasma; CL/F, total body
clearance from plasma after oral administration; CLH, hepatic plasma clearance;
CLH,blood, hepatic blood clearance; CLint, intrinsic clearance; CLR, renal clearance
from plasma; Cmax, peak plasma concentration after oral administration; D, dose; F,
absolute oral bioavailability; fuinc, unbound fraction in microsomal or hepatocyte
incubation; fup, unbound fraction in plasma; GFR, glomerular filtration rate; in vivo
t1/2, in vivo terminal half-life; logPow, n-octanol:water partition coefficient of the non-
ionised species; PBPK, physiologically based pharmacokinetics; PK,
pharmacokinetics; Ptp, tissue-to-plasma partition coefficient; Ptpu, tissue-to-plasma
partition coefficient of the unbound drug; Qh, hepatic blood flow; RA, ratio of
albumin concentration found in tissue over plasma; RB, blood-to-plasma concentration
This article has not been copyedited and formatted. The final version may differ from this version.DMD Fast Forward. Published on July 9, 2007 as DOI: 10.1124/dmd.107.015644
at ASPE
T Journals on M
arch 1, 2022dm
d.aspetjournals.orgD
ownloaded from
DMD#15644
3
ratio; SF, scaling factor; SIF, simulated intestinal fluid; Vd/F, apparent volume of
distribution after oral administration; Vss, apparent volume of distribution at steady-
state
This article has not been copyedited and formatted. The final version may differ from this version.DMD Fast Forward. Published on July 9, 2007 as DOI: 10.1124/dmd.107.015644
at ASPE
T Journals on M
arch 1, 2022dm
d.aspetjournals.orgD
ownloaded from

DMD#15644
4
Abstract
The aim of this study was to evaluate different physiologically based modelling
strategies for the prediction of human pharmacokinetics. Plasma profiles after
intravenous and oral dosing were simulated for 26 clinically tested drugs. Two
mechanism-based predictions of human tissue-to-plasma partitioning (Ptp) from
physicochemical input (Method Vd1) were evaluated for their ability to describe
human volume of distribution at steady-state (Vss). This was compared with a
strategy that combined predicted and experimentally determined in vivo rat Ptp data
(Method Vd2). Best Vss predictions were obtained using Method Vd2, providing that
rat Ptp-input was corrected for interspecies differences in plasma protein binding (84%
within 2-fold). Vss predictions from physicochemical input alone were poor (32%
within 2-fold). Total body clearance (CL) was predicted as the sum of scaled rat renal
clearance and hepatic clearance projected from in vitro metabolism data. Best CL
predictions were obtained by disregarding both blood and microsomal or hepatocyte
binding (Method CL2, 74% within 2-fold), while strong bias was seen using both
blood and microsomal or hepatocyte binding (Method CL1, 53% within 2-fold). The
PBPK model which combined Method Vd2 and CL2 yielded most accurate
predictions of in vivo terminal half-life (69% within 2-fold). The Gastroplus ACAT
model was used to construct an absorption-disposition model and provided accurate
predictions of area under the plasma concentration-time profile, oral apparent volume
of distribution and maximum plasma concentration after oral dosing, with 74%, 70%
and 65% within 2-fold, respectively. This evaluation demonstrates that PBPK models
can lead to reasonable predictions of human pharmacokinetics.
This article has not been copyedited and formatted. The final version may differ from this version.DMD Fast Forward. Published on July 9, 2007 as DOI: 10.1124/dmd.107.015644
at ASPE
T Journals on M
arch 1, 2022dm
d.aspetjournals.orgD
ownloaded from

DMD#15644
5
In the drug discovery process considerable resources are required to assess the
pharmacokinetic (PK) properties of potential drug candidates in vivo in animals. In
order to optimise the use of such in vivo testing, there has been a growing interest in
predicting the PK behaviour of drug candidates (Theil et al., 2003; van de
Waterbeemd and Gifford, 2003). If sufficiently reliable, such simulations could also
help to select the most promising candidates for development and reject those with a
low probability of success (van de Waterbeemd and Gifford, 2003).
The majority of the approaches to predict human PK developed to date
typically focus on the drug’s behaviour in individual processes of absorption,
distribution, metabolism and excretion (ADME). The characterization of a drug’s PK
in a complex biological system is be best described by assembling these processes in
one global model. In this context, physiologically based pharmacokinetic models
(PBPK) have been developed (Bischoff, 1986). PBPK models map the complex drug
transport scheme onto a physiologically realistic compartmental structure (Figure 1).
The major structural elements of the PBPK disposition model are derived from the
anatomical structure of the organism; therefore, the model structure is predetermined
and basically independent of the drug of interest. The PBPK model input parameters
include both a drug independent and a drug-specific subset. The first subset comprises
data underlying the physiological processes (e.g., blood-flow), while the second
subset comprises drug-specific biochemical parameters. The latter consists of the
drug’s in vivo intrinsic clearance (CLint) of each organ involved in its elimination, in
addition to estimates of the drug’s tissue-to-plasma coefficient (Ptp) for each model
compartment. Prediction of the rate and extent of absorption can be obtained using
semi-physiologically based absorption models, such as the advanced compartmental
absorption and transit (ACAT) model (Yu and Amidon, 1999; Agoram et al., 2001).
As depicted in Figure 1, the ACAT model may serve as a time-dependent input
This article has not been copyedited and formatted. The final version may differ from this version.DMD Fast Forward. Published on July 9, 2007 as DOI: 10.1124/dmd.107.015644
at ASPE
T Journals on M
arch 1, 2022dm
d.aspetjournals.orgD
ownloaded from

DMD#15644
6
function to the disposition model, thereby creating a combined absorption-distribution
PBPK model.
Although PBPK models have been widely used in areas such as risk
assessment to predict the PK behaviour of toxic chemicals, their application in
support of drug discovery and development has remained limited, most probably as a
result of their mathematically complexity and the labour intensive drug-specific input
data required. However, more recently a variety of in vitro based prediction tools have
been developed for the estimation of PBPK model input parameters (Theil et al.,
2003). Such prediction tools require commonly determined biochemical and
physicochemical drug-specific input, and thus allow for the prediction of ADME
parameters prior to any in vivo experiment. As examples of such prediction tools,
mechanistic equations have been developed for the prediction of fraction of oral dose
absorbed (Agoram et al., 2001; Willmann et al., 2004), tissue partitioning (Ptp) (Poulin
and Theil, 2000; Poulin et al., 2001; Rodgers et al., 2005a), apparent volume of
distribution at steady-state (Vss) (Poulin and Theil, 2002), and hepatic plasma
clearance (CLH) (Houston and Carlile, 1997; Austin et al., 2002; Ito and Houston,
2004). In a previous study, we also evaluated a variety of physiologically-based
prediction tools for the prediction of rat PK (De Buck et al., 2007).
The aim of the present work was to further evaluate these prediction tools for
their ability to predict human PK parameters by simulation of full plasma
concentration-time profiles after both intravenous and oral administration. Although
recent studies have addressed a similar question, the overall prediction accuracy
obtained was in the lower range, particularly for predictions of Vss and in vivo
terminal half-life (in vivo t1/2) (Parrott et al., 2005b; Jones et al., 2006a). In the present
study, a more comprehensive range of approaches towards the prediction of Vss and
CLH was explored; including two mechanism-based Vss predictions from
This article has not been copyedited and formatted. The final version may differ from this version.DMD Fast Forward. Published on July 9, 2007 as DOI: 10.1124/dmd.107.015644
at ASPE
T Journals on M
arch 1, 2022dm
d.aspetjournals.orgD
ownloaded from

DMD#15644
7
physicochemical input, as well as approaches that combine the use of both predicted
and experimentally determined in vivo rat Ptp. For each of the approaches tested, the
influence of interspecies differences in plasma protein binding on prediction accuracy
was investigated. The role of relative drug binding in plasma and in vitro drug
matrices was also considered with respect to CLH projection from in vitro metabolism
data. Whereas the basic tenet of pharmacokinetics states that the unbound drug
concentration in the plasma dictates clearance, our previous report in rat using
microsomes has suggested that in vitro CLint may provide a better estimate of in vivo
CLH of total rather than unbound drug (De Buck et al., 2007). To further investigate
the effect of relative drug binding, predictions of human CLH were performed each
time under two variations, either by incorporation or disregarding such binding
factors. Methods to predict Vss and CL were combined to predict in vivo t1/2 and the
ACAT model was tested for its ability to predict the area under the oral concentration-
time profile (AUC), the oral apparent volume of distribution (Vd/F) and peak plasma
concentration (Cmax). To determine whether a successful prediction in rat correlates
with a successful prediction in human, the accuracy of each method was assessed
within both species.
This article has not been copyedited and formatted. The final version may differ from this version.DMD Fast Forward. Published on July 9, 2007 as DOI: 10.1124/dmd.107.015644
at ASPE
T Journals on M
arch 1, 2022dm
d.aspetjournals.orgD
ownloaded from
DMD#15644
8
Methods
Compounds and Sources of In vitro and In vivo Parameters. The set of compounds
(n=26) included in this analysis were taken from those brought into clinical
development at Johnson & Johnson Pharmaceutical Research and Development
(Beerse, Belgium). Compounds were selected based on the availability of historical
data on the in vivo preclinical (rat) and clinical PK, as well as of each of the following
experimentally determined biochemical and physicochemical parameters: unbound
fraction in plasma (fup), unbound fraction in microsomal or hepatocyte incubation
(fuinc), basic and acidic dissociation constants (pKa), n-octanol:water partition
coefficient of the non-ionised species (logPow), aqueous solubility at defined pH
conditions or solubility in simulated intestinal fluid (SIF), in vitro CLint determined in
hepatic microsomes or hepatocyte suspension cultures, and the blood-to-plasma
concentration ratio (RB). Summaries of the available in vitro and in vivo PK data are
shown in Tables I and II, respectively.
The 26 compounds in the data set cover a broad range of small molecules from
a variety of discovery programs. The majority of compounds (n=19) were moderate-
to-strong bases (pKa of protonated base >7.0), three were neutral or weakly ionised at
physiological pH (weak base). The remaining compounds were one weak acid, one
strong acid, and two were zwitterions. The lipophilicity (logPow) ranged between 1.11
and 5.5, and fup ranged from 0.001 to 0.867. Aqueous solubility was highly variable
with values at physiological pH ranging from 0.003 mg/ml to 74 mg/ml. Vss in
humans varied from limited (30 L) to widespread (>1000 L). In the rat, major
elimination pathways included hepatic metabolism, renal excretion or a combination
of these. In humans, total body clearance from plasma (CL) varied from less than 10%
of hepatic blood flow (Qh) to more than 70% of Qh.
This article has not been copyedited and formatted. The final version may differ from this version.DMD Fast Forward. Published on July 9, 2007 as DOI: 10.1124/dmd.107.015644
at ASPE
T Journals on M
arch 1, 2022dm
d.aspetjournals.orgD
ownloaded from

DMD#15644
9
Model Structure. The Gastroplus 5.1.0 generic PBPK model and its built-in mass
balance differential equations were used for all simulations (Simulations Plus Inc.,
Lancaster, CA, USA). Briefly, the model (Figure 1) was composed of 14 tissue
compartments, including lung, spleen, liver, gut, adipose tissue, muscle, heart, brain,
kidney, skin, testes, red marrow, yellow marrow and rest of the body, which were
linked by the venous and arterial blood circulation. It was assumed that drug
distributes instantaneously and homogenously within each tissue compartment and
uptake of drug within each tissue compartment was limited by the blood flow
(perfusion rate-limited uptake). The default Gastroplus settings of all physiological
data used in the rat and human PBPK models are summarized in Table III. The
methods used for estimating the PBPK model input data on CLH, renal plasma
clearance (CLR), Ptp values, and absorption rate are described below.
Prediction of Human and Rat Ptp and Vss: Method Vd1. Predicted values of rat
and human Ptp for each tissue compartment of Figure 1 were obtained from drug-
specific physicochemical parameters using the following mechanistic tissue
composition-based equation developed by Poulin and coworkers (Poulin and Theil,
2002):
(1)
where P is the anti-logged value of logPow for a non-adipose tissue or is the vegetable
oil:buffer partition coefficient for both the ionised and non-ionised species at pH 7.4
(Dvow) for adipose tissue. Dvow was calculated from logPow using the Henderson-
Hasselbalch equations and the following relationship: log Pvow = 1.115 • logPow –
1.35 (Leo et al., 1971). V is the fractional tissue volume content of neutral lipids
Ptp = [P • (VNLT + 0.3 • VPHT) + (VWT + 0.7 • VPHT)] • fup
[P • (VNLp + 0.3 • VPHp) + (VWp + 0.7 • VPHp)] • fut
Ptp = [P • (VNLT + 0.3 • VPHT) + (VWT + 0.7 • VPHT)] • fup
[P • (VNLp + 0.3 • VPHp) + (VWp + 0.7 • VPHp)] • fut
This article has not been copyedited and formatted. The final version may differ from this version.DMD Fast Forward. Published on July 9, 2007 as DOI: 10.1124/dmd.107.015644
at ASPE
T Journals on M
arch 1, 2022dm
d.aspetjournals.orgD
ownloaded from

DMD#15644
10
(NL), phospholipids (PH) or water (W) in tissue (T) and plasma (p). The
physiological data on human and rat values used for VNLT, VNLp, VPHT, VPHp, VWT,
VWp have been described in the literature (Poulin and Theil, 2002). The fraction
unbound in tissue (fut) in equation 1 was estimated as follows:
fut = 1 / (1+(((1 – fup) / fup) • RA)) (2)
where RA is the ratio of albumin concentration found in tissue over plasma. For
lipophilic and highly protein bound compounds, it has been assumed that for adipose
tissue RA equals 0.15, whereas for non-adipose tissue RA equal 0.5 (Ellmerer et al.,
2000; Poulin and Theil, 2002).
Finally, rat and human Vss was calculated by Gastroplus software according
to the equation of Sawada et al. in which Vss equals the plasma volume in addition to
the sum of each Ptp multiplied by its respective tissue volume (Sawada et al., 1984).
Prediction of Human and Rat Ptp and Vss: Method Vd2. For rat Ptp and Vss,
experimental rat Ptp values were determined under in vivo conditions (single oral or
intravenous dose) as the ratio of the AUC calculated over a minimum of five time
points, assuming pseudo-equilibrium. All experimentally determined in vivo rat Ptp
values used within this study are summarized in Table II. In instances where the in
vivo Ptp was not available for a compound, the value for that tissue compartment
(Figure 1) was predicted using the tissue composition-based equation as described by
Rodgers et al. (Rodgers et al., 2005a). Briefly, for strong bases (pKa>7.0), Ptp of
unbound drug (Ptpu) was calculated using equation 3:
(3) Ptpu = =
VEW + • VIW1 + 10 pKa-7.0
1 + 10 pKa-7.4
Ka • [AP]t • 10 pKa-7.0
1 + 10 pKa-7.4
Pvow • VNL + ((0.3•Pvow+0.7)•VNP))
1 + 10 pKa-7.4
+
+
Ptp
fup
Ptpu = =
VEW + • VIW1 + 10 pKa-7.0
1 + 10 pKa-7.4
Ka • [AP]t • 10 pKa-7.0
1 + 10 pKa-7.4
Pvow • VNL + ((0.3•Pvow+0.7)•VNP))
1 + 10 pKa-7.4
+
+
Ptp
fup
This article has not been copyedited and formatted. The final version may differ from this version.DMD Fast Forward. Published on July 9, 2007 as DOI: 10.1124/dmd.107.015644
at ASPE
T Journals on M
arch 1, 2022dm
d.aspetjournals.orgD
ownloaded from

DMD#15644
11
where V is the fractional tissue volume of neutral lipids (NL), neutral phospholipids
(NP), extracellular water (EW) and intracellular water (IW), [AP]t is the concentration
of acidic phospholipids in tissue, all physiological data on VEW, VIW, VNL, VNP and
[AP]t for both adipose and non-adipose tissue have been described in the literature
(Rodgers et al., 2005a), pKa represents the dissociation constant of the protonated
base, Pvow the anti-logged value of logPvow (calculated from Pow as described above),
Ka is the association constant of the compound with the acidic phospholipids, and was
calculated from equation 4:
(4)
where Ptpu,BC is the Ptpu of the red blood cell (BC) and thus equals the erythrocyte-to-
plasma concentration ratio (E:P) divided by fup. E:P was calculated from the RB and
hematocrit (H), as follows: E:P = (RB–(1–H))/H. For weak bases (pKa<7, JNJ5,
JNJ25, JNJ26), acids (JNJ13, JNJ22) and zwitterions (JNJ17, JNJ19) Ptp values were
predicted using a modification of equation 3, as described by Rodgers et al. (Rodgers
and Rowland, 2006). It should be noted that for all compounds, Ptp estimates for testes
and rest of body compartment were taken from Method Vd1, as the published
equations by Rodgers et al. do not allow for prediction of these values.
For human Ptp and Vss, all rat Ptp values obtained as described in this section
were scaled to human with the assumption that the human Ptpu is equal to the rat Ptpu:
(5)
Ka,BC =
Ptpu,BC - • VIW1 + 10 pKa-7.22
1 + 10 pKa-7.4
Pvow•VNL,BC + (0.3•Pvow+0.7)•VNP,BC
1 + 10 pKa-7.4
[AP]BC • 10 pKa-7.22
-
• 1 + 10 pKa-7.4
Ka,BC =
Ptpu,BC - • VIW1 + 10 pKa-7.22
1 + 10 pKa-7.4
Pvow•VNL,BC + (0.3•Pvow+0.7)•VNP,BC
1 + 10 pKa-7.4
[AP]BC • 10 pKa-7.22
-
• 1 + 10 pKa-7.4
Human Ptp = Human fup • Rat Ptp
Rat fup
Human Ptp = Human fup • Rat Ptp
Rat fup
This article has not been copyedited and formatted. The final version may differ from this version.DMD Fast Forward. Published on July 9, 2007 as DOI: 10.1124/dmd.107.015644
at ASPE
T Journals on M
arch 1, 2022dm
d.aspetjournals.orgD
ownloaded from

DMD#15644
12
Finally, rat and human Vss were calculated by Gastroplus software as mentioned
under Method Vd1.
Prediction of CLH, CLR and CL: Method CL1. For metabolically cleared
compounds, the liver compartment of the PBPK model was provided with input data
on CLH, which was calculated in three steps:
Firstly, the in vitro hepatic CLint (L/h/mg microsomal protein or L/h/106 cells)
was determined from a typical microsomal or hepatocyte substrate depletion or
kinetic assay (Kantharaj et al., 2003), and was scaled to in vivo CLint (L/h), accounting
for the microsomal recovery or hepatocellularity and liver weight as described by
Houston (Houston, 1994):
in vivo CLint = in vitro CLint • SF (6)
where SF (Scaling Factor) represents the milligrams of microsomal protein or million
cells per gram of liver multiplied by the grams of liver weight. A microsomal
recovery of 40 mg microsomal protein/g of liver (Pelkonen et al., 1973; Ito and
Houston, 2005) was used for both rat and human. A hepatocellularity of 125 and 120
million cells/g of liver was used for rat and human, respectively (Iwatsubo et al.,
1996; Iwatsubo et al., 1997). Human and rat standard liver weight was 1400 g (20
g/kg bodyweight) and 11.25 g (45 g/kg bodyweight), respectively (Houston, 1994;
Obach et al., 1997). Secondly, the hepatic blood clearance (CLH,blood,) was calculated
using the commonly used equation of the well-stirred liver model:
(7)
where Qh is the hepatic blood flow (Human, 90 L/h; Rat, 0.828 L/h). Experimental
values for fup, fuinc, RB and in vivo CLint are presented in Table I. Finally, as
CLH,blood =(fup/RB) • Qh • (in vivo CLint/fuinc)Qh + (in vivo CLint /fuinc) • (fup/RB)CLH,blood =(fup/RB) • Qh • (in vivo CLint/fuinc)Qh + (in vivo CLint /fuinc) • (fup/RB)
This article has not been copyedited and formatted. The final version may differ from this version.DMD Fast Forward. Published on July 9, 2007 as DOI: 10.1124/dmd.107.015644
at ASPE
T Journals on M
arch 1, 2022dm
d.aspetjournals.orgD
ownloaded from

DMD#15644
13
Gastroplus requires input data on CLH, CLH,blood was converted to CLH (CLH = RB •
CLH,blood).
For renally cleared compounds, the prediction of human CLR was obtained
using the glomerular filtration rate (GFR) ratio approach as described by Lin (Lin,
1998):
(8)
where rat CLR, unbound (L/h/kg) is the CLR corrected for rat fup (CLR/fup) and the GFR
ratio between rat and human is 4.8 (Lin, 1998). Predicted CL was calculated as the
sum of the predicted CLH and CLR.
Prediction of CLH, CLR and CL: Method CL2. Our previous study and those by
others using in vitro metabolism data have suggested that in vitro CLint may provide a
better estimate of in vivo CLH of total rather than unbound drug (Obach et al., 1997;
De Buck et al., 2007). Therefore, CLH predictions were also assessed using Method
CL2 under the assumption that fup/RB and fuinc effectively nullify in the liver model
calculation, negating the measurement of either process:
(9)
CLH,blood was converted to CLH as described above. The prediction of human CLR
from rat data was identical to Method CL1. Predicted CL was calculated as the sum of
the predicted CLH and CLR.
Prediction of In vivo t1/2: Method Vd1/CL1 and Method Vd2/CL2. Prediction of in
vivo t1/2 relies on the prediction of both Vss and CL. Two different approaches were
Human CLR, unbound = Rat CLR, unbound
GFR ratio Human CLR, unbound =
Rat CLR, unbound
GFR ratio
CLH,blood =Qh • in vivo CLint
Qh + in vivo CLint CLH,blood =
Qh • in vivo CLint
Qh + in vivo CLint
This article has not been copyedited and formatted. The final version may differ from this version.DMD Fast Forward. Published on July 9, 2007 as DOI: 10.1124/dmd.107.015644
at ASPE
T Journals on M
arch 1, 2022dm
d.aspetjournals.orgD
ownloaded from

DMD#15644
14
tested for their ability to predict in vivo t1/2: Firstly, Method Vd1 was combined with
Method CL1 (i.e., Method Vd1/CL1) as this combination predicts CLH according to
the most widely accepted approach towards the use of fup/RB and fuinc (equation 7)
(Jones et al., 2006a), and requires minimal data input for prediction of Vss. For
comparison, Method Vd2 was combined with Method CL2 (i.e., Method Vd2/CL2) as
this combination predicts Vss and CL according to the approach which was also
found to provide best results in rat. Predicted values of in vivo t1/2 were taken from the
Gastroplus software interface.
The ACAT Model and Prediction of Oral AUC. Prediction of oral AUC relies on
the prediction of both CL and the extent of absorption. CL was predicted using either
Method CL1 or Method CL2 as described above. The extent of absorption was
predicted using the Gastroplus ACAT model (Yu and Amidon, 1999; Agoram et al.,
2001). For all simulations, the ACAT model was provided with experimentally
determined data on logPow, pKa, aqueous buffer solubility or solubility in SIF at
defined pH, effective human jejunal permeability (Peff) and dose (D) administered
(Table I). Apparent permeability (Papp) was measured using a typical Caco-2
permeability assay and converted to Peff using the following correlation: logPeff,human =
0.6532•logPapp,caco-2 – 0.3036 (Sun et al., 2002). In instances where Caco-2 data was
not available (n=4, Table I), in silico estimates of human Peff were obtained by the
artificial neural network model in ADMETpredictor version 1.3.2 (Simulations Plus
Inc., Lancaster, CA, USA). The extent to which paracellular and transcellular routes
are utilized in drug transport is influenced by the fraction of ionized and unionized
species, which in turn, depends upon the pKa of the drug and the pH of the solution
(Ungell et al., 1998). To account for such regional changes in permeability, the
Gastroplus built-in “Opt logD-model” was applied (for a detailed description, see
This article has not been copyedited and formatted. The final version may differ from this version.DMD Fast Forward. Published on July 9, 2007 as DOI: 10.1124/dmd.107.015644
at ASPE
T Journals on M
arch 1, 2022dm
d.aspetjournals.orgD
ownloaded from

DMD#15644
15
manual of Gastroplus 5.1.0). In brief, the model assumes that the regional absorption
rate coefficient for each GI compartment can be calculated as the product of the Peff
(jejunal permeability at pH 6.5) and an absorption scale factor (ASF) specific for each
GI compartment. An estimate of ASF for each compartment is obtained based on the
premise that a linear relationship with a negative slope exists between the deviation of
the logD from the neutral logP (∆logDpH) and the change in the log of the
permeability coefficients at the two pH’s:
(10)
where C1 and C2 are two proprietary fitted constants accomplished through a series
of many thousands of simulations. The Gastroplus ACAT physiology was “Human-
physiological-Fasted”. Metabolic first pass extraction was assumed to depend only on
CLH.
Prediction of Vd/F and Cmax After Oral Dosing. Prediction of both Vd/F and Cmax
rely on the prediction of Vss, CL and the rate and extent of absorption. The rate and
extent of absorption were predicted using the ACAT model as described above. Vss
and CL were predicted using either Method Vd1/CL1 or Method Vd2/CL2 as
described above. Predicted values of Cmax were taken from the Gastroplus software
interface. The predicted Vd/F was calculated from the predicted CL/F multiplied by
the predicted in vivo t1/2/ln2. Predicted CL/F was calculated as D divided by predicted
AUC after oral dosing.
Prediction of Plasma Concentrations After Oral Dosing. Predictions of individual
plasma concentrations after oral dosing were obtained using the ACAT model (as
ASFpH = C2 • 10
∆logDpH-6.26
∆logD6.5-6.26C1 •∆logDpH-6.26
∆logD6.5-6.26C1 •
ASFpH = C2 • 10
∆logDpH-6.26
∆logD6.5-6.26C1 •∆logDpH-6.26
∆logD6.5-6.26C1 •
This article has not been copyedited and formatted. The final version may differ from this version.DMD Fast Forward. Published on July 9, 2007 as DOI: 10.1124/dmd.107.015644
at ASPE
T Journals on M
arch 1, 2022dm
d.aspetjournals.orgD
ownloaded from

DMD#15644
16
described above), which served as a time-dependent input to the disposition model
composed of either Method Vd1/CL1 or Method Vd2/CL2 as described above.
Calculation of the In vivo Pharmacokinetic Parameters. Noncompartmental
analysis was performed using WinNonLin version 4.01 (Pharsight, Mountain View,
CA) to calculate CL from the relationship CL= D/AUC, and Vss was determined as
Vss= Dose • AUMC/(AUC)2. Absolute oral bioavailability (F) was calculated as the
ratio of dose normalized AUC after oral and intravenous administration using the
mean of individual AUCs.
Success Criteria. Success of predictions was assessed by the root mean squared
prediction error (rmse) and the average-fold error (afe) as measures of precision and
bias, respectively, with equal value to under- and overpredictions:
(11)
(12)
A prediction method with an afe ≤2 was considered successful. Predicted PK
parameters and plasma concentration-time profiles were deemed accurate if they
agree with mean experimental in vivo values within a factor of two (Obach, 1999;
Poulin and Theil, 2002).
mse = ∑ (Predicted – Observed)2 , rmse = √mse1N
mse = ∑ (Predicted – Observed)2 , rmse = √mse1N1N
afe = 10
∑ log Predicted
Observed
Nafe = 10
∑ log Predicted
Observed
N
This article has not been copyedited and formatted. The final version may differ from this version.DMD Fast Forward. Published on July 9, 2007 as DOI: 10.1124/dmd.107.015644
at ASPE
T Journals on M
arch 1, 2022dm
d.aspetjournals.orgD
ownloaded from

DMD#15644
17
Results
Prediction of Vss. There were 19 compounds that had human intravenous PK data
suitable for assessment of Vss predictions. The correlations between observed and
predicted human Vss using Method Vd1 and Vd2 are presented in panel A and B of
Figure 2, respectively. The parameters for the accuracy of the predictions using
Method Vd1 and Vd2 are given in Table IV and V, respectively. The simplest
approach (Method Vd1) predicted human Vss within 2-fold of observed for only 6
compounds (32%, Figure 2A). In contrast, Method Vd2 resulted in more accurate
predictions with 16 compounds within 2-fold of observed (84%, Figure 2B). Although
Method Vd2 showed slight bias towards overprediction, the bias and precision were
typically much better than Method Vd1 as indicated by the decreased afe and rmse
values (Table IV and V). Using Method Vd2, the correction for differences in plasma
binding between rat and human resulted in better predictions as compared to when
binding differences were ignored (Table VI). Ignoring binding differences yielded
more bias and a lower precision, but also a decrease in the number of compounds that
were within 2-fold error (Table VI). Furthermore, if in Method Vd2 all experimentally
determined in vivo rat Ptp values were substituted by their predicted counterparts, a
general decrease in accuracy was observed, irrespective of correction for plasma
binding (Table VI).
Vss prediction accuracy was also assessed in rat to test whether a successful
prediction approach in rat indicates that prediction in human would be successful.
Method Vd2 was the best predictor of rat Vss, with 73% within 2-fold of observed
(n=26), respectively (Table VII). As expected, when all experimentally determined in
vivo rat Ptp values were substituted by their predicted counterparts, a general decrease
in accuracy of Method Vd2 was observed. The poorest predictor was Method Vd1,
This article has not been copyedited and formatted. The final version may differ from this version.DMD Fast Forward. Published on July 9, 2007 as DOI: 10.1124/dmd.107.015644
at ASPE
T Journals on M
arch 1, 2022dm
d.aspetjournals.orgD
ownloaded from
DMD#15644
18
which predicted only 12 compounds out of 26 within 2-fold of observed (42%, Table
VII).
Prediction of CL. The accuracy of clearance predictions refers to the total plasma
clearance (CL) when intravenous data were available (n=19). The correlations
between observed and predicted human CL using Method CL1 are shown in Figure
2C. Method CL1, which included both blood and microsomal or hepatocyte binding,
yielded several underpredictions of CL and only 10 compounds were predicted within
2-fold of mean observed values (53%, Table IV). As a result, a strong bias (afe) and
poor precision (rmse) were observed (Table IV). Despite the overall poor accuracy of
the method, prediction of the renal component, i.e., CLR, was found to be accurate.
CLR predictions (n=4) were 6.4 L/h, 18 L/h, 0.74 L/h and 19 L/h for JNJ4, JNJ12,
JNJ19, JNJ20, respectively, and therefore all predictions were within 2-fold of
observed (Table IV).
The correlations between observed and predicted human CL using Method
CL2 are shown in Figure 2D. This method predicted CL within 2-fold of observed for
14 compounds (74%, Figure 2D). Predictions showed limited bias (afe) and rmse
value was strongly decreased as compared to Method CL1 (Table V). To further
substantiate these findings, prediction of CL using both Method CL1 and CL2 was
also assessed in rat for all compounds (n=26). Table VII indicates that Method CL2
yielded more accurate predictions in rat as compared to Method CL1. Method CL1
projected rat CL within a 2-fold error for only 9 compounds (35%), whereas Method
CL2 projected rat CL within 2-fold error for 22 compounds (85%).
Prediction of In vivo t1/2. The accuracy of the in vivo t1/2 predictions refers to the
terminal in vivo t1/2 after intravenous administration when intravenous data were
This article has not been copyedited and formatted. The final version may differ from this version.DMD Fast Forward. Published on July 9, 2007 as DOI: 10.1124/dmd.107.015644
at ASPE
T Journals on M
arch 1, 2022dm
d.aspetjournals.orgD
ownloaded from
DMD#15644
19
available (n=19), and to the terminal in vivo t1/2 after oral dosing when only oral data
were available (n=7). Panels A and B of Figure 3 illustrate the correlations between
the observed and predicted values of in vivo t1/2 using Method Vd1/CL1 and Method
Vd2/CL2, respectively. Method Vd1/CL1 was a poor predictor of in vivo t1/2 in this
analysis in that only 7 compounds were within 2-fold of observed (27%, Figure 3A),
with high bias towards overprediction (afe) and poor precision (rmse) (Table IV).
These results were expected based on the results of the individual Methods Vd1 and
CL1. In contrast, Method Vd2/CL2 resulted in more accurate predictions of in vivo t1/2
with 18 compounds within 2-fold of observed (69%, Figure 3B). More importantly,
there was significantly less bias (afe) and higher precision (rmse) (Table V).
Prediction of AUC and F After Oral Dosing. There were 23 compounds that had
human oral PK data for assessment of oral AUC, and 16 compounds had both
intravenous and oral PK data for assessment of F. The correlations between the
observed and predicted oral AUC and F were obtained using the ACAT model in
combination with either Method CL1 or Method CL2 and are presented in panels A
and B of Figure 4, respectively. Method CL1 predicted oral AUC within 2-fold of
observed for only 8 compounds (35%, Figure 4A), and a strong bias towards
overprediction was observed for both oral AUC (Figure 4A) and F (Figure 4A, insert).
In contrast, Method CL2 predicted oral AUC within 2-fold of observed for 17
compounds (74%, Figure 4B). Prediction of both oral AUC (Figure 4B) and F (Figure
4B, insert) showed less bias and higher precision as indicated by a decreased afe and
rmse value (Table IV and V), respectively.
This article has not been copyedited and formatted. The final version may differ from this version.DMD Fast Forward. Published on July 9, 2007 as DOI: 10.1124/dmd.107.015644
at ASPE
T Journals on M
arch 1, 2022dm
d.aspetjournals.orgD
ownloaded from

DMD#15644
20
Prediction of Vd/F and Cmax After Oral Dosing. The accuracy of the Vd/F
predictions was assessed on all compounds intended for the oral route (n=23). Figure
5 illustrates the correlations between the observed and predicted values of Vd/F using
the ACAT model in combination with either Method Vd1/CL1 (Figure 5A) or Method
Vd2/CL2 (Figure 5B). Method Vd1/CL1 was a poor predictor of Vd/F in that only 5
predictions were within 2-fold of observed (22%, Figure 5A), with high bias towards
overprediction (afe) and poor precision (rmse) (Table IV). In contrast, Method
Vd2/CL2 resulted in more accurate predictions of Vd/F with 16 compounds within 2-
fold of observed (70%, Figure 5B). Although this method showed slight bias towards
underprediction, the bias and precision were typically much better than Method
Vd1/CL1 as indicated by the decreased afe and rmse values (Table IV and V).
The correlations between the observed and predicted Cmax using the ACAT
model in combination with either Method Vd1/CL1 or Method Vd2/CL2 are
presented in panels C and D of Figure 5, respectively. Both methods had similar
accuracy to predict Cmax (Table IV and V).
Prediction Accuracy of Oral Plasma Concentrations. There were 23 compounds
that had suitable data for assessment of oral plasma concentrations. The simulated
plasma concentration-time profiles using the ACAT model in combination with either
Method Vd1/CL1 (full line) or Method Vd2/CL2 (dotted line) are shown in Figure 6,
together with the observed data (open squares). In general, Method Vd2/CL2 yielded
the best agreement between the mean observed and predicted plasma values, as
indicated by the afe and rmse values (Table VIII).
This article has not been copyedited and formatted. The final version may differ from this version.DMD Fast Forward. Published on July 9, 2007 as DOI: 10.1124/dmd.107.015644
at ASPE
T Journals on M
arch 1, 2022dm
d.aspetjournals.orgD
ownloaded from

DMD#15644
21
Discussion
The use of whole body PBPK modelling is becoming more popular within the
pharmaceutical industry. This is due to a combination of estimating the PK
characteristics of compounds as early as possible, with making efficient and informed
selection on which compounds to progress (van de Waterbeemd and Gifford, 2003;
Jones et al., 2006a). The development of mechanism-based prediction tools for the
assessment of Ptp and CLH based on in vitro data has greatly contributed to the early
applications of PBPK modelling (Theil et al., 2003). Although these prediction tools
show great promise, it has been recognized that inaccurate predictions will occur if
the underlying assumptions of the mechanistic equations are not met (Parrott et al.,
2005b; Jones et al., 2006a). Therefore, more studies are required to assess how the
prediction accuracy as well as the type of data needed will vary depending on the
approach, the type of chemistry, and prediction system used. To the best of our
knowledge, the current study represents the first attempt to explore how an integrated
use of both experimental and predicted data can improve PK predictions using whole
body PBPK modelling. A dataset of 26 compounds formed the reference data in our
study. It is acknowledged that the number of compounds might be below the optimum
to draw general conclusions about the usefulness of the approaches investigated,
nevertheless it is still large enough to show some clear trends.
The present evaluation indicates that the type of tissue distribution data used
must be carefully considered. The most accurate approach towards prediction of
human Vss considered a combined set of predicted and experimental in vivo rat Ptp
data (84% within 2-fold, Method Vd2), whereas predictions based on
physicochemical input alone were rather poor (32% within 2-fold, Method Vd1). This
finding illustrates that Vss predictions can be improved by considering limited
experimental in vivo rat Ptp data (Table II). Experimental Ptp data must however be
This article has not been copyedited and formatted. The final version may differ from this version.DMD Fast Forward. Published on July 9, 2007 as DOI: 10.1124/dmd.107.015644
at ASPE
T Journals on M
arch 1, 2022dm
d.aspetjournals.orgD
ownloaded from

DMD#15644
22
carefully selected as Vss is largely determined by Ptp of adipose and muscle tissue
(Bjorkman, 2002), which were available for most of the compounds (Table II). A
second clear trend was that correction of rat Ptp data for interspecies differences in
plasma protein binding yielded better predictions as compared to when binding
differences were ignored (84% versus 53% within 2-fold). This observation was
anticipated as in scaling tissue distribution from rat to human, the unbound human Ptp
values are generally assumed to be identical to those of rat (Sawada et al., 1984).
Nevertheless, in case of basic drugs, the accuracy of this assumption remains
uncertain as electrostatic interactions with acidic phospholipids have been identified
as a major factor controlling tissue distribution (Rodgers et al., 2005b), and an
interspecies variability in the acidic phospholipids has been indicated (Rodgers et al.,
2005a).
Mechanistic equations to predict tissue distribution from physicochemical
input have been developed by Poulin and Theil (Poulin and Theil, 2000; Poulin et al.,
2001; Poulin and Theil, 2002), who reported that for a set of 123 drugs, 80% of the
predicted Vss were within 2-fold of observed. In the current study, the overall
prediction accuracy using these equations was reduced to 42% and 32% within 2-fold
of observed for rat and human, respectively. A deceased prediction accuracy of these
equations was also observed by others (Parrott et al., 2005a; Jones et al., 2006a). This
may be explained by distribution processes that are not covered in these equations,
such as active transport or ionic interactions of charged bases with acidic
phospholipids of cell membranes. In the Poulin and Theil’s equation, ionic
interactions are not included and tissue binding is extrapolated from plasma protein
binding. We have shown that using this approach tissue binding of bases is prone to
underestimation, particularly for strong bases that have low plasma protein binding
such as JNJ4, JNJ10 and JNJ20 (De Buck et al., 2007). In this study the Vss of most
This article has not been copyedited and formatted. The final version may differ from this version.DMD Fast Forward. Published on July 9, 2007 as DOI: 10.1124/dmd.107.015644
at ASPE
T Journals on M
arch 1, 2022dm
d.aspetjournals.orgD
ownloaded from

DMD#15644
23
compounds was however overpredicted, despite the fact that they were bases (Figure
2A). Although this may be explained by a limitation in membrane permeation, this
seems rather unlikely given the overall high permeability of the compounds within
our dataset. Another explanation may be a consistent overprediction of Ptp values of
adipose tissue, which is a major contributor to the total Vss. For example, Vss
prediction can be easily biased by the investigator’s choice on the RA value for
adipose tissue (equation 1 and 2). In this study and those by others, it has been
assumed that the RA value for adipose tissue equals 0.15 (Jones et al., 2006a).
However, in the original work of Poulin and Theil, the RA value for adipose tissue
was assumed to be 0 (Poulin and Theil, 2002). Future work will assess whether an
optimisation of the RA value based on the outcome of the prediction in rat may
improve prediction accuracy.
The decision of whether to incorporate blood binding (fup/RB) and in vitro
incubation matrix binding (fuinc) in CLH predictions remains controversial (Obach,
1999; Riley et al., 2005; De Buck et al., 2007). The inclusion of both unbound
fractions has been suggested as the generally acceptable approach. However, our
results and those by others demonstrate that in the case of some compound classes,
especially basic ones, disregarding all binding values may yield the most accurate
predictions (Method CL2, 74% within 2-fold) (Obach, 1997; Obach, 1999; De Buck
et al., 2007), whereas inclusion of both correction factors yielded large
underpredictions (Method CL1, 53% within 2-fold). It is however acknowledged that
underpredictions (Figure 2C) may prevail as the contribution of extrahepatic
metabolism and biliary clearance to CL has been neglected, therefore scaled
microsomal or hepatocyte data may not always be able to fully project CL. To the best
of our knowledge, oxidative microsomal metabolism was the major route of
elimination for the compounds within this study. Despite these uncertainties, our
This article has not been copyedited and formatted. The final version may differ from this version.DMD Fast Forward. Published on July 9, 2007 as DOI: 10.1124/dmd.107.015644
at ASPE
T Journals on M
arch 1, 2022dm
d.aspetjournals.orgD
ownloaded from
DMD#15644
24
findings obtained in human were in agreement with those obtained in rat, suggesting
that an assessment of the prediction accuracy in rat could be used to guide which
approach is most likely to succeed. For renally cleared compounds (JNJ4, JNJ12,
JNJ19, JNJ20), the empirical GFR approach successfully extrapolated human CLR
from rat data. This is in agreement with previous reports that have achieved good
predictions of CLR using this approach (Lin, 1998; Jones et al., 2006a).
The ability to successfully predict a drug’s dosing regimen by predicting
human in vivo t1/2 is of tremendous value in the compound selection process. The
most accurate prediction of in vivo t1/2 was obtained using Method Vd2/CL2 (69%
within 2-fold). In contrast, in vivo t1/2 prediction was strongly biased towards
overprediction using a combination of method Vd1 and CL1, most probably as a
result of overprediction of Vss and underprediction of CL, respectively (Table IV).
These results indicate that accurate predictions of both Vss and CL are critical in the
prediction of in vivo t1/2.
In the prediction of oral AUC both the CL and fraction of oral dose absorbed
are important. As expected, the most accurate predictions of AUC were obtained
using the most accurate input on CL (Method CL2). For the purpose of this study,
intestinal wall metabolism was ignored, yet the prediction of oral absorption
parameters was on the whole quiet successful, suggesting that the contribution of
intestinal metabolism may be low. It is acknowledged that this represents a
shortcoming, and ideally its contribution should be considered. Estimates of fraction
of oral dosed absorbed were obtained using the ACAT model and were based on the
drug’s in vitro input on permeability and solubility. Unfortunately, in this dataset
there were only two BCS class III compounds (high solubility, and low permeability)
for which the limiting effect of permeability could be assessed (JNJ10, JNJ12). For
such compounds accurate estimates of permeability are imperative for successful
This article has not been copyedited and formatted. The final version may differ from this version.DMD Fast Forward. Published on July 9, 2007 as DOI: 10.1124/dmd.107.015644
at ASPE
T Journals on M
arch 1, 2022dm
d.aspetjournals.orgD
ownloaded from
DMD#15644
25
predictions. In this study, converted Caco-2 permeability data provided accurate
predictions, while inaccurate predictions were observed using in silico predicted
counterparts (data not shown). The vast majority of the compounds were highly
permeable and belong to either BCS Class I (high solubility) or BCS Class II (low
solubility). For BCS class II compounds, the outcome of simulations may be sensitive
to the nature and accuracy of the solubility input. Aqueous solubility data may not
reflect actual solubility in vivo, resulting in a strong bias towards underprediction of
bioavailability (Parrott et al., 2005b; Jones et al., 2006a). For two compounds that
were practically insoluble in aqueous media (JNJ21, JNJ24), solubility measurements
in SIF were found to provide a good alternative.
Prediction of Vd/F and Cmax rely on the rate of absorption as well as the
methods used for prediction of CL and Vss. The ACAT model may serve as a time-
dependent input function of PBPK-disposition models, and thus allows to predict full
plasma concentration-time profiles. As expected, the most accurate prediction of Vd/F
was obtained using Method Vd2/CL2 (70% within 2-fold), while prediction was
strongly biased towards overprediction using Method Vd1/CL1 (21% within 2-fold).
In contrast, prediction of Cmax (65% within 2-fold) was less sensitive to the choice of
methods used for prediction of Vss and CL. This may be explained by time dependent
prediction errors, which are usually more pronounced on terminal plasma
concentrations (Figure 6).
In summary, these results and those by others demonstrate that a generic
physiologically based prediction approach can lead to reasonable predictions of
human pharmacokinetics (Jones et al., 2006a; Jones et al., 2006b). However, the
prediction accuracy may vary depending on the approach and significant mis-
predictions can occur when the underlying assumptions of the model or prediction
tool are not met. PBPK model validation on each of the key input parameters using in
This article has not been copyedited and formatted. The final version may differ from this version.DMD Fast Forward. Published on July 9, 2007 as DOI: 10.1124/dmd.107.015644
at ASPE
T Journals on M
arch 1, 2022dm
d.aspetjournals.orgD
ownloaded from

DMD#15644
26
vitro assays in combination with preclinical data remains the recommended strategy
for human PBPK modelling.
This article has not been copyedited and formatted. The final version may differ from this version.DMD Fast Forward. Published on July 9, 2007 as DOI: 10.1124/dmd.107.015644
at ASPE
T Journals on M
arch 1, 2022dm
d.aspetjournals.orgD
ownloaded from

DMD#15644
27
Acknowledgements
The authors would like to thank the many colleagues at Johnson & Johnson
Pharmaceutical Research and Development (Beerse, Belgium), who have generated
data used in these analyses, with a special thanks to everybody who currently supports
the in vitro and in vivo pharmacokinetic studies and bioanalytical assays.
This article has not been copyedited and formatted. The final version may differ from this version.DMD Fast Forward. Published on July 9, 2007 as DOI: 10.1124/dmd.107.015644
at ASPE
T Journals on M
arch 1, 2022dm
d.aspetjournals.orgD
ownloaded from

DMD#15644
28
References
Agoram B, Woltosz WS and Bolger MB (2001) Predicting the impact of
physiological and biochemical processes on oral drug bioavailability. Adv
Drug Deliv Rev 50 Suppl 1:S41-67.
Austin RP, Barton P, Cockroft SL, Wenlock MC and Riley RJ (2002) The influence
of nonspecific microsomal binding on apparent intrinsic clearance, and its
prediction from physicochemical properties. Drug Metab Dispos 30:1497-
1503.
Bischoff KB (1986) Physiological pharmacokinetics. Bull Math Biol 48:309-322.
Bjorkman S (2002) Prediction of the volume of distribution of a drug: which tissue-
plasma partition coefficients are needed? J Pharm Pharmacol 54:1237-1245.
De Buck SS, Sinha VK, Fenu LA, Gilissen RA, Mackie CE and Nijsen MJ (2007)
The prediction of drug metabolism, tissue distribution and bioavailability of
50 structurally diverse compounds in rat using mechanism-based ADME
prediction tools. Drug Metab Dispos.
Ellmerer M, Schaupp L, Brunner GA, Sendlhofer G, Wutte A, Wach P and Pieber TR
(2000) Measurement of interstitial albumin in human skeletal muscle and
adipose tissue by open-flow microperfusion. Am J Physiol Endocrinol Metab
278:E352-356.
Giuliano C, Jairaj M, Zafiu CM and Laufer R (2005) Direct determination of unbound
intrinsic drug clearance in the microsomal stability assay. Drug Metab Dispos
33:1319-1324.
Houston JB (1994) Utility of in vitro drug metabolism data in predicting in vivo
metabolic clearance. Biochem Pharmacol 47:1469-1479.
This article has not been copyedited and formatted. The final version may differ from this version.DMD Fast Forward. Published on July 9, 2007 as DOI: 10.1124/dmd.107.015644
at ASPE
T Journals on M
arch 1, 2022dm
d.aspetjournals.orgD
ownloaded from
DMD#15644
29
Houston JB and Carlile DJ (1997) Prediction of hepatic clearance from microsomes,
hepatocytes, and liver slices. Drug Metab Rev 29:891-922.
Ito K and Houston JB (2004) Comparison of the use of liver models for predicting
drug clearance using in vitro kinetic data from hepatic microsomes and
isolated hepatocytes. Pharm Res 21:785-792.
Ito K and Houston JB (2005) Prediction of human drug clearance from in vitro and
preclinical data using physiologically based and empirical approaches. Pharm
Res 22:103-112.
Iwatsubo T, Hirota N, Ooie T, Suzuki H, Shimada N, Chiba K, Ishizaki T, Green CE,
Tyson CA and Sugiyama Y (1997) Prediction of in vivo drug metabolism in
the human liver from in vitro metabolism data. Pharmacol Ther 73:147-171.
Iwatsubo T, Hirota N, Ooie T, Suzuki H and Sugiyama Y (1996) Prediction of in vivo
drug disposition from in vitro data based on physiological pharmacokinetics.
Biopharm Drug Dispos 17:273-310.
Jones HM, Parrott N, Jorga K and Lave T (2006a) A novel strategy for
physiologically based predictions of human pharmacokinetics. Clin
Pharmacokinet 45:511-542.
Jones HM, Parrott N, Ohlenbusch G and Lave T (2006b) Predicting pharmacokinetic
food effects using biorelevant solubility media and physiologically based
modelling. Clin Pharmacokinet 45:1213-1226.
Kantharaj E, Tuytelaars A, Proost PE, Ongel Z, Van Assouw HP and Gilissen RA
(2003) Simultaneous measurement of drug metabolic stability and
identification of metabolites using ion-trap mass spectrometry. Rapid Commun
Mass Spectrom 17:2661-2668.
Leo A, Hansch C and Elkins D (1971) Partition coefficients and their uses. Chem Rev
71:525-615.
This article has not been copyedited and formatted. The final version may differ from this version.DMD Fast Forward. Published on July 9, 2007 as DOI: 10.1124/dmd.107.015644
at ASPE
T Journals on M
arch 1, 2022dm
d.aspetjournals.orgD
ownloaded from

DMD#15644
30
Lin JH (1998) Applications and limitations of interspecies scaling and in vitro
extrapolation in pharmacokinetics. Drug Metab Dispos 26:1202-1212.
Obach RS (1997) Nonspecific binding to microsomes: impact on scale-up of in vitro
intrinsic clearance to hepatic clearance as assessed through examination of
warfarin, imipramine, and propranolol. Drug Metab Dispos 25:1359-1369.
Obach RS (1999) Prediction of human clearance of twenty-nine drugs from hepatic
microsomal intrinsic clearance data: An examination of in vitro half-life
approach and nonspecific binding to microsomes. Drug Metab Dispos
27:1350-1359.
Obach RS, Baxter JG, Liston TE, Silber BM, Jones BC, MacIntyre F, Rance DJ and
Wastall P (1997) The prediction of human pharmacokinetic parameters from
preclinical and in vitro metabolism data. J Pharmacol Exp Ther 283:46-58.
Parrott N, Jones H, Paquereau N and Lave T (2005a) Application of full physiological
models for pharmaceutical drug candidate selection and extrapolation of
pharmacokinetics to man. Basic Clin Pharmacol Toxicol 96:193-199.
Parrott N, Paquereau N, Coassolo P and Lave T (2005b) An evaluation of the utility
of physiologically based models of pharmacokinetics in early drug discovery.
J Pharm Sci 94:2327-2343.
Pelkonen O, Kaltiala EH, Larmi TK and Karki NT (1973) Comparison of activities of
drug-metabolizing enzymes in human fetal and adult livers. Clin Pharmacol
Ther 14:840-846.
Poulin P, Schoenlein K and Theil FP (2001) Prediction of adipose tissue: plasma
partition coefficients for structurally unrelated drugs. J Pharm Sci 90:436-447.
Poulin P and Theil FP (2000) A priori prediction of tissue:plasma partition
coefficients of drugs to facilitate the use of physiologically-based
pharmacokinetic models in drug discovery. J Pharm Sci 89:16-35.
This article has not been copyedited and formatted. The final version may differ from this version.DMD Fast Forward. Published on July 9, 2007 as DOI: 10.1124/dmd.107.015644
at ASPE
T Journals on M
arch 1, 2022dm
d.aspetjournals.orgD
ownloaded from

DMD#15644
31
Poulin P and Theil FP (2002) Prediction of pharmacokinetics prior to in vivo studies.
1. Mechanism-based prediction of volume of distribution. J Pharm Sci
91:129-156.
Riley RJ, McGinnity DF and Austin RP (2005) A unified model for predicting human
hepatic, metabolic clearance from in vitro intrinsic clearance data in
hepatocytes and microsomes. Drug Metab Dispos 33:1304-1311.
Rodgers T, Leahy D and Rowland M (2005a) Physiologically based pharmacokinetic
modeling 1: predicting the tissue distribution of moderate-to-strong bases. J
Pharm Sci 94:1259-1276.
Rodgers T, Leahy D and Rowland M (2005b) Tissue distribution of basic drugs:
accounting for enantiomeric, compound and regional differences amongst
beta-blocking drugs in rat. J Pharm Sci 94:1237-1248.
Rodgers T and Rowland M (2006) Physiologically based pharmacokinetic modelling
2: predicting the tissue distribution of acids, very weak bases, neutrals and
zwitterions. J Pharm Sci 95:1238-1257.
Sawada Y, Hanano M, Sugiyama Y, Harashima H and Iga T (1984) Prediction of the
volumes of distribution of basic drugs in humans based on data from animals.
J Pharmacokinet Biopharm 12:587-596.
Sun D, Lennernas H, Welage LS, Barnett JL, Landowski CP, Foster D, Fleisher D,
Lee KD and Amidon GL (2002) Comparison of human duodenum and Caco-2
gene expression profiles for 12,000 gene sequences tags and correlation with
permeability of 26 drugs. Pharm Res 19:1400-1416.
Theil FP, Guentert TW, Haddad S and Poulin P (2003) Utility of physiologically
based pharmacokinetic models to drug development and rational drug
discovery candidate selection. Toxicol Lett 138:29-49.
This article has not been copyedited and formatted. The final version may differ from this version.DMD Fast Forward. Published on July 9, 2007 as DOI: 10.1124/dmd.107.015644
at ASPE
T Journals on M
arch 1, 2022dm
d.aspetjournals.orgD
ownloaded from
DMD#15644
32
Ungell AL, Nylander S, Bergstrand S, Sjoberg A and Lennernas H (1998) Membrane
transport of drugs in different regions of the intestinal tract of the rat. J Pharm
Sci 87:360-366.
van de Waterbeemd H and Gifford E (2003) ADMET in silico modelling: towards
prediction paradise? Nat Rev Drug Discov 2:192-204.
Willmann S, Schmitt W, Keldenich J, Lippert J and Dressman JB (2004) A
physiological model for the estimation of the fraction dose absorbed in
humans. J Med Chem 47:4022-4031.
Yu LX and Amidon GL (1999) A compartmental absorption and transit model for
estimating oral drug absorption. Int J Pharm 186:119-125.
This article has not been copyedited and formatted. The final version may differ from this version.DMD Fast Forward. Published on July 9, 2007 as DOI: 10.1124/dmd.107.015644
at ASPE
T Journals on M
arch 1, 2022dm
d.aspetjournals.orgD
ownloaded from

DMD#15644
33
Legends to Figures
Fig. 1. Scheme of the generic disposition PBPK model for simulation of full plasma
and tissue concentration-time profiles in rat and human. An overview of all
physiological values is given in Table III. Estimation of rate and extent of oral
absorption from the gut was obtained using the Advanced Compartmental Absorption
and Transit model (ACAT) (Yu and Amidon, 1999; Agoram et al., 2001). For more
details on all methods used, refer to the Methods.
Fig. 2. Prediction accuracy for the physiologically based predictions of human
volume of distribution at steady-state (Vss) obtained using (A) Method Vd1, (B)
Method Vd2. Prediction accuracy for the physiologically based predictions of human
total body clearance from plasma (CL) obtained using (C) Method CL1, (D) Method
CL2. For more details on all methods used, refer to the Methods. Lines signify unity
and 2-fold errors between predicted and experimentally determined parameters.
Fig. 3. Prediction accuracy for the physiologically based predictions of human in vivo
terminal half-life (in vivo t1/2) obtained using (A) Method Vd1/CL1, (B) Method
Vd2/CL2. For more details on all methods used, refer to the Methods. Lines signify
unity and 2-fold errors between predicted and experimentally determined parameters.
Fig. 4. Prediction accuracy for the physiologically based predictions of human area
under the plasma concentration-time curve after oral dosing (AUC) and absolute oral
bioavailability (F, inserts) obtained using (A) the ACAT model and Method CL1, (B)
the ACAT model and Method CL2. For more details on all methods used, refer to the
Methods. Lines signify unity and 2-fold errors between predicted and experimentally
determined parameters.
This article has not been copyedited and formatted. The final version may differ from this version.DMD Fast Forward. Published on July 9, 2007 as DOI: 10.1124/dmd.107.015644
at ASPE
T Journals on M
arch 1, 2022dm
d.aspetjournals.orgD
ownloaded from

DMD#15644
34
Fig. 5. Prediction accuracy for the physiologically based predictions of the apparent
volume of distribution after oral administration (Vd/F) obtained using (A) the ACAT
model and Method Vd1/CL1, (B) the ACAT model and Method Vd2/CL2. Prediction
accuracy for the physiologically based predictions of the peak plasma concentration
after oral dosing (Cmax) obtained using (C) the ACAT model and Method Vd1/CL1,
(D) the ACAT model and Method Vd2/CL2. For more details on all methods used,
refer to the Methods. Lines signify unity and 2-fold errors between predicted and
experimentally determined parameters.
Fig. 6. Predictions of human plasma concentration-time profiles after oral dosing
using the ACAT model and either Method Vd1/CL1 (dotted line) or Method Vd2/CL2
(full line) for: (A) JNJ1; (B) JNJ2; (C) JNJ3; (D) JNJ4; (E) JNJ7; (F) JNJ8; (G) JNJ9;
(H) JNJ10; (I) JNJ11; (J) JNJ12; (K) JNJ13; (L) JNJ14; (M) JNJ15; (N) JNJ16; (O)
JNJ18; (P) JNJ19; (Q) JNJ20; (R) JNJ21; (S) JNJ22; (T) JNJ23; (U) JNJ24; (V)
JNJ25; (W) JNJ26. The observed data is shown in open squares. For more details on
all methods used, refer to the Methods.
This article has not been copyedited and formatted. The final version may differ from this version.DMD Fast Forward. Published on July 9, 2007 as DOI: 10.1124/dmd.107.015644
at ASPE
T Journals on M
arch 1, 2022dm
d.aspetjournals.orgD
ownloaded from

DMD#15644
35
Table I
In vitro and in silico physicochemical and biochemical properties of the 26 compounds
JNJ # Generic Mw pKa a LogPow a Species fup
a fuinc b,c,d RB
a in vivo CLint e
(ml/min/kg) Test
system a Peff
(10-4 cm/s) f,g Solubility (mg/ml)
JNJ1 Lorcainide 407 B 9.44 4.16 Rat 0.260 - 1.2 624 RLMic 4.78 Human 0.150 0.45 0.70 31.5 HLMic
265, 214, 192, 2.4, 0.18 in aqueous buffer at pH 2.2, 4.2, 5.9, 7.7 and 9.5, respectively
JNJ2 Domperidone 425 B 7.89 B 2.50 3.96 Rat 0.092 - 1.3 178 RLMic 1.88 Human 0.061 0.34 0.74 69.3 HLMic
0.31, 1.5, 0.057, 0.006, 0.001 in aqueous buffer at pH 2.3, 4.2, 6.0, 7.2, 8.0, respectively
JNJ3 Nebivolol 405 B 8.40 4.03 Rat 0.015 - 1.2 89.1 RLMic 1.86 Human 0.020 0.12 c 1.2 11.2 HLMic
0.046, 0.071, 0.91, 0.031, 0.12 in aqueous buffer at pH 1.9, 4.0, 5.4, 6.1, 8.1, respectively
JNJ4 Galantamine 287 B 8.20 1.11 Rat 0.755 - 1.0 20.8 RLMic 5.43 Human 0.822 0.86 c 1.2 2.49 HLMic
35, 39, 33, 38, 37, 41 in aqueous buffer at pH 2.0, 4.9, 5.2, 6.8, 7.5, 7.7, respectively
JNJ5 Alfentanil 416 B 6.50 2.21 Rat 0.164 - 0.69 416 RLMic - Human 0.079 0.97 0.63 190 HLMic
-
JNJ6 Sufentanil 386 B 8.10 4.02 Rat 0.069 - 0.74 250 RLMic - Human 0.075 0.87 0.74 184 HLMic
-
JNJ7 Ketanserin 395 B 7.50 3.30 Rat 0.012 - 0.65 10.0 RLMic 7.14 Human 0.049 0.32 0.70 31.5 HLMic
0.72, 1.30, 16, 15, 11, 0.050, 0.001 in aqueous buffer at pH 1.2, 2.6, 3.1, 3.5, 4.6, 5.7, 8.0, respectively
JNJ8 Ritanserin 478 B 8.20 B 2.07 5.20 Rat 0.015 - 0.74 139 RLMic 12.0 g Human 0.008 0.45 0.65 4.91 HLMic
1.4, 0.063, 0.037in aqueous buffer at pH 2.2, 4.1, 6.1, respectively
JNJ9 Sabeluzole 415 B 7.60 B 3.40 4.63 Rat 0.016 - 0.84 43.0 RLMic 2.93
This article has not been copyedited and form
atted. The final version m
ay differ from this version.
DM
D Fast Forw
ard. Published on July 9, 2007 as DO
I: 10.1124/dmd.107.015644 at ASPET Journals on March 1, 2022 dmd.aspetjournals.org Downloaded from

DMD#15644
36
Human 0.014 0.06 0.82 5.10 HLMic 13, 5.8, 1.3, 3.9, 0.19, 0.01 in aqueous buffer at pH 2.7, 3.3, 4.2, 4.6, 6.0, 6.9, respectively
JNJ10 - 297 B 9.47 4.03 Rat 0.141 - 2.0 312 RLMic 0.321 Human 0.115 0.12 c 1.4 10.5 HLMic
29, 11, 4.7, 2.9, 0.14, 0.061 in aqueous buffer at pH 3.4, 3.5, 4.5, 7.5, 9.14, 12.8, respectively
JNJ11 Lubeluzole 433 B 7.60 B 4.27 4.88 Rat 0.008 - 0.76 52.0 RLMic 2.79 Human 0.003 0.05 c 0.58 3.90 HLMic
0.013 in aqueous buffer at pH 6.9
JNJ12 - 296 B 9.88 B 3.00 1.18 Rat 0.820 - 1.5 20.8 RLMic 0.05 Human 0.867 0.85 c 1.5 0.570 HLMic
20, 20, 20, 7.56, 3.09 in aqueous buffer at pH 1.8, 3.8, 4.3, 7.45, 12.6, respectively
JNJ13 Ridogrel 366 A 4.90 B 3.84 3.54 Rat 0.049 - 0.80 5.10 RLHep 4.73 Human 0.033 1.0 d 0.77 2.20 HLHep
0.26, 0.02, 0.65, 9.8 in aqueous buffer at pH 2.1, 5.4, 7.0, 8.1, respectively
JNJ14 Laniquidar 584 B 7.90 B 3.30 5.50 Rat 0.002 - 0.79 51.7 RLMic 4.56 g Human 0.001 0.08 0.62 99.0 HLMic
12.4, 0.58, 0.10, 0.064 in aqueous buffer at pH 2.21, 2.78, 3.62, 7.05, respectively
JNJ15 Mazapertine 421 B 7.06 3.96 Rat 0.030 - 0.63 623 RLMic 5.70 g Human 0.011 0.13 c 0.52 231 HLMic
80, 43, 0.54, 0.21, 0.22 in aqueous buffer at pH 3.8, 4.7, 6.9, 8.9, 11.5, respectively
JNJ16 - 686 B 7.20 B 3.10 4.12 Rat 0.036 - 0.78 28.2 RLMic 1.85 Human 0.034 0.08 0.75 20.3 HLMic
13, 1.1, 0.75, 0.04, 0.01 in aqueous buffer at pH 2.2, 3.7, 5.7, 7.5, 8.6, respectively
JNJ17 - 558 3.90 Rat 0.028 - 1.0 416 RLMic -
B 7.26 B 6.18 B 4.00 A 8.28 Human 0.009 0.14 c 1.0 231 HLMic
-
JNJ18 Risperidone 411 B 8.24 B 3.11 3.04 Rat 0.118 - 0.85 250 RLMic 5.70 Human 0.100 0.34 0.67 7.96 HLMic
40, 4.1, 1.8, 0.25, 0.064 in aqueous buffer at pH 5.4, 6.0, 6.2, 7.5, 8.7, respectively
JNJ19 Levocabastine 420 B 9.90 A 3.20 1.75 Rat 0.465 - 1.1 1.25 RLHep 2.10
This article has not been copyedited and form
atted. The final version m
ay differ from this version.
DM
D Fast Forw
ard. Published on July 9, 2007 as DO
I: 10.1124/dmd.107.015644 at ASPET Journals on March 1, 2022 dmd.aspetjournals.org Downloaded from

DMD#15644
37
Human 0.453 1.0 d 1.2 0.33 HLHep 0.06, 0.05, 0.02, 0.02 in aqueous buffer at pH 2.0, 3.2, 6.0, 8.0, respectively
JNJ20 Norcisapride 313 B 9.10 B 3.00 1.51 Rat 0.650 - 1.5 2.43 RLMic 1.16 Human 0.625 0.79 c 1.6 0.88 HLMic
80, 92, 93, 74, 41 in aqueous buffer at pH 2.1, 4.8, 6.6, 7.8, 8.0, respectively
JNJ21 - 481 B 7.27 3.55 Rat 0.015 - 1.5 35.6 RLMic 1.96 Human 0.012 0.23 1.5 77.0 HLMic
0.05 in aqueous buffer at pH 1.2, 0.003 in SIFa at pH 7.53
JNJ22 - 570 A 8.21 4.78 Rat 0.001 - 0.74 156 RLMic 0.751 Human 0.001 0.90 0.55 116 HLMic
0.002 and 100 in aqueous buffer at pH 6.5 and 8.7, respectively and 0.249 in SIFa at pH 7.5
JNJ23 - 359 B 7.00 B 3.10 3.40 Rat 0.082 - 0.80 208 RLMic 3.41 Human 0.016 0.06 0.61 10.2 HLMic
10.3, 3.9, 0.42, 0.035, 0.002 in aqueous buffer at pH 3.0, 4.2, 5.1, 6.0, 8.1, respectively
JNJ24 - 380 B 7.23 B 5.20 5.24 Rat 0.007 - 0.75 371 RLHep 2.00 Human 0.006 1.0 d 0.59 8.97 HLHep
20, 10.2, 2.19, 0.026 in aqueous buffer at pH 1.4, 4.4, 5.2, 6.0, respectively and 0.005 SIFa at pH 7.4
JNJ25 - 660 B 6.80 B 2.86 4.84 Rat 0.015 - 0.70 19.9 RLMic 4.54 g Human 0.016 0.05 c 0.72 7.28 HLMic
1.6, 2.43, 0.52, 0.02, 0.01 in aqueous buffer at pH 2.1, 4.4, 5.0, 7.0, 9.0, respectively
JNJ26 - 500 B 5.95 B 3.67 4.00 Rat 0.036 - 1.3 24.8 RLHep 2.07 Human 0.023 1.0 d 1.5 9.03 HLHep
2.3, 0.18, 0.014, 0.005 in aqueous buffer at pH 2.3, 4.5, 5.9, 7.5
a A, acid; B, base; RB, blood-to-plasma partition coefficient; fup, fraction unbound in plasma; HLHep, human liver hepatocytes; HLMic, human liver microsomes;
logPow, octanol:water partition coefficient; RLHep, rat liver hepatocytes; RLMic, rat liver microsomes; SIF, simulated intestinal fluid b fuinc, experimentally determined unbound fraction in in vitro incubation matrix. Experimental values of fuinc in human microsomal protein was determined according
to (Giuliano et al., 2005). Rat fuinc was assumed to equal human fuinc c Predicted fuinc value in microsomes according to (Austin et al., 2002)
This article has not been copyedited and form
atted. The final version m
ay differ from this version.
DM
D Fast Forw
ard. Published on July 9, 2007 as DO
I: 10.1124/dmd.107.015644 at ASPET Journals on March 1, 2022 dmd.aspetjournals.org Downloaded from
DMD#15644
38
d Hepatocyte incubation performed in protein-free medium (fuinc=1)
e in vivo CLint, in vivo intrinsic clearance calculated using equation 6 as described in the Methods f Permeability measured using a Caco-2 assay and converted to effective human jejunal permeability (Peff) using the reported correlation logPeff,human =
0.6532•logPapp,caco-2 – 0.3036 (Sun et al., 2002).
g In silico predicted Peff (ADMETpredictor software version 1.3.2, Simulations Plus Inc., Lancaster, CA, USA)
This article has not been copyedited and form
atted. The final version m
ay differ from this version.
DM
D Fast Forw
ard. Published on July 9, 2007 as DO
I: 10.1124/dmd.107.015644 at ASPET Journals on March 1, 2022 dmd.aspetjournals.org Downloaded from

DMD#15644
39
Table II
Summary of the preclinical (rat) and clinical pharmacokinetic data for the 26 compounds.
JNJ# Species D a Route
CL
or
CL/F a CLR a
Vss
or
Vd/F a
in vivo
t1/2 a Cmax
a AUC a Experimentally determined in vivo rat Ptp b
(mg) (L/h) (L/h) (L) (h) (ng/ml) (ng.h/ml) lung adipose muscle liver spleen heart brain kidney skin testes bone
JNJ1 Human 100 IV 71.6 - 413 5.10 - 1.40E+03 - - - - - - - - - - -
Human 100 PO 202 - 1.49E+03 - 60.1 494 - - - - - - - - - - -
Rat 2.50 IV 1.55 - 3.92 2.91 - 1.61E+03 19.4 5.27 6.50 0.571 10.3 2.91 1.52 5.68 - - -
Rat 1.88 PO 4.24 - - - - 442 - - - - - - - - - - -
- - - - - - - - - - -
JNJ2 Human 10.0 IV 34.3 - 157 7.59 - 292 - - - - - - - - - - -
Human 60.0 PO 232 - 2.54E+03 - 102 259 - - - - - - - - - - -
Rat 0.625 IV 1.30 - 1.39 0.871 - 480 10.9 3.21 3.45 13.8 - 3.87 - 22.5 4.35 - -
Rat 0.625 PO 6.01 - - - - 104 - - - - - - - - - - -
- - - - - - - - - - -
JNJ3 Human 0.500 IV 80.5 - 1.14E+03 10.40 - 6.20 - - - - - - - - - - -
Human 5.00 PO 192 - 2.87E+03 - 2.01 26.1 - - - - - - - - - - -
Rat 0.313 IV 0.736 - 1.55 1.37 - 425 99.7 2.67 2.95 14.1 15.6 4.71 3.73 10.6 7.65 5.32 7.87;14.1
Rat 0.313 PO 0.925 - - - - 338 - - - - - - - - - - -
- - - - - - - - - - -
JNJ4 Human 8.00 IV 17.8 3.93 175 7.40 - 482 - - - - - - - - - - -
Human 8.00 PO 18.7 - 200 - 42.6 427 - - - - - - - - - - -
Rat 0.625 IV 0.473 0.100 1.30 3.48 - 1.32E+03 4.42 0.476 2.14 2.53 2.92 2.28 1.51 14.5 1.14 1.46 4.79;4.81
This article has not been copyedited and form
atted. The final version m
ay differ from this version.
DM
D Fast Forw
ard. Published on July 9, 2007 as DO
I: 10.1124/dmd.107.015644 at ASPET Journals on March 1, 2022 dmd.aspetjournals.org Downloaded from

DMD#15644
40
Rat 0.625 PO 0.803 - - - - 778 - - - - - - - - - - -
- - - - - - - - - - -
JNJ5 Human 8.75 IV 21.2 - 28.8 1.37 - 510 - - - - - - - - - - -
Human - PO - - - - - - - - - - - - - - - - -
Rat 4.00E-02 IV 0.464 - 0.110 0.146 - 86.2 1.11 3.01 0.440 1.43 1.05 0.791 0.181 1.18 0.512 0.481 -
Rat - PO - - - - - - - - - - - - - - - - -
- - - - - - - - - - -
JNJ6 Human 0.350 IV 49.6 - 128 2.47 - 8.10 - - - - - - - - - - -
Human - PO - - - - - - - - - - - - - - - - -
Rat 6.25E-04 IV 1.04 - 0.967 1.05 - 0.604 6.18 7.72 1.71 0.370 2.80 1.80 2.08 1.17 - 1.97 -
Rat - PO - - - - - - - - - - - - - - - - -
- - - - - - - - - - -
JNJ7 Human 10.0 IV 33.9 - 268 14.3 - 298 - - - - - - - - - - -
Human 20.0 PO 71.7 - 1.48E+03 - 71.4 279 - - - - - - - - - - -
Rat 2.50 IV 5.75E-02 - 0.168 2.00 - 4.35E+04 1.49 0.562 0.284 2.60 0.911 0.354 0.194 1.53 0.463 0.495 0.19;0.18
Rat 2.50 PO 9.82E-02 - - - - 2.55E+04 - - - - - - - - - - -
- - - - - - - - - - -
JNJ8 Human 5.00 IV 2.14 - 99.0 40.0 - 2.51E+03 - - - - - - - - - - -
Human 10.0 PO 2.33 - 134 - 164 4.30E+03 - - - - - - - - - - -
Rat 0.625 IV 0.400 - 2.00 2.52 - 1.56E+03 27.8 4.29 3.02 21.8 - - 10.5 14.1 - - -
Rat 0.625 PO 0.918 - - - - 681 - - - - - - - - - - -
- - - - - - - - - - -
JNJ9 Human 10.0 IV 17.0 - 385 18.9 - 594 - - - - - - - - - - -
Human 5.00 PO 22.7 - 621 - 14.5 220 - - - - - - - - - - -
This article has not been copyedited and form
atted. The final version m
ay differ from this version.
DM
D Fast Forw
ard. Published on July 9, 2007 as DO
I: 10.1124/dmd.107.015644 at ASPET Journals on March 1, 2022 dmd.aspetjournals.org Downloaded from
DMD#15644
41
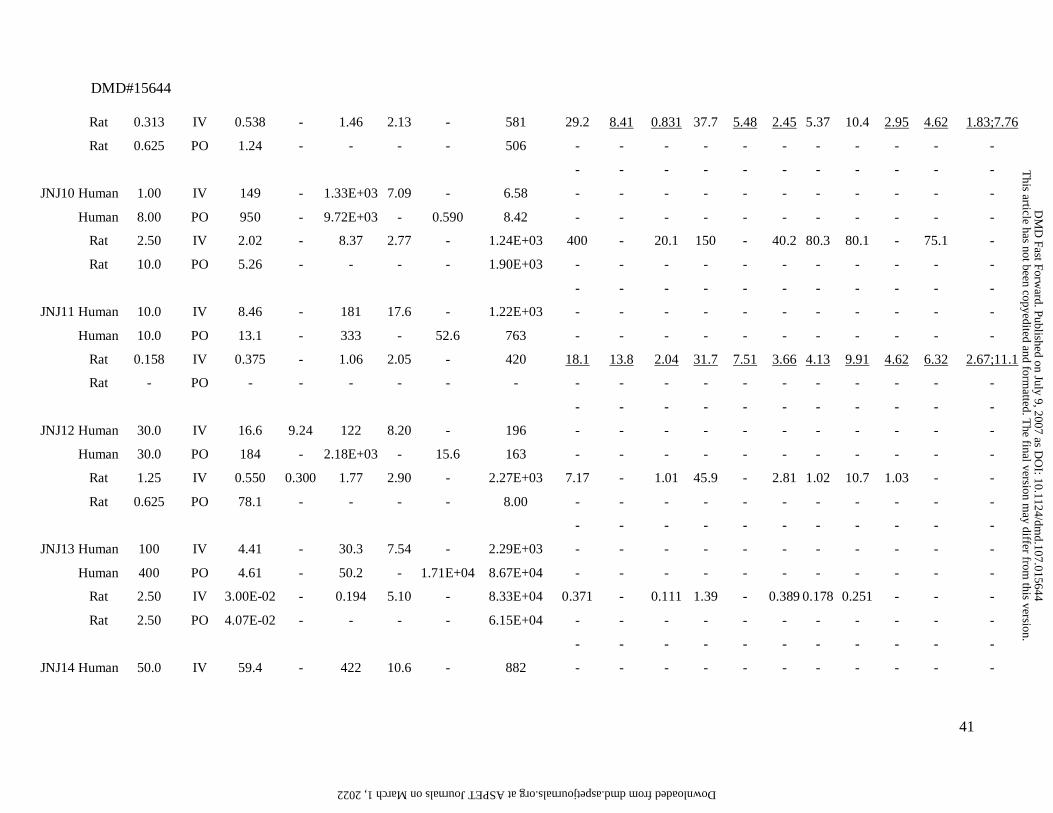
Rat 0.313 IV 0.538 - 1.46 2.13 - 581 29.2 8.41 0.831 37.7 5.48 2.45 5.37 10.4 2.95 4.62 1.83;7.76
Rat 0.625 PO 1.24 - - - - 506 - - - - - - - - - - -
- - - - - - - - - - -
JNJ10 Human 1.00 IV 149 - 1.33E+03 7.09 - 6.58 - - - - - - - - - - -
Human 8.00 PO 950 - 9.72E+03 - 0.590 8.42 - - - - - - - - - - -
Rat 2.50 IV 2.02 - 8.37 2.77 - 1.24E+03 400 - 20.1 150 - 40.2 80.3 80.1 - 75.1 -
Rat 10.0 PO 5.26 - - - - 1.90E+03 - - - - - - - - - - -
- - - - - - - - - - -
JNJ11 Human 10.0 IV 8.46 - 181 17.6 - 1.22E+03 - - - - - - - - - - -
Human 10.0 PO 13.1 - 333 - 52.6 763 - - - - - - - - - - -
Rat 0.158 IV 0.375 - 1.06 2.05 - 420 18.1 13.8 2.04 31.7 7.51 3.66 4.13 9.91 4.62 6.32 2.67;11.1
Rat - PO - - - - - - - - - - - - - - - - -
- - - - - - - - - - -
JNJ12 Human 30.0 IV 16.6 9.24 122 8.20 - 196 - - - - - - - - - - -
Human 30.0 PO 184 - 2.18E+03 - 15.6 163 - - - - - - - - - - -
Rat 1.25 IV 0.550 0.300 1.77 2.90 - 2.27E+03 7.17 - 1.01 45.9 - 2.81 1.02 10.7 1.03 - -
Rat 0.625 PO 78.1 - - - - 8.00 - - - - - - - - - - -
- - - - - - - - - - -
JNJ13 Human 100 IV 4.41 - 30.3 7.54 - 2.29E+03 - - - - - - - - - - -
Human 400 PO 4.61 - 50.2 - 1.71E+04 8.67E+04 - - - - - - - - - - -
Rat 2.50 IV 3.00E-02 - 0.194 5.10 - 8.33E+04 0.371 - 0.111 1.39 - 0.389 0.178 0.251 - - -
Rat 2.50 PO 4.07E-02 - - - - 6.15E+04 - - - - - - - - - - -
- - - - - - - - - - -
JNJ14 Human 50.0 IV 59.4 - 422 10.6 - 882 - - - - - - - - - - -
This article has not been copyedited and form
atted. The final version m
ay differ from this version.
DM
D Fast Forw
ard. Published on July 9, 2007 as DO
I: 10.1124/dmd.107.015644 at ASPET Journals on March 1, 2022 dmd.aspetjournals.org Downloaded from

DMD#15644
42
Human 200 PO 568 - 8.69E+03 - 187 352 - - - - - - - - - - -
Rat 4.55 IV 0.697 - 2.24 2.92 - 6.53E+03 38.7 25.5 7.07 16.8 8.44 5.82 2.86 12.0 8.52 3.81 1.83;8.32
Rat 2.50 PO 2.52 - - - - 994 - - - - - - - - - - -
- - - - - - - - - - -
JNJ15 Human 2.80 IV 25.9 - 108 4.60 - - - - - - - - - - - - -
Human 40.0 PO 56.4 - 374 - - 0.650 - - - - - - - - - - -
Rat 1.25 IV 0.588 - 0.433 1.94 - 2.13E+03 2.31 8.01 1.49 20.5 1.55 1.52 0.620 7.36 1.12 0.762 -
Rat 7.50 PO 2.96 - - - - 2.54E+03 - - - - - - - - - - -
- - - - - - - - - - -
JNJ16 Human 50.0 IV 36.0 - 717 18.9 - 1.37E+03 - - - - - - - - - - -
Human 200 PO 68.1 - 1.86E+03 - 220 2.94E+03 - - - - - - - - - - -
Rat 0.500 IV 0.370 - 1.46 2.92 - 1.35E+03 46.7 - 3.24 35.5 20.9 7.73 0.661 14.1 - 2.35 -
Rat 2.50 PO 0.440 - - - - 5.68E+03 - - - - - - - - - - -
- - - - - - - - - - -
JNJ17 Human 75.0 IV 31.2 - 172 5.14 - 2.45E+03 - - - - - - - - - - -
Human - PO - - - - - - - - - - - - - - - - -
Rat 0.500 IV 1.40 - 15.4 6.67 - 357 56.1 15.3 20.5 48.2 50.4 40.1 1.12 92.3 10.1 2.11 -
Rat 2.50 PO - - - - - - - - - - - - - - - - -
- - - - - - - - - - -
JNJ18 Human 1.00 IV 23.6 0.780 81.0 2.80 - 45.3 - - - - - - - - - - -
Human 1.00 PO 31.3 - 126 - 7.90 32.0 - - - - - - - - - - -
Rat 0.313 IV 0.962 - 0.443 0.600 - 325 3.42 - 0.581 12.3 - 0.822 0.233 6.43 - - -
Rat 0.313 PO 3.52 - - - - 88.8 - - - - - - - - - - -
- - - - - - - - - - -
This article has not been copyedited and form
atted. The final version m
ay differ from this version.
DM
D Fast Forw
ard. Published on July 9, 2007 as DO
I: 10.1124/dmd.107.015644 at ASPET Journals on March 1, 2022 dmd.aspetjournals.org Downloaded from
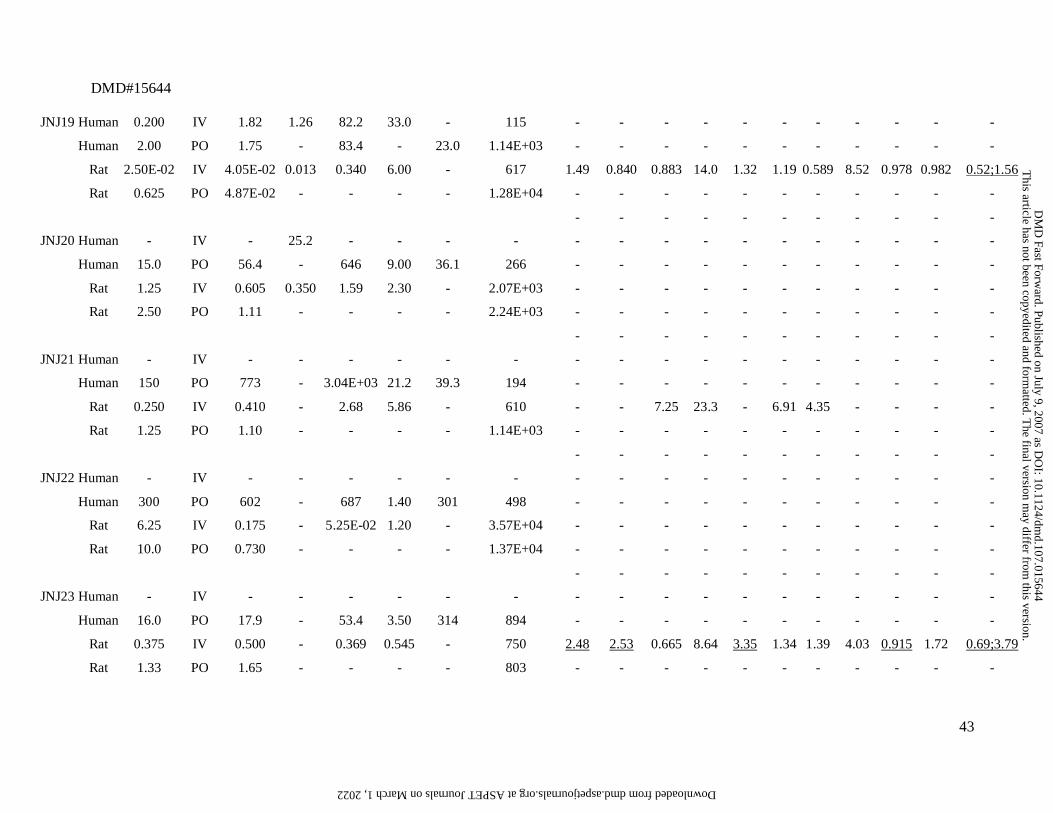
DMD#15644
43
JNJ19 Human 0.200 IV 1.82 1.26 82.2 33.0 - 115 - - - - - - - - - - -
Human 2.00 PO 1.75 - 83.4 - 23.0 1.14E+03 - - - - - - - - - - -
Rat 2.50E-02 IV 4.05E-02 0.013 0.340 6.00 - 617 1.49 0.840 0.883 14.0 1.32 1.19 0.589 8.52 0.978 0.982 0.52;1.56
Rat 0.625 PO 4.87E-02 - - - - 1.28E+04 - - - - - - - - - - -
- - - - - - - - - - -
JNJ20 Human - IV - 25.2 - - - - - - - - - - - - - - -
Human 15.0 PO 56.4 - 646 9.00 36.1 266 - - - - - - - - - - -
Rat 1.25 IV 0.605 0.350 1.59 2.30 - 2.07E+03 - - - - - - - - - - -
Rat 2.50 PO 1.11 - - - - 2.24E+03 - - - - - - - - - - -
- - - - - - - - - - -
JNJ21 Human - IV - - - - - - - - - - - - - - - - -
Human 150 PO 773 - 3.04E+03 21.2 39.3 194 - - - - - - - - - - -
Rat 0.250 IV 0.410 - 2.68 5.86 - 610 - - 7.25 23.3 - 6.91 4.35 - - - -
Rat 1.25 PO 1.10 - - - - 1.14E+03 - - - - - - - - - - -
- - - - - - - - - - -
JNJ22 Human - IV - - - - - - - - - - - - - - - - -
Human 300 PO 602 - 687 1.40 301 498 - - - - - - - - - - -
Rat 6.25 IV 0.175 - 5.25E-02 1.20 - 3.57E+04 - - - - - - - - - - -
Rat 10.0 PO 0.730 - - - - 1.37E+04 - - - - - - - - - - -
- - - - - - - - - - -
JNJ23 Human - IV - - - - - - - - - - - - - - - - -
Human 16.0 PO 17.9 - 53.4 3.50 314 894 - - - - - - - - - - -
Rat 0.375 IV 0.500 - 0.369 0.545 - 750 2.48 2.53 0.665 8.64 3.35 1.34 1.39 4.03 0.915 1.72 0.69;3.79
Rat 1.33 PO 1.65 - - - - 803 - - - - - - - - - - -
This article has not been copyedited and form
atted. The final version m
ay differ from this version.
DM
D Fast Forw
ard. Published on July 9, 2007 as DO
I: 10.1124/dmd.107.015644 at ASPET Journals on March 1, 2022 dmd.aspetjournals.org Downloaded from

DMD#15644
44
- - - - - - - - - - -
JNJ24 Human - IV - - - - - - - - - - - - - - - - -
Human 80.0 PO 26.5 - 635 26.6 551 3.02E+03 - - - - - - - - - - -
Rat 0.625 IV 0.829 - 0.947 2.40 - 754 3.43 3.36 4.36 27.9 2.53 2.65 1.00 4.89 0.936 4.53 0.58;2.54
Rat 1.25 PO 9.77 - - - - 128 - - - - - - - - - - -
- - - - - - - - - - -
JNJ25 Human - IV - - - - - - - - - - - - - - - - -
Human 200 PO 19.9 - 413 22.7 701 1.01E+04 - - - - - - - - - - -
Rat 0.625 IV 0.320 - 1.735 4.33 - 1.95E+03 20.6 3.80 2.27 11.7 6.74 4.27 0.663 2.96 1.09 0.666 0.63;2.44
Rat 1.25 PO 0.373 - - - - 3.35E+03 - - - - - - - - - - -
- - - - - - - - - - -
JNJ26 Human - IV - - - - - - - - - - - - - - - - -
Human 20.0 PO 38.8 - 292 9.80 99 516 - - - - - - - - - - -
Rat 0.625 IV 0.365 - 0.609 1.47 - 1.71E+03 2.51 20.0 1.20 2.10 1.10 1.70 0.500 2.00 2.51 2.11 2.72;20.0
Rat 2.50 PO 11.1 - - - - 226 - - - - - - - - - - -
a AUC, area under the plasma concentration-time curve; CL, total body clearance from plasma; CL/F, total body clearance from plasma after oral dosing; Cmax, peak plasma
concentration; in vivo t1/2, in vivo terminal half-life; D, Dose; Vss, volume of distribution at steady-state; Vd/F, apparent volume of distribution during terminal phase after oral
dosing b Ptp, tissue-to-plasma partition coefficient. Experimental rat Ptp values were determined under in vivo conditions (single oral or intravenous dose) as the ratio of the
AUC calculated over a minimum of five time points, assuming pseudo-equilibrium. Underlined values refer to in vivo rat Ptp obtained using total radioactivity
measurements
This article has not been copyedited and form
atted. The final version m
ay differ from this version.
DM
D Fast Forw
ard. Published on July 9, 2007 as DO
I: 10.1124/dmd.107.015644 at ASPET Journals on March 1, 2022 dmd.aspetjournals.org Downloaded from

DMD#15644
45
Table III
Physiological values for tissue volumes and blood flows in rat and human a
Rat Human
Tissue
Blood flow
(ml/min)
Volume
(ml)
Blood flow
(L/min)
Volume
(L)
Lung 53.0 2.10 6.08 1.11
Spleen 0.600 0.600 0.184 0.184
Liver 13.8 10.3 1.50 1.63
ACAT gut 7.50 0.836
Adipose 0.400 10.0 0.605 30.3
Muscle 7.50 122 0.622 20.7
Heart 3.90 1.20 0.230 0.315
Brain 1.30 1.24 0.882 1.73
Kidney 9.20 3.70 1.02 0.277
Skin 5.80 40.0 0.235 1.96
Testes 0.500 2.50 0.007 0.032
Red Marrow 1.30 1.33 0.354 1.18
Yellow Marrow 0.275 2.81 0.098 3.28
Rest of body 9.01 41.5 0.529 17.6
Arterial blood 53.0 5.60 6.08 2.21
Venous blood 53.0 11.3 6.08 4.42
a Default values taken from the Gastroplus software 5.1.0 generic rat and
human PBPK model
This article has not been copyedited and formatted. The final version may differ from this version.DMD Fast Forward. Published on July 9, 2007 as DOI: 10.1124/dmd.107.015644
at ASPE
T Journals on M
arch 1, 2022dm
d.aspetjournals.orgD
ownloaded from

DMD#15644
46
Table IV
Statistics for the predicted human pharmacokinetic parameters obtained using
Method Vd1 and Method CL1 a
Parameter a n
Average fold
error (afe)
Root mean squared
error (rmse)
% within
2-fold error
% within
3-fold error
Vss (L) 19 2.10 604 31.6 52.6
CL (L/h) 19 2.41 36.3 52.6 68.4
CLR (L/h) 4 1.09 5.41 100 100
in vivo t1/2 (h) 26 5.40 903 26.9 38.5
Vd/F (L) 23 1.38 9.33E+03 21.7 39.1
AUC (ng.h/ml) 23 5.09 7.91E+04 34.8 43.5
Cmax (ng/ml) 23 1.39 2.94E+03 65.2 69.6
F (%) 16 1.60 31.0 62.5 b - a See Methods for more details on prediction of each parameter using Method Vd1
and/or Method CL1. Vss, apparent volume of distribution at steady-state; CL, total
body clearance from plasma; CLR, renal clearance from plasma; in vivo t1/2, in vivo
terminal half-life; Vd/F, volume of distribution during terminal phase after oral
dosing; AUC, area under plasma concentration-time curve after oral dosing; Cmax,
peak plasma concentration after oral dosing; F, absolute oral bioavailability
b % within 1.5-fold error
This article has not been copyedited and formatted. The final version may differ from this version.DMD Fast Forward. Published on July 9, 2007 as DOI: 10.1124/dmd.107.015644
at ASPE
T Journals on M
arch 1, 2022dm
d.aspetjournals.orgD
ownloaded from

DMD#15644
47
Table V
Statistics for the predicted human pharmacokinetic parameters obtained using
Method Vd2 and Method CL2 a
Parameter a n
Average fold
error (afe)
Root mean squared
error (rmse)
% within
2-fold error
% within
3-fold error
Vss (L) 19 1.14 207 84.2 94.7
CL (L/h) 19 1.10 31.3 73.7 89.5
CLR (L/h) 4 1.09 5.41 100 100
in vivo t1/2 (h) 26 1.49 8.72 69.2 88.5
Vd/F (L) 23 1.32 2.10E+03 69.6 82.6
AUC (ng.h/ml) 23 1.06 6.45E+03 73.9 87.0
Cmax (ng/ml) 23 1.31 2.01E+03 65.2 91.3
F (%) 16 1.06 15.0 81.3 b - a See Methods for more details on prediction of each parameter using Method
Vd2 and/or Method CL2. Vss, apparent volume of distribution at steady-state;
CL, total body clearance from plasma; CLR, renal clearance from plasma; in vivo
t1/2, in vivo terminal half-life; Vd/F, volume of distribution during terminal phase
after oral dosing; AUC, area under plasma concentration-time curve after oral
dosing; Cmax, peak plasma concentration after oral dosing; F, absolute oral
bioavailability b % within 1.5-fold error
This article has not been copyedited and formatted. The final version may differ from this version.DMD Fast Forward. Published on July 9, 2007 as DOI: 10.1124/dmd.107.015644
at ASPE
T Journals on M
arch 1, 2022dm
d.aspetjournals.orgD
ownloaded from
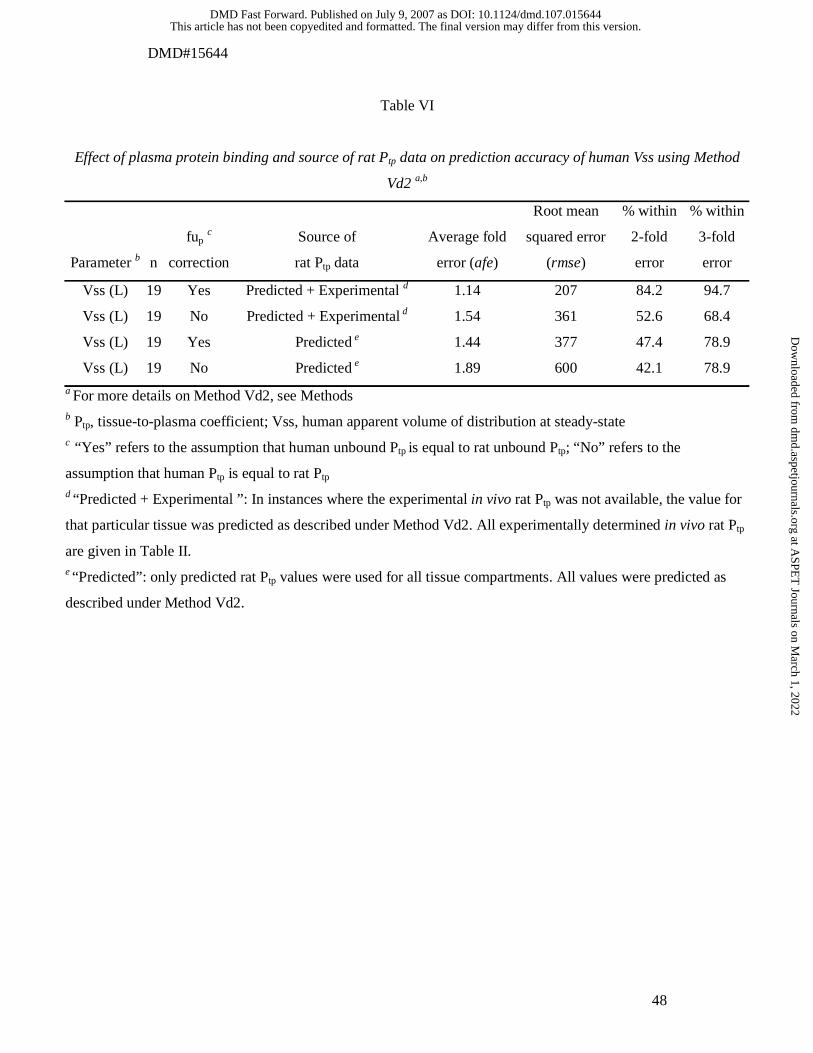
DMD#15644
48
Table VI
Effect of plasma protein binding and source of rat Ptp data on prediction accuracy of human Vss using Method
Vd2 a,b
Parameter b n
fup c
correction
Source of
rat Ptp data
Average fold
error (afe)
Root mean
squared error
(rmse)
% within
2-fold
error
% within
3-fold
error
Vss (L) 19 Yes Predicted + Experimental d 1.14 207 84.2 94.7
Vss (L) 19 No Predicted + Experimental d 1.54 361 52.6 68.4
Vss (L) 19 Yes Predicted e 1.44 377 47.4 78.9
Vss (L) 19 No Predicted e 1.89 600 42.1 78.9
a For more details on Method Vd2, see Methods b Ptp, tissue-to-plasma coefficient; Vss, human apparent volume of distribution at steady-state c “Yes” refers to the assumption that human unbound Ptp is equal to rat unbound Ptp; “No” refers to the
assumption that human Ptp is equal to rat Ptp d “Predicted + Experimental ”: In instances where the experimental in vivo rat Ptp was not available, the value for
that particular tissue was predicted as described under Method Vd2. All experimentally determined in vivo rat Ptp
are given in Table II.
e “Predicted”: only predicted rat Ptp values were used for all tissue compartments. All values were predicted as
described under Method Vd2.
This article has not been copyedited and formatted. The final version may differ from this version.DMD Fast Forward. Published on July 9, 2007 as DOI: 10.1124/dmd.107.015644
at ASPE
T Journals on M
arch 1, 2022dm
d.aspetjournals.orgD
ownloaded from

DMD#15644
49
Table VII
Statistics for the predicted rat pharmacokinetic parameters
Parameter b Method a Source of rat Ptp data b
Average
fold error
(afe)
Root mean
squared
error (rmse)
% within
2-fold
error
% within
3-fold
error
Vss (L) Method Vd1 Predicted c 1.07 3.23 42.3 53.8
Vss (L) Method Vd2 Predicted + Experimental d 1.51 2.52 73.1 88.5
Vss (L) Method Vd2 Predicted c 1.10 3.10 65.4 80.8
CL (L/h) Method CL1 - 3.59 0.468 34.6 53.8
CL (L/h) Method CL2 - 1.23 0.311 84.6 100 a For more details on Method Vd1, Method Vd2, Method CL1 and Method CL2, see Methods b Vss, apparent volume of distribution at steady-state; CL, total body clearance from plasma; Ptp,
tissue-to-plasma coefficient
c “Predicted” : only predicted rat Ptp values were used for all tissue compartments.
d “Predicted + Experimental ”: In instances where the experimental in vivo rat Ptp was not available,
the value for that particular tissue compartment was predicted as described under Method Vd2. All
experimentally determined in vivo rat Ptp are given in Table II
This article has not been copyedited and formatted. The final version may differ from this version.DMD Fast Forward. Published on July 9, 2007 as DOI: 10.1124/dmd.107.015644
at ASPE
T Journals on M
arch 1, 2022dm
d.aspetjournals.orgD
ownloaded from

DMD#15644
50
Table VIII
Statistics for the predicted human plasma concentrations after oral dosing
Approach a n
Average
fold error
(afe)
Root mean
squared error
(rmse)
% within
1.5-fold
error
% within
2-fold
error
% within
3-fold
error
Method Vd1/CL1 261 b 2.29 1.57 25.7 36.5 50.9
Method Vd2/CL2 261 b 1.03 1.20 43.4 60.0 74.8
a For details on prediction of oral plasma concentrations using Method Vd1/CL1 and
Method Vd2/CL2, see Methods
b the total pool (n=261) of mean plasma concentrations (ug/ml) for all compounds of
Table II after oral dosing.
This article has not been copyedited and formatted. The final version may differ from this version.DMD Fast Forward. Published on July 9, 2007 as DOI: 10.1124/dmd.107.015644
at ASPE
T Journals on M
arch 1, 2022dm
d.aspetjournals.orgD
ownloaded from

Figure 1
Rest of BodyRest of Body
Bone marrowBone marrow
TestesTestes
SkinSkin
KidneyKidney
BrainBrain
HeartHeart
AdiposeAdipose
LungLung
LiverLiver
SpleenSpleenVenous Venous ReturnReturn
Arterial Arterial SupplySupply
GutGut
MuscleMuscle
This article has not been copyedited and form
atted. The final version m
ay differ from this version.
DM
D Fast Forw
ard. Published on July 9, 2007 as DO
I: 10.1124/dmd.107.015644 at ASPET Journals on March 1, 2022 dmd.aspetjournals.org Downloaded from

Figure 2
This article has not been copyedited and form
atted. The final version m
ay differ from this version.
DM
D Fast Forw
ard. Published on July 9, 2007 as DO
I: 10.1124/dmd.107.015644 at ASPET Journals on March 1, 2022 dmd.aspetjournals.org Downloaded from

Figure 3
This article has not been copyedited and form
atted. The final version m
ay differ from this version.
DM
D Fast Forw
ard. Published on July 9, 2007 as DO
I: 10.1124/dmd.107.015644 at ASPET Journals on March 1, 2022 dmd.aspetjournals.org Downloaded from

Figure 4
This article has not been copyedited and form
atted. The final version m
ay differ from this version.
DM
D Fast Forw
ard. Published on July 9, 2007 as DO
I: 10.1124/dmd.107.015644 at ASPET Journals on March 1, 2022 dmd.aspetjournals.org Downloaded from

Figure 5
This article has not been copyedited and formatted. The final version may differ from this version.DMD Fast Forward. Published on July 9, 2007 as DOI: 10.1124/dmd.107.015644
at ASPE
T Journals on M
arch 1, 2022dm
d.aspetjournals.orgD
ownloaded from

Figure 6
This article has not been copyedited and formatted. The final version may differ from this version.DMD Fast Forward. Published on July 9, 2007 as DOI: 10.1124/dmd.107.015644
at ASPE
T Journals on M
arch 1, 2022dm
d.aspetjournals.orgD
ownloaded from