Embed Size (px)
Citation preview
1
Nonlinear Pharmacokinetics
Dr. Chalet Tan
Quantitative Pharmacokinetics
2
Learning Objectives
profiles of nonlinear kinetics
sources and effects of dose dependency on ADME
Michaelis-Menten equation and parameters (Vmax, Km) for
capacity-limited metabolism
Case Study
An epileptic patient who has not responded to
phenytoin after 2 weeks on 300 mg/day is observed to have a
plasma concentration of 4 mg/ml. Twenty days after the daily
dose is subsequently increased to 500 mg/day, the patient
develops severe toxicities. The plasma concentrations of
phenotoin is now 36 mg/L.
4
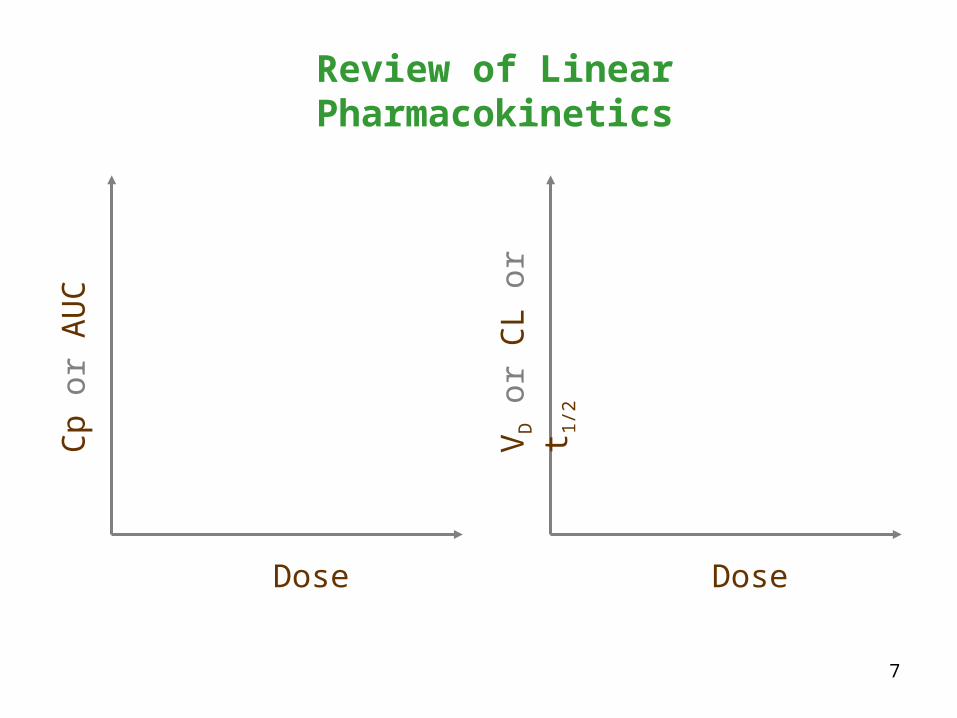
Review of Linear Pharmacokinetics
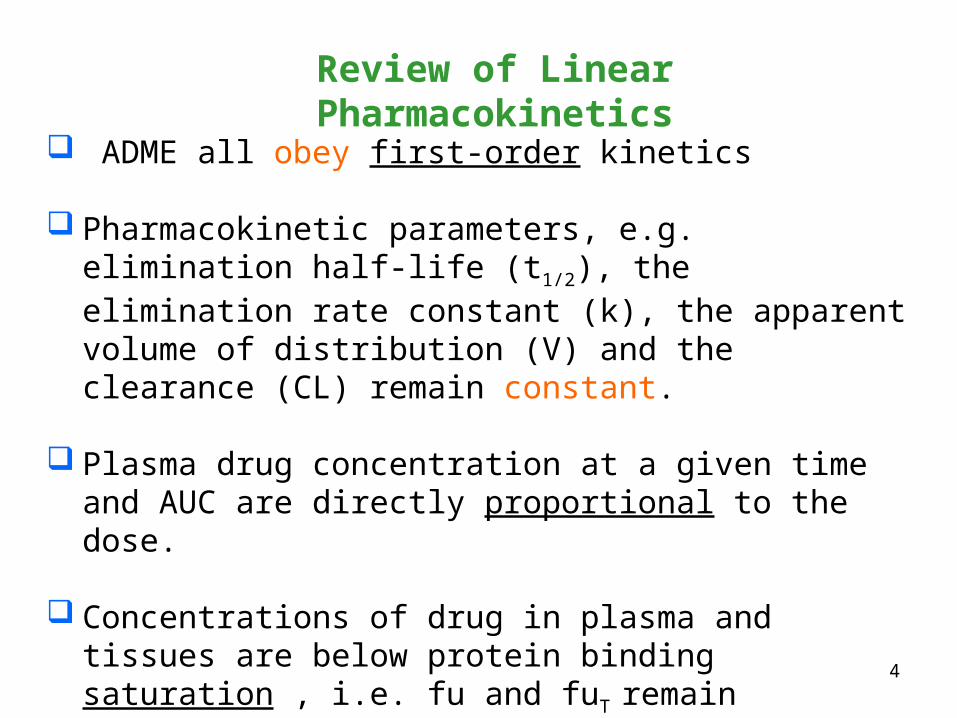
ADME all obey first-order kinetics
Pharmacokinetic parameters, e.g. elimination half-life (t1/2), the elimination rate constant (k), the apparent volume of distribution (V) and the clearance (CL) remain constant.
Plasma drug concentration at a given time and AUC are directly proportional to the dose.
Concentrations of drug in plasma and tissues are below protein binding saturation , i.e. fu and fuT remain constant.
Review of Linear Pharmacokinetics
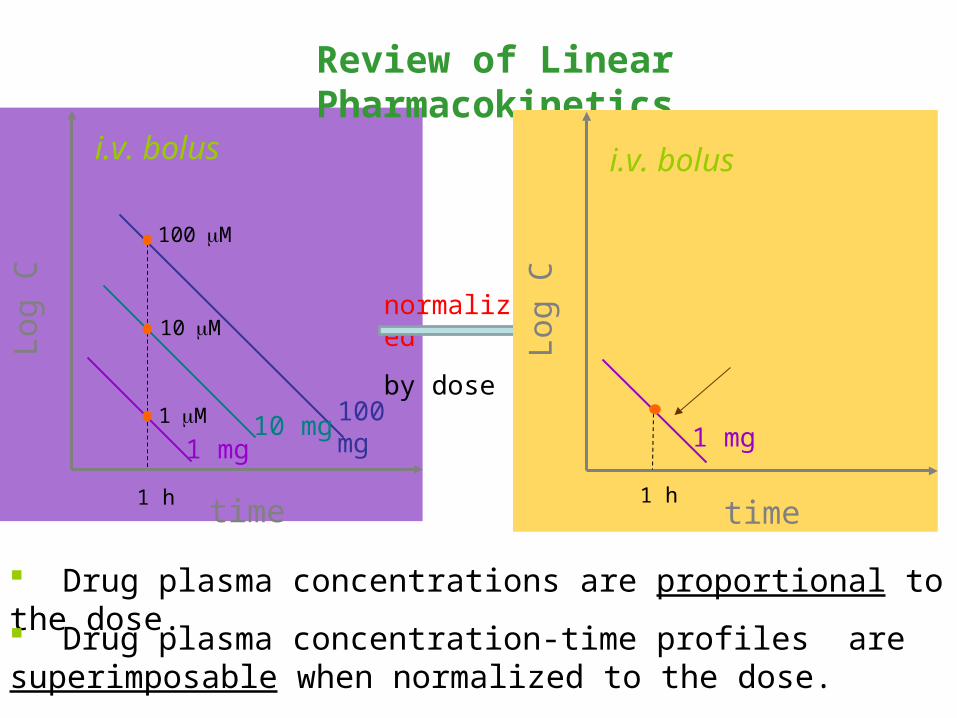
Drug plasma concentrations are proportional to the dose.
Drug plasma concentration-time profiles are superimposable when normalized to the dose.
normalized
by dose
time
i.v. bolus
100 mg1
mg
10 mg
Log
C
100M
10M
1M
1 h
i.v. bolus
1 mg
timeLo
g C
1 h
Review of Linear Pharmacokinetics
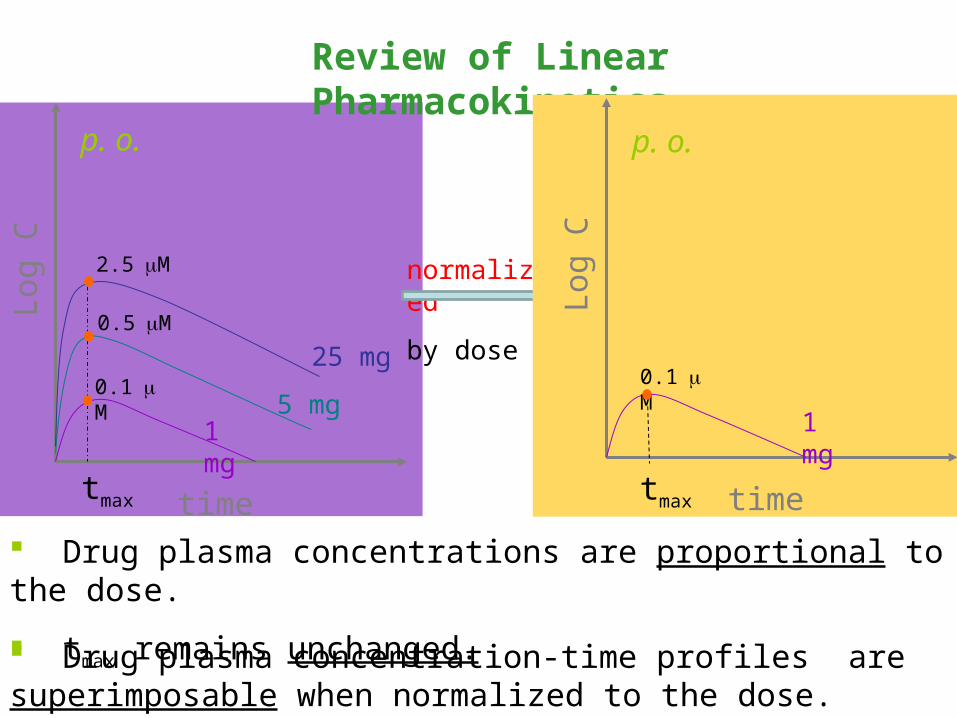
Drug plasma concentrations are proportional to the dose.
tmax remains unchanged.
normalized
by dose
p. o.
25 mg
1 mg
5 mg
Log
C
timetmax
0.5M
0.1M
2.5M
Drug plasma concentration-time profiles are superimposable when normalized to the dose.
p. o.
1 mg
Log
C
timetmax
0.1M
7
Review of Linear Pharmacokinetics
Dose
Cp
or A
UC
Dose
VD o
r C
L or
t1
/2
8
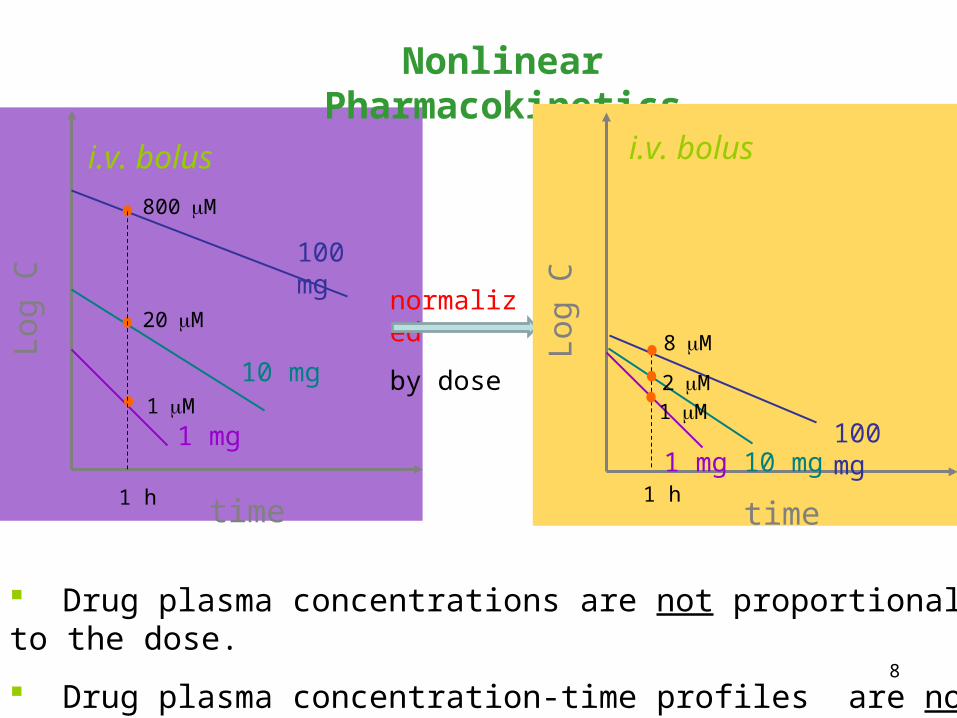
Nonlinear Pharmacokinetics
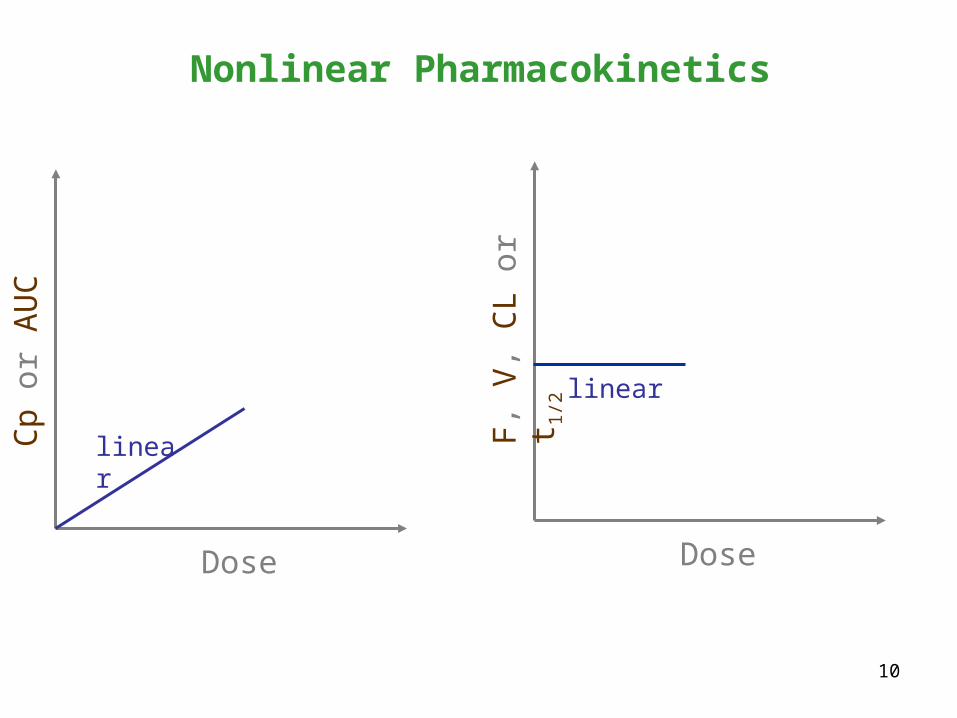
Drug plasma concentrations are not proportional to the dose.
Drug plasma concentration-time profiles are not superimposable when normalized to the dose.
normalized
by dose
i.v. bolus
100 mg
1 mg
10 mg
time
Log
C
20M
1M
800M
1 htime
i.v. bolus
100 mg1 mg 10 mg
Log
C
1 h
1M2M
8M
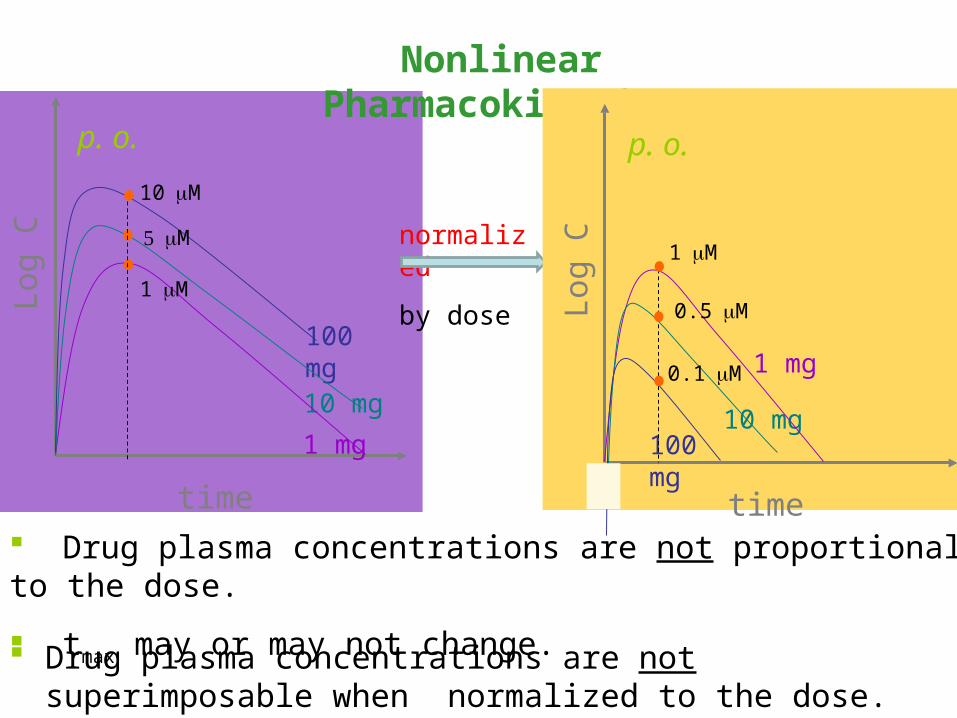
Nonlinear Pharmacokinetics
p. o.
100 mg10 mg
Log
C
time
1 mg
M
1M
10M
normalized
by dose
Drug plasma concentrations are not superimposable when normalized to the dose.
Drug plasma concentrations are not proportional to the dose.
tmax may or may not change.
p. o.
100 mg
10 mg
Log
C
time
1 mg
1M
0.5M
0.1M
10
Nonlinear Pharmacokinetics
linear
linear
Dose
Cp
or A
UC
Dose
F,
V,
CL
or t
1/2
11
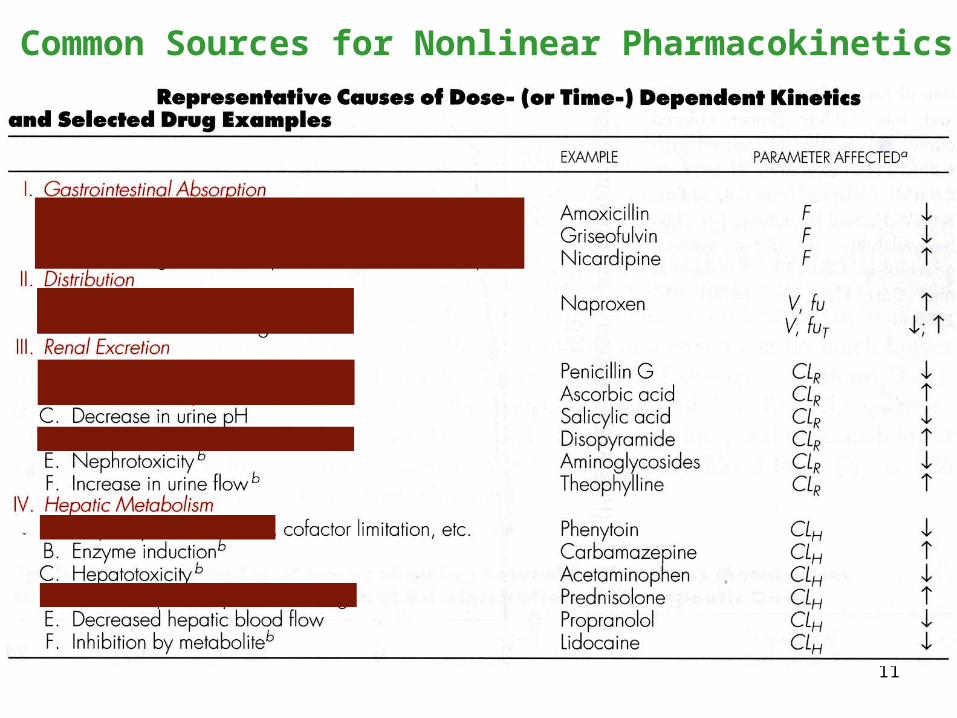
Common Sources for Nonlinear Pharmacokinetics
12
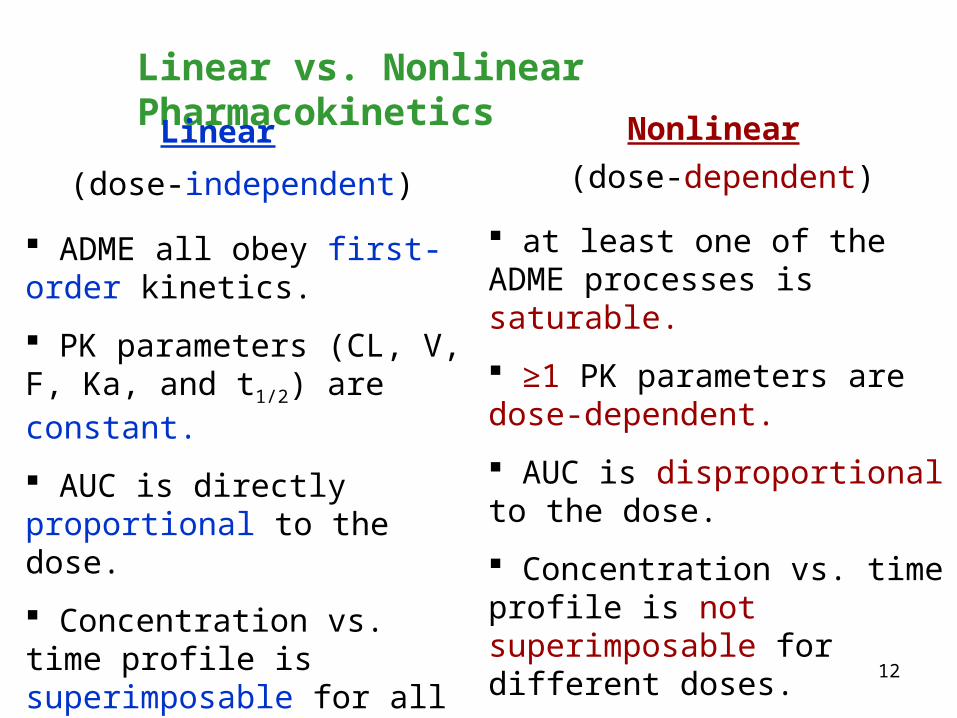
Linear vs. Nonlinear Pharmacokinetics
ADME all obey first-order kinetics.
PK parameters (CL, V, F, Ka, and t1/2) are constant.
AUC is directly proportional to the dose.
Concentration vs. time profile is superimposable for all doses.
Linear Nonlinear
at least one of the ADME processes is saturable.
≥1 PK parameters are dose-dependent.
AUC is disproportional to the dose.
Concentration vs. time profile is not superimposable for different doses.
(dose-dependent)(dose-independent)

13
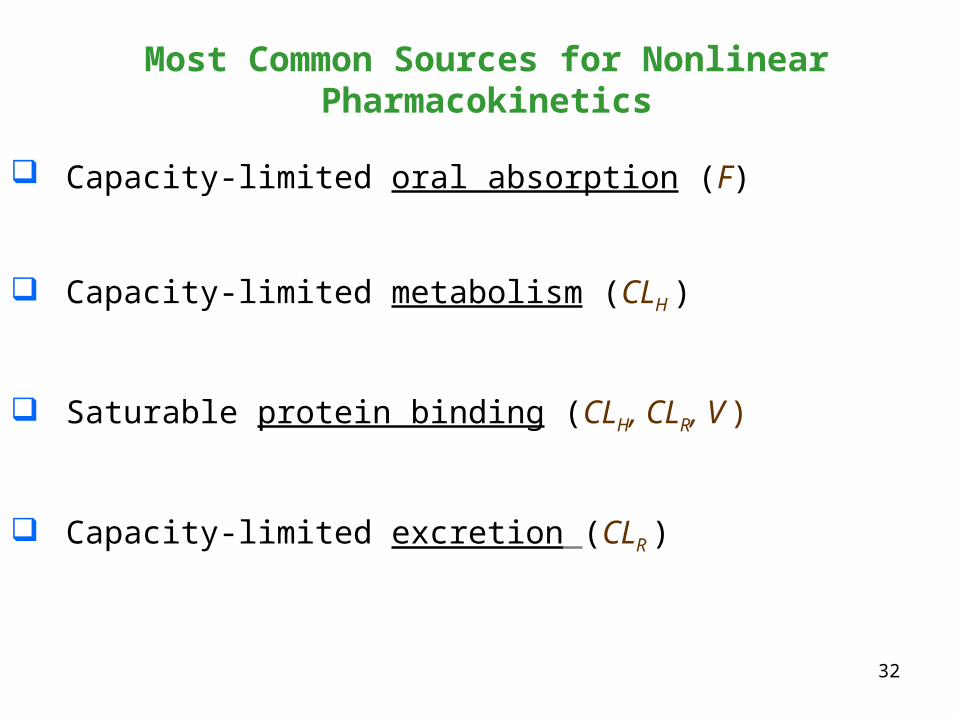
Most Common Sources for Nonlinear Pharmacokinetics
Capacity-limited oral absorption (F)
Capacity-limited metabolism (CLH )
Saturable protein binding (CLH, CLR, V )
Capacity-limited excretion (CLR )
14
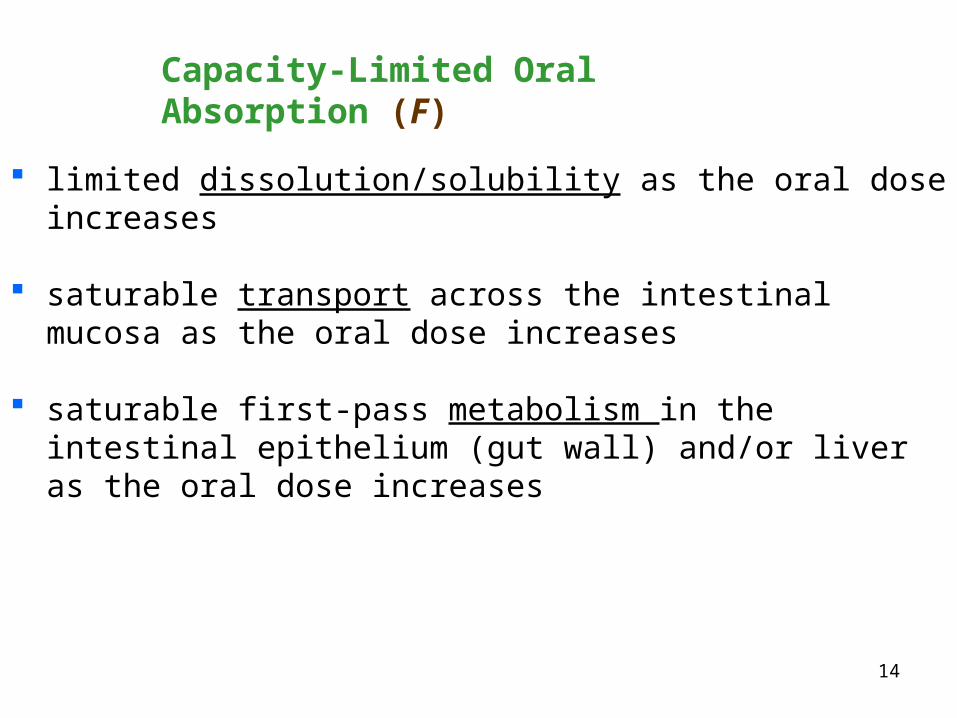
Capacity-Limited Oral Absorption (F)
limited dissolution/solubility as the oral dose increases
saturable transport across the intestinal mucosa as the oral dose increases
saturable first-pass metabolism in the intestinal epithelium (gut wall) and/or liver as the oral dose increases
15
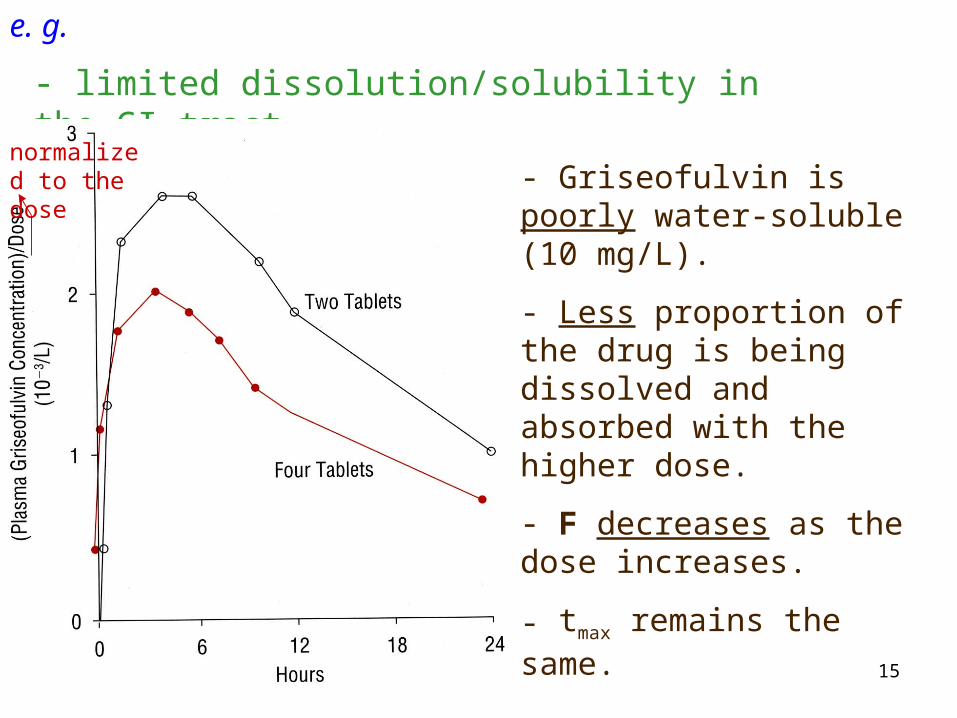
- limited dissolution/solubility in the GI tract
normalized to the dose - Griseofulvin is poorly
water-soluble (10 mg/L).
- Less proportion of the drug is being dissolved and absorbed with the higher dose.
- F decreases as the dose increases.
- tmax remains the same.
e. g.
16
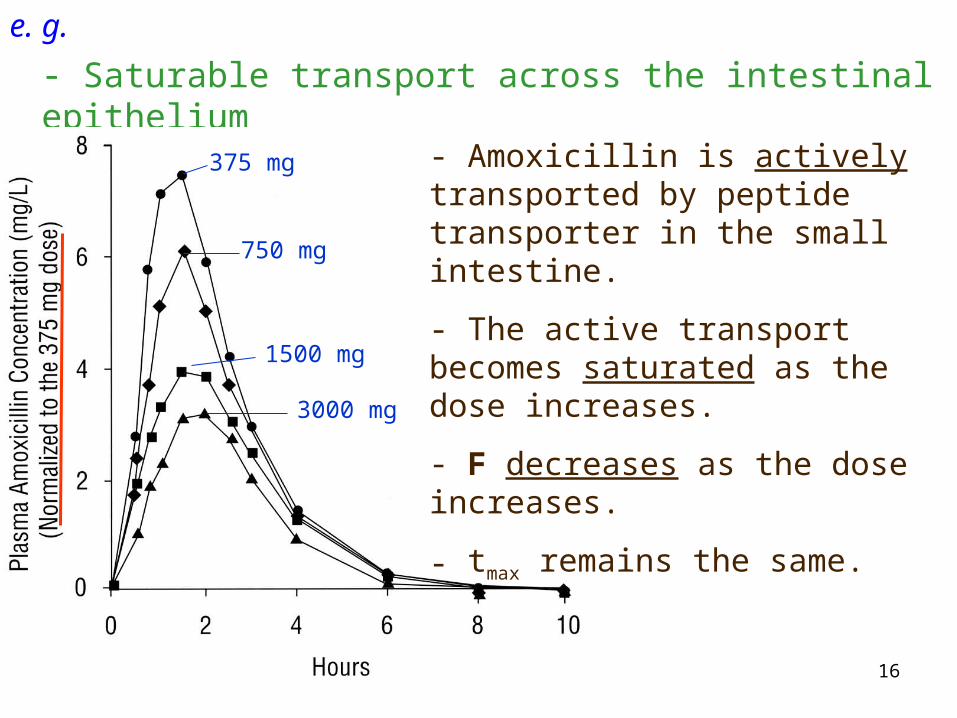
- Saturable transport across the intestinal epithelium
375 mg
750 mg
1500 mg
3000 mg
- Amoxicillin is actively transported by peptide transporter in the small intestine.
- The active transport becomes saturated as the dose increases.
- F decreases as the dose increases.
- tmax remains the same.
e. g.
17
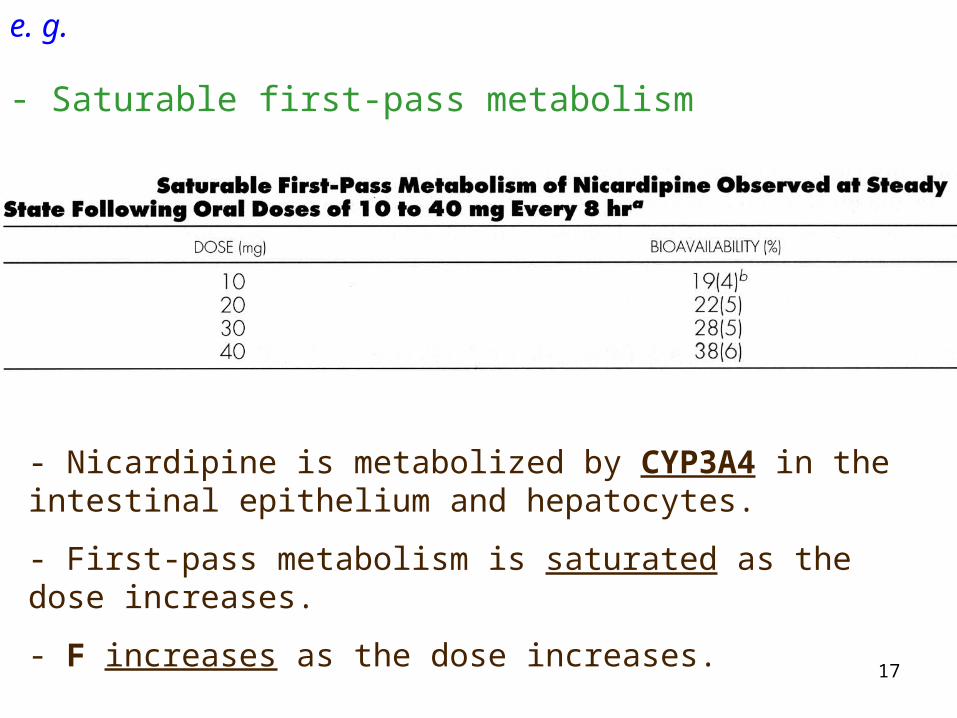
- Saturable first-pass metabolism
- Nicardipine is metabolized by CYP3A4 in the intestinal epithelium and hepatocytes.
- First-pass metabolism is saturated as the dose increases.
- F increases as the dose increases.
e. g.
18
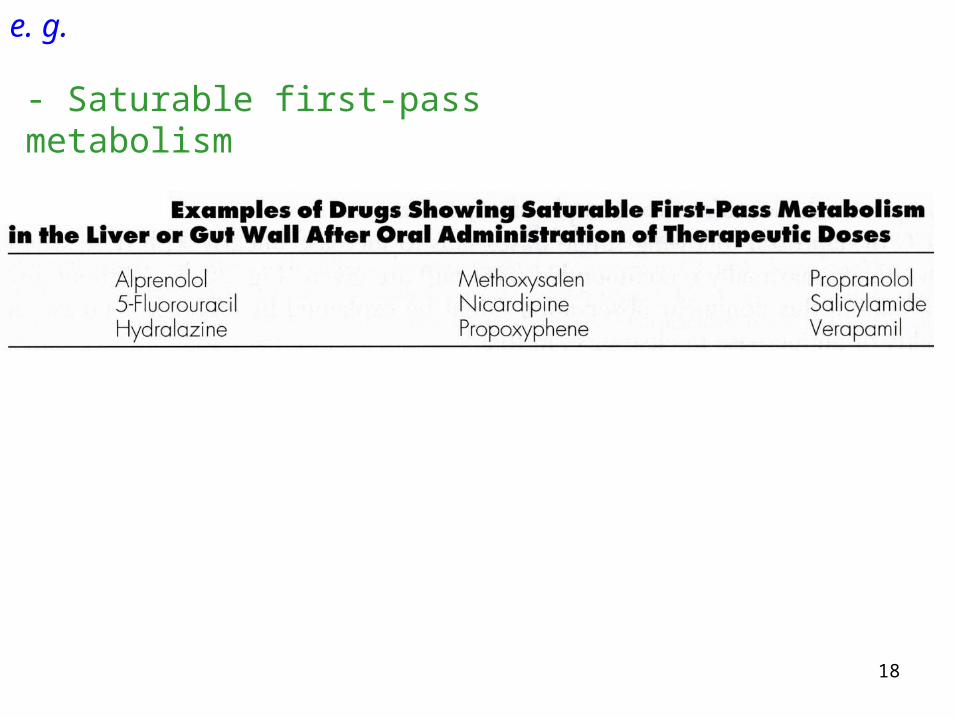
- Saturable first-pass metabolism
e. g.
19
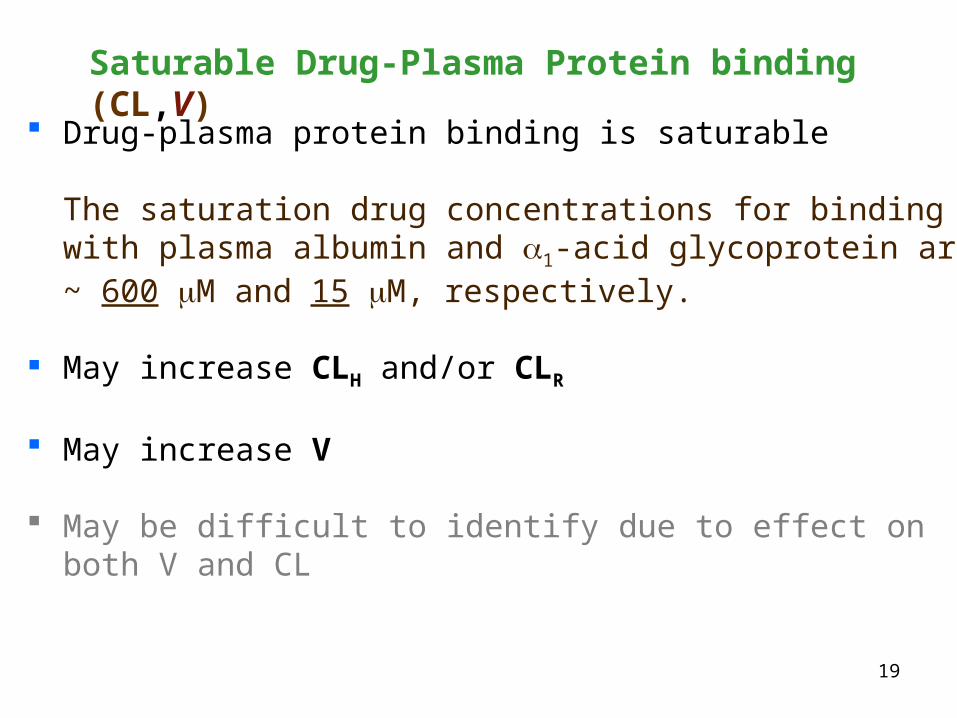
Saturable Drug-Plasma Protein binding (CL,V)
Drug-plasma protein binding is saturable
The saturation drug concentrations for binding with plasma albumin and 1-acid glycoprotein are ~ 600 M and 15 M, respectively.
May increase CLH and/or CLR
May increase V
May be difficult to identify due to effect on both V and CL
20
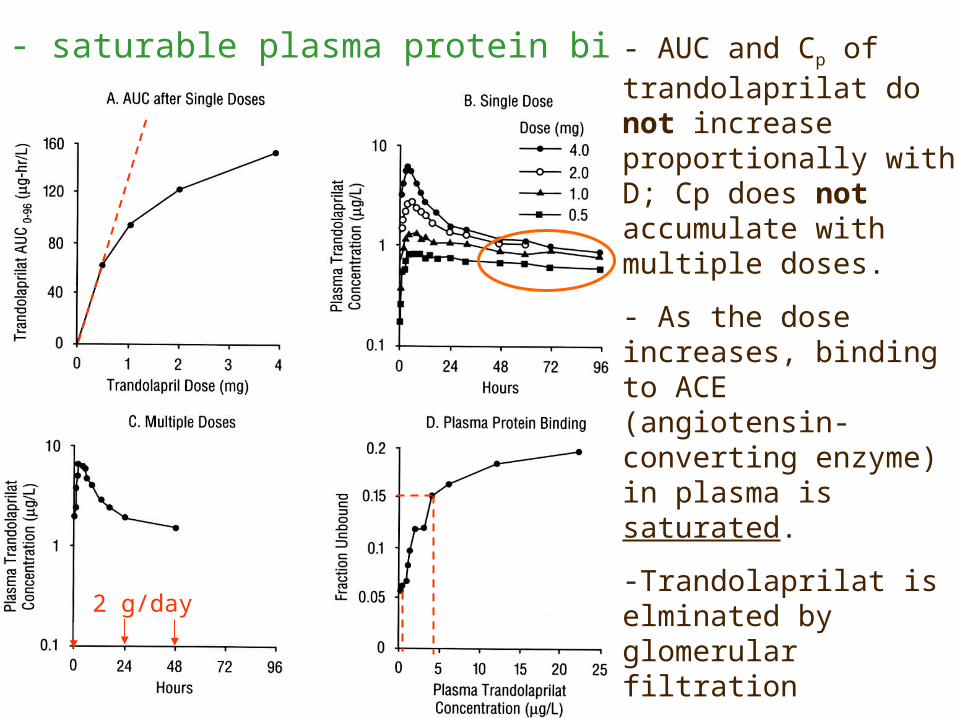
- saturable plasma protein binding - AUC and Cp of trandolaprilat do not increase proportionally with D; Cp does not accumulate with multiple doses.
- As the dose increases, binding to ACE (angiotensin-converting enzyme) in plasma is saturated.
-Trandolaprilat is elminated by glomerular filtration
CLR= fu GFR
- As fu increases with higher Cp, CLR increases.
2 g/day
21
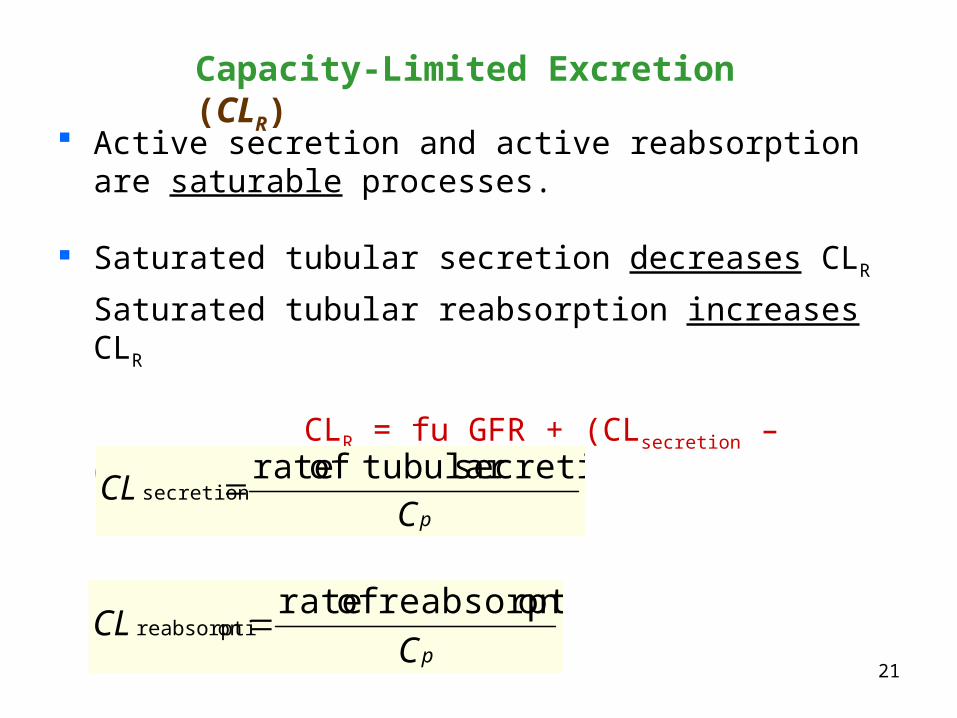
Capacity-Limited Excretion (CLR)
Active secretion and active reabsorption are saturable processes.
Saturated tubular secretion decreases CLR
Saturated tubular reabsorption increases CLR
CLR = fu GFR + (CLsecretion – CLreabsoption)
pCCL
secretion tubular of ratesecretion
pCCL
onreabsorpti of rateonreabsorpti
22
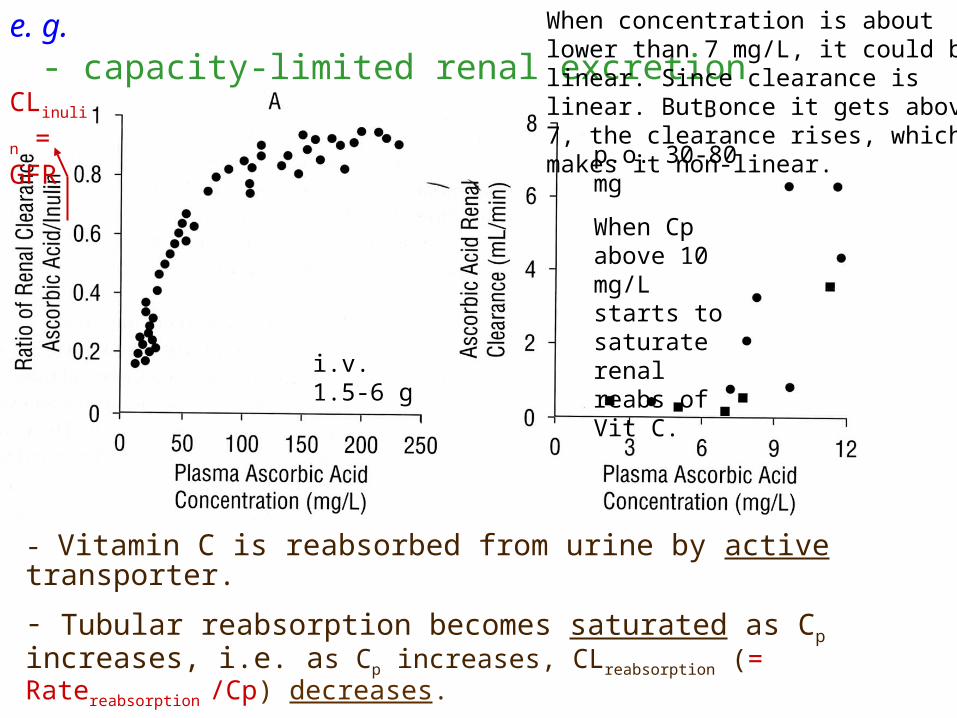
- capacity-limited renal excretion
- Vitamin C is reabsorbed from urine by active transporter.
- Tubular reabsorption becomes saturated as Cp increases, i.e. as Cp increases, CLreabsorption (= Ratereabsorption /Cp) decreases.
- ClR (=fu GFR –CLreabsorption) approaches GFR (fu=1) as Cp increases.
CLinulin = GFR
i.v. 1.5-6 g
p.o. 30-80 mg
When Cp above 10 mg/L starts to saturate renal reabs of Vit C.
e. g. When concentration is about lower than 7 mg/L, it could be linear. Since clearance is linear. But once it gets above 7, the clearance rises, which makes it non-linear.
23
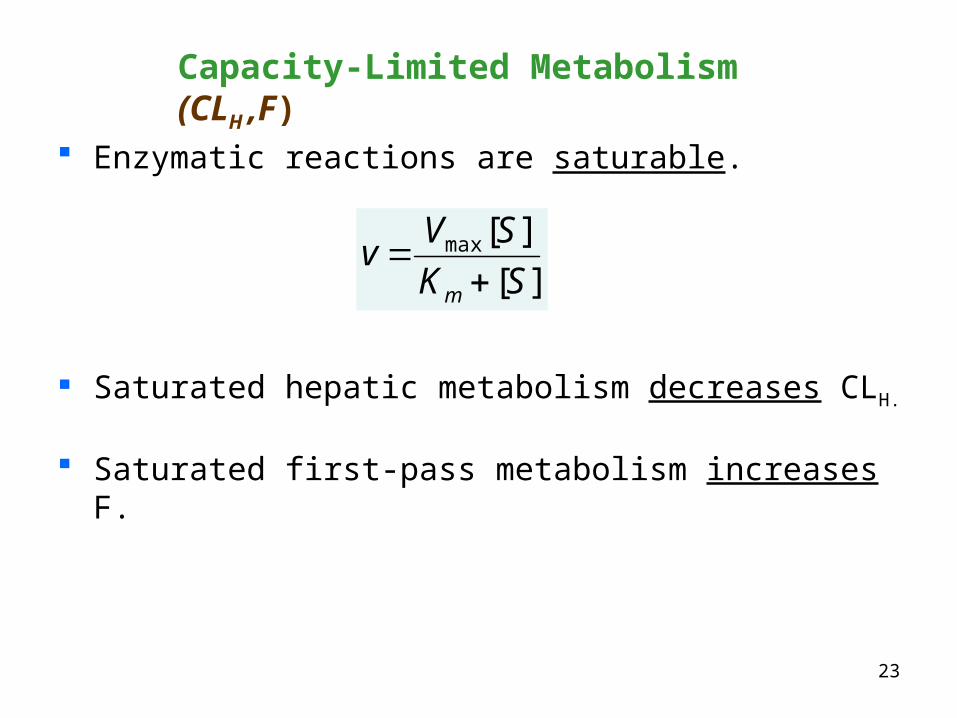
Enzymatic reactions are saturable.
Saturated hepatic metabolism decreases CLH.
Saturated first-pass metabolism increases F.
Capacity-Limited Metabolism (CLH ,F)
][
][max
SK
SVv
m
24
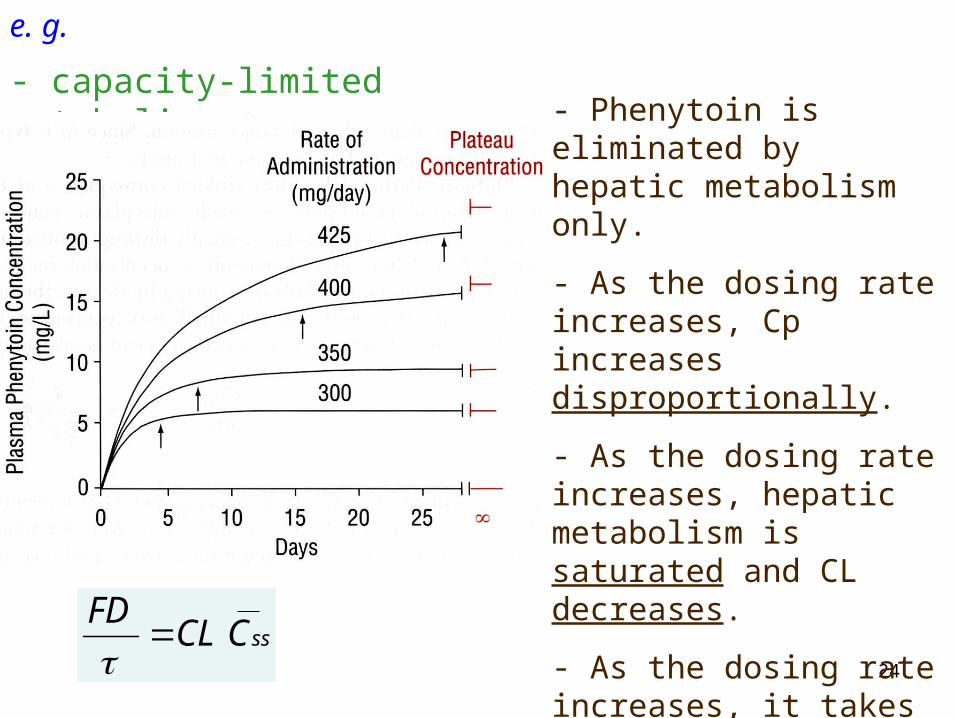
- capacity-limited metabolism
e. g.
- Phenytoin is eliminated by hepatic metabolism only.
- As the dosing rate increases, Cp increases disproportionally.
- As the dosing rate increases, hepatic metabolism is saturated and CL decreases.
- As the dosing rate increases, it takes longer time to reach steady state.
ssCCLFD
25
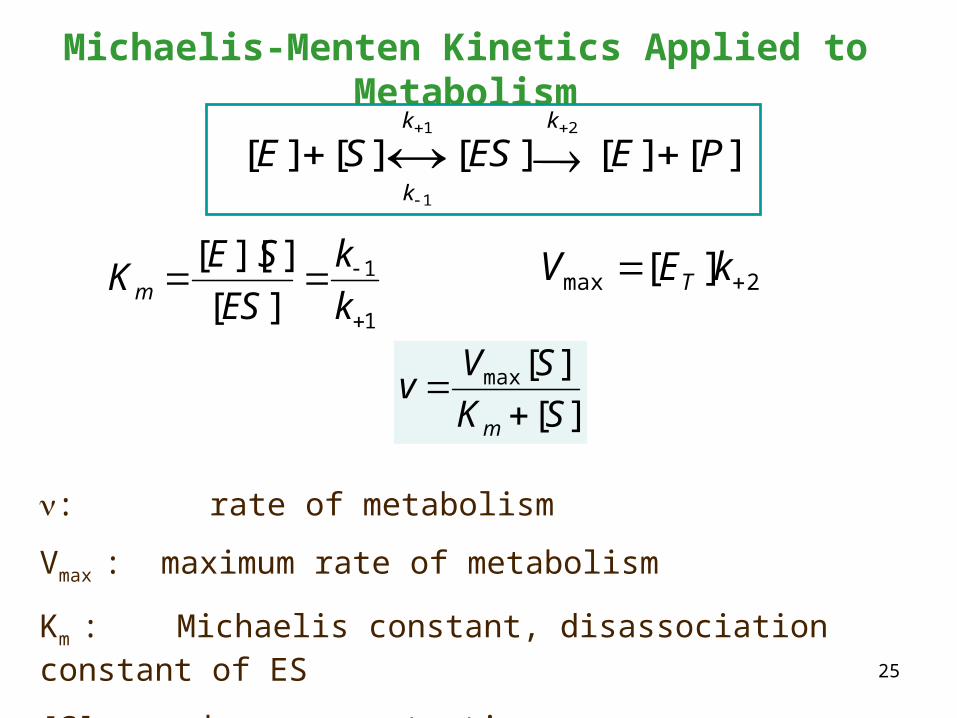
Michaelis-Menten Kinetics Applied to Metabolism
][
][max
SK
SVv
m
1
1
][
]][[
k
k
ES
SEKm
][ 2max kEV T
][][][][][21
1
PEESSEkk
k
: rate of metabolism
Vmax : maximum rate of metabolism
Km : Michaelis constant, disassociation constant of ES
[S]: drug concentration
mK
SVv
][max
26
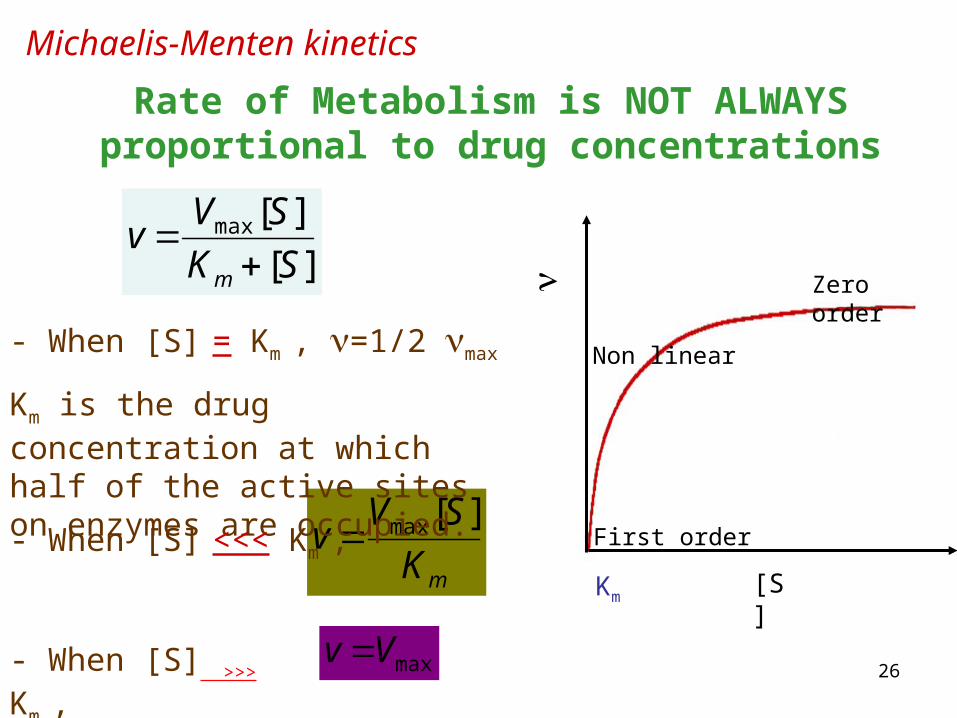
Michaelis-Menten kinetics
Rate of Metabolism is NOT ALWAYS proportional to drug concentrations
][
][max
SK
SVv
m
- When [S] = Km , =1/2 max
Km is the drug concentration at which half of the active sites on enzymes are occupied.
- When [S] <<< Km ,
- When [S] >>> Km , maxVv
[S]Km
Zero order
First order
Non linear
27
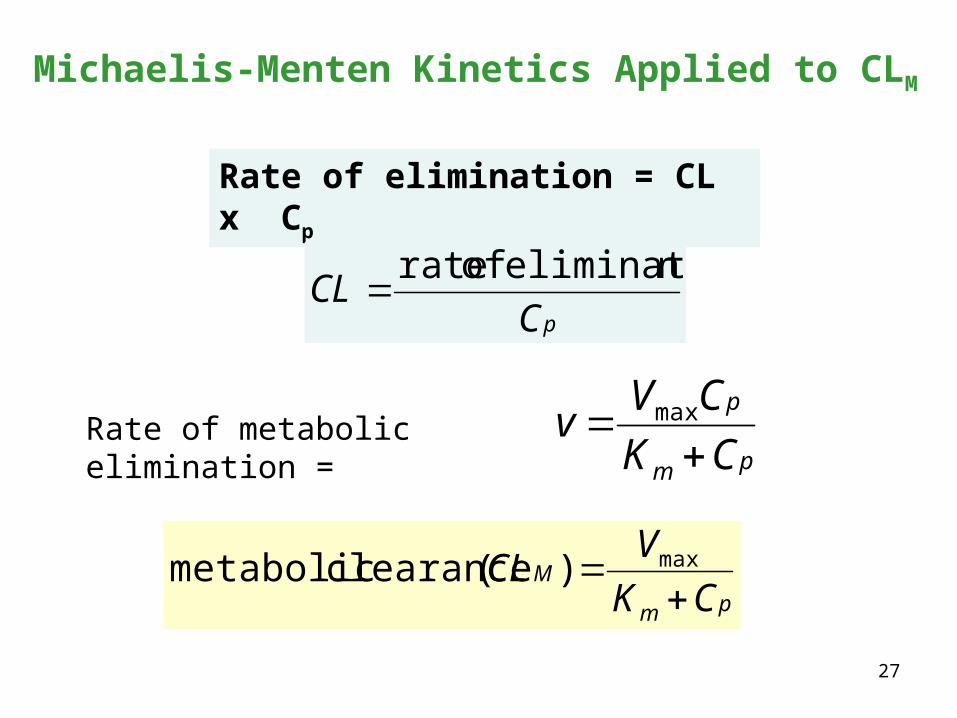
Michaelis-Menten Kinetics Applied to CLM
Rate of elimination = CL x Cp
pm
p
CK
CVv
max
Rate of metabolic elimination =
pCCL
neliminatio of rate
pm
MCK
VCL
max)( clearance metabolic
28
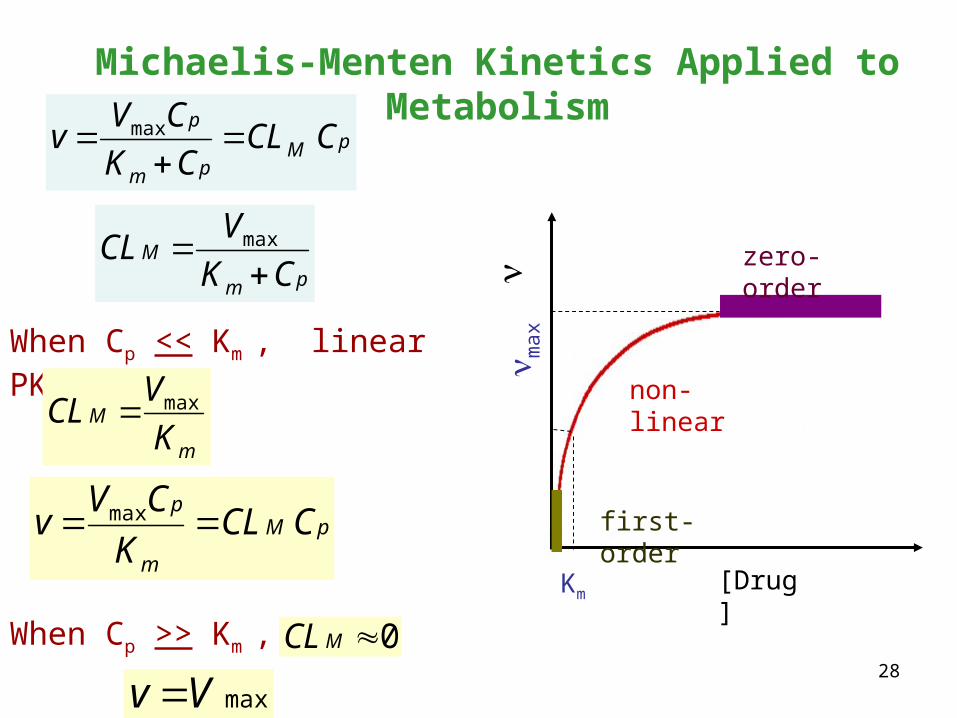
Michaelis-Menten Kinetics Applied to Metabolism
When Cp << Km , linear PK
pMpm
pCCL
CK
CVv max
pM
m
pCCL
K
CVv max
When Cp >> Km ,
maxVv
pm
MCK
VCL
max
m
MK
VCL max
[Drug]
max
Km
zero-order
first-order
non-linear
0MCL
29Cp
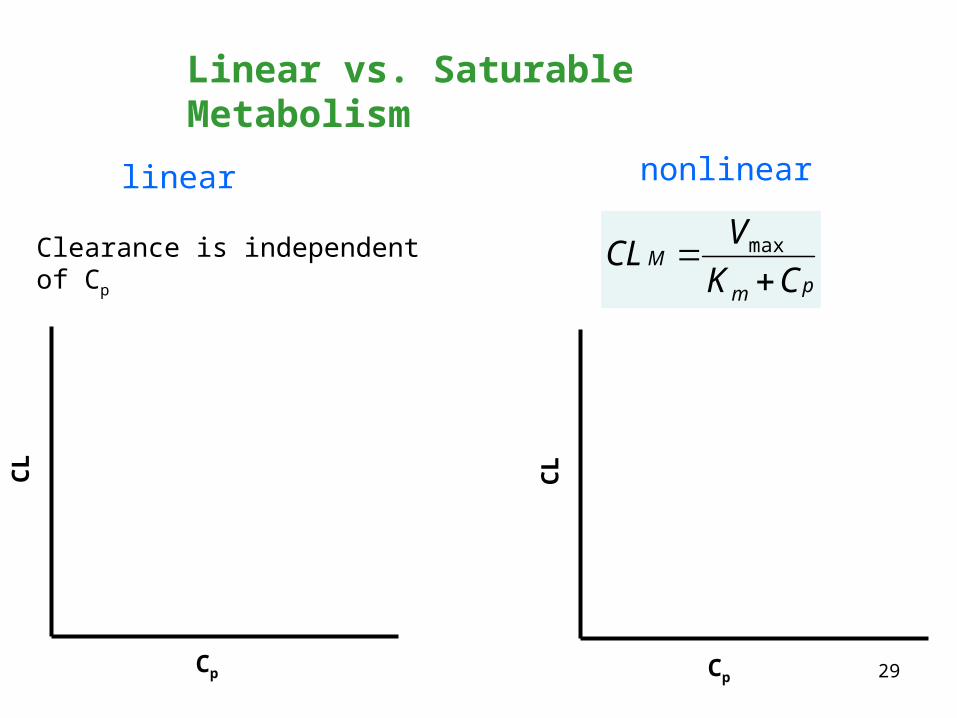
CL
Linear vs. Saturable Metabolism
Clearance is independent of Cp
linear nonlinear
CL
pm
MCK
VCL
max
Cp
30
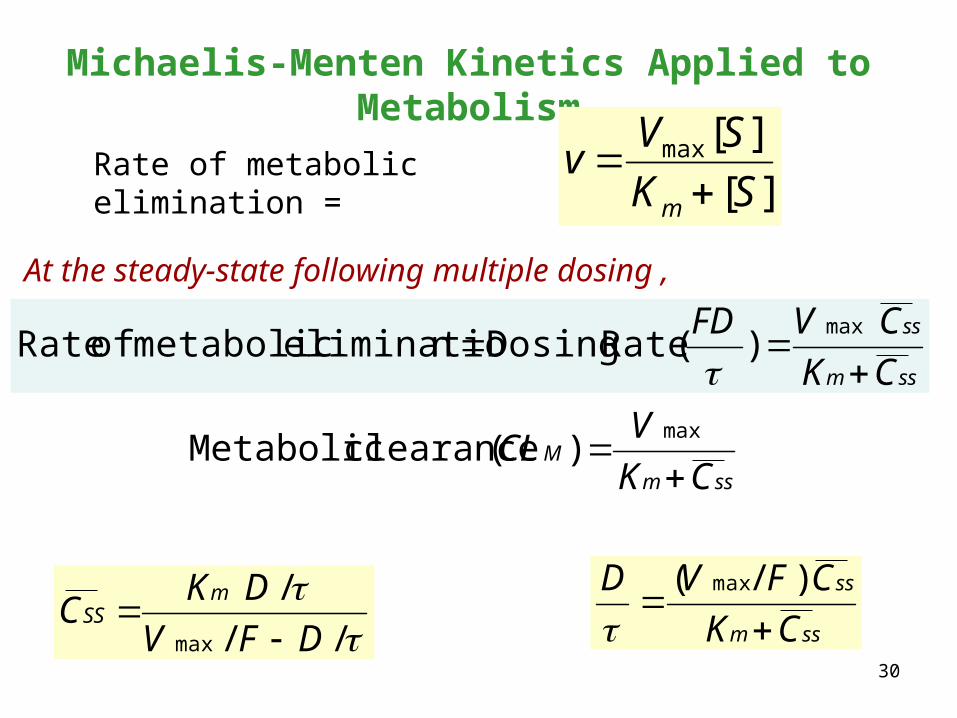
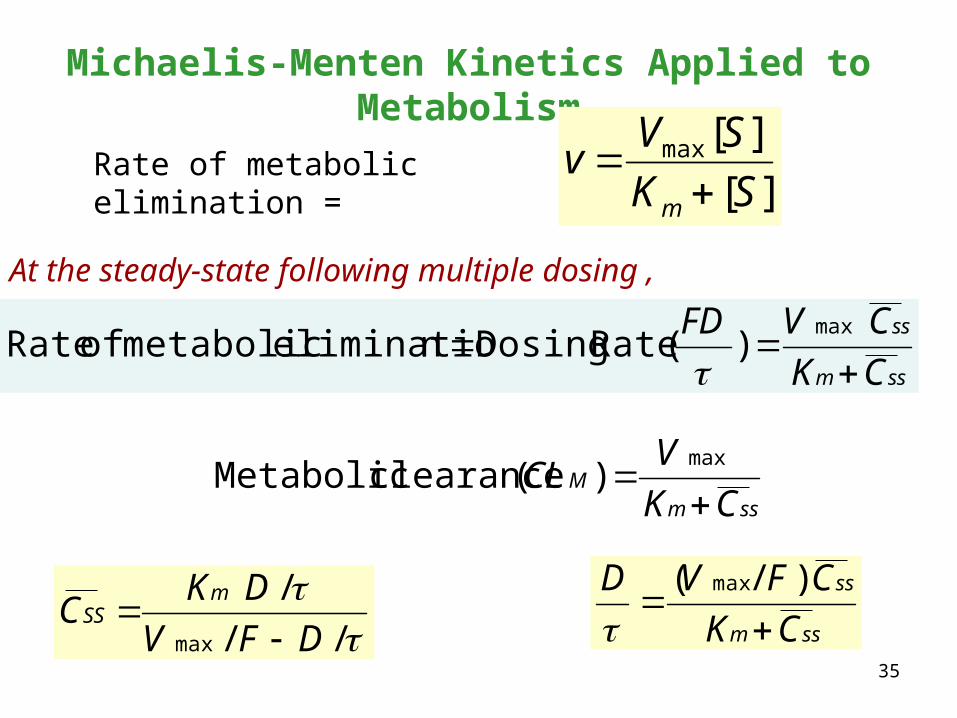
Michaelis-Menten Kinetics Applied to Metabolism
At the steady-state following multiple dosing ,
ssmM
CK
VCL
max )( clearance Metabolic
ssm
ss
CK
CFVD
)/( max
ssm
ss
CK
CVFD
max)( Rate Dosing neliminatio metabolic of Rate
][
][max
SK
SVv
m Rate of metabolic elimination =
//
/
max
DFV
DKC
mSS
31
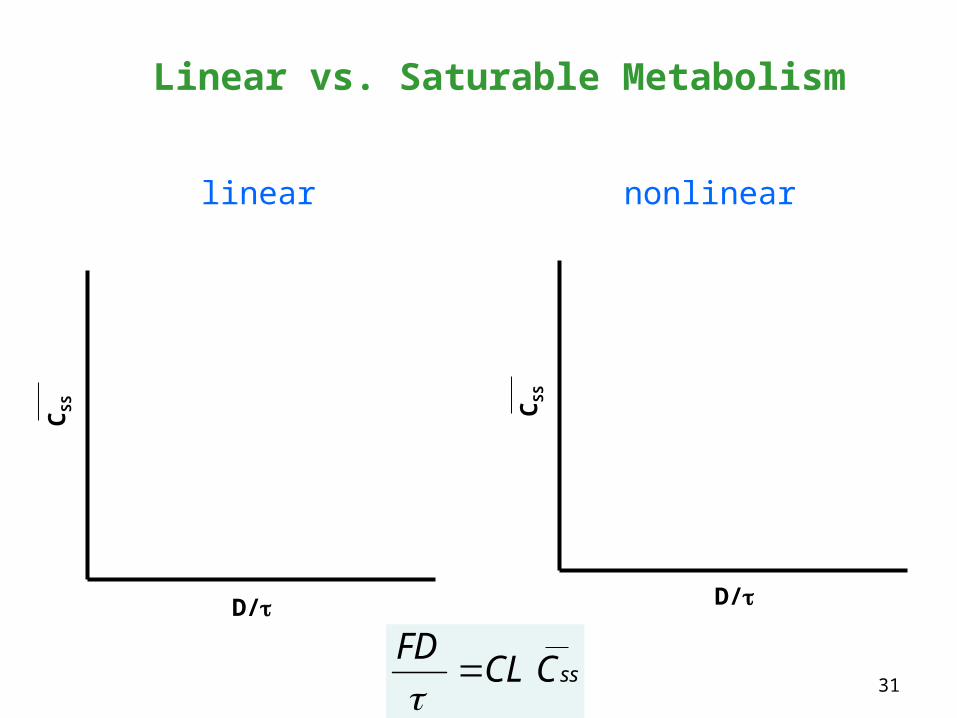
Linear vs. Saturable Metabolism
linear nonlinear
D/
CS
S
D/
CS
S
ssCCLFD
32
Most Common Sources for Nonlinear Pharmacokinetics
Capacity-limited oral absorption (F)
Capacity-limited metabolism (CLH )
Saturable protein binding (CLH, CLR, V )
Capacity-limited excretion (CLR )
At a daily intake of 75 mg of ascorbic acid (vitamin C), the
steady-state plasma concentration is 9 mg/L, whereas at a daily
dose of 10,000 mg, the steady-state concentration is about 19
mg/L in a healthy volunteer. The renal clearance of ascorbic
acid is less than 0.5 ml/min at the plasma concentration of 9
mg/ml, whereas the renal clearance is 21 ml/min at 19 mg/L.
Case Study
Vitamin is absorbed by passive facilitated diffusion in the
small intestine, and undergoes tubular reabsorption in the
kidney.
34
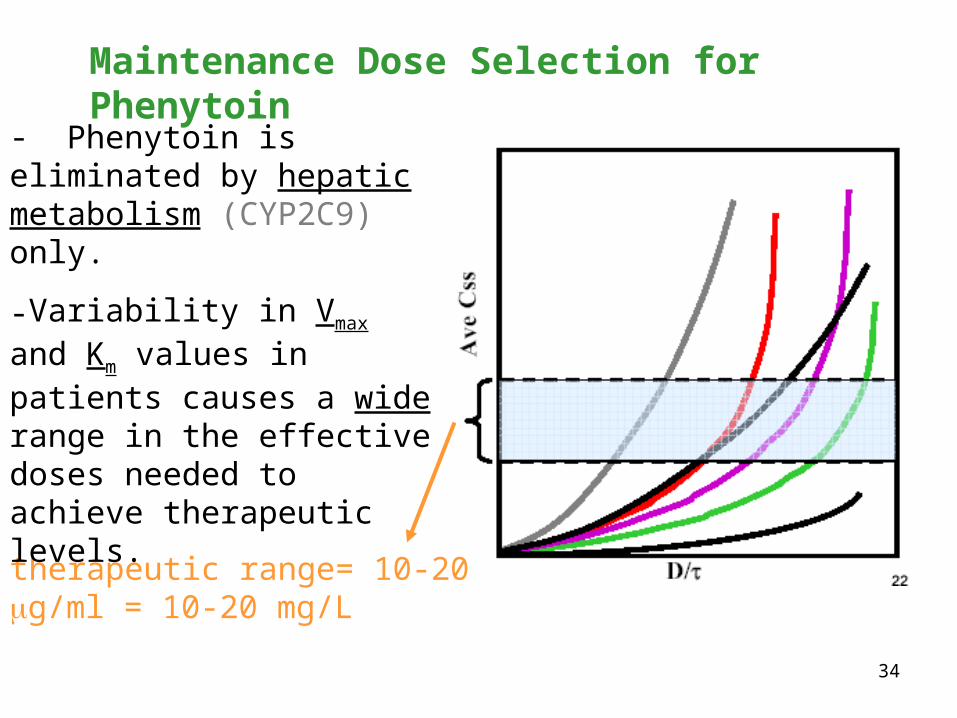
Maintenance Dose Selection for Phenytoin
therapeutic range= 10-20 g/ml = 10-20 mg/L
- Phenytoin is eliminated by hepatic metabolism (CYP2C9) only.
-Variability in Vmax and Km values in patients causes a wide range in the effective doses needed to achieve therapeutic levels.
35
Michaelis-Menten Kinetics Applied to Metabolism
At the steady-state following multiple dosing ,
ssmM
CK
VCL
max )( clearance Metabolic
ssm
ss
CK
CFVD
)/( max
ssm
ss
CK
CVFD
max)( Rate Dosing neliminatio metabolic of Rate
][
][max
SK
SVv
m Rate of metabolic elimination =
//
/
max
DFV
DKC
mSS
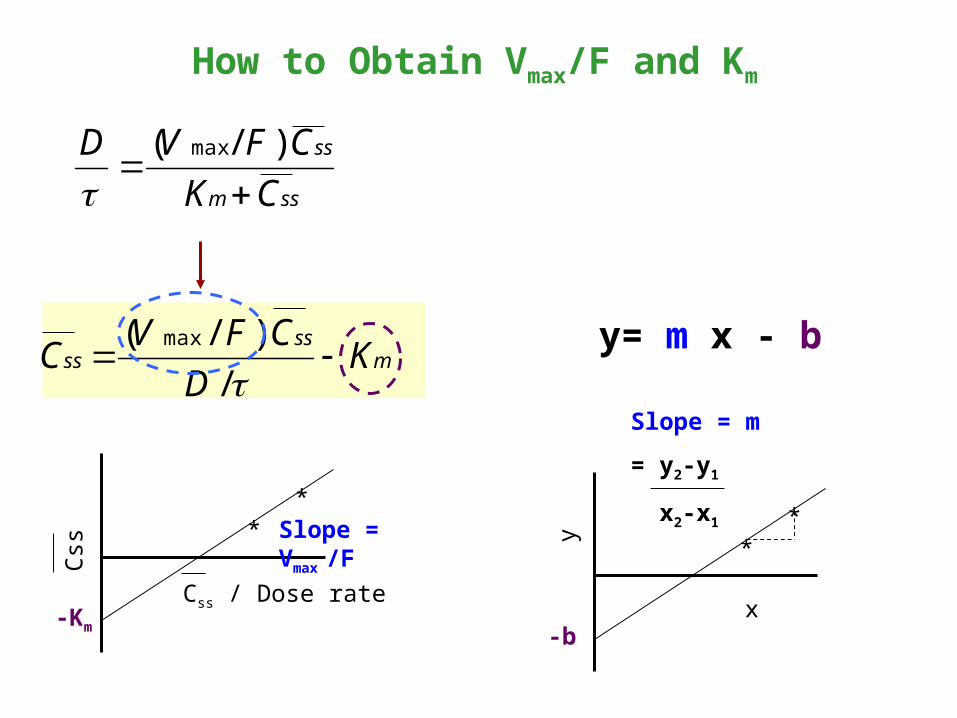
How to Obtain Vmax/F and Km
ssm
ss
CK
CFVD
)/( max
mss
ss KD
CFVC
/ )/ ( max
**
Css / Dose rate
Css
Slope = Vmax /F
-Km
y= m x - b
Slope = m
= y2-y1
x2-x1
**
x
y
-b
37
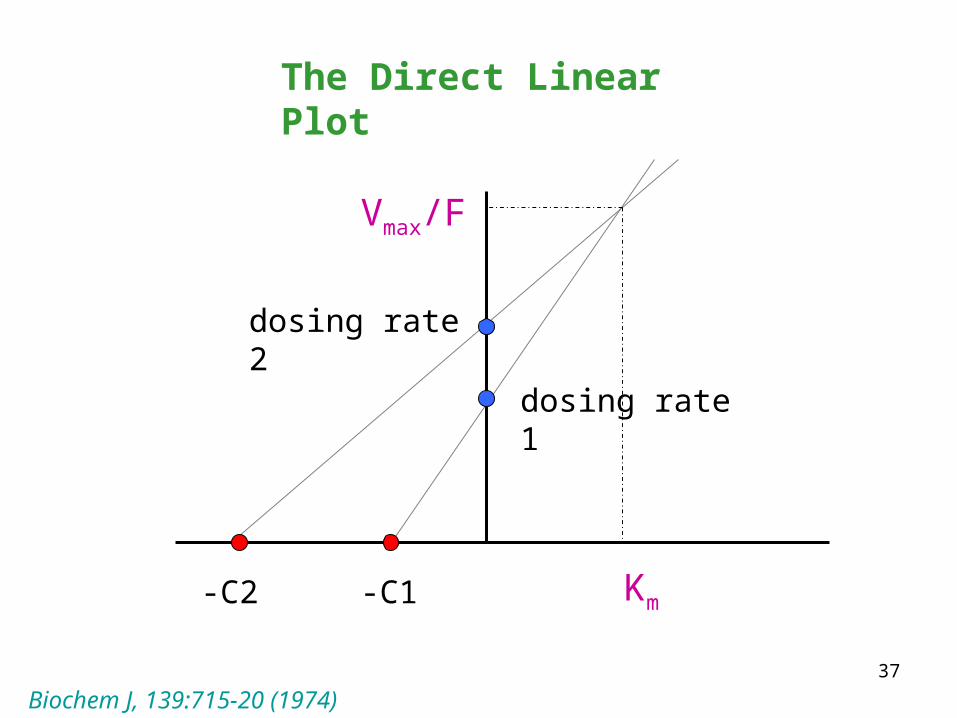
The Direct Linear Plot
Vmax/F
Km-C1-C2
dosing rate 1
dosing rate 2
Biochem J, 139:715-20 (1974)
38
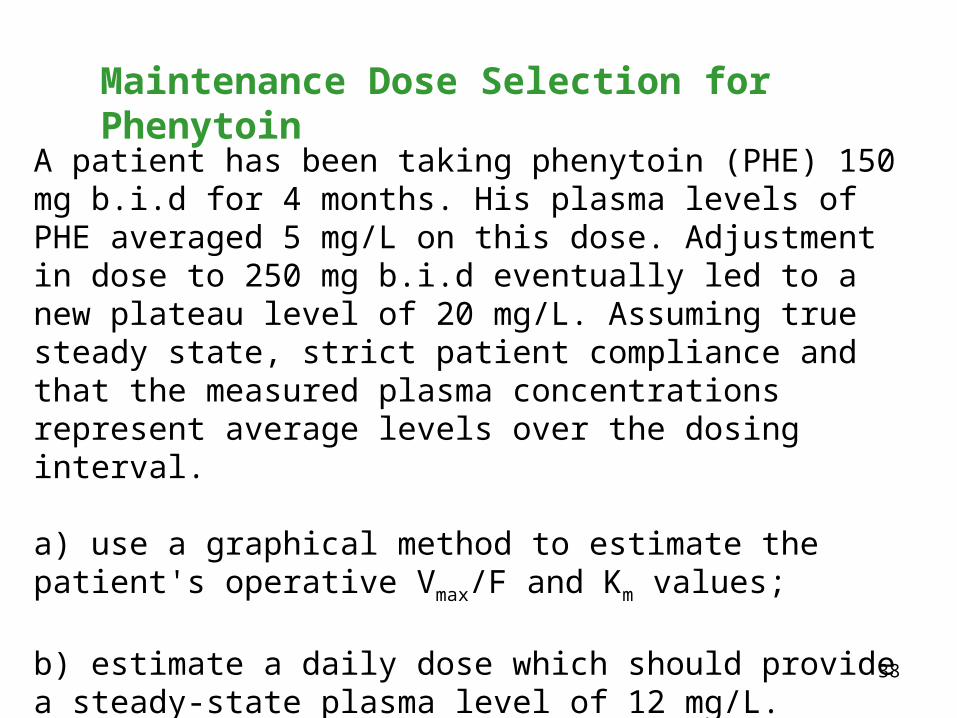
Maintenance Dose Selection for Phenytoin
A patient has been taking phenytoin (PHE) 150 mg b.i.d for 4 months. His plasma levels of PHE averaged 5 mg/L on this dose. Adjustment in dose to 250 mg b.i.d eventually led to a new plateau level of 20 mg/L. Assuming true steady state, strict patient compliance and that the measured plasma concentrations represent average levels over the dosing interval.
a) use a graphical method to estimate the patient's operative Vmax/F and Km values;
b) estimate a daily dose which should provide a steady-state plasma level of 12 mg/L.
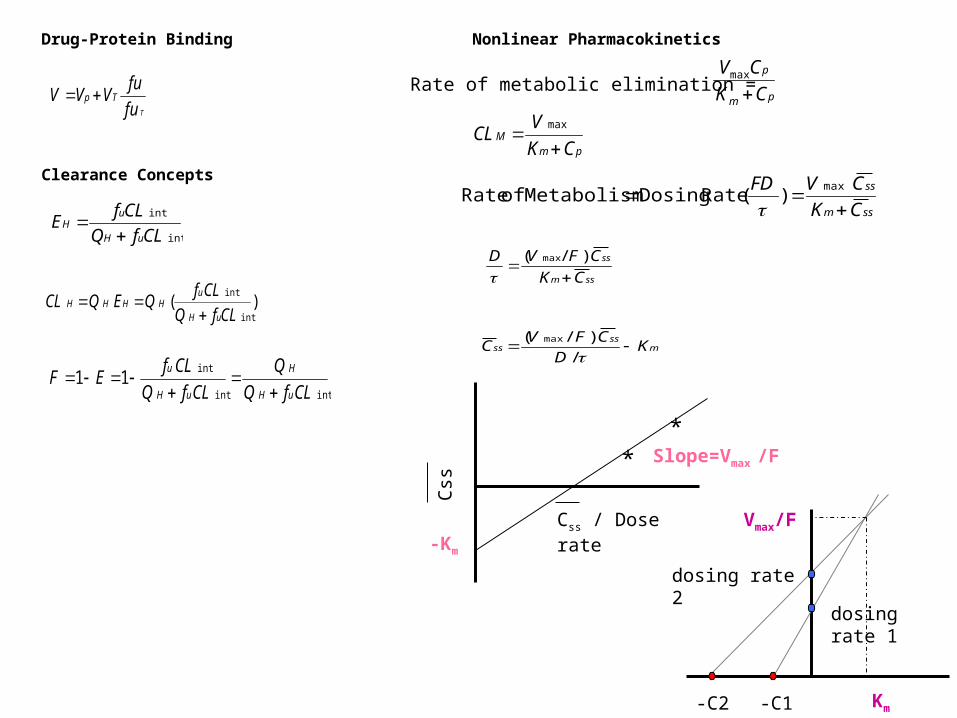
)
(
int
int
CLfQ
CLfQEQCL
uH
uHHHH
int int
int
11
CLfQ
Q
CLfQ
CLfEF
uH
H
uH
u
Tfu
fuVVV Tp
**
Slope=Vmax /F
-Km
Css / Dose rate
Css
Nonlinear PharmacokineticsDrug-Protein Binding
int
int
CLfQ
CLfE
uH
uH
Vmax/F
Km-C1-C2
dosing rate 1
dosing rate 2
ssm
ss
CK
CVFD
max)( Rate Dosing Metabolism of Rate
ssm
ss
CK
CFVD
)/( max
Clearance Concepts
pmM
CK
VCL
max
pm
p
CK
CV
max
Rate of metabolic elimination =
mss
ss KD
CFVC
/ )/ ( max

40

41

42

43

44