Embed Size (px)
Citation preview

Physiologically-Based Simulation of Daclatasvir Pharmacokinetics With Antiretroviral Inducers
and Inhibitors of Cytochrome P450 and Drug Transporters
Qi Wang, Wenying Li, Ming Zheng, Timothy Eley, Frank LaCreta, Tushar Garimella
Bristol-Myers Squibb Research and Development, Princeton, NJ, USA.
Oral Presentation: O_21
17th International Workshop on Clinical Pharmacology of HIV & Hepatitis TherapyWashington, DC; 8 - 10 June 2016
Presenting author: Timothy Eley

■ Tushar Garimella is an employee of Bristol-Myers Squibb
■ Editorial support was provided by N Fitch of Articulate Science and funded by Bristol-Myers Squibb
■ The following simulations based on PBPK analyses provide the most appropriate dose of DCV in certain complex HIV-1 treatment regimens and the recommendations based on this modeling are currently not in any approved Daklinza product labelling
Disclosures
2
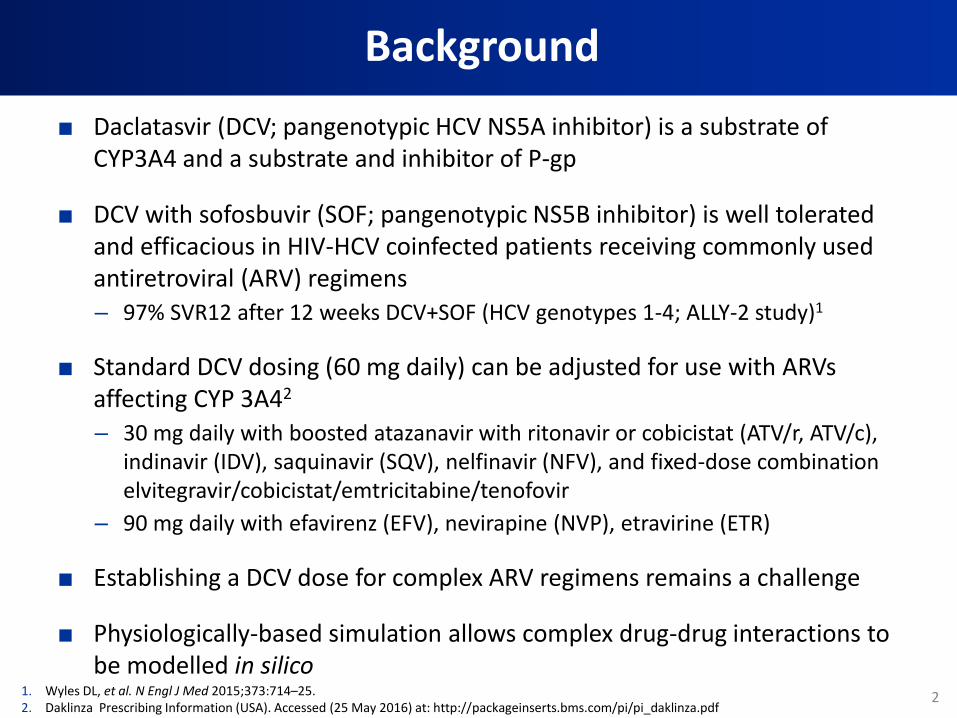
■ Daclatasvir (DCV; pangenotypic HCV NS5A inhibitor) is a substrate of CYP3A4 and a substrate and inhibitor of P-gp
■ DCV with sofosbuvir (SOF; pangenotypic NS5B inhibitor) is well tolerated and efficacious in HIV-HCV coinfected patients receiving commonly used antiretroviral (ARV) regimens
– 97% SVR12 after 12 weeks DCV+SOF (HCV genotypes 1-4; ALLY-2 study)1
■ Standard DCV dosing (60 mg daily) can be adjusted for use with ARVs affecting CYP 3A42
– 30 mg daily with boosted atazanavir with ritonavir or cobicistat (ATV/r, ATV/c), indinavir (IDV), saquinavir (SQV), nelfinavir (NFV), and fixed-dose combination elvitegravir/cobicistat/emtricitabine/tenofovir
– 90 mg daily with efavirenz (EFV), nevirapine (NVP), etravirine (ETR)
■ Establishing a DCV dose for complex ARV regimens remains a challenge
■ Physiologically-based simulation allows complex drug-drug interactions to be modelled in silico
2
Background
1. Wyles DL, et al. N Engl J Med 2015;373:714–25.2. Daklinza Prescribing Information (USA). Accessed (25 May 2016) at: http://packageinserts.bms.com/pi/pi_daklinza.pdf

■ To use a physiologically-based PK (PBPK) model to simulate PK interactions between DCV and ARV regimens combining inducers and inhibitors of CYP and P-gp
■ To explore appropriate DCV dose adjustments with complex ARV regimens, based on PBPK models and observed data
Objectives
4

■ Initial model development and validation was carried out in Simcyp simulator versions 13r1 and 14r1
■ DCV base model was derived from in vitro parameters, in silico predictions, and in vivo ADME and bioavailability data1
■ Key DCV assumptions– P-gp efflux in gut and liver but no influx transporters involved in gut absorption
– Minor metabolism by an unknown CYP with similar properties to CYP 2C8
– Passive tissue distribution according to partition and binding rules, except for the liver
■ All simulations modelled a healthy, 50% female Caucasian population of ages 20–49 years
■ Base model performance assessed by visual comparison of simulated PK profiles and parameters against observed data from SAD and MAD studies
DCV PBPK Model Development
51. Wang Q, et al. American Conference on Pharmacometrics 6; Washington, DC; October 4–7, 2015.

DCV PBPK Parameters
6
Value Method
Molecular Weight 738.96log Po:w 4.05 ExperimentalCompound Type Diprotic base
pKa 1 5.6 ExperimentalpKa 2 4.9 ExperimentalBlood/Plasma Ratio 0.8 ExperimentalFraction Unbound in Plasma 0.006 ExperimentalPAMPA (x10-6 cm/s) 49 ExperimentalP-gp efflux in Gut
Jmax (pmol/min/million cells) 2.610 ExperimentalKm (µM) 8.160 ExperimentalVss (L/kg) 0.556 Method 2 (Roger and Rowland)
Enzyme kinetics tab: Recombinant enzymesCYP3A4
Vmax (pmol/min/pmol) 0.575 ExperimentalKm (µM) 2.53 Experimental
CYP3A5Vmax (pmol/min/pmol) 0.0957 ExperimentalKm (µM) 9.14 Experimental
Unidentified CYPClint (µl/min/pmol) 0.32 Model fittingfu, mic 0.35 in silico
P-gp mediated canalicular efflux in liverJmax (pmol/min/million cells) 88.000 Sensitivity analysis, fittingKm (µM) 8.160 Sensitivity analysis, fittingRAF/REF 1.600 Sensitivity analysis, fitting% available for reabsorption 80% Sensitivity analysis, fitting

■ DCV PK was simulated and compared with clinical data for coadministration of DCV with:
– Ketoconazole (KET; 400 mg QD) – Strong CYP3A4 and P-gp inhibitor
– Cyclosporine (CSP; 400 mg QD) – Weak CYP3A4 inhibitor/ Strong P-gp inhibitor
– Rifampin (RIF; 600 mg QD) – Strong CYP3A4/P-gp inducer
■ In addition, single-dose midazolam (MDZ; 5 mg) PK was simulated with and without DCV 60 mg QD and compared with clinical data
■ KET, CSP, RIF and MDZ parameters were as supplied within Simcyp, but with adjustment of P-gp inhibition for KET and CSP
Model Validation
7

■ All ARV simulations were performed in Simcyp version 14r1
■ Model parameters for individual ARVs were derived from available
physicochemical, in vitro, in silico and clinical data
– ATV, EFV, tenofovir (TDF), emtricitabine (FTC), ritonavir (RTV), cobicistat (Cobi),
darunavir (DRV)
– Elvitegravir (EVG), maraviroc (MVC), raltegravir (RAL), and other nucleoside
analogues were not modelled
■ Six simulation trials of DCV 60 mg ( 3 modelled ARVs/trial) were
performed per regimen, each with 14 healthy subjects
Simulation of DCV PK with cART
8

Dose(mg)
DCV Cmax DCV AUC
Obs. Sim. Sim:Obs Obs. Sim. Sim:Obs
1 16 17 1.1 160 169 1.1
10 200 182 0.9 2053 1811 0.9
25 406 471 1.2 3962 4683 1.2
50 1226 962 0.8 13255 9596 0.7
100 1921 1960 1.0 22241 19667 0.9
200 2816 3987 1.4 31473 40508 1.3
Model Base Case: Single & Multiple Dose DCV
9
Dose(mg)
DCV Cmax DCV AUC
Obs. Sim. Sim:Obs Obs. Sim. Sim:Obs
1 16 19 1.2 125 193 1.5
10 257 198 0.8 2454 2051 0.8
30 734 619 0.8 6275 6387 1.0
60 1582 1202 0.8 15666 11713 0.8
Single Dose DCV
Multiple Dose DCV
100 mg single dose
Observed data Simulated data +5th and 95th percentiles
60 mg multiple dose
Obs., observed; Sim., simulated
Obs., observed; Sim., simulated
3000.00
2500.00
2000.00
1500.00
1000.00
500.00
0.00
0 8 16 24 32 40 48 56 64 72
Time (h)
Syst
em
ic C
on
cen
trat
ion
(n
g/m
L)
Time (h)
2000.00
1800.00
1600.00
1400.00
1200.00
1000.00
800.00
600.00
400.00
200.00
0.00
Syst
em
ic C
on
cen
trat
ion
(n
g/m
L)
0 38 76 114 152 190 266 304 342 380228

Model Validation 1
10
GMR Cmax
(90% CI)GMR AUC
(90% CI)
Observed 0.95 (0.88–1.04) 0.87 (0.83–0.92)
Simulated 0.90 (0.87–0.94) 0.90 (0.87–0.94)
DCV effect on MDZ PK
Three trial simulations of 10 healthy subjects each
14 days of DCV 60 mg QD with a single 5 mg MDZ dose at Day 10
Simulated vs Observed Plasma DCV ± KET
Simulated ObservedWithout KET:
With KET: Simulated Observed
■ The simulated effect of DCV on MDZ exposure parameters was similar to observed data
■ Simulated PK profiles for DCV 20 mg ± KET 400 mg were similar to observed data
■ The KET effect was mainly via CYP3A inhibition, with a minor contribution from inhibition of biliary P-gp clearance
1000.00
100.00
10.00
1.00
0.10
0.0170 94 118 142 166 190 214
Time substrate (h)
Syst
emic
Co
nce
ntr
atio
n (
ng/
mL)

Model Validation 2
11
Drug DCV dose
GMR Cmax GMR AUC
Observed SimulatedSim:obs
ratioObserved Simulated
Sim:obs
ratio
RIF 60 mg SD 0.438 0.627 1.43 0.212 0.218 1.01
KET 20 mg SD 1.57 1.25 0.80 2.99 3.11 1.04
CSP 60 mg QD 1.04 1.03 0.99 1.4 1.04 0.74
■ Overall simulated GMR were similar to observed data
■ Under-prediction of RIF Cmax change may represent omission of gut P-gp induction from the model
■ Under-prediction of CSP AUC change may represent underestimation of CSP inhibition of CYP3A4, DCV hepatic uptake or DCV renal clearance
SD, single dose

■ Modelling was performed for– TDF/FTC/EVG/Cobi fixed-dose combination – EVG not modelled (non-perpetrator)
– ATV 300 mg or 400 mg alone, with ritonavir 100 mg, and with ritonavir + EFV 600 mg
– ATV 300 mg + Cobi
– DRV 800 mg + ritonavir 100 mg ± EFV 600 mg
■ Non-perpetrator ARVs in the regimen (EVG, MVC, RAL, other NRTIs) were assumed to have no effect on modelled results for the above combinations
■ DCV dose recommendations were made by comparing modelled GMR for DCV AUC and Cmax against observed interaction data for which a dose adjustment is indicated1
– Observed ATV/r (300/100 mg) : 2.1-fold AUC increase 30 mg DCV QD
– Observed EFV (600 mg) : 32% AUC decrease 90 mg DCV QD
ARV Regimen Models and DCV Dose Recommendations
121. Bifano M, et al. Antivir Ther 2013;18:931–40.

Simulated DCV PK with vs without ARVs
13
RegimenDCV GMR Cmax
(95% CI)
DCV GMR AUC
(95% CI)
Recommended
DCV Dose
TDF/FTC/EVG/Cobi (300/200/150/150 mg)a 1.46 (1.40–1.52) 2.09 (1.94–2.26) 30 mg
ATV 400 mg 1.90 (1.83–1.97) 2.69 (2.55–2.85) 30 mg
ATV 400mg + RTV 1.80 (1.71–1.89) 2.46 (2.27–2.67) 30 mg
ATV 400mg + RTV + EFV 1.75 (1.66–1.85) 2.36 (2.18–2.56) 30 mg
ATV 300mg + RTV 1.74 (1.65–1.83) 2.34 (2.15–2.55) 30 mg
ATV 300mg + RTV + EFV 1.69 (1.60–1.79) 2.24 (2.06–2.44) 30 mg
ATV 300mg + Cobi 1.97 (1.90–2.05) 2.92 (2.77–3.02) 30 mg
DRV 800 mg + RTV 1.31 (1.24–1.38) 1.56 (1.42–1.71) 60 mg
DRV 800mg + RTV + EFV 1.31 (1.25–1.39) 1.57 (1.44–1.72) 60 mg
ATV, atazanavir; Cobi, cobicistat; DRV, darunavir; EFV, efavirenz; EVG, elvitegravir; FTC, emtricitabine; RIF, rifampin; RTV, ritonavir; TDF, tenofovir disoproxil fumarate. All Regimens were QD administration. All RTV was 100 mg, all Cobi was 150 mg, and all EFV was 600 mg.aEVG not included in model
■ Substitution of etravirine for EFV in the above is expected to give similar results due to similar CYP3A4 induction

■ A validated, physiologically-based model was used to estimate PK
interactions between DCV and complex combinations of ARVs not
generally evaluated in clinical interaction studies
■ The model predicts >2-fold elevations in DCV AUC and corresponding
increases in Cmax for administration with TDF/FTC/EVG/Cobi or with
RTV- or Cobi-boosted ATV
– Lesser (<1.6-fold) effect on AUC and Cmax with RTV-boosted DRV
■ The effect of boosted PIs on DCV is not significantly affected by
concomitant EFV
■ Based on this model, the predicted dose of DCV would be:
– 30 mg QD with ATV/r- or ATV/c-based regimens ± EFV
– 60 mg QD with DRV/r-based regimens ± EFV
Summary & Conclusions
14