Embed Size (px)
Citation preview

Pre and Post Regional Development Scenario in India
1 — —© 2016 The Center for Contemporary India Studies, Hiroshima University
Journal of Urban and Regional Studies on Contemporary India 3(1): 1–10 (2016)Article
The Center for Contemporary India Studies, Hiroshima Universityhttp://home.hiroshima-u.ac.jp/hindas/index.html
1. Introduction
�e main objective of India’s development strategy has been to establish a socialistic society accompanied by eco-nomic growth self-reliance, social justice and alleviation of poverty. �ese objectives were to be achieved within a democratic political framework using the mechanism of a mixed economy where both public and private sectors co-exist (Misra 1985). Some factors contributing to India’s regional development are; �rst, changes in agriculture and the rural development that are key to India’s economic development, second, dynamic features, that bring about major regional changes as part of economic liberalization to include reorganization of spatial structures pertaining to industrialization and the formation of new industrial regions, thirdly, the progression of urbanization and development of major cities, and economic growth (Nath 2009). Contemporarily the planning tasks in India can be divided into three categories; �rst, agricultural and related development programmes (land reclamation, soil conservation, irrigation, animal husbandry, forestry and �sheries; development of industries, power, transport and communication); second, development of social services (education, medical care, social welfare); and the last one is the urban development (Misra et al. 1974). �e clas-si�cation follows broadly the sectoral classi�cation in the �ve year plans. Since Independence, the Government of India has initiated the developmental planning measures and implemented them through the Five Year Plans. So far, even though Eleven Five Year Plans have been imple-
Pre and Post Regional Development Scenario in India
Pankaj KUMAR* and Saidur RAHAMAN***Assistant Professor, Department of Geography, Delhi School of Economics, University of Delhi, Delhi- 110007, India.**Research Scholar, Department of Geography, Delhi School of Economics, University of Delhi, Delhi- 110007, India.E-mail: [email protected]*, [email protected]**
Abstract India has travelled through a remarkable journey a�er Independence. As a �edgling democracy, the planned eco-nomic development took 40 long years from 1950–51 for India’s real per capita GDP to double by 1990–91. Macroeconomic crisis of 1991 is a turning point in the post-Independence economic geography and history of India. �e government of India adopted two completely di�erent approaches of regional development in pre and post reform period a�er Independence. As a result of economic reform and unlocking its growth potential, in only 15 years, India’s per capita income doubled in 2006–07 and going to double again by 2017–18, in only 10 years time. But rising income inequalities, loss of traditional livelihoods, increasing environmental problems and emerging social tensions in post reform period urge us to overview the degree of inclusiveness achieved in balanced sustainable regional development goals and further do the needful course correction in the policies.
Key words macroeconomic crisis, regional development, income inequalities
mented, still the problem of rural poverty, unemployment and regional imbalances has remained largely unsolved. Even the basic infrastructural facilities are missing in most of the villages (Tiwari 1988).
2. Historical Background
Before Independence�e Britishers paid attention to the development of only
those regions of their colony, (especially Port Cities; like Calcutta, Bombay and Madras) which served their eco-nomic interests the most (Figure 1).
Figure 1. Development of port cities during British periodSource: Roy 2000

KUMAR P and RAHAMAN S
2 — —
�is is how the historical forces guide the development of port towns such as Bombay, Calcutta and Madras, these cities in turn functioned as the nucleus for further development of Maharashtra, West Bengal and Tamil Nadu respectively. On the other hand, resource rich regions such as Jharkhand, Orissa and Madhya Pradesh lagged behind. �e discriminatory development of some regions during the British Raj, became evident by link-ing the hinterland with the port towns by the railways. �ese port towns worked merely as outputs of the met-ropolitan economy. Before First World War, industrial investment was con�ned to only two nodes: Bombay and Calcutta. During 1930’s, some more centres emerged on the industrial map of the country such as Ahmedabad, Delhi, Kanpur, Madras, Madurai and Coimbatore, these were engaged primarily in cotton textile manufacturing. During 1913–14, the total number of companies in the provinces of Bengal was 973 (35.46%), Bombay was 613 (22.3%) and Madras 427 (15.6%). During 1938–39, Ben-gal increased its share by 6% at the expense of Bombay and Madras (Awasthi 1991).
After IndependenceOn 14 August 1947, Nehru had declared: ‘Many years
ago we made a tryst with destiny, and now the time has come when we shall redeem our pledge. �e achievement we celebrate today is but a step, an opening of opportunity, to the great triumph and achievements that await us’. He reminded the country that the tasks ahead included, ‘the ending of poverty, ignorance, disease and inequality of opportunity’. �ese were the basic foundations on which India embarked upon its path of development since gain-ing Independence in 1947. �e purpose of this talk is to analyze how much has India really achieved in the last 55 years in ful�lling the aspirations on which it was founded. India initiated planning for national economic develop-ment with the establishment of the Planning Commission. �e aim of the First Five Year Plan (1951–56) was to raise the domestic savings for initiating growth and to help the economy resurrect itself from colonial rule. �e real break with the past in planning came with the introduction of Second Five Year Plan (Nehru-Mahalanobis Plan).
�e industrialization strategy articulated by Profes-sor Mahalanobis placed emphasis on the development of heavy industries and envisaged a dominant role for the public sector in the economy. �e objectives of industrial policy (in Second Five Year Plan) were; a high growth rate, national self-reliance, reduction of foreign domi-nance, building up of indigenous capacity, encouraging small scale industries, bringing about balanced regional
development, prevention of concentration of economic power, in a few hands reduction of income inequalities and control of economy by the State. �e strategy under-lying the �rst three plans assumed that once the growth process gets established, the institutional changes would ensure that bene�ts of growth trickle down to the poor. But doubts were raised in the early 1970’s about the e�ec-tiveness of the ‘trickle down’ approach and its ability to banish poverty. Further, the growth itself generated by the planned approach remained too weak to create adequate surplus; which is a prerequisite for the ‘trickle down’ mechanism to work. �e Fi�h Plan’s (1974–79) course of action began by initiating a program, which emphasized growth with redistribution. To accelerate the process of production and to align it with contemporary realities, a mild version of economic liberalization was started in the mid 1980’s. �ree important committees were set up in the early 1980’s. First, �e Narsimhan Committee focus-ing on the shi� from physical controls to �scal controls; Second, �e Sengupta Committee on the public sector improvement; and the �ird was the Hussain Commit-tee on trade policy. As a result some progress was made in the process of deregulation during the 1980’s. Two kinds of deliquescing activities took place. Firstly, thirty two groups of industries were delicensed without any investment limit, secondly, in 1988; all industries were exempted from licensing except for a speci�ed negative list of twenty six industries.
In 1951–52 the GDP at factor cost was 2.3%, and it was the highest in 1981–82. On the other hand the GDP at factor cost was low (i.e.; only 1%) during 1971–72, that is why the NDP at factor cost was high (5.7%), and per capita NNP fall to a negative rate of (−1.8%) during 1971–72. Per capita income was high (3.5%) during the period 1981–82, but at the same time NDP at factor cost was very low (i.e.; only 0.9%), but on the contrary in 1951–52 NDP at factor cost was quite high (i.e.; 2.28%) (Table 1).
Table 1. Growth rates of selected macro economic indicators from 1951 to 1982 (in percentage)
Year GDP at Factor Cost NDP at Factor Cost Per Capita NNP
1951–52 2.3 2.28 0.5
1961–62 3.1 0.6 0.4
1971–72 1 5.7 −1.8
1981–82 5.6 0.9 3.5
Source: Central Statistics O�ce (CSO) 2010
3. The Goals of Five Year Plans
�e goals of the Five Year Plans are formed in order to

Pre and Post Regional Development Scenario in India
3 — —
promote growth, modernisation, self-reliance; and equity. �e First Five Year Plan (1951–56) was initially set up or mainly focused on primary sector. Hence the goal of First Five Year Plan was agricultural development rather than the industrial development (secondary economic development). �is does not mean that all the plans have given equal importance to all the goals. Due to limited resources, a choice has to be made in each plan as to which of the goals is to be given prime importance. Nev-ertheless, the planners have to ensure that, as far as pos-sible, the policies of the plans do not contradict the goals.
4. Lessons Learned from Planning Process
While the reasons for adopting a centrally directed strategy of development were understandable against the background of colonial rule, it, however soon became clear that the actual results of this strategy were far below expectations. Instead of showing high growth, high pub-lic savings and a high degree of self-reliance, India was actually showing one of the lowest rates of growth in the developing world with a rising public de�cit and a peri-odic balance of payment crises. Between 1950 and 1990, India’s growth rate averaged less than 4% per annum and this was at a time when the developing world, including Sub-Saharan Africa and other least developed countries, showed a growth rate of 5.2% per annum. During 1960–1975, total public sector borrowings averaged 4.4% of the GDP. �ese increased to 6% of the GDP by 1980–1981, and further to 9% by 1989–90. �us, the public sector, which was supposed to generate resources for the growth of the rest of the economy, gradually became a net drain on the society as a whole.
�ere are multiplicities of departments involved in the simplest of decisions, and administrative rules generally concentrate on the process rather than results. �ere is very little decentralization of decision-making powers, particularly �nancial powers. �us, while local authori-ties have been given signi�cant authority in some states for implementing the national programmes, their �nan-cial authority was limited. Hence, during early 90’s it was imperative for India to correct its, clearly faulty devel-opmental process. �ere have been several reasons put forward for the failure of the developmental path which necessitated the reforms of Manmohan Singh in 1991.
Liberalization and globalization�e main aims and objectives of liberalization and
globalization are to improve the quality of goods and ser-vices, to increase the employment opportunities, join in
the competition at the international level, and improve the production capacity at the domestic level.
5. Regional Disparities in the Post Reform Period
Economic liberalization and hard budget constraints have reduced the role of the centre in allocating resources to the states. �is has heightened the regional inequality. �e increasing role of private investment has provided greater autonomy to the states to take the initiative to grow. �e abolition of industrial licensing ensured that private investment, both foreign and domestic, would go to the states, where productivity gains would be the greatest. Investors sought a decent legal administrative system for pursuing business, infrastructure in the form of power, telecommunication and roads, and a skilled and disciplined work force have been provided to improve productivity. �e level of state plan expenditure was only about 10% of the investment, did not make a dent on growth. Orissa, which had the highest state plan to GSDP allocation (7.10%), grew at 3.25%, while West Bengal with the lowest plan to GSDP ratio (2.70%) grew at 6.90%. �e fastest growing states out of the 14 for which comparable data was available between 1991 and 1998 are Gujarat, Maharashtra and West Bengal; all grew at rates greater or around 7% per annum. �e middling states were Tamil Nadu, Madhya Pradesh, Rajasthan, Karnataka, and Kerala, which grew at the rate of 5.5 to 6% per annum. Madhya Pradesh, Tamil Nadu, Kerala, West Bengal, Gujarat, Maharashtra and Karnataka improved their growth rates within the reform period. Rajasthan’s growth rate declined marginally from 6.60% during 1980–1990 to 5.85% in the period 1991–98. Punjab, Haryana, Bihar, Uttar Pradesh and Orissa declined in terms of growth rates. �e problem states were Bihar, Uttar Pradesh, and Orissa. �ese three states carrying about a third of the population of the 14 states under consideration also had the greatest number of poor (Nath 2009). Regional disparity is a ubiquitous phenomenon of the developing countries like India. �e co-existence of relatively developed and economically depressed states and even regions within each state is known as Regional Imbalance. Regional disparities may be classi�ed on the basis of natural resources, man-made, inter-state or intra-sate, whole or sectorial. ‘Economic Backwardness’ of a region can be indicated by symptoms like high population pressure on land, excessive depen-dence on agriculture, absence of large-scale urbanization, low productivity in agriculture and cottage industries. Maharashtra, Uttar Pradesh, West Bengal, Gujarat and

KUMAR P and RAHAMAN S
4 — —
Tamil Nadu were share at a higher level of NDP (Figure 2).
Annual average growth rate was high in Karnataka (6.91%), West Bengal (6.88%), Gujarat (6.79%) and Maharashtra (6.06%). �e annual average growth rate can be seen at a moderate level in Orissa (5.52%), Rajasthan (5.11%), Andhra Pradesh (5.65%), Tamil Nadu (5.65%), Kerala (5.86%), and Haryana (5.37%) during the period from 1990–91 to 2004–05. On the other hand, the annual average growth rate is seen to be at a lower level in the states of Uttar Pradesh (2.79%) Assam (3.18%) Madhya Pradesh (1.78%), and Punjab (4.37%). Among these states, Bihar saw a negative growth rate (−0.99%) in the context of annual average growth rates among the Indian states (Figure 3).
�e Tenth Five Year Plan was set up for the less devel-oped States, high level of capital investment, initiative towards the better governance and institutional reforms to make the targeted investment e�ective, Rashtriya Sam Vikas Yojana (RSVY-National Equal Development Plan) were a few goals that were formulated to support the development initiatives in various backward states and regions. Whereas during the Eleventh Five year plan, several important programmes and Yojanas were setup for the less developed States, like; Pradhan Mantri Gram Swaranjayanti Swarozgar Yojana (PMGSY), Indira Awas Yojana, National Rural Health Mission (NRHM), Sarv Shiksha Abhiyan, Supplementary Nutrition Programme (SNP).
6. Human Development Index in India
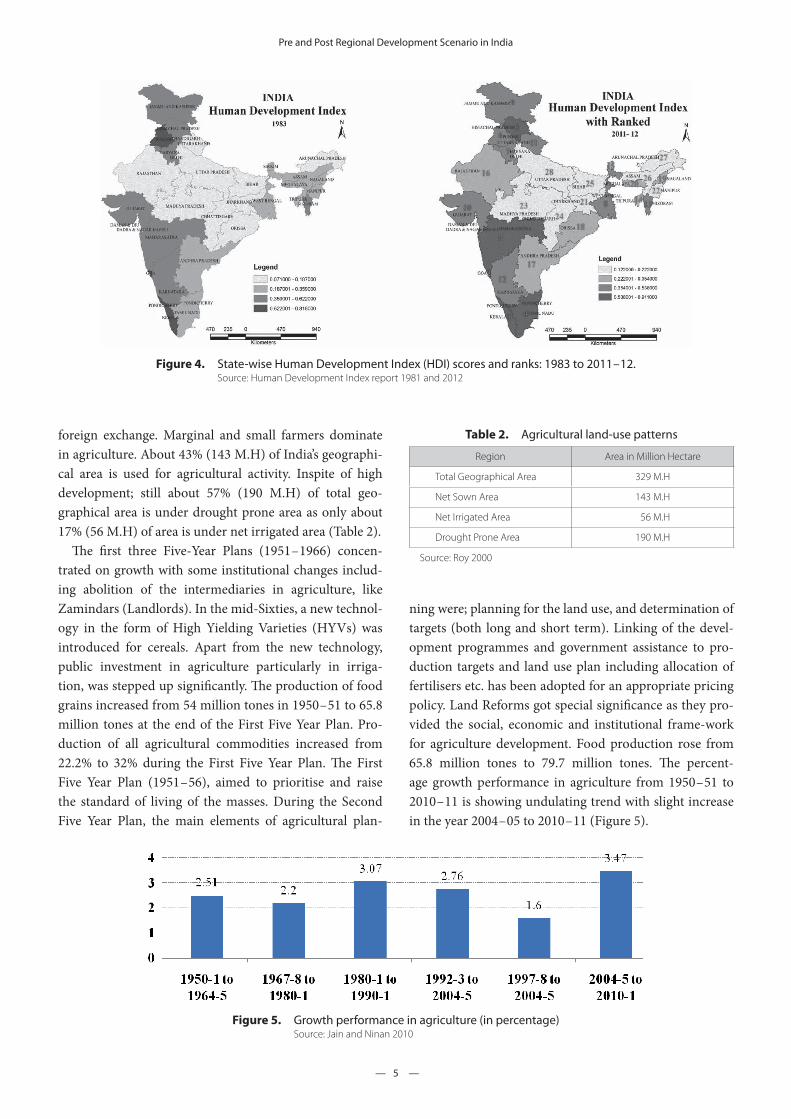
Figure 4 represents the Indian states by their respec-tive Human Development Index (HDI), in the years 1983 and 2011–12. Kerala stands �rst in Human Development Index among the states in India during 2011–12 (Figure 4). �e national average HDI for India in 2008 was 0.467. By 2010, its average HDI had risen to 0.519. UNDP, the sponsor of Human Development Index methodology since 1990, reported India’s HDI to be 0.554 for 2012, an 18% increase over its 2008 HDI. United Nations declared India’s HDI to be 0.586 in 2014, a 5.77% increase over 2012 (Figure 4).
�ere are many ways to calculate HDI, and its calcu-lation is sensitive to base data and assumptions. Using another approach, UNDP and the Government of India calculated the nationwide HDI, whose average came out to be 0.605 in 2006. In 1983 Uttarakhand, Rajasthan, Uttar Pradesh, Bihar, Madhya Pradesh, Chhattisgarh, Odisha, Jharkhand and Anurachal Pradesh were the states put in the lower categories in the HDI index. Kerala and Punjab were placed in higher categories of Human Development Index in 1981. Besides Kerala, Goa, Maharashtra, Him-achal Pradesh were also placed in the higher category in the context of Human Development Index in 2011–12 (Figure 4).
7. Indian Agriculture: A Regional Analysis
India, China, and Brazil have become major forces in the global agricultural economy. Agriculture Sector is changing the socio-economic environments of the popu-lation due to liberalization and globalization. It continues to be the major source of employment, successfully pro-vided food and raw material to industrial sector, earning
Figure 2. Net state domestic productSource: Central Statistics O�ce (CSO) 2010
Figure 3. Annual average growth rate 1990–91 to 2004–05 in percentageSource: State Domestic Product 2007
Pre and Post Regional Development Scenario in India
5 — —
foreign exchange. Marginal and small farmers dominate in agriculture. About 43% (143 M.H) of India’s geographi-cal area is used for agricultural activity. Inspite of high development; still about 57% (190 M.H) of total geo-graphical area is under drought prone area as only about 17% (56 M.H) of area is under net irrigated area (Table 2).
�e �rst three Five-Year Plans (1951–1966) concen-trated on growth with some institutional changes includ-ing abolition of the intermediaries in agriculture, like Zamindars (Landlords). In the mid-Sixties, a new technol-ogy in the form of High Yielding Varieties (HYVs) was introduced for cereals. Apart from the new technology, public investment in agriculture particularly in irriga-tion, was stepped up signi�cantly. �e production of food grains increased from 54 million tones in 1950–51 to 65.8 million tones at the end of the First Five Year Plan. Pro-duction of all agricultural commodities increased from 22.2% to 32% during the First Five Year Plan. �e First Five Year Plan (1951–56), aimed to prioritise and raise the standard of living of the masses. During the Second Five Year Plan, the main elements of agricultural plan-
ning were; planning for the land use, and determination of targets (both long and short term). Linking of the devel-opment programmes and government assistance to pro-duction targets and land use plan including allocation of fertilisers etc. has been adopted for an appropriate pricing policy. Land Reforms got special signi�cance as they pro-vided the social, economic and institutional frame-work for agriculture development. Food production rose from 65.8 million tones to 79.7 million tones. �e percent-age growth performance in agriculture from 1950–51 to 2010–11 is showing undulating trend with slight increase in the year 2004–05 to 2010–11 (Figure 5).
Figure 4. State-wise Human Development Index (HDI) scores and ranks: 1983 to 2011–12.Source: Human Development Index report 1981 and 2012
Figure 5. Growth performance in agriculture (in percentage)Source: Jain and Ninan 2010
Table 2. Agricultural land-use patterns
Region Area in Million Hectare
Total Geographical Area 329 M.H
Net Sown Area 143 M.H
Net Irrigated Area 56 M.H
Drought Prone Area 190 M.H
Source: Roy 2000

KUMAR P and RAHAMAN S
6 — —
Green revolution in IndiaDr. M.S Swaminathan initiated the project of Green
Revolution in India. In the �rst phase of the green revolu-tion (from mid-1960s up to mid-1970s), the use of HYV seeds was restricted to the more a�uent states such as Punjab, Haryana, Western Uttar Pradesh, Andhra Pradesh and Tamil Nadu (Figure 6). Further, the use of HYV seeds primarily bene�ted the wheat growing regions only. In the second phase of the green revolution (from mid-1970s to mid-1980s), the High Yield Varieties technology spread to a larger number of states and bene�ted more varieties of crops. In 1965 the Government of India (Mrs. Indira Gandhi) decided to take a major step in the direction of agricultural development. At this stage the green revolu-tion was concerned only with Wheat and Rice (Figure 6).
�e introduction and di�usion of HYV seeds in the Indian agriculture has not only enhanced the production of some of the cereals, they have also created numerous social-economic and ecological problems, like; regional inequalities, intraregional inequalities, farm size varia-tion, large and small farmers, landless labours, salinization and water logging, soil erosion, lowering of underground water tables, a�ect on vegetation cover, noise pollution etc. these were the challenges and problem prospects of Green Revolution in India. Agriculture has been the core element of the Tenth Plan (2002–07). Broad features of the agricultural development under this Plan includes; a) sustainable development of land and water resources, b) improvement in the infrastructural facilities, c) attracting capital �ow in agriculture sector, d) creating additional irrigation potential of 15.61 million hectare, e) boosting up agricultural diversi�cation, f) improving agricultural
marketing and pricing systems, g) liberalising agriculture-trading, h) agriculture-industry and exports. Eleventh Five Year Plan (2007–12) had attempted to reverse decel-eration of agricultural growth; food grains production has touched a new peak of 241.56 million tonnes in 2010–11. Growth in agriculture in the Eleventh Plan is likely about 3.3% per year.
8. Industrial Development
At the time of Independence the modern large-scale industries, together with mines, accounted for only 7% of the national income as compared to the small-scale industry’s share of 10%, 49% share for agriculture and 34% share for the construction and service sector. Employment in factories in 1951 was a mere 2.9 million and in factories and mines together employed around 3.5 million people, which amounted to 2.5% of the total work force (Patnaik 2012) (Figure 7).
In 2008–09, factories were developed specially in South and West India; Tamil Nadu, Andhra Pradesh, Maharashtra, Gujarat. Whereas the industrial develop-ment was also in�uence in West Bengal, Karnataka, Uttar Pradesh and Punjab. Madhya Pradesh, Orissa, Jharkhand, Bihar, and North Eastern States are the least developed in the context of industrial development in India (Figure 7).
9. Service Sector
In developing countries like India, the service sector can lead to inclusive growth through backward and for-ward links (Banga 2005), by ensuring equitable access to
Figure 6. Introduced green revolution in IndiaSource: ICAR 1999
Figure 7. Number of factories in IndiaSource: Annual Survey of Industries 2009–10

Pre and Post Regional Development Scenario in India
7 — —
basic services at low prices (Deloitte 2011), by creating employment opportunities, and by developing human capital. India is among the world’s rapidly growing econo-mies. In 2010, the gross domestic product (GDP) grew at 10.6% as compared to an average growth rate of 7.5% in emerging and developing economies. Although the growth rate falls to 7.2% in 2011, it was still higher than the average growth rate of emerging economies (6.2%). �e service sector has been a major contributor to India’s GDP and to its growth. Over time, the share of the ser-vice sector in GDP has increased while that of agriculture has declined GDP from agricultural sector has relatively declined from 1950 to 2000 in India. GDP from the indus-trial sector were rapidly increased from 14.8% to 24.5% in �ve decades. On the other hand, like an industrial sector GDP from service sector were also increased. In 1950s GDP from service sector was only 29.8% but in 2000s it was relatively very high (53.7%) (Table 3).
In the last decade, the share of services surpassed the combined share of agriculture and industry making it the most important contributor to the country’s output. It is
the second largest employer a�er agriculture. India’s trade in services has increased overtime, and services account for the largest share in India’s foreign direct investment (FDI) in�ows and out�ows. �e growth in the service sec-tor in India has been linked to the reforms of the 1990s. In the �rst 3 decades a�er Independence in 1947, India was largely an agrarian economy. �e service sector started to grow in the mid-1980s, but growth accelerated in the 1990s when India initiated a series of economic reforms a�er the country faced a severe balance of payments crisis. Reforms in the service sector were a part of the overall reform program which led to privatization, the removal of FDI restrictions, and streamlining of approval procedures among others. In the 1950s and 1960s, transport, storage, communication, trade, hotels, and restaurant services grew faster than the overall sector while in the 1970s and 1980s. Whereas the �nancing and business services started growing in the 1980s surpassed transport, stor-age, communication, trade, hotels, and restaurants. From 1990s to 2000s, transport, storage, and communication were the fastest growing service sector followed by �nanc-ing, insurance, real estate and business services (Figure 8).
10. Regional Policy for Urban Growth
A policy on urban growth should be based on recog-nition of the certainty of rapid urban growth during the next several decades, to understand the vital role of towns
Table 3. GDP from di�erent sectors (in percentage)
Sector 1950s 1960s 1970s 1980s 1990s 2000s
Agriculture 55.3 47.6 42.8 37.3 30.9 21.8
Industry 14.8 19.6 21.3 22.3 23.3 24.5
Services 29.8 32.8 35.9 40.3 45.7 53.7
Source: Mukherjee 2013
Figure 8. Average by decade in the growth of service industries (1950s–2000s)Source: Mukherjee 2013
14
12
10
8
6
4
2
0 1950s 1960s 1970s 1980s 1990s 2000s
Trade, hotels, and restaurant Transport, storage, and communication Financing, insurance, real estate, and business servicesCommunity, social, and personal services Gross domestic product at factor cost Total services
%

KUMAR P and RAHAMAN S
8 — —
and cities as growth centres and central places for regions of di�erent sizes, and to understand the fact that as the economy develops the spatial economic relations within it will be expressed primarily through its system of urban places. �e operation part of the policy on urban growth is related to various factors, these factors are:• Institutional systems for formulation of urban devel-
opment plans, their inter-relation with national and state plans and their �nancing from national and state resource pools in the same way as rural development plans are �nanced at present;
• Reorganization of municipalities to equip them ade-quately for rapid urban expansion;
• A major e�ort in the area of urban design, aims at evolving urban patterns which keep costs of expansion low and maximize its growth-including in�uences on the neighboring rural regions; and
• Promotion of Smart Cities at sub-regional level.
Metropolitan regional planningUrban development problems have provided the great-
est impetus for regional planning in India. A�er partition the urban problems of Delhi reached crisis proportions and the Government of India set up the Town Planning Organization in November 1955 to prepare a Master Plan specifying the optimum directions of growth and expan-sion for the city. Delhi Master Plan is a concrete step in the direction of city-oriented regional planning and must be noted as an important landmark in the history of urban and regional planning in this country. �e success of the
Delhi plan depended on the synchronous development of these ‘ring town’ which, however, did not come about as envisaged, since the plan was not coordinated with the urban development plans of the surrounding areas. �e work initiated in Delhi has been followed up in other metropolitan cities as well, so that metropolitan regional planning in the country may now be considered to be in a fairly advanced stage. Plans for Calcutta and Bombay have been prepared and the preparation of plans for the other metropolitan cities is well under way. �e Calcutta Metropolitan Planning Organization (CMPO) was set up in 1961, and prepared a basic development plan in 1966. �is plan represents a new approach to metropolitan planning, which is very di�erent from the conventional ‘Master Plan’ approach. �e concept and strategy adopted in this plan have been activated by the need to disperse the industrial and economic activities concentrated in Greater Bombay and surrounding areas. In metropolitan planning, therefore, it is necessary to consider the hinter-land to identify the growth nodes that can receive some alternative in the form of activities and functions, and still depend for business and other facilities on the metropoli-tan city. In 1980’s the number of million plus cities was 35 in India, whereas in 2011 the number of million plus cities became 53, whereas the urban population of India has been 31.16% in 2011 (Figure 9).
Smart city: concept of developmentDeveloping Smart Cities across the country will need a
large number of professionally trained personal and sev-
Figure 9. Million plus cities in India, 1981 and 2011Source: Khullar 2014 and Census of India 2011
Pre and Post Regional Development Scenario in India
9 — —
eral decision support systems to be in place. �us, there is a need for a large capacity building programme that encompasses training, education, contextual research, knowledge exchange and a rich database.City is evaluated not only for its physical and social infrastructure but also for its intellectual capital (knowledge capital). Smart city highlights the growing signi�cance of Information and Communication Technologies (ICT), and social and envi-ronmental capital. Social and environmental capital dis-tinguishes the smart cities from technology-driven digital/ intelligent cities. A city is ‘smart’ when investments lead to sustainable economic development, and high qual-ity of life, with wise management of natural resources, through participatory action and engagement. Smart cities are identi�ed by six dimensions. 1) Smart economy, i.e. competitiveness, 2) Smart people, i.e. social and human capital, 3) Smart governance, i.e. participation of citizens, 4) Smart mobility, i.e. transport and ICT, 5) Smart envi-ronment, i.e. natural resources, 6) Smart living, i.e. quality of life.
�e purpose of the Smart Cities Mission is to drive eco-nomic growth and improve the quality of life of people by enabling local area development and harnessing technol-ogy, especially technology that leads to smart outcomes. Area-based development will transform existing areas (retro�t and redevelop), including slums, into better planned ones, thereby improving liveability of the whole city. New areas (green�eld) will be developed around cit-ies in order to accommodate the expanding population in urban areas. Application of smart solutions will enable cities to use technology, information and data to improve infrastructure and services. Comprehensive development in this way will improve quality of life, create employment and enhance incomes for all, especially the poor and the disadvantaged, leading to inclusive Cities.
�e total number of 100 smart cities has been dis-tributed among the States and UTs on the basis of equi-table criteria. �e formula gives equal weightage (50:50) to urban population of the State/UT and the number of statutory towns in the State/UT. Based on this formula, each State/UT will, therefore, have a certain number of potential smart cities, with each State/UT having at least one.
11. Conclusion
�e discriminatory development of some regions dur-ing the British Raj, remain continued even a�er Indepen-dence. Somehow spatial component in planning remain neglected in early phase of planned development resulted
into lopsided regional development. �e mandate behind the opening of economy was to allow and promote foreign direct investment in the backward regions, as engine of economic growth. �e modernization strategy articulated by the Indian government did not result into minimizing regional disparities and even resulted into the co-existence of relatively developed and economically depressed area within a state. �erefore, the future programme and policies of regional development need reorganization of spatial structures pertaining to industrialization and urbanization keeping into mind balance between spatial and sectoral approach.
References
Awasthi, D.N. (1991): Regional Patterns of Industrial Growth in India. Concept Publishing Company, New Delhi. (E)
Balassa, B. (1965): Trade Liberalization and Revealed Compara-tive Advantage. �e Manchester School of Economic and Social Studies, 33(2), 99–123. (E)
Banga, R. (2005): Critical Issues in India’s Service-led Growth. Indian Council for Research on International Economic Rela-tions (ICRIER) Working Paper Series, No. 171, 1–38. (E)
Central Statistics O�ce (2010): CSO Annual Report. Ministry of Statistics and Programme Implementation. Government of India. (E)
Chanda, R. (2002): Globalization of Services: India’s Opportunities and Constraints. Oxford University Press, New Delhi. (E)
Chandhoke, N. and Priyadarshi, P. (2009): Contemporary India: Economy, Society, Politics. Dorling Kindersley Publication Pearson, New Delhi. (E)
Deloitte (2011): Inclusive Growth: A Challenging Opportunity. Deloitte and All India Management Association. http://www.deloitte.com/assets/DcomIndia/Local%20Assets/Documents/Inclusive_Growth (accessed August 1, 2016) (E)
Human Development Index Report (1981): Institute of Applied Manpower Research. Planning Commission. Government of India, New Delhi. (E)
Human Development Index Report (2012): Institute of Applied Manpower Research. Planning Commission. Government of India, New Delhi. (E)
Indian Council of Agricultural Research (1999): Directorate of Knowledge Management in Agriculture, New Delhi. (E)
Jain, S. and Ninan, T.N. eds. (2010): Servicing India’s GDP Growth. India’s Economy, Performance and Challenges-Essays in Honour of Montek Singh Ahluwalia. Oxford University Press, New Delhi. (E)
Khullar, D.R. (2014): India: A Comprehensive Geography. Kalyani Publishers, New Delhi. (E)
Ministry of Statistics & Programme Implementation (2009–10): Annual Survey of Industries. Government of India, New Delhi. (E)
Misra, G.P. (1985): Regional Structure of Development & Growth in India. Ashish Publishing House, New Delhi. (E)
Misra, R.P., Sundaram, K.V. and Prakash, V.L.S. (1974): Regional Development Planning in India. Vikash Publishing House Pvt.

KUMAR P and RAHAMAN S
10 — —
Ltd, Delhi. (E)Mukherjee, A. (2013): �e Service Sector in India. Asian Develop-
ment Bank Economics Working Paper, No. 352, 8–14. (E)Nath, V. and Aggarwal, S.K. eds. (2009): Regional Development and
Planning in India. Concept Publishing Company, New Delhi. (E)
O�ce of the Registrar General & Census Commissioner (2011): Census of India 2011, Primary Abstract Data. Ministry of Home A�airs. Government of India, New Delhi. (E)
Okahashi, H. (2013): Development of Contemporary India Area Studies as Part of Geographical Studies in Japan since the 1980s. Geographical Review of Japan Series B, 86(1), 40–51. (JE)
Patnaik, P. (2012): Industrial Development in India since Indepen-dence. Social Scientist, Vol. 7, No. 11, 3–19. (E)
Roy, T. (2000): �e Economic History of India 1857–1947. Oxford University Press, New Delhi. (E)
Sabanna, T. (2012): Inter-Regional Disparities in India. Global Research Publications, New Delhi. (E)
Sridhar, K.S. (2005): Incentives for Regional Development. Palgrave Mcmillan, New York. (E)
State Domestic Product (2007): Annual Report. Central Statistical O�ce, Ministry of Statistics and Programme Implementation, Government of India, New Delhi. (E)
Tiwari, P.C. (1988): Regional Development and Planning in India. Criterion Publications, New Delhi. 199–224.


![Pre Production Production Post Production · Pre Production [Planning] Knowledge Visual grammar (rule) Brainstorming / Theme / IDEA Reference Story / Scenario Storyboard Animatics](https://img.dokumen.tips/doc/110x75/5fda37ce684f065bfe3687ce/pre-production-production-post-production-pre-production-planning-knowledge-visual.jpg)