Embed Size (px)
Citation preview

TH
E P
AR
IS M
EM
OR
AN
DU
M O
F U
ND
ER
ST
AN
DIN
G O
N P
OR
T S
TA
TE
CO
NT
RO
L
2 0 0 7annual report
PORT STATECONTROLon course for safer shipping

bL
AC
k L
I ST
G
RE
y L
IST
w
HIT
E L
IST

bL
AC
k L
I ST
G
RE
y L
IST
w
HIT
E L
IST
3 1
3 3
3 5
2 0 0 7
C o n t e n t s
E x e c u t i v e s u m m a r y 4
P a r i s M o U d e v e l o p m e n t s 6
L o o k i n g a h e a d 1 2
C o n c e n t r a t e d I n s p e c t i o n C a m p a i g n s 1 4
M e m b e r s h i p o f t h e P a r i s M o U 1 6
C o - o p e r a t i o n w i t h o t h e r o r g a n i z a t i o n s 1 8
F a c t s a n d f i g u r e s 2 0
S t a t i s t i c a l A n n e x e s a n n u a l r e p o r t 2 0 0 7 2 5
E x p l a n a t o r y n o t e – b l a c k , G r e y a n d w h i t e l i s t s 4 8
P a r i s M o U S e c r e t a r i a t
c o l o p h o n , a d d r e s s a n d s t a f f 5 0
A n n u a l r e p o r t

1.executive summary
Although some have expected that port State control would not be necessary anymore the contrary is true. After several years where detention rates have showed a declining trend, in the past 2 years this trend has been reversed and detentions are on the rise again. Several factors may play a role, such as the increased demand for tonnage world wide and also the reported difficulties of ship owners in finding well qualified and experienced seafarers. In the coming years the Paris MoU can not afford itself any complacency and will need to focus its efforts more on those ships, ship owners, f lag States and recognized organizations which operate in the margins of what is legally acceptable.
The introduction of the new inspection regime in 2011 will play an important role. While low-risk ships will be rewarded with a 24 to 36 month inspection interval, the high-risk ships will be subject to a more rigorous inspection regime with an inspection every 6 months. Hopefully in 2008 the decision making process at the European Community level on the proposed recast Directive on port State control will be completed, thereby creating a legal framework for the EU member States.
To manage the new inspection regime, a new sophisticated database will be needed. The European Maritime Safety Agency has offered to develop and host this database for the Paris MoU and during 2007 concrete steps have been taken to include all requirements of the new inspection regime in the specifications for the information centre.
With Bulgaria and Romania joining the Memorandum in 2007, the 27 members of the agreement have carried out 22,875 inspections in 2007. For the second year in a row, the number of detentions has gone up from 944 in 2005 to 1,174 in 2006 and 1,250 in 2007. Over the period 2005-2007 ships f lying a “black listed f lag” have the highest detention rate. With 14,765 inspections and 1,716 detentions they score a detention rate of 11.6%. For ships f lying a “grey listed f lag” the detention rate is 6.5% (5,196 inspections, 337 detentions) and ships f lying a “white listed f lag” 2.9% (45,350 inspections and 1,309 detentions).
In 2007 a total of 14 ships were banned. From these ships 12 were f lying a “black listed f lag” at the time of the banning.
The year under review has been a milestone for the Paris MoU on Port State
Control. During the 40th Committee meeting in bonn, Germany, the 25th year
of the agreement was commemorated. This report contains a special section
in which representatives of governmental organizations and industry have
expressed their views on the Paris MoU.
e x e c u t i v e s u m m a r y
4

Detention percentages for bulk carriers have been rising for the past 3 years, which is not surprising taking the ageing record of this ship type. Hopefully this will not result in major casualties in the coming years.
Certain areas of deficiencies also show a concerning increase compared with 2006:• Certification of crew (15.4%)• Safety (6.5%)• Security (5.4%)• Marine pollution and environment (13.9%)• Working and living conditions (16,3%)• Operational (19.2%)• Management (50.9%)
From 1 September to 30 November 2007 a Concentrated Inspection Campaign was carried out in the context of the International Safety Management Code, jointly with the Tokyo MoU. The previous ISM campaigns in 1998 and 2002 were mainly carried out to verify that a Safety Management System was established on board. The purpose of the 2007 campaign was to verify the effective implementation of the SMS on board. In practice the campaign meant that during almost every port State control inspection within the Paris MoU
region, the SMS was verified in more detail for compliance with the international standards. Port State Control Officers verified that the SMS on board was not a “paper exercise”. 176 inspections resulted in a detention where one or more major non-conformities were found. The most commonly found of these were in the areas of “effective maintenance of the ship and equipment”, “emergency preparedness” and “reports of non-conformities and accident occurrences”. All three are key areas with regard to the safety of the ship and its crew.
Although much has been accomplished in the past 25 years, there are still some ship owners which manage to operate unsafe ships, thereby endangering the crew and the environment. Unfortunately they are assisted by poorly performing f lag States and f ly-by-night recognized organizations. Some banks are still willing to provide mortgage and insurance companies to provide coverage. In this light it is evident that the determined efforts of the Paris MoU members to fight sub-standard shipping will continue and amplify in the future.
5

1.executive summary
The task forces, of which 11 were active in 2007, are each assigned a specific work programme to investigate improvement of operational, technical and administrative port State control procedures. Reports of the task forces are submitted to the Technical Evaluation Group at which all Paris MoU members and observers are represented. The evaluation of the TEG is submitted to the Committee for final consideration and decision-making.
The MoU Advisory Board advises the Port State Control Committee on matters of a political and strategic nature, and provides direction to the task forces and Secretariat between meetings of the Committee. The Board meets several times a year and in 2007 was composed of participants from Canada, the Russian Federation, Spain, Sweden and the European Commission.
Port State Control Committee
The Port State Control Committee held its 40th meeting in Bonn, Germany on 7-11 May 2007. The MoU has grown to 27 member States and the Committee made significant progress in its deliberation over a new inspection
regime more suited to this larger region. The Committee also discussed the database, which will be the core element of this new regime and will, additionally, take into account performance of companies operating ships.
During the PSCC meeting, Bulgaria and Romania were welcomed as full members of the Paris MoU. It is very encouraging to see the Paris MoU increasing its influence to reduce sub-standard shipping in the Black Sea region. One of the main items on the agenda was the proposal for a common training programme for Port State Control Officers. The general principles of setting common and consistent standards, providing continuing training to Port State Control Officers and the updating of technical knowledge were embraced. A number of initiatives will be financed and developed jointly by the member States, Paris MoU Secretariat and European Maritime Safety Agency. The Committee noted EMSA’s progress with an electronic tool for Port State Control Officers to check the application of legislation. This is
Once a year the Port State Control Committee, which is the executive body of
the Paris MoU, meets in one of the Member States. The Committee considers
policy matters concerning regional enforcement of port State control, reviews
the work of the Technical Evaluation Group and task forces and decides on
administrative procedures.
P a r i s M o U d e v e l o p m e n t s
6

2008. For 2009, a CIC on lifeboat launching arrangements is planned.
The report of the CIC on MARPOL 73/78, Annex I carried out in February, March and April 2006 was presented to PSCC40. The results will be presented to the IMO in 2008.
The Paris MoU Celebrates 25 years
The maritime authorities of the Paris MoU celebrated 25 years of co-operation during the 40th session of the PSCC. Germany hosted a commemoration of the 25 years of Paris MoU with a boat excursion on the river Rhine for key members of the maritime world. Mr. Richard Schiferli, the General Secretary of the Paris MoU, made an opening address to the guests. Dr. Cleopatra Doumbia-Henry from the International Labour Office, Captain Hartmut Hesse on behalf of
expected to be delivered towards the end of the year following field-testing by the member State Port State Control Officers. The Committee continued to take actions in response to the 2nd Joint Ministerial Conference of the Paris and Tokyo MoUs held in Vancouver in 2004. It gave high importance to Concentrated Inspection Campaigns and scheduled a CIC on the International Safety Management Code from September to November 2007. The campaign was carried out jointly with the Tokyo MoU. In addition the Committee considered a number of options for further joint CICs with the Tokyo MoU in 2008 and beyond. A CIC on Navigation SOLAS chapter V, including voyage data recorder, automatic identification system and electronic chart display and information system will be carried out during
7

1.executive summary
Mr. Efthimios Mitropoulos, Secretary-General of the International Maritime Organization and Mr. Fotis Karamitsos from the European Commission, Directorate-General for Energy and Transport also addressed the guests. Later that evening Germany hosted a gala dinner in the Godesburg castle overlooking the Rhine valley. Mr. Felix Stenschke, Head of the Shipping Directorate at the German Ministry of Transport welcomed all the delegates and guests recalling the historical role of the Rhine as a waterway that provides for transiting sea-going ships.
TECHNICAL EVALUATION GROUP
The Technical Evaluation Group convened in March in The Hague, the Netherlands, and in November 2007 in Lisbon, Portugal. Several task forces submitted reports to the TEG for evaluation before submission to the Port State Control Committee.
Issues considered by the TEG included:• development of a new inspection regime• enhancement of the SIReNaC information
system• evaluation of Paris MoU statistics• revisions of the manual for PSC Officers• development of a new training policy• development of guidelines for campaigns on
the International Safety Management Code (2007) and Safety of Navigation (2008)
• development of guidelines for Ballast Water Management
• development of new PSC guidelines on operational drills.
Port State Control Training initiatives
The Paris MoU will continue to invest in the training and development of Port State Control Officers in order to establish a higher degree of harmonisation and standardisation in inspections throughout the region. The Secretariat organises three different training programmes for Port State Control Officers:• Seminars (twice a year)• Expert training (twice a year)• Specialized training (once a year)The Seminars are open to members, co-operating members and observers.
P a r i s M o U d e v e l o p m e n t s
8

The Seminar was attended by Port State Control Officers from the Paris MoU, as well as participants from the US Coast Guard and the ILO.Apart from new developments in the MoU, the Seminar discussed working and living conditions (STCW / ILO), the evaluation of the CIC on ISM and PSC implementation in Ireland.
Expert and Specialized Training
For the Expert Training the central themes are “The Human Element” and “Safety and Environment”. The theme of the Specialized Training will change every year. In 2007 this training dealt with inspections of tankers. Both training programmes are intended for experienced Port State Control Officers. Using that experience, the participants can work together to establish a higher degree of harmonisation and standardisation of their inspection practice. Lecturers for the training programmes are recruited from the maritime Administrations of the member States, international organizations, and educational
The agenda is more topical and deals with current issues such as inspection campaigns and new requirements.Expert and Specialized Training aims to promote a high degree of professional knowledge and harmonisation of more complex port State control issues and procedures. These 5-day training sessions are concluded with an assessment and certification.
44th PSC Seminar
The 44th Port State Control Seminar was held on 12 – 14 June 2007 in St. Petersburg, Russian Federation. The Seminar was attended by Port State Control Officers from the Paris MoU, as well as participants from the Tokyo MoU, Black Sea MoU and Israel. The Seminar covered the latest developments within the Paris MoU. The main topics of discussion were related to the CIC on ISM and emergency drills.
45th PSC Seminar
The 45th Port State Control Seminar was held on 11 – 13 December 2007 in Dublin, Ireland.
9

1.executive summary
institutions and from the maritime industry. For the training programmes in 2007 the United Kingdom, the Netherlands, as well as Lloyds Register, shipping companies, suppliers and others, provided lecturers.
The 3rd Expert Training “Safety and Environment”
The third Expert Training programme was held in The Hague in February 2007. Participants from member States and co-operating members took part in the programme. Important issues during this training were the IMDG Code, Load Lines, life saving appliances and oil filtering equipment.
The 3rd Specialized Training on the Inspection of Tankers
The third Specialized Training programme was conducted in April 2007 in London, United Kingdom, and was developed in co-operation with the Oil Companies International Marine Forum, OCIMF. Participants from members States and co-operating members took part in this training. The presentations covered a broad range of subjects with regard to oil, chemical and gas tankers and inspection procedures.
The 6th Expert Training “The Human Element”
In October 2007 the sixth Expert Training programme was held in The Hague with the Human Element as the central theme. Participants from member States as well as from the co-operating members took part in this training. The issues discussed during the training session were the ILO and STCW conventions, the Code of Good Practice and inter-cultural communication.
Distance Learning Programme
The development of the Distance Learning Programme was driven forward in 2007. During the year the module on Paris MoU procedures was further developed. The development of the third phase of the DLP programme has been taken up by EMSA.
Review Panel
Flag States or recognized organizations that cannot resolve a dispute concerning a detention with the port State may submit their case for review. The Review Panel is composed of representatives of four different MoU Authorities, on a rotating basis, plus the Secretariat.
In 2007 the Secretariat received 5 official requests for review. Each case was administrated by the Secretariat and submitted to MoU members for review. Different members are used for each case.One case was closed without review due to lack of information from the flag Administration. In three cases the Review Panel concluded that the port State decision to detain was not justified and the port State should reconsider its decision. In all cases the port States deleted the detentions. In one case the panel concluded that the port State need not reconsider its decision.
Paris MoU on the Internet
The Paris MoU Internet site has continued to enjoy an increasing demand from a variety of visitors. In particular from flag and port States, government agencies, charterers,
P a r i s M o U d e v e l o p m e n t s
10

During 2007 details were published of the m/v Gulf Pride registered in Panama and detained in Italy, the m/v Evangelia registered in Panama and detained in Germany, the m/v Osama registered in the Syrian Arab Republic and detained in Italy.The annual award for the best contribution to the “Caught in the Net” has been presented to Germany.
Other information of interest such as the monthly list of detentions, the annual report, the statistics of the “Blue Book” and news items can be downloaded from the website, which is found at “www.parismou.org”.
insurers and classification societies, who are able to monitor their performance and the performance of others on a continuous basis. Ships which are currently under detention are entered in a listing by the port State. Port State control inspections are no longer updated on a weekly basis, but can now be accessed live and provide the visitor with more detailed information. The regular publication of ships “Caught in the Net” has highlighted particularly serious detentions. These are described in detail and supported with photographs to make the general public aware of unsafe ships that have been caught by port State control.
11

1.executive summary
Although the detention level appears relatively low compared to some years
ago, port State control results for 2007 indicate that efforts still need to be
enhanced to obtain a substantial reduction in the number of substandard ships
visiting the region.
Actions agreed by the Committee during its 40th session in 2007 are in the
process of being implemented.
Performance of Recognized Organizations
For several years the Committee has closely monitored the performance of classification societies acting as recognized organizations for f lag States. A table indicating a performance ranking, based on similar principles to the table for f lag States has been published for several years. When comparing the performance with results published by the Paris MoU over the past years, the ranking in the list is unlikely to lead to many surprises.On the other hand, the list may provide an incentive, as it does for f lag States, to compete for higher quality. Among the best performing recognized organizations were:• Det Norske Veritas (Norway)• Germanischer Lloyd (Germany)• Registro Italiano Navale (Italy)
The lowest performing organizations were:• Korea Classification Society (DPR Korea)• International Register of Shipping (U.S.A.)
New Inspection Regime
The Committee decided 2 years ago on a fundamental review of its inspection regime. These principles have to be translated into practical implementation. Very important for the MoU members will be how the new inspection regime will affect their national port State control programmes, particularly since the agreement was extended to 27 members in 2007. The inspection regime will also take into account a “fair sharing” principle where, under certain conditions, the inspection burden can be shared among the members.For the EU members of the Paris MoU, the inspection regime will be translated in a new Directive, part of the “3rd Maritime Safety Package”. This package is now actively discussed by the Council of EU Ministers and by the European Parliament and will hopefully be finalized by the end of 2008.
l o o k i n g a h e a d
12

Although it was originally anticipated that the new inspection regime could enter into force in 2009, developments now indicate that 2011 is a more realistic date.Another consequence of the new inspection regime will be the introduction of a new information system. Taking EU interests into account, the Committee agreed on a “hybrid solution” in which the Paris MoU database would be integrated with EU databases. The European Maritime Safety Agency has offered to develop and host the new system. Together with a Paris MoU Expert Group the specifications for the system have been finalized and it is expected that development will start in the second half of 2008.
13

1.executive summary
Several Concentrated Inspection Campaigns have been held in the Paris
MoU region over the past years. The campaigns focus on a particular area of
compliance with international regulations with the aim of gathering information
and enforcing the level of compliance. Each campaign is prepared by experts
and identifies a number of specific items for inspection. Experience shows that
they serve to draw attention to the chosen area of compliance.
(non-conformities), corresponding with 1031 inspections. In total 1868 ISM non-conformities were recorded during the inspections. 176 inspections resulted in a detention where one or more major non-conformities (MNCs) were found. Most commonly found MNCs were issued against “effective maintenance of the ship and equipment”, “emergency preparedness” and “reports of non-conformities and accident occurrences”. All three are key areas with regard to the safety of the ship and its crew.
With regard to the performance of f lag States the average detention rate during the campaign was 5.4%. The worst performing ships, with a detention rate of 16,2% (which is three times the average) or higher, were f lying the f lag of: Albania, Comoros, Cook Islands, DPR Korea, Sierra Leone, Slovakia, St Vincent and the Grenadines and Syrian Arab Republic.
The best performing ships, with a detention rate of 0%, were f lying the f lag of: Azerbaijan, Belgium, Bermuda, China, Denmark, Faroe
c o n c e n t r a t e d i n s p e c t i o n c a m p a i g n s
ISM
2007 marked the 5 year period after the introduction of the global implementation of the ISM code. For the Paris MoU this was an occasion to focus a campaign on the effective implementation of the SMS on board.
In practice the concentrated inspection campaign meant that during almost every port State control inspection within the Paris MOU region, the safety management system was verified in more detail for compliance with the international standards. Port State Control Officers verified that the safety management system (SMS) on board was not a “paper exercise” but that the master was “fully conversant” with the SMS and ship’s personnel were able to “communicate effectively” in the execution of their duties related to the SMS.
In the period from 1 September to 30 November a total of 5427 inspections were carried out within the Paris MoU on 5120 ships. Several ships were inspected more than once.A matter of serious concern is that 1 out of 5 inspections showed ISM deficiencies
14

Islands, Finland, France, India, Ireland, Latvia, Luxembourg, Isle of Man, Philippines, Spain, Thailand, and United States of America.
Campaigns 2008, 2009 and 2010
For 2008 it has been decided that the Concentrated Inspection Campaign will focus on the requirements of SOLAS Chapter V (navigation) including passage planning, voyage data recorder, automatic identification system and electronic chart display and information system. Integrated navigation bridge systems have developed rapidly in the past decade and have become increasingly complex. Reliance on complex automated systems has therefore also developed simultaneously. The still relatively high number of deficiencies in this area has led to a focus on these aspects. Starting from September 2008 the Paris MoU, together with the Tokyo
MoU and other regional MoUs, will control compliance with SOLAS Chapter V for a 3 month period. The results of this campaign should demonstrate whether the Code is effective or not.For 2009 the Committee agreed to join the Tokyo MoU in a campaign focused on life saving arrangements. Maintenance and familiarity of the crew are the main areas for attention. It was provisionally agreed that there will be a campaign on ship loading and stability in 2010.
15

1.executive summary
In preparation for prospective new members of the Paris MoU, the Port State
Control Committee has adopted criteria for co-operating status for non-member
States and observer status for newly developed PSC regions.
In 2007 the following maritime Authorities had co-operating member status:• Bulgaria joined the MoU in 2004 as a
co-operating member. After the visit of the monitoring team, recommendations for improvements were adopted by the Committee. In 2006 a fact-finding mission visited Bulgaria to verify that all recommendations had been implemented. In May 2007 the Committee welcomed Bulgaria as a full member.
• Romania joined the MoU one year after Bulgaria and has undergone the membership process in just 2 years. Early in 2007 a fact-f inding mission visited
Romania to carry out the f inal audits before the Committee took a decision on full membership. In May 2007 the Committee welcomed Romania as a full member.
Until recently, the Paris MoU had only 2 members with dual or multiple membership - Canada and the Russian Federation with the Tokyo MoU, while the Russian Federation is also a member of the Black Sea MoU. New members Malta and Cyprus extended dual membership, since they are also members of the Mediterranean MoU. And with Bulgaria and Romania becoming members, there are further ties with the Black Sea MoU. For all these members the Paris MoU standards will prevail.
m e m b e r s h i p o f t h e P a r i s M o U
16
17

1.executive summary
The strength of regional regimes of port State control, which are bound by
geographical circumstances and interests, is widely recognised. Nine regional
MoUs have been established. The Committee has expressed concern that
some of these MoUs are dominated by Members who have not made efforts
to exercise effective control over their own fleet. Several flag States belonging
to regional MoUs appear on the “black List” of the Paris MoU. In order
to provide technical co-operation to these new MoUs, they may apply for
associate status.
Two regional agreements have obtained official observer status to the Paris MoU: The Tokyo MoU and the Caribbean MoU. The United States Coast Guard is also an at Paris MoU meetings.
The Port State Control Committee agreed to the requests from the Black Sea MoU, the Mediterranean MoU and the West and Central African MoU for associate status. Although these MoUs will not be represented in the Committee, there is a commitment from the Paris MoU to assist them on a technical and administrative basis. This will include participation in seminars and technical meetings.
The International Labour Organization and the International Maritime Organization have participated in the meetings of the Paris MoU on a regular basis since 1982.
c o - o p e r a t i o n w i t h o t h e r o r g a n i z a t i o n s
18

In 2006 the Paris MoU obtained official status at the IMO as an Inter Governmental Organization. A delegation of the MoU participated in the 15th session of the Sub-Committee on Flag State Implementation in June 2007.The 2006 Annual Report, including inspection data, an analysis of 2006 statistics, a combined list of f lags targeted by the Paris MoU, Tokyo MoU and USCG and a summary of the actions from the 2004 Ministerial Conference were submitted to the Sub-Committee on Flag State Implementation. The figures have generated good discussion on how several f lag States have implemented measures to improve their records. The Paris MoU welcomed the decision of FSI to continue this dialogue at the next session in 2008.
19

1.executive summary
During 2007 Paris MoU Member States carried out 22,877 inspections on 14,182
individual ships registered with 113 flags. The total number of inspections
increased by 6.1% compared with 2006.
Inspections
The number of individual ships inspected increased by 5.7%. The increase in inspections is partly due to the contribution of the two new Paris MoU members in the second half of 2007; without their contribution the increase is 2.6%
The overall inspection effort, that is the ratio of the number of inspections to the number of individual ship calls in Members’ ports was 30.3% in 2007, compared with 30.2% in 2006 and 31.8% in 2005. All member States reached the 25% inspection effort commitment of the Memorandum. A chart showing the individual efforts of Paris MoU members is included in the statistical annexes to this Annual Report and the separate publication: the “2007 Blue Book”.
Def iciencies
One or more deficiencies were found in 56.4% of inspections. In 2006 this figure was 53.6%. In total 74,713 deficiencies were detected, a significant increase of 12.9 %, compared with the previous year. The average number of deficiencies per inspection also increased to 3.27 in 2007. In summary, the increase in overall deficiencies reflects more deficiencies per inspection, more inspections and also the results of the CIC on ISM.
Detentions
Some deficiencies are clearly hazardous to safety, health or the environment and the ship is detained until they are rectified. Detention rates are expressed as a percentage of the number of inspections, rather than the number of individual ships inspected to take account of the fact that some ships are detained more than once in a year.In 2007 the number of inspections resulting in a detention amounted to 1,250. This compares with 1,174 detentions in 2006, 994 in 2005 and 1,187 in 2004. The average detention percentage for all inspections in 2007 is 5.46% compared with 5.44% in 2006, 4.67 % in 2005 and 5.84% in 2004. The increase of 6.5% in the number of detentions is similar to the increase in the number of inspections.
“Black, Grey and White List”
The “Black, Grey and White List” presents the full spectrum, from quality f lags to f lags with a poor performance that are considered high or very high risk. It is based on the total number of inspections and detentions over a 3-year rolling period for f lags with at least 30 inspections in the period. There are 80 f lags, on this list namely 19 on the “Black List”, 23 on the “Grey List” and 38 on the “White List”. In 2006 there were 16, 27 and 37 respectively. In 2006 it was reported “From the f igures it may be concluded that since the “Grey List” and the
f a c t s a n d f i g u r e s 2 0 0 7
20

careful not to neglect control over their ships and risk ending up on the “Black List” next year. The Cook Islands are new on the “Grey List”. Morocco improved its performance moving from the Black to the “Grey List”. Netherlands Antilles and Saudi Arabia transferred to the ‘Grey List” from the “White List”.
The “White List” represents quality f lags with a consistently low detention record. France, Bermuda (United Kingdom) and China are placed highest in terms of performance. The length of the “White List” is one more than in the previous year. India, Ireland, the Russian Federation and Vanuatu moved to the “White List” from the “Grey List”.
Ship type
Looking at detentions by ship type over several years, it is noted that general dry cargo ships and bulk carriers still account for about 75% of
“Black List” are getting smaller and the “White List” is increasing, there is a movement towards quality f lags”. In 2007, however, this statement must be qualified as the “Black List” is growing again.A hard core of f lags reappear on the “Black List”. Most f lags that were considered very high risk in previous years remain so in 2007. The poorest performing f lags are still Korea DPR, Bolivia and Albania. New on the “Black List” is Sierra Leone; in previous years this f lag had fewer than 30 inspections. Brazil disappeared from the “Black List” because of too few inspections. Jamaica, Mongolia, Panama and Ukraine joined the “Black List” from the “Grey List”.
Flags with an average performance are shown on the “Grey List”. Their appearance on this list may act as an incentive to improve and move to the “White List”. At the same time f lags at the lower end of the “Grey List” should be
21

1.executive summary
Def iciencies per major category
A total of 74,713 deficiencies were recorded during port State control inspections in 2007, an increase of 12.96 % on the number of 66,142 recorded in 2006. An increase in deficiencies is seen in all major categories and in ISM, SOLAS and certification categories in particular. With some exceptions, ships older than 15 years show substantially more deficiencies than ships of less than 5 years.The trends in key safety areas are shown below. More detailed information may be found in the statistical Annexes to this report.
Certif ication of crew
Deficiencies in compliance with the standards for training, certification and watch keeping for seafarers indicated an increase of 15.4%, from 2,684 in 2006 to 3,098 in 2007.
Safety
In 2007 deficiencies in vital safety areas such as life saving appliances, fire fighting equipment, alarm signals, structural safety, radio communication and navigation accounted for about 44% of the total number of deficiencies. The number of deficiencies in these areas has increased by 7.5% from 30,493 in 2006 to 32,788 in 2007.
Maritime Security
On 1 July 2004 the ISPS code was implemented. Until the end of 2004, 107 ISPS related deficiencies were recorded. This number has increased to 735 deficiencies in 2006 and 775 deficiencies in 2007, an increase of 5.4%
all detentions, and that the average detention rate has increased very little compared with previous years. However there is some variation by ship type. Statistical annexes to this report show the detention percentage for each ship type in 2007, 2006 and 2005.
Banning of ships
A total of 14 ships were banned from the Paris MoU region in 2007 because: they failed to call at an agreed repair yard (8), jumped detention (1), because of multiple detentions (4) or lack of valid ISM Certification (1). 12 of the 14 bannings were applied to ships f lying a black listed f lag. By the end of 2007 the ban had been lifted on 5 of these ships after verification that all deficiencies had been rectified. A number of ships remain banned from previous years.An up-to-date list of banned ships can be found on the internet site of the Paris MoU on Port State Control.
Performance of Recognized Organizations
Details of the responsibility of recognized organizations (RO) for detainable deficiencies have been published since 1999. When one or more detainable deficiencies are attributed to a recognized organization in accordance with the criteria it is recorded and the RO is informed. Out of 1,250 detentions recorded in 2007, 154 or 12.3% were considered RO related which is a similar percentage to the previous year.
f a c t s a n d f i g u r e s
22
Management
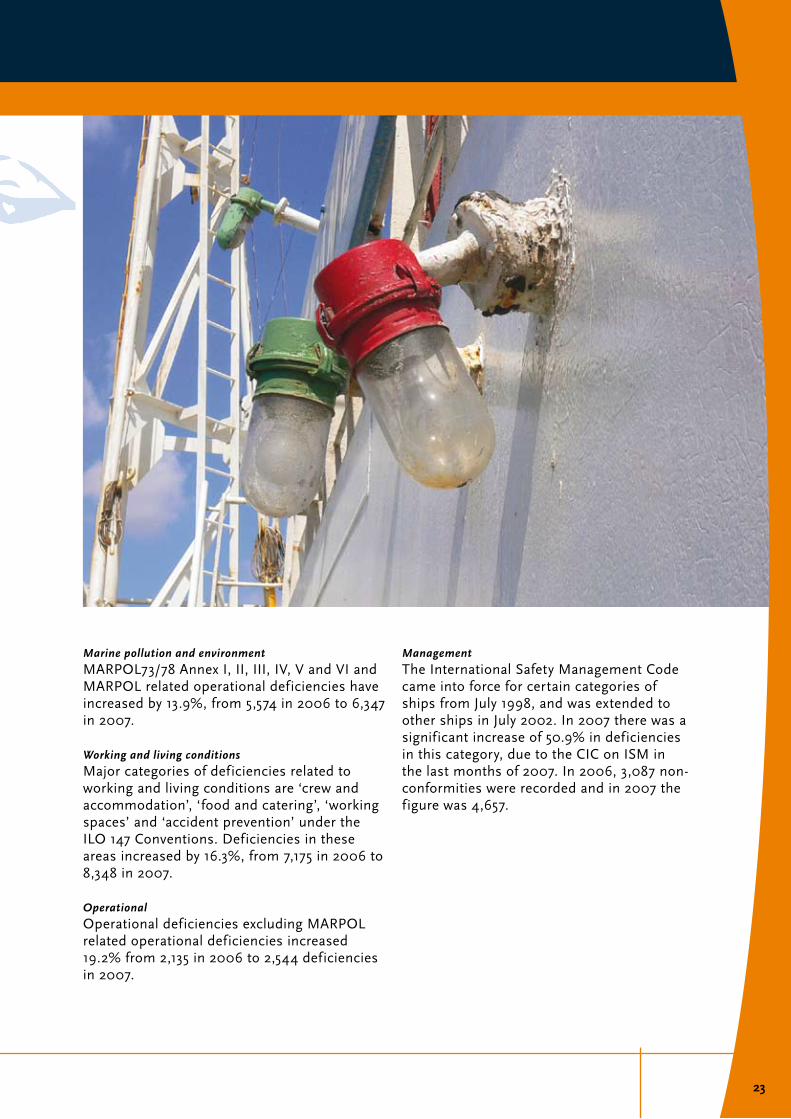
The International Safety Management Code came into force for certain categories of ships from July 1998, and was extended to other ships in July 2002. In 2007 there was a significant increase of 50.9% in deficiencies in this category, due to the CIC on ISM in the last months of 2007. In 2006, 3,087 non-conformities were recorded and in 2007 the figure was 4,657.
Marine pollution and environment
MARPOL73/78 Annex I, II, III, IV, V and VI and MARPOL related operational deficiencies have increased by 13.9%, from 5,574 in 2006 to 6,347 in 2007.
Working and living conditions
Major categories of deficiencies related to working and living conditions are ‘crew and accommodation’, ‘food and catering’, ‘working spaces’ and ‘accident prevention’ under the ILO 147 Conventions. Deficiencies in these areas increased by 16.3%, from 7,175 in 2006 to 8,348 in 2007.
Operational
Operational deficiencies excluding MARPOL related operational deficiencies increased 19.2% from 2,135 in 2006 to 2,544 deficiencies in 2007.
23

1.executive summary

STATISTICAL ANNExESannual report 2007
25

nu
mb
er
of
ind
ivid
ua
l
ship
s in
spe
cte
dn
um
be
r o
f in
spe
cti
on
s
b a s i c p o r t s t a t e c o n t r o l f i g u r e s
26

de
ten
tio
ns
in %
of
in
spe
cti
on
sn
um
be
r o
f d
ete
nti
on
sn
um
be
r o
f d
efi
cie
nc
ies
ob
serv
ed
b a s i c p o r t s t a t e c o n t r o l f i g u r e s
27

i n s p e c t i o n e f f o r t s - 1
i n s p e c t i o n e f f o r t s o f m e m b e r s c o m p a r e d t o t a r g e t
28

M O U p o r t S t a t e s ’ i n d i v i d u a l c o n t r i b u t i o n t o t h e t o t a l a m o u n t o f i n s p e c t i o n s
M O U p o r t
S t a t e Ind
ivid
ual
Sh
ips1
Insp
ecti
on
s
Insp
ecti
on
s
wit
h
def
icie
nci
es
Det
enti
on
s
Det
ents
wit
h R
O
rela
ted
d
efic
ien
cies
%-I
nsp
. w
ith
d
efic
ien
cies
% D
etai
ned
% I
nd
ivid
ual
S
hip
s in
spec
ted
(25%
com
mit
men
t)
% I
nsp
ecti
on
o
f M
OU
to
tal
b e lg ium 5080 1399 762 83 13 54,47 5,93 27,54 6,11
bu lga r i a 716 246 180 10 5 73,17 4,07 34,36 1,07
Canada 1760 693 233 27 7 33,62 3,90 39,38 3,03
Croa t i a 1356 359 244 18 0 67,97 5,01 26,47 1,57
Cyprus 1071 304 127 26 2 41,78 8,55 28,38 1,33
Denmark 2257 617 253 26 0 41 4,21 27,34 2,70
Es ton ia 1551 415 143 4 0 34,46 0,96 26,76 1,81
F in land 1273 426 115 10 0 27,00 2,35 33,46 1,86
France 5799 1702 899 89 10 52,82 5,23 29,35 7,44
Germany 5387 1447 750 51 8 51,83 3,52 26,86 6,32
Greece 2939 957 437 67 10 45,66 7,00 32,56 4,18
I ce land 366 99 29 1 0 29,29 1,01 27,05 0,43
I re l and 1352 412 276 23 9 66,99 5,58 30,47 1,80
I ta l y 6557 2228 1438 250 32 64,54 11,22 33,98 9,73
La tv ia 1812 560 257 4 0 45,89 0,71 30,91 2,45
L i thuan ia 1384 384 322 9 1 83,85 2,34 27,75 1,68
Mal ta 816 263 164 17 1 62,36 6,46 32,23 1,15
Nether l ands 5400 1461 783 54 6 53,59 3,70 27,06 6,38
Norway 2163 556 183 14 1 32,91 2,52 25,71 2,43
Po land 2259 762 370 26 3 48,56 3,41 33,73 3,33
Por tuga l 2683 935 515 69 14 55,08 7,38 34,85 4,09
Romania 1970 495 354 33 3 71,52 6,67 25,13 2,16
Russ ian Fed . 3765 1369 937 47 5 68,44 3,43 36,36 5,98
S loven ia 761 269 95 33 13 35,32 12,27 35,35 1,18
Spa in 6218 2142 1496 173 18 69,84 8,08 34,45 9,36
Sweden 2701 742 299 5 1 40,30 0,67 27,47 3,24
Un i ted k ingdom 6328 1646 1248 81 14 75,82 4,92 26,01 7,19
Tota l 73038 22888 12909 1250 177 56,40 5,46 30,23 100,00
i n s p e c t i o n e f f o r t s - 1 i n s p e c t i o n e f f o r t s - 2
29

30

Flag StateInspec -
t ions2005 -2007
Deten -t ions
2005 -2007
b lack to Grey l im i t
Grey to whi te l im i t
Excess Fac to r
b lack l i s t
korea , DPR 336 107 32 7,89
bo l i v i a 36 14 6 7,18
A lban ia 300 78 29 5,97
Comoros 446 93 41 4,59
S lovak ia 280 57 27 4,18
Georg ia 822 140 70 3,64
S ie r ra Leone 131 26 14 3,48
St .k i t t s and Nev is 136 26 15 3,29
Syr ian Arab Repub l i c 176 31 18 3,05
Honduras 84 16 10 2,84
Cambod ia 590 84 52 2,65
S t V incent and the Grenad ines
2445 278 192 2,11
be l i ze 636 67 56 1,54
Egypt 160 20 17 1,52
Jama ica 54 8 7 1,29
Panama 7368 594 552 1,18
Lebanon 149 17 16 1,18
Mongo l i a 47 7 7 1,17
Ukra ine 568 53 50 1,15
very highrisk
high risk
medium to high
risk
medium risk
b l a c k l i s t
31

b a s i c p o r t s t a t e c o n t r o l f i g u r e sb a s i c p o r t s t a t e c o n t r o l f i g u r e s
32

b a s i c p o r t s t a t e c o n t r o l f i g u r e sb a s i c p o r t s t a t e c o n t r o l f i g u r e s
Flag StateInspec -
t ions2005 -2007
Deten -t ions
2005 -2007
b lack to Grey l im i t
Grey to whi te l im i t
Excess Fac to r
Grey l i s t
Domin ica 136 14 15 4 0,92
A lge r i a 123 12 14 3 0,83
Morocco 156 13 17 5 0,68
Tha i l and 226 18 23 9 0,66
bu lga r i a 310 23 30 14 0,58
Azerba i j an 105 8 12 3 0,57
Turkey 1862 128 149 112 0,44
Aust r i a 34 2 5 0 0,44
Domin ican Repub l i c 34 2 5 0 0,44
Ta iwan , Ch ina 37 2 6 0 0,40
Croa t i a 205 13 21 8 0,40
Cook I s l ands 44 2 6 0 0,34
korea , Repub l i c o f 189 11 20 7 0,32
L i thuan ia 270 16 26 12 0,30
La tv ia 136 7 15 4 0,27
Saud i A rab ia 53 2 7 0 0,26
Faroe I s l ands 106 5 12 3 0,25
Po land 174 9 18 6 0,24
Malays ia 96 4 11 2 0,21
Romania 44 1 6 0 0,18
Tun is ia 46 1 7 0 0,17
Ant i l l es , Nether l ands 749 43 64 40 0,11
Japan 62 1 8 1 0,06
g r e y l i s t
33

34

Flag StateInspec -
t ions2005 -2007
Deten -t ions
2005 -2007
b lack to Grey l im i t
Grey to whi te l im i t
Excess Fac to r
whi te l i s tSwi t ze r l and 72 1 9 1 0,00
I ran , I s l amic Repub l i c o f 243 10 24 10 0,00
Es ton ia 171 6 18 6 0,00
Is rae l 35 0 5 0 0,00
Uni ted S ta tes o f Amer i ca 181 6 19 7 -0,13
Russ ian Federa t ion 2692 153 211 166 -0,17
I re l and 163 4 17 6 -0,43
Cayman I s l ands 390 14 36 19 -0,46
Mal ta 4470 222 341 284 -0,49
Ind ia 155 3 17 5 -0,62
Vanuatu 128 2 14 4 -0,62
barbados 381 11 35 18 -0,73
Gib ra l t a r, Uk 905 31 76 50 -0,79
be lg ium 184 3 19 7 -0,88
Cyprus 2709 95 212 167 -0,95
Por tuga l 530 13 47 27 -1,02
Ant igua and barbuda 4562 155 348 290 -1,04
Spa in 253 4 25 11 -1,10
L ibe r i a 3430 101 265 215 -1,18
Hong kong , Ch ina 1190 30 98 68 -1,20
Greece 1557 40 126 92 -1,22
bahamas 3603 100 278 227 -1,25
Luxembourg 161 1 17 5 -1,30
Norway 2626 63 206 162 -1,35
I ta l y 1210 24 100 70 -1,41
Marsha l l I s l ands 1629 34 131 97 -1,42
Nether l ands 2932 65 228 182 -1,43
Ph i l ipp ines 185 1 19 7 -1,45
Denmark 1271 23 104 74 -1,49
Man I s l e o f , Uk 929 15 78 52 -1,51
S ingapore 997 15 84 56 -1,57
F in land 587 7 52 30 -1,59
Germany 1243 19 102 72 -1,59
Uni ted k ingdom 1682 24 135 100 -1,67
Sweden 1001 11 84 56 -1,73
Ch ina 280 1 27 12 -1,75
bermuda , Uk 300 1 29 13 -1,79
France 313 1 30 14 -1,81
w h i t e l i s t
35

Flag State
Insp
ectio
ns
Det
entio
ns
Insp
ectio
ns
with
de
ficie
ncie
s
Indi
vidu
alSh
ips
Insp
ectio
n %
with
de
ficie
ncie
s
Det
entio
n %
E r i t r ea 1 - 1 1 100,00 0,00
Es ton ia 65 3 34 29 52,31 4,62
Eth iop ia 1 - 1 1 100,00 0,00
Faroe I s l ands 39 1 19 24 48,72 2,56
F in land 209 3 98 116 46,89 1,44
France 122 - 65 79 53,28 0,00
Georg ia 326 52 275 130 84,36 15,95
Germany 401 6 169 271 42,14 1,50
Gibra l ta r, Uk 334 8 151 174 45,21 2,40
Greece 559 15 222 423 39,71 2,68
Grenada 1 - - 1 0,00 0,00
Honduras 18 4 13 11 72,22 22,22
Hong kong , Ch ina 394 8 156 320 39,59 2,03
Ind ia 56 1 27 43 48,21 1,79
Indones ia 1 - 1 1 100,00 0,00
I ran , I s l amic Repub l i c o f 73 6 40 53 54,79 8,22
I re land 50 - 25 29 50,00 0,00
Is rae l 7 - 1 7 14,29 0,00
I ta l y 430 8 197 303 45,81 1,86
Jamaica 20 5 18 11 90,00 25,00
Japan 17 - 6 16 35,29 0,00
Jordan 2 - 2 2 100,00 0,00
kazakhs tan 4 - 2 4 50,00 0,00
k i r iba t i 2 - 1 2 50,00 0,00
korea , DPR 66 19 57 36 86,36 28,79
korea , Repub l i c o f 71 6 53 55 74,65 8,45
kuwa i t 6 - 1 6 16,67 0,00
Latv ia 51 2 37 24 72,55 3,92
Lebanon 33 5 22 19 66,67 15,15
L ibe r i a 1309 48 666 939 50,88 3,67
Flag State
Insp
ectio
ns
Det
entio
ns
Insp
ectio
ns
with
de
ficie
ncie
s
Indi
vidu
alSh
ips
Insp
ectio
n %
with
de
ficie
ncie
s
Det
entio
n %
A l ban ia 96 24 79 29 82,29 25,00
A lge r i a 34 4 31 18 91,18 11,76
Ant igua and barbuda 1598 54 877 811 54,88 3,38
Ant i l l es , Nether l ands 249 20 166 117 66,67 8,03
Argent ina 1 1 1 1 100,00 100,00
Aust r i a 8 - 6 5 75,00 0,00
Azerba i j an 37 2 25 22 67,57 5,41
bahamas 1247 34 619 777 49,64 2,73
bahra in 3 - 3 2 100,00 0,00
bang ladesh 1 - 1 1 100,00 0,00
barbados 147 6 79 78 53,74 4,08
be lg ium 62 2 29 46 46,77 3,23
be l i ze 216 26 170 113 78,70 12,04
bermuda , Uk 103 - 41 75 39,81 0,00
bo l i v i a 18 8 18 8 100,00 44,44
braz i l 6 - 5 4 83,33 0,00
bu lgar i a 98 10 71 57 72,45 10,20
Cambod ia 250 39 212 129 84,80 15,60
Canada 9 1 7 6 77,78 11,11
Cayman I s l ands , Uk 127 6 67 81 52,76 4,72
Ch i l e 1 - 1 1 100,00 0,00
China 76 - 39 63 51,32 0,00
Comoros 196 44 164 89 83,67 22,45
Cook I s l ands 29 2 22 19 75,86 6,90
Croa t i a 65 5 35 44 53,85 7,69
Cyprus 907 35 506 536 55,79 3,86
Denmark 433 3 183 286 42,26 0,69
Domin ica 57 9 45 29 78,95 15,79
Domin ican Repub l i c 9 1 7 3 77,78 11,11
Egypt 55 8 41 26 74,55 14,55
i n s p e c t i o n s , d e t e n t i o n s a n d d e f i c i e n c i e s 2 0 0 7
36

Flag StateIn
spec
tions
Det
entio
ns
Insp
ectio
ns
with
de
ficie
ncie
s
Indi
vidu
alSh
ips
Insp
ectio
n %
with
de
ficie
ncie
s
Det
entio
n %
E r i t r ea 1 - 1 1 100,00 0,00
Es ton ia 65 3 34 29 52,31 4,62
Eth iop ia 1 - 1 1 100,00 0,00
Faroe I s l ands 39 1 19 24 48,72 2,56
F in land 209 3 98 116 46,89 1,44
France 122 - 65 79 53,28 0,00
Georg ia 326 52 275 130 84,36 15,95
Germany 401 6 169 271 42,14 1,50
Gibra l ta r, Uk 334 8 151 174 45,21 2,40
Greece 559 15 222 423 39,71 2,68
Grenada 1 - - 1 0,00 0,00
Honduras 18 4 13 11 72,22 22,22
Hong kong , Ch ina 394 8 156 320 39,59 2,03
Ind ia 56 1 27 43 48,21 1,79
Indones ia 1 - 1 1 100,00 0,00
I ran , I s l amic Repub l i c o f 73 6 40 53 54,79 8,22
I re land 50 - 25 29 50,00 0,00
Is rae l 7 - 1 7 14,29 0,00
I ta l y 430 8 197 303 45,81 1,86
Jamaica 20 5 18 11 90,00 25,00
Japan 17 - 6 16 35,29 0,00
Jordan 2 - 2 2 100,00 0,00
kazakhs tan 4 - 2 4 50,00 0,00
k i r iba t i 2 - 1 2 50,00 0,00
korea , DPR 66 19 57 36 86,36 28,79
korea , Repub l i c o f 71 6 53 55 74,65 8,45
kuwa i t 6 - 1 6 16,67 0,00
Latv ia 51 2 37 24 72,55 3,92
Lebanon 33 5 22 19 66,67 15,15
L ibe r i a 1309 48 666 939 50,88 3,67
i n s p e c t i o n s , d e t e n t i o n s a n d d e f i c i e n c i e s 2 0 0 7
37
Flag State
Insp
ectio
ns
Det
entio
ns
Insp
ectio
ns
with
de
ficie
ncie
s
Indi
vidu
alSh
ips
Insp
ectio
n %
with
de
ficie
ncie
s
Det
entio
n %
S l ovak ia 103 24 83 48 80,58 23,30
S loven ia 2 - 1 1 50,00 0,00
Spa in 80 1 43 50 53,75 1,25
Sr i Lanka 1 - 1 1 100,00 0,00
St. Vincent and the Grenadines 777 86 564 380 72,59 11,07
St . k i t t s and Nev is 96 16 83 50 86,46 16,67
Sweden 344 9 151 204 43,90 2,62
Swi t ze r l and 26 1 12 20 46,15 3,85
Sy r i an Arab Repub l i c 76 15 60 51 78,95 19,74
Ta iwan , Ch ina 7 - 5 5 71,43 0,00
Tanzan ia Un i ted Rep . 2 1 2 1 100,00 50,00
Tha i l and 56 2 42 39 75,00 3,57
Togo 1 1 1 1 100,00 100,00
Tonga 3 - 2 2 66,67 0,00
Tun is ia 21 - 18 9 85,71 0,00
Turkey 670 41 432 418 64,48 6,12
Tuva lu 10 2 7 7 70,00 20,00
Ukra ine 200 21 155 123 77,50 10,50
Uni ted Arab Emi ra tes 10 - 6 8 60,00 0,00
Uni ted k ingdom 603 10 293 418 48,59 1,66
Uni ted S ta tes o f Amer i ca 54 3 36 48 66,67 5,56
Vanuatu 44 1 21 28 47,73 2,27
V ie t Nam 9 2 8 6 88,89 22,22
Tota l 22877 1250 12896 14182 56,38 5,46
Flag State
Insp
ectio
ns
Det
entio
ns
Insp
ectio
ns
with
de
ficie
ncie
s
Indi
vidu
alSh
ips
Insp
ectio
n %
with
de
ficie
ncie
s
Det
entio
n %
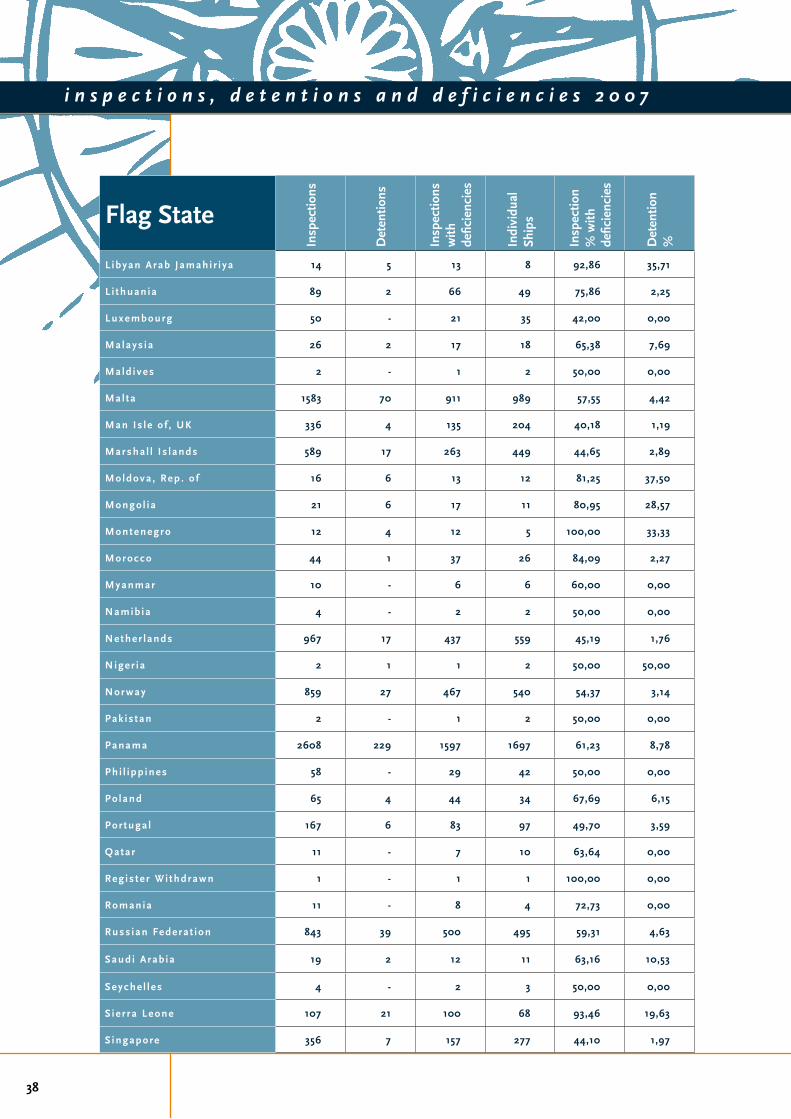
L i byan Arab Jamah i r i ya 14 5 13 8 92,86 35,71
L i thuan ia 89 2 66 49 75,86 2,25
Luxembourg 50 - 21 35 42,00 0,00
Malays ia 26 2 17 18 65,38 7,69
Mald ives 2 - 1 2 50,00 0,00
Mal ta 1583 70 911 989 57,55 4,42
Man I s l e o f , Uk 336 4 135 204 40,18 1,19
Marsha l l I s l ands 589 17 263 449 44,65 2,89
Moldova , Rep . o f 16 6 13 12 81,25 37,50
Mongo l i a 21 6 17 11 80,95 28,57
Montenegro 12 4 12 5 100,00 33,33
Morocco 44 1 37 26 84,09 2,27
Myanmar 10 - 6 6 60,00 0,00
Namib ia 4 - 2 2 50,00 0,00
Nether l ands 967 17 437 559 45,19 1,76
Niger ia 2 1 1 2 50,00 50,00
Norway 859 27 467 540 54,37 3,14
Pak is tan 2 - 1 2 50,00 0,00
Panama 2608 229 1597 1697 61,23 8,78
Ph i l ipp ines 58 - 29 42 50,00 0,00
Po land 65 4 44 34 67,69 6,15
Por tuga l 167 6 83 97 49,70 3,59
Qata r 11 - 7 10 63,64 0,00
Reg is te r wi thdrawn 1 - 1 1 100,00 0,00
Romania 11 - 8 4 72,73 0,00
Russ ian Federa t ion 843 39 500 495 59,31 4,63
Saud i A rab ia 19 2 12 11 63,16 10,53
Seyche l l es 4 - 2 3 50,00 0,00
S ie r ra Leone 107 21 100 68 93,46 19,63
S ingapore 356 7 157 277 44,10 1,97
i n s p e c t i o n s , d e t e n t i o n s a n d d e f i c i e n c i e s 2 0 0 7
38

Flag StateIn
spec
tions
Det
entio
ns
Insp
ectio
ns
with
de
ficie
ncie
s
Indi
vidu
alSh
ips
Insp
ectio
n %
with
de
ficie
ncie
s
Det
entio
n %
S l ovak ia 103 24 83 48 80,58 23,30
S loven ia 2 - 1 1 50,00 0,00
Spa in 80 1 43 50 53,75 1,25
Sr i Lanka 1 - 1 1 100,00 0,00
St. Vincent and the Grenadines 777 86 564 380 72,59 11,07
St . k i t t s and Nev is 96 16 83 50 86,46 16,67
Sweden 344 9 151 204 43,90 2,62
Swi t ze r l and 26 1 12 20 46,15 3,85
Sy r i an Arab Repub l i c 76 15 60 51 78,95 19,74
Ta iwan , Ch ina 7 - 5 5 71,43 0,00
Tanzan ia Un i ted Rep . 2 1 2 1 100,00 50,00
Tha i l and 56 2 42 39 75,00 3,57
Togo 1 1 1 1 100,00 100,00
Tonga 3 - 2 2 66,67 0,00
Tun is ia 21 - 18 9 85,71 0,00
Turkey 670 41 432 418 64,48 6,12
Tuva lu 10 2 7 7 70,00 20,00
Ukra ine 200 21 155 123 77,50 10,50
Uni ted Arab Emi ra tes 10 - 6 8 60,00 0,00
Uni ted k ingdom 603 10 293 418 48,59 1,66
Uni ted S ta tes o f Amer i ca 54 3 36 48 66,67 5,56
Vanuatu 44 1 21 28 47,73 2,27
V ie t Nam 9 2 8 6 88,89 22,22
Tota l 22877 1250 12896 14182 56,38 5,46
i n s p e c t i o n s , d e t e n t i o n s a n d d e f i c i e n c i e s 2 0 0 7
39

Flag State
Insp
ectio
ns
Det
entio
ns
Det
entio
ns
% 2
00
7
Exce
ss o
f av
erag
e 20
07
Det
entio
ns
% 2
00
6
Exce
ss o
f av
erag
e 20
06
A l ban ia 96 24 25,00 19,54 29,90 24,46
A lge r i a 34 4 11,76 6,30 6,52 1,08
Antilles, Netherlands 249 20 8,03 2,57 5,67 0,23
be l i ze 216 26 12,04 6,58 11,79 6,35
bu lga r i a 98 10 10,20 4,74 6,60 1,16
Cambod ia 250 39 15,60 10,14 16,27 10,83
Comoros 196 44 22,45 16,99 19,17 13,73
Cook I s l and 30 2 6,67 1,21 0,00 -5,44
Croa t i a 65 5 7,69 2,23 6,90 1,46
Domin ica 57 9 15,79 10,33 4,00 -1,44
Egypt 55 8 14,55 9,09 13,04 7,60
Georg ia 325 51 15,69 10,23 18,57 13,13
I ran I s l amic Repub l i c o f 72 6 8,33 2,87 2,60 -2,84
korea Democratic People's rep. 66 19 28,79 23,33 36,84 31,40
korea Repub l i c o f 71 6 8,45 2,99 6,00 0,56
Lebanon 33 5 15,15 9.69 15,38 9,94
Malays ia 26 2 7,69 2,23 2,94 -2,50
Mongo l i a 21 6 28,57 23,11 0,00 -5,44
Panama 2605 229 8,79 3,33 8,57 3,13
Po land 65 4 6,15 0,69 3,39 -2,05
S ie r ra Leone 106 21 19,81 14,35 22,73 17,29
S lovak ia 103 24 23,30 17,84 17,82 12,38
St Vincent and the Grenadines 777 86 11,07 5,61 12,30 6,86
St k i t t s and Nev is 96 16 16,67 11,21 27,03 21,59
Syr ian Arab Repub l i c 76 15 19,74 14,28 16,67 11,23
Turkey 670 41 6,12 0,66 7,06 1,62
Ukra ine 200 21 10,50 5,04 8,89 3,45
Uni ted S ta tes o f Amer i ca 54 3 5,56 0,10 1,85 -3,59
Average o f To ta l - - 5,46 - 5,44 -
● Only f lags with more than 20 port State control inspections in 2007 are recorded in this table and the graph
● The orange area in the graph represents the 2007 average detention percentage (5,48%)
2 0 0 7 d e t e n t i o n s p e r f l a g S t a t e , e x c e e d i n g a v e r a g e p e r c e n t a g e
40

Flag StateIn
spec
tions
Det
entio
ns
Det
entio
ns
% 2
00
7
Exce
ss o
f av
erag
e 20
07
Det
entio
ns
% 2
00
6
Exce
ss o
f av
erag
e 20
06
A l ban ia 96 24 25,00 19,54 29,90 24,46
A lge r i a 34 4 11,76 6,30 6,52 1,08
Antilles, Netherlands 249 20 8,03 2,57 5,67 0,23
be l i ze 216 26 12,04 6,58 11,79 6,35
bu lga r i a 98 10 10,20 4,74 6,60 1,16
Cambod ia 250 39 15,60 10,14 16,27 10,83
Comoros 196 44 22,45 16,99 19,17 13,73
Cook I s l and 30 2 6,67 1,21 0,00 -5,44
Croa t i a 65 5 7,69 2,23 6,90 1,46
Domin ica 57 9 15,79 10,33 4,00 -1,44
Egypt 55 8 14,55 9,09 13,04 7,60
Georg ia 325 51 15,69 10,23 18,57 13,13
I ran I s l amic Repub l i c o f 72 6 8,33 2,87 2,60 -2,84
korea Democratic People's rep. 66 19 28,79 23,33 36,84 31,40
korea Repub l i c o f 71 6 8,45 2,99 6,00 0,56
Lebanon 33 5 15,15 9.69 15,38 9,94
Malays ia 26 2 7,69 2,23 2,94 -2,50
Mongo l i a 21 6 28,57 23,11 0,00 -5,44
Panama 2605 229 8,79 3,33 8,57 3,13
Po land 65 4 6,15 0,69 3,39 -2,05
S ie r ra Leone 106 21 19,81 14,35 22,73 17,29
S lovak ia 103 24 23,30 17,84 17,82 12,38
St Vincent and the Grenadines 777 86 11,07 5,61 12,30 6,86
St k i t t s and Nev is 96 16 16,67 11,21 27,03 21,59
Syr ian Arab Repub l i c 76 15 19,74 14,28 16,67 11,23
Turkey 670 41 6,12 0,66 7,06 1,62
Ukra ine 200 21 10,50 5,04 8,89 3,45
Uni ted S ta tes o f Amer i ca 54 3 5,56 0,10 1,85 -3,59
Average o f To ta l - - 5,46 - 5,44 -
● Only f lags with more than 20 port State control inspections in 2007 are recorded in this table and the graph
● The orange area in the graph represents the 2007 average detention percentage (5,48%)
2 0 0 7 d e t e n t i o n s p e r f l a g S t a t e , e x c e e d i n g a v e r a g e p e r c e n t a g e
41

2005 2006 2007
Def. Main Group Category of deficiencies Def Def% Def Def% Def Def%
CertificatesCrew certificates 2529 4,1% 2684 4,1% 3098 4,1%
Ship's certificates and documents 3583 5,7% 4198 6,3% 5152 6,9%
Total Certificates 6112 9,8% 6882 10,4 8250 11,0%
Equipment and Machinery
Mooring arrangements 930 1,5% 936 1,4% 1122 1,5%
Propulsion and auxiliary mach. 4287 6,9% 5077 7,7% 5379 7,2%
Radio communications 3027 4,8% 2724 4,1% 3040 4,1%
Safety of navigation 6681 10,7% 7570 11,4% 7875 10,5%
Total Equipment and Machinery 14925 23,9% 16307 24,7% 17416 23,3%
Management ISM related deficiencies 2940 4,7% 3087 4,7% 4657 6,2%
Total Management 2940 4,7% 3087 4,7% 4657 6,2%
Safety and Fire Appliances
Alarm signals 425 0,7% 488 0,7% 532 0,7%
Fire safety measures 8631 13,8% 8511 12,9% 9319 12,5%
Life saving appliances 6147 9,8% 6017 9,1% 6147 8,2%
Total Safety and Fire Appliances 15203 24,4% 15016 22,7% 15998 21,4%
Security Maritime security 817 1,3% 735 1,1% 775 1,0%
Total Security 817 1,3% 735 1,1% 775 1,0%
Ship and Cargo Operations
Gargoes 588 0,9% 567 0,9% 593 0,8%
Gas and chemical carriers 214 0,3% 192 0,3% 226 0,3%
MARPOL - annex I 3270 5,2% 4601 7,0% 5097 6,8%
MARPOL - annex II 40 0,1% 68 0,1% 162 0,2%
MARPOL - annex III 6 0,0% 13 0,0% 11 0,0%
MARPOL - annex IV 24 0,0% 39 0,1% 46 0,1%
MARPOL - annex V 608 1,0% 640 1,0% 743 1,0%
MARPOL - annex VI 17 0,0% 92 0,1% 163 0,2%
MARPOL related operational deficiencies 134 0,2% 121 0,2% 125 0,2%
Operational deficiencies 2099 3,4% 2135 3,2% 2544 3,4%
Total Ship and Cargo Operations 7000 11,2% 8468 12,8% 9710 13,0%
Stability and Structure
bulks carriers 111 0,2% 171 0,3% 270 0,4%
Load lines 3197 5,1% 3118 4,7% 3414 4,6%
Structural safety 5165 8,3% 5183 7,8% 5875 7,9%
Total Stability and Structure 8473 13,6% 8472 12,8% 9559 12,8%
working and Living Conditions
Accident prevention (ILO147) 1048 1,7% 1369 2,1% 1559 2,1%
Accommodation 1720 2,8% 1684 2,5% 1943 2,6%
Food and catering 1634 2,6% 1673 2,5% 1886 2,5%
working spaces 2562 4,1% 2449 3,7% 2960 4,0%
Total working and Living Conditions 6964 11,2% 7175 10,8% 8348 11,2%
End Total 62434 66142 74713
Ship type
Insp
ectio
ns
Insp
ectio
ns w
ith
defic
ienc
ies
% o
f ins
pect
ions
with
de
ficie
ncie
s
Indi
vidu
al s
hips
Det
entio
ns
Det
entio
n %
20
07
Det
entio
n %
20
06
Det
entio
n %
20
05
+/-
ave
rage
de
tent
ion
%
bu l k Car r i e rs 3479 2064 59,33 2564 193 5,55 4,98 4,08 0,08
Chemica l Tankers 1750 875 50,00 1093 62 3,54 2,18 3,42 -1,92
Gas Car r i e rs 470 205 43,62 325 7 1,49 0,67 1,75 -3,97
Genera l Dry Cargo 9292 5862 63,09 4851 745 8,02 7,99 6,61 2,55
Other Types 889 545 61,30 694 56 6,30 6,16 4,62 0,84
Passenger Sh ips Fe r r i es 962 577 59,98 551 23 2,39 3,35 2,80 -3,07
Re f r ige ra ted Cargo 688 498 72,38 462 47 6,83 6,70 5,62 1,37
Ro -Ro / Conta ine r Veh ic l e 3306 1501 45,40 2263 86 2,60 2,71 2,66 -2,86
Tankers / Comb. Car r i e rs 2041 769 37,68 1520 31 1,52 2,95 2,34 -3,95
A l l t ypes 22877 12896 56,37 14323 1250 5,46 5,44 4,67 -
i n s p e c t i o n s a n d d e t e n t i o n sPER SHIP TyPE
42

2005 2006 2007
Def. Main Group Category of deficiencies Def Def% Def Def% Def Def%
CertificatesCrew certificates 2529 4,1% 2684 4,1% 3098 4,1%
Ship's certificates and documents 3583 5,7% 4198 6,3% 5152 6,9%
Total Certificates 6112 9,8% 6882 10,4 8250 11,0%
Equipment and Machinery
Mooring arrangements 930 1,5% 936 1,4% 1122 1,5%
Propulsion and auxiliary mach. 4287 6,9% 5077 7,7% 5379 7,2%
Radio communications 3027 4,8% 2724 4,1% 3040 4,1%
Safety of navigation 6681 10,7% 7570 11,4% 7875 10,5%
Total Equipment and Machinery 14925 23,9% 16307 24,7% 17416 23,3%
Management ISM related deficiencies 2940 4,7% 3087 4,7% 4657 6,2%
Total Management 2940 4,7% 3087 4,7% 4657 6,2%
Safety and Fire Appliances
Alarm signals 425 0,7% 488 0,7% 532 0,7%
Fire safety measures 8631 13,8% 8511 12,9% 9319 12,5%
Life saving appliances 6147 9,8% 6017 9,1% 6147 8,2%
Total Safety and Fire Appliances 15203 24,4% 15016 22,7% 15998 21,4%
Security Maritime security 817 1,3% 735 1,1% 775 1,0%
Total Security 817 1,3% 735 1,1% 775 1,0%
Ship and Cargo Operations
Gargoes 588 0,9% 567 0,9% 593 0,8%
Gas and chemical carriers 214 0,3% 192 0,3% 226 0,3%
MARPOL - annex I 3270 5,2% 4601 7,0% 5097 6,8%
MARPOL - annex II 40 0,1% 68 0,1% 162 0,2%
MARPOL - annex III 6 0,0% 13 0,0% 11 0,0%
MARPOL - annex IV 24 0,0% 39 0,1% 46 0,1%
MARPOL - annex V 608 1,0% 640 1,0% 743 1,0%
MARPOL - annex VI 17 0,0% 92 0,1% 163 0,2%
MARPOL related operational deficiencies 134 0,2% 121 0,2% 125 0,2%
Operational deficiencies 2099 3,4% 2135 3,2% 2544 3,4%
Total Ship and Cargo Operations 7000 11,2% 8468 12,8% 9710 13,0%
Stability and Structure
bulks carriers 111 0,2% 171 0,3% 270 0,4%
Load lines 3197 5,1% 3118 4,7% 3414 4,6%
Structural safety 5165 8,3% 5183 7,8% 5875 7,9%
Total Stability and Structure 8473 13,6% 8472 12,8% 9559 12,8%
working and Living Conditions
Accident prevention (ILO147) 1048 1,7% 1369 2,1% 1559 2,1%
Accommodation 1720 2,8% 1684 2,5% 1943 2,6%
Food and catering 1634 2,6% 1673 2,5% 1886 2,5%
working spaces 2562 4,1% 2449 3,7% 2960 4,0%
Total working and Living Conditions 6964 11,2% 7175 10,8% 8348 11,2%
End Total 62434 66142 74713
i n s p e c t i o n s a n d d e t e n t i o n sPER SHIP TyPE
m a j o r c a t e g o r i e o f d e f i c i e n c i e s 2 0 0 5 - 2 0 0 7
43

Recognized organization*
Tota
l nu
mbe
r of
in
spec
tion
s
Nu
mbe
r of
in
divi
dual
sh
ips
insp
ecte
d
Tota
l nu
mbe
r of
de
ten
tion
s
Det
enti
on-%
of
tota
l nu
mbe
r of
in
spec
tion
s
+/-
Per
cen
tage
of
Ave
rage
Det
enti
on-%
of
indi
vidu
al s
hip
s in
spec
ted
+/-
Per
cen
tage
of
Ave
rage
American bureau of Shipping (USA) AbS 1798 1342 3 0,17 -0,37 0,22 -0,63
bulgarski koraben Registar bkR 81 45 7 8,64 8,11 15,56 14,71
bureau Securitas bS 12 10 0 0,00 -0,53 0,00 -0,85
bureau Veritas (France) bV 3993 2383 17 0,43 -0,08 0,76 -0,10
China Classification Society CCS 331 267 1 0,30 -0,23 0,37 -0,48
China Corporation Register of Shipping CCRS 24 21 0 0,00 -0,53 0,00 -0,85
Croatian Register of Shipping CRS 104 67 0 0,00 -0,53 0,00 -0,85
Det Norske Veritas DNVC 4409 2986 5 0,11 -0,42 0,17 -0,68
Germanischer Lloyd GL 4932 2794 11 0,22 -0,31 0,39 -0,46
Hellenic Register of Shipping (Greece) HRS 319 165 6 1,88 1,35 3,64 2,79
Honduras Int. Surveying Insp. bureau HINSIb 14 10 0 0,00 -0,53 0,00 -0,85
Inclamer (Cyprus) INC 80 28 1 1,25 0,72 3,57 2,72
Indian Register of Shipping IRS 66 49 0 0,00 -0,53 0,00 -0,85
International Naval Surveys bureau (Greece) INSb 314 149 5 1,59 1,08 3,36 2,51
International Register of Shipping (USA) IS 446 211 19 4,26 3,73 9,00 8,15
Isthmus bureau of Shipping (Greece) IbS 110 55 3 2,73 2,19 5,45 4,60
korean Register of Shipping kRS 209 165 2 0,96 0,42 1,21 0,36
Lloyd’s Register (Uk) LR 4984 3222 27 0,54 0,01 0,84 -0,01
Nippon kaiji kyokai Nkk 2129 1597 8 0,38 -0,16 0,50 -0,35
Panama bureau of Shipping PbS 12 10 0 0,00 -0,53 0,00 -0,85
Panama Maritime Doc. Services PMDS 59 32 4 6,78 6,25 12,50 11,65
Panama Register Corporation PRC 61 40 1 1,64 1,11 2,50 1,65
Polski Rejestr Statkow PRS 330 179 1 0,30 -0,23 0,56 -0,29
Register of Shipping (Albania) RSA 93 28 6 6,45 5,92 21,43 20,58
korea Classification Society (korea, DPR)1 kCS 37 19 1 2,70 2,17 5,26 4,41
Registro Italiano Navale RINA 1034 648 2 0,19 -0,34 0,31 -0,54
RINAVE Portuguesa RP 28 17 0 0,00 -0,53 0,00 -0,85
Russian Maritime Register of Shipping RMRS 2608 1402 13 0,50 -0,03 0,93 0,08
Shipping Register of Ukraine SRU 218 124 12 5,50 4,97 9,68 8,83
Turkish Lloyd TL 475 279 0 0,00 -0,53 0,00 -0,85
29310 18344 156 0,53 0,85
Detentions of ships with RO related detainable deficiencies per Recognized Organization
(CASES IN WHICH MORE THAN 10 INSPECTIONS ARE INVOLVED)
* Where a country is shown after a Recognized Organization this indicates its location and not necessarily any connection with the maritime administration of that country.
1 formerly Register of Shipping
44
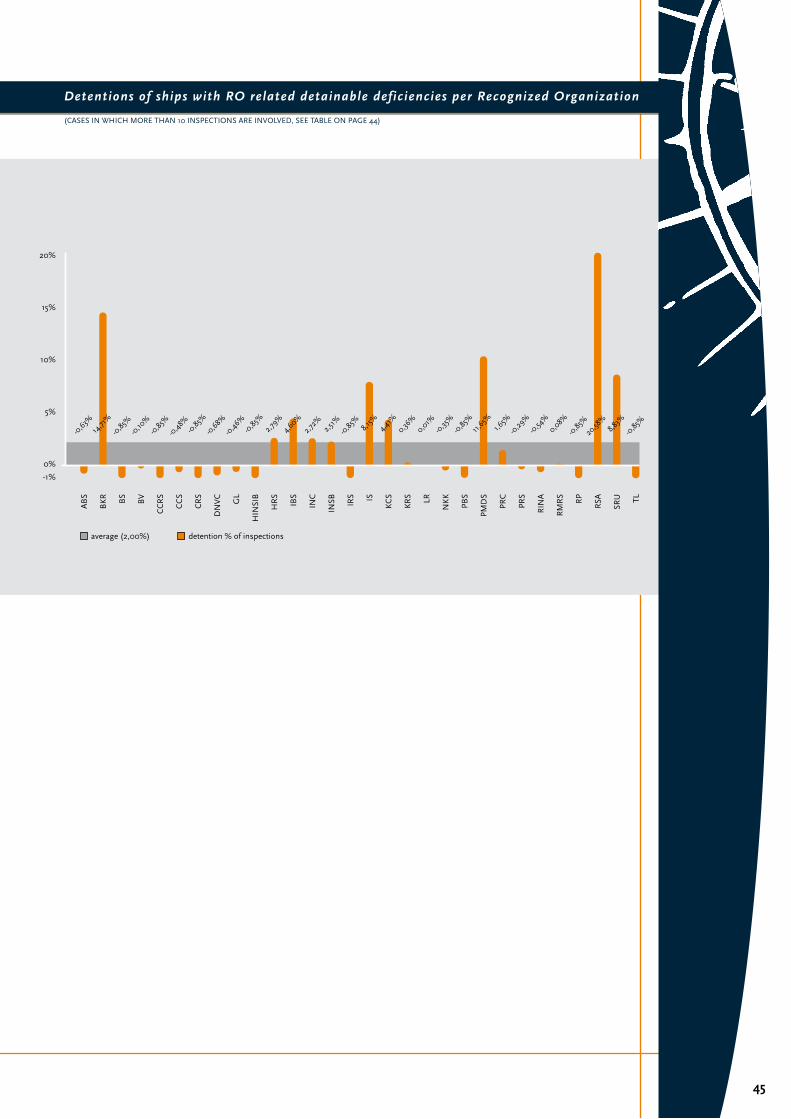
Detentions of ships with RO related detainable deficiencies per Recognized Organization
(CASES IN WHICH MORE THAN 10 INSPECTIONS ARE INVOLVED, SEE TABLE ON PAGE 44)
45

Recognized organization*
Insp
ecti
ons*
dete
nti
ons
Low
/ m
ediu
m li
mit
Med
ium
/ h
igh
lim
it
exce
ss f
acto
r
Per
form
an-c
e le
vel
korea Classification Society (DPR korea)2 kCS 112 8 5 0 2,75
Very low
International Register of Shipping (USA) IS 790 38 23 9 2,65
Shipping Register of Ukraine SRU 441 19 14 3 1,89
LowRegister of Shipping (Albania) RSA 287 13 10 1 1,77
bulgarski koraben Registar bkR 264 12 10 1 1,72
Inclamer (Cyprus) INC 171 7 7 0 1,03
Panama Maritime Documentation Services PMDS 165 5 7 0 0,75
Medium
Isthmus bureau of Shipping (Greece) IbS 206 5 8 0 0,62
International Naval Surveys bureau (Greece) INSb 730 14 21 8 0,46
Hellenic Register of Shipping (Greece) HRS 837 15 24 10 0,38
Panama Register Corporation PRC 143 2 6 0 0,37
Croatian Register of Shipping CRS 307 4 11 2 0,26
High
Polski Rejestr Statkow PRS 1018 13 28 13 0,00
China Corporation Register of Shipping CCRS 78 0 4 0 0,00
Indian Register of Shipping IRS 148 0 6 0 0,00
Rinave RP 75 0 4 0 0,00
korean Register of Shipping kRS 598 5 18 6 -0,19
Russian Maritime Register of Shipping RMRS 7080 50 161 122 -1,11
China Classification Society CCS 820 2 23 9 -1,29
Lloyd's Register (Uk) LR 12939 70 285 232 -1,36
Nippon kaiji kyokai Nkk 5923 29 137 100 -1,37
Turkish Lloyd TL 1144 3 31 15 -1,41
bureau Veritas (France) bV 10108 48 226 179 -1,43
American bureau of Shipping AbS 4846 18 113 80 -1,50
Registro Italiano Navale RINA 2647 6 65 41 -1,64
Germanischer Lloyd GL 13271 30 292 238 -1,73
Det Norske Veritas DNVC 11170 20 248 199 -1,78
In this table only Recognized Organizations that had more than 60 inspections are taken into account. The formula used is identical to the one used for the
Black Grey and White l ist. However, the values for P and Q are adjusted to P=0,02 and Q=0,01
* Where a country is shown after a Recognized Organization this indicates its location and not necessarily any connection with the maritime administration of that country
2 formerly Register of Shipping
R e c o g n i z e d O r g a n i z a t i o n p e r f o r m a n c e t a b l e ( 2 0 0 5 - 2 0 0 7 )
46

Flag
Faile
d to
cal
l at
in
dica
ted
re
pair
yar
d
Jum
ped
de
ten
tion
Mu
ltip
le
dete
nti
ons
No
valid
ISM
cert
ific
ates
ban
ned
sh
ips
Albania 1 1
bolivia 1 1
Cambodia 3 4 7
Comoros 1 1
Georgia 1 4 5
korean Dem. Peop. Rep 4 2 6
Lebanon 1 1 2
Libyan Arab Jamahiriya 1 1
Lithuania 1 1
Madagascar 1 1
Panama 4 2 6 1 13
Slovakia 1 1 2
St. kitts and Nevis 1 1
St. Vincent and Grenadines 2 3 5
Syrian Arab Republic 2 2
Turkey 2 1 4 7
Totals 21 7 27 1 56
R e f u s a l o f a c c e s s ( b a n n i n g ) p e r f l a g s t a t e 2 0 0 5 - 2 0 0 7
47

1
10
100
1000
30 50 100 250 500 1000 2000
Number of Inspections
Number of Detentions
EF = 4 and above very high riskEF = 3 to 4 high riskEF = 2 to 3 medium to high riskEF = 1 to 2 medium risk
EF = 4 EF = 3 EF = 2 EF = 1 BlackEF = 0 White
EF = -1
EF = -2
The new normative listing of Flags provides an independent categorization
that has been prepared on the basis of Paris MoU port State inspection
results. Compared to the calculation method of previous year, this system has
the advantage of providing an excess percentage that is significant and also
reviewing the number of inspections and detentions over a 3-year period at
the same time, based on binomial calculus.
The performance of each Flag is calculated using a standard formula for statistical calculations in which certain values have been fixed in accordance with agreed Paris MoU policy. Two limits have been included in the new system, the ‘black to grey’ and the ‘grey to white’ limit, each with its own specific formula:
In the formula “N” is the number of inspections, “p” is the allowable detention limit (yardstick), set to 7% by the Paris MoU Port State Control Committee, and “z” is the significance requested (z=1.645 for a statistically acceptable certainty level of 95%). The result “u“ is the allowed number of detentions for either the black or white list. The “u“ results can be found in the table A number of detentions above this ‘black to grey’
limit means significantly worse than average, where a number of detentions below the ‘grey to white’ limit means significantly better than average. When the amount of detentions for a particular Flag is positioned between the two, the Flag will find itself on the grey list. The formula is applicable for sample sizes of 30 or more inspections over a 3-year period.To sort results on the black or white list, simply alter the target and repeat the calculation. Flags which are still significantly above this second target, are worse than the f lags which are not. This process can be repeated, to create as many refinements as desired. (Of course the maximum detention rate remains 100%!) To make the f lags’ performance comparable, the excess factor (EF) is introduced. Each incremental or decremental step corresponds with one whole EF-point of difference. Thus the excess factor EF is an indication for the
E x p l a n a t o r y n o t e – B l a c k , G r e y a n d W h i t e l i s t
48

number of times the yardstick has to be altered and recalculated. Once the excess factor is determined for all f lags, the f lags can be ordered by EF. The excess factor can be found in the last column the black, grey or white list. The target (yardstick) has been set on 7% and the size of the increment and decrement on 3%. The Black/Grey/White lists have been calculated in accordance with the above principles.The graphical representation of the system, below, is showing the direct relations between the number of inspected ships and the number of detentions. Both axis have a logarithmic character.as the ‘black to grey’ or the ‘grey to white’ limit.
Example f lag on Black list:
Ships of Flag A were subject to 108 inspections of which 25 resulted in a detention . The “black to grey limit” is 12 detentions. The excess factor is 4,26
N= total inspectionsP = 7%Q =3%Z = 1.645
How to determine the black to grey limit:
The excess factor is 4,26. This means that ‘p’ has to be adjusted in the formula. The black to grey limit has an excess factor of 1, so to determine the new value for ‘p’, ‘q’ has to be multiplied with 3,26 and the outcome has to be added to the normal value for ‘p’:
Example f lag on Grey list:
Ships of Flag B were subject to 141 inspections, of which 10 resulted in a detention. The ‘ black to grey limit” is 15 and the “ grey to white limit” is 4. The excess factor is 0.51.How to determine the black to grey limit:
How to determine the grey to white limit:
To determine the excess factor the following formula is used:
= Detentions – grey to white limit / grey to black limit – grey to white limit
Example f lag on White list:
Ships of Flag C were subject to 297 inspections of which 11 resulted in detention. The “grey to white limit” is 13 detentions. The excess factor is –0,28.How to determine the grey to white limit:
The excess factor is - 0,28 This means that ‘p’ has to be adjusted in the formula. The grey to white limit has an excess factor of 0, so to determine the new value for ’p’, ‘q’ has to be multiplied with –0,28, and the outcome has to be added to the normal value for ‘p’:
E x p l a n a t o r y n o t e – B l a c k , G r e y a n d W h i t e l i s t
49

1.executive summary
Address Secretariat:
Jan van Nassaustraat 125P.O.Box 906532509 LR The HagueTelephone: +31 70 456 1508Fax: +31 70 456 [email protected]
Layout and design
Rooduijn bureau voor communicatie & design
Photographs
Richard W. J. SchiferliParis MoU Authorities of:- Germany- Spain- www.fotoklein.de
Website
The Paris MoU maintains a website which can be found at www.parismou.org. The site contains information on operation of the Paris MoU and a database of inspection results.
Staff
Mr. Richard W.J. SchiferliGeneral SecretaryTelephone: +31 70 456 1509E-mail: [email protected]
Mrs. Carien DroppersDeputy General SecretaryTelephone: +31 70 456 1507E-mail: [email protected]
Mr. Ivo SnijdersSecretaryTelephone: +31 70 456 1849E-mail: [email protected]
Mr. Peter AarsenSecretaryTelephone: +31 70 456 1510E-mail: [email protected]
Mr. Edwin MeeuwsenSecretaryTelephone: +31 70 456 1627E-mail: [email protected]
Mr. Roy WelbornOffice ManagerTelephone: +31 70 456 1436E-mail: [email protected]
Secretariat Paris Memorandum of Understanding on Port State Control
50

p a r i s m o u f a c t s h e e t o r g a n i z a t i o n a l s t r u c t u r e
51