Embed Size (px)
Citation preview

The Paris Memorandum of Understanding on Port State Control
Annual Report 2001Annual Report 2001


Annual Report 2001
3
Contents
1. Executive summary . . . . . . . . . . . . . . . . . . . . . . . . . . . . . . . . . . . . . . . . . . . . . . . . . . . . . . . . . . . . . . . . . . . . . . . . . . . . . . . . . . . 5
2. Paris MOU developments . . . . . . . . . . . . . . . . . . . . . . . . . . . . . . . . . . . . . . . . . . . . . . . . . . . . . . . . . . . . . . . . . . . . . . . . . . . . . 6
3. Looking ahead . . . . . . . . . . . . . . . . . . . . . . . . . . . . . . . . . . . . . . . . . . . . . . . . . . . . . . . . . . . . . . . . . . . . . . . . . . . . . . . . . . . . . . . . 8
4. Concentrated Inspection Campaigns . . . . . . . . . . . . . . . . . . . . . . . . . . . . . . . . . . . . . . . . . . . . . . . . . . . . . . . . . . . . . . . . . . . 9
5. Membership of the Paris MOU . . . . . . . . . . . . . . . . . . . . . . . . . . . . . . . . . . . . . . . . . . . . . . . . . . . . . . . . . . . . . . . . . . . . . . . 10
6. Co-operation with other organizations . . . . . . . . . . . . . . . . . . . . . . . . . . . . . . . . . . . . . . . . . . . . . . . . . . . . . . . . . . . . . . . . 11
7. Facts and figures . . . . . . . . . . . . . . . . . . . . . . . . . . . . . . . . . . . . . . . . . . . . . . . . . . . . . . . . . . . . . . . . . . . . . . . . . . . . . . . . . . . . 12
Statistical Annexes to the Annual Report 2001 . . . . . . . . . . . . . . . . . . . . . . . . . . . . . . . . . . . . . . . . . . . . . . . . . . . . . . . . . . . 15Annex 1 - Inspections• Basic port State control figures . . . . . . . . . . . . . . . . . . . . . . . . . . . . . . . . . . . . . . . . . . . . . . . . . . . . . . . . . . . . . . . . . . . . . . . . 16• Inspection efforts Paris MOU members . . . . . . . . . . . . . . . . . . . . . . . . . . . . . . . . . . . . . . . . . . . . . . . . . . . . . . . . . . . . . . . . 19• Black - Grey - White List . . . . . . . . . . . . . . . . . . . . . . . . . . . . . . . . . . . . . . . . . . . . . . . . . . . . . . . . . . . . . . . . . . . . . . . . . . . . . . 21
Annex 2 - Detentions• Inspections, detentions and deficiencies per flag State . . . . . . . . . . . . . . . . . . . . . . . . . . . . . . . . . . . . . . . . . . . . . . . . . . 23• Flag States exceeding average detention percentage . . . . . . . . . . . . . . . . . . . . . . . . . . . . . . . . . . . . . . . . . . . . . . . . . . . . 26• Inspections and detentions per ship type . . . . . . . . . . . . . . . . . . . . . . . . . . . . . . . . . . . . . . . . . . . . . . . . . . . . . . . . . . . . . . . 27
Annex 3 - Deficiencies• Summary of major categories of deficiencies . . . . . . . . . . . . . . . . . . . . . . . . . . . . . . . . . . . . . . . . . . . . . . . . . . . . . . . . . . . 28
Annex 4 - Class performance• Detentions with class related detainable deficiencies . . . . . . . . . . . . . . . . . . . . . . . . . . . . . . . . . . . . . . . . . . . . . . . . . . . . 30• Detentions with class related detainable deficiencies . . . . . . . . . . . . . . . . . . . . . . . . . . . . . . . . . . . . . . . . . . . . . . . . . . . . 32• Number of detentions per classification society . . . . . . . . . . . . . . . . . . . . . . . . . . . . . . . . . . . . . . . . . . . . . . . . . . . . . . . . . 33• Detentions with class related detainable deficiencies per flag State . . . . . . . . . . . . . . . . . . . . . . . . . . . . . . . . . . . . . . . 34
Explanatory note - Black, Grey and White lists . . . . . . . . . . . . . . . . . . . . . . . . . . . . . . . . . . . . . . . . . . . . . . . . . . . . . . . . . . . 38
Paris MOU Secretariat colophon, address and staff . . . . . . . . . . . . . . . . . . . . . . . . . . . . . . . . . . . . . . . . . . . . . . . . . . . . . . 40
Paris MOU organizational structure . . . . . . . . . . . . . . . . . . . . . . . . . . . . . . . . . . . . . . . . . . . . . . . . . . . . . . . . . . . . . . . . . . . . . 41

4

Annual Report 2001
5
1. Executive summary
After nearly 20 years of operation the Paris MOU hasset its course for the years ahead. Determinedtargeting of substandard ships, greater transparencyto the outside world and a higher level ofharmonization and quality are goals for the future. At the same time ship owners, flag States,classification societies and charterers will be heldaccountable for their performance and involvementwith sub-standard ships. While on the other hand,companies, ships and flags with a good safety recordwill be rewarded for investing in quality shipping.
The overall figures for 2001 are very similar to those of 2000. The total numbers of inspections, individualships and ships detained do not show substantialchange and therefore provide a platform forcomparing other aspects which indicate trends in thesafety of shipping.
When looking at the chain of responsibility in theshipping industry it is evident that many companiesoperating older tonnage do not show a great interestin proper safety standards. Recognizing that not everyold ship is necessarily a bad ship, the figures indicatethat in areas related to safety, the marine environment,operational standards and implementation of a safetymanagement system in particular, such owners pose agreat risk.
Apparently a number of flag States which areresponsible for certifying these ships have moreconcern for their revenues than safety standards. "Fine examples" of new flags of convenience are SaoTome and Principe, Cambodia and Tonga. Theseregisters have managed to find their way to the top ofthe Black List in a single year. Other notorious flags seem to be comfortable withtheir position on the Black List and have not shownany sign of improvement over the years.Several other flags have fortunately taken positivesteps to improve their record and are no longerconsidered a "risk flag".To take account of the important role of classificationsocieties when acting on behalf of a flag State, theirresponsibility has been closely monitored over the past3 years. In 22% of 1,699 detentions the classificationsociety was held responsible (380). From these 380 class related detentions 78% (297)were attributed to class societies acting on behalf offlags on the Black List. Does this indicate that safety is or can be measured
by double standards or should classification societiesbecome more discriminating in whom they represent?
The number of deficiencies recorded during port Statecontrol inspections in 2001 (68,756) showed a slightincrease and is only 1.5% higher when compared withlast year. The increasing trend in operationaldeficiencies related to safety procedures is stillcontinuing at an alarming rate. Since 1999 there hasbeen an increase of 29%. Ships older than 15 yearsshow over 11 times as many operational deficienciesas ships less than 5 years old.
Of even greater concern is a steep increase in safetymanagement defects which over 3 years haveincreased by 150%. Again ships older than 15 yearsshow 14 times as many non-conformities as ships lessthan 5 year old. Since all ISM compliant ships have been subject toseveral audits by the company and flag or classificationsociety since they were certified in 1998, the standardof non-compliance should be cause for concern.At the same time questions are raised as to how thecompanies of these ships managed to obtain aDocument of Compliance.
It is widely recognized that there is a close correlationbetween safety and working and living conditions (ILO Convention No. 147). Deficiency rates haveincreased over many years. In particular older bulkcarriers and general dry cargo ships are sometimesfound in an appalling condition for the crew.Combined with contracts of long service on board andextensive working hours there is no room for a safetyculture on board these ships. Unfortunately many flagStates and classification societies take no interest ordeny their competence and leave it to port States topick up the pieces.

6
Annual Report 2001
2. Paris MOU developments
GeneralOnce a year the Port State Control Committee whichis the executive body of the Paris MOU meets in oneof the Member States. The Committee considerspolicy matters concerning regional enforcement ofport State control, reviews the work of the TechnicalEvaluation Group and task forces and decides onadministrative procedures.
The task forces, of which 12 were active in 2001, areeach assigned a specific work programme toinvestigate improvement of operational, technical andadministrative port State control procedures. Reportsof the task forces are submitted to the TechnicalEvaluation Group (TEG) at which all Paris MOUmembers and observers are represented. Theevaluation of the TEG is submitted to the Committeefor final consideration and decision making.
The MOU Advisory Board advises the Port StateControl Committee on matters of a political andstrategic nature, and provides direction to the taskforces and Secretariat between meetings of theCommittee. The board meets several times a year andin 2001 was composed of participants from Canada,Denmark, Norway, the United Kingdom and theEuropean Commission.
Port State Control CommiteeThe Port State Control Committee (PSCC) held its 34thmeeting in Bruges, Belgium on 8-11 May 2001.
The Committee revealed that every ship flying a blacklisted flag which entered the region in 2000 wassubject to at least one inspection.
While this is not a target for the Paris MOU it doesdemonstrate that any ship flying one of these flags willbe subjected to an inspection. It is also an indicationthat the new targeting system is starting to achieve itsaims.Across the whole of the MOU there was a swing of9% towards the inspection of higher target factorships.
Discussions continued on the introduction of a systemwhich rewards quality ships. The system will aim toreflect the one recently introduced by the USCG.
During the meeting the Committee decided to carryout a Concentrated Inspection Campaign (CIC) on all
ships subject to the ISM Code from 1 July 2002, notjust those ships which become ISM eligible after thatdate. The CIC for 2003 will focus on operational aspects ofpassenger ships and it was agreed that living andworking conditions should be the theme for 2004. This last campaign will inform the review of majorcrew conventions being carried out by ILO. Inconjunction, a task force will investigate improvementsto information available in the database on manning,training, certification and living and workingconditions.
With the introduction of STCW95 in February 2002,the Committee confirmed that Port State ControlOfficers would focus on the new requirements fromthat date and provide feedback on the level ofcompliance.
The Committee reviewed data on class performanceand agreed to more detailed information beinggathered and presented to the next meeting. The Committee also agreed to review the presentsystem for dealing with requests for information ondetentions from flag States and owners.
As part of the development of a new inspectiondatabase it was agreed that the possibility of recordingdetails of charterers should be investigated. Closeliaison will be maintained with the USCG who arerecording such information. The Committee also decided to investigate thepossibility of using a system complementary toSIReNaC for checking the convention requirements for all ships.
In a move to encourage flag State improvement,members of the Paris MOU who had not already doneso agreed to submit their Self Assessment Forms assoon as possible, and many will be made public.
Following a pilot course of training material held earlierthis year, the Paris MOU is to review the package witha view to establishing a comprehensive trainingprogramme from next year.
Noting the increasing use of electronic charts on shipsthe Committee approved new guidance for Port StateControl Officers.
The Committee welcomed Estonia as its newest co-operating member.

Annual Report 2001
The initiative to invite representatives of the industrywas repeated. Representatives of OCIMF,INTERTANKO and INTERCARGO attended a half-daysession during which areas of mutual interest werediscussed.
Technical Evaluation GroupThe Technical Evaluation Group (TEG) convened onceduring 2001. Several task forces submitted reports tothe TEG for evaluation before submission to the PortState Control Committee.
Issues considered by TEG included:• development of a new SIReNaC information
system• preparations for an inspection campaign on
STCW compliance starting February 2002• preparations for a Concentrated Inspection
Campaign on ISM implementation in 2002• preparations for a Concentrated Inspection
Campaign on operational safety of passenger ships in 2003
• improvement of the reporting system for PSCinspections, including recording of charterers
• development of a Paris MOU reward system• evaluation of statistics• enforcement of the human element related to
working and resting hours on board
Port State Control Seminars32nd PSC SeminarThe 32nd Port State Control Seminar of the ParisMOU was held in St.Petersburg, Russian Federation on 26-28 June 2001. The Seminar was attended byPort State Control Officers from the Paris MOU, aswell as participants from the Viña del Mar Agreement,Estonia, Latvia, Lithuania and Slovenia. The seminar covered the latest developments in theParis MOU and provisions under MARPOL 73/78Annex I, II and V, focussing on recent changes anddevelopments including PSC enforcement provisions.
33rd PSC SeminarThe 33rd PSC Seminar was held on 24-26 October2001, in Athens, Greece. It was attended by Port StateControl Officers from the Paris MOU, as well asparticipants from the Tokyo MOU, Viña del MarAgreement, Estonia, Latvia, Lithuania, Slovenia andSouth-Africa. The seminar was dedicated to human element issues:STCW95 and ISM, and their correlation, in preparationfor the (Concentrated) Inspection Campaigns whichare scheduled to take place between February andApril 2002 and from July until September 2002respectively.
New Information SystemFast developing database and internet technologyhave made it necessary to replace the current versionof the SIReNaC F information system, which has beenin operation since 1998.In addition, several amendments in port State controlpolicy such as targeting of ships, new inspectionprocedures and measuring performance ofclassification societies have made it necessary todevelop a new database/information system. Last yearthe Committee agreed the financial basis for a newsystem which will be designed by the FrenchDepartement des Systèmes d'Information (DSI).The new system will make full use of internettechnology and an ORACLE database architecture.Port State Control Officers will be able to access thesystem for interrogation and updating by means ofportable PC’s and cellular phones. It will also providemore accurate descriptions of inspection results andinclude a range of new data.A Task Force was instructed to oversee thedevelopment of the new system which is expected tobecome operational in January 2003.
Paris MOU on the InternetThe Paris MOU Internet site has undergone a majorface-lift. The new lay-out guarantees easier and fasteraccess and the advanced search options of thedatabase have been in increasing demand from avariety of visitors. In particular from flag and portStates, government agencies, charterers, insurers andclassification societies who are able to monitor theirperformance and the performance of others on acontinuous basis. The internal web site has also undergone a major re-development. Most documents, manuals, guidelinesand meeting papers are now available on line forconsultation by the port State authorities. They mayalso make use of the discussion forum to exchangemessages and views.
The regular publication of the "Rustbucket" hashighlighted particularly serious detentions. These aredescribed in detail and supported with photographicmaterial to make the general public aware of unsafeships that have been caught by port State control.During 2001 the motor vessels M Trans (Cambodia),Shiva (Cambodia) and Isparta (Turkey) were "namedand shamed".
Other information of interest such as the monthly listof detentions, the annual report, the statistics of the"Blue Book" and news items can be downloaded fromthe website, which can be found at"www.parismou.org".
7

Annual Report 2001
8
3. Looking ahead
Although the overall situation appears to be stable,Port State control results for 2001 indicate that effortsneed to be enhanced to substantially reduce thenumber of substandard ships visiting the region. ThePort State Control Committee is already lookingahead in order to anticipate new developments and totake concerted harmonised actions. Such actions needto enhance the effectiveness of the region incombating substandard shipping.
The Paris MOU Advisory Board (MAB) has consideredseveral policy issues of a political or strategic natureand will submit proposals to the Committee forconsideration.Actions agreed by the Committee during its 34thsession (2001) and 35th session (2002) are in theprocess of being implemented.
Concentrated Inspection Campaigns• On 1 July 2002 the Paris MOU will launch a
campaign on ISM compliance. All ships will besubject to this control, which is carried out in co-operation with the Tokyo MOU. There will be noexcuses accepted for non-compliance. Ships withoutproper certification will be banned from all MOUports until appropriate corrective measures have beentaken.
• A number of recent incidents on passenger shipstogether with longer term statistics have underlinedthe need for strict compliance with operationalstandards on board ship. New guidelines have beenadopted by the Committee and will provide a usefultool to establish whether the crew is able to respondeffectively to emergency situations on largepassenger ships. The Committee has adopted a CICfor Operational Safety on cruise ships starting in May2003.
Compliance with STCW requirementsFrom 1 February 2002 all ships will be inspected underthe new STCW95 requirements. Until 31 July letters ofwarning will be issued to ships with crew memberswithout proper certification.These ships are published on the web site and will beconsidered an overriding priority for inspection starting1 August 2002. If the certification of the crew is not inorder after this date the ship will be subject todetention.
Performance of classification societiesThe Committee will continue to monitor closely theperformance of classification societies.
Ships of QualityThe Committee will consider the introduction of areward system for a trial period for ships which have a good safety and port State control history. Other criteria will take account of the flag of the ship,which should not appear on the Black List, and theperformance record of its classification society. The potential reward for operators of quality ships is areduction in the inspection burden, while at the sametime enabling port State control Authorities to directtheir resources more effectively. A Task Force will be reporting to the next meeting ofthe Committee in 2003.
Recording of charterersIt has been recognized that charterers also play a rolein the chain of responsibility in maritime transport. If the only ships chartered are ships with a good safetyrecord there will be no market for sub-standard ships.The Paris MOU has decided therefore to record thecharterer of ships engaged in the transport of liquid orsolid bulk cargoes. As a next step the Committee mayconsider publishing the names of charterers ofdetained ships.
Review PanelA trial of the Review Panel will continue during 2002.Flag States or classification societies that cannotresolve a dispute concerning a detention with the portState may submit their case for review.The Review Panel is composed of representatives of 3different MOU Authorities on a rotating basis plus theSecretariat.
New amendments to the MOUNew amendments have been adopted to bring theParis MOU in line with the latest changes of the ECDirective on Port State Control (Erika 1 Package). Ships which fly the flag of a state on the Black Listmay be banned from the region after multipledetentions. The amendments will enter into force on22 July 2003.
Training of Port State Control OfficersThe Paris MOU has agreed to establish acomprehensive training programme starting in the fall of 2002. In order to establish a higher degree ofharmonisation and expertise the Authorities haveinvested substantial resources in regional training. This programme will be additional to the regularbiannual seminars for Port State Control Officers.
Annual Report 2001
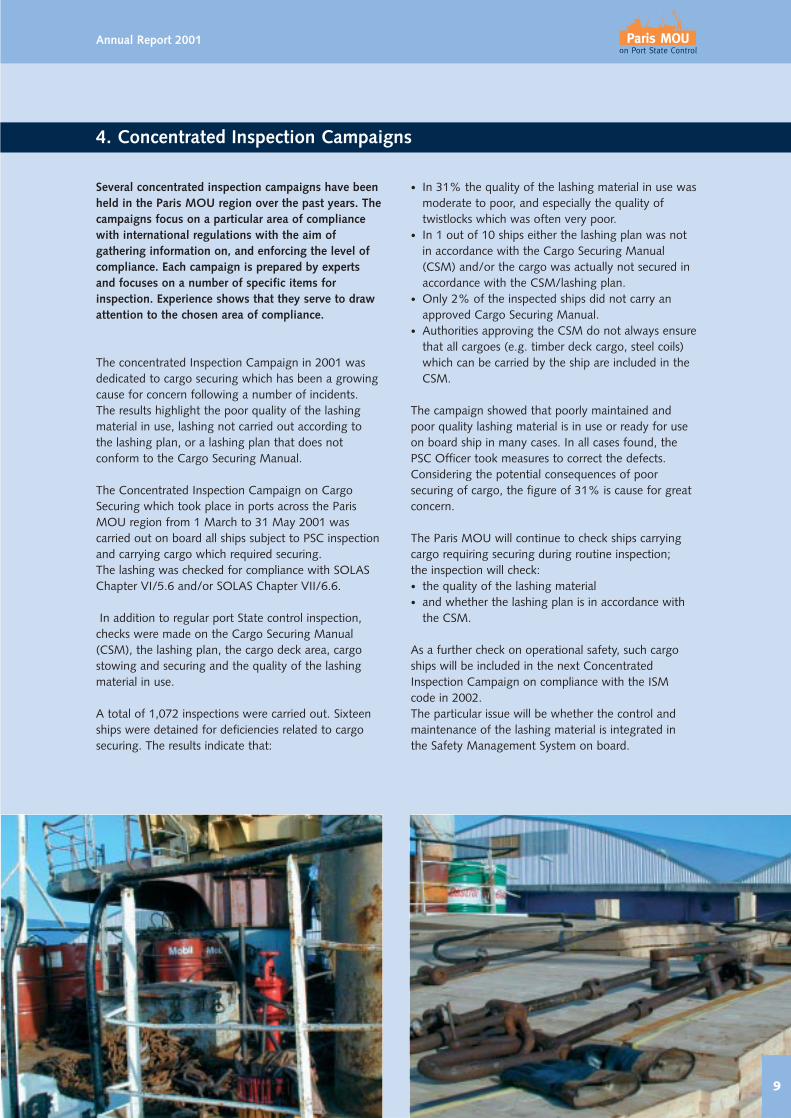
Several concentrated inspection campaigns have beenheld in the Paris MOU region over the past years. Thecampaigns focus on a particular area of compliancewith international regulations with the aim ofgathering information on, and enforcing the level ofcompliance. Each campaign is prepared by expertsand focuses on a number of specific items forinspection. Experience shows that they serve to drawattention to the chosen area of compliance.
The concentrated Inspection Campaign in 2001 wasdedicated to cargo securing which has been a growingcause for concern following a number of incidents. The results highlight the poor quality of the lashingmaterial in use, lashing not carried out according tothe lashing plan, or a lashing plan that does notconform to the Cargo Securing Manual.
The Concentrated Inspection Campaign on CargoSecuring which took place in ports across the ParisMOU region from 1 March to 31 May 2001 wascarried out on board all ships subject to PSC inspectionand carrying cargo which required securing. The lashing was checked for compliance with SOLASChapter VI/5.6 and/or SOLAS Chapter VII/6.6.
In addition to regular port State control inspection,checks were made on the Cargo Securing Manual(CSM), the lashing plan, the cargo deck area, cargostowing and securing and the quality of the lashingmaterial in use.
A total of 1,072 inspections were carried out. Sixteenships were detained for deficiencies related to cargosecuring. The results indicate that:
• In 31% the quality of the lashing material in use wasmoderate to poor, and especially the quality oftwistlocks which was often very poor.
• In 1 out of 10 ships either the lashing plan was notin accordance with the Cargo Securing Manual(CSM) and/or the cargo was actually not secured inaccordance with the CSM/lashing plan.
• Only 2% of the inspected ships did not carry anapproved Cargo Securing Manual.
• Authorities approving the CSM do not always ensurethat all cargoes (e.g. timber deck cargo, steel coils)which can be carried by the ship are included in theCSM.
The campaign showed that poorly maintained andpoor quality lashing material is in use or ready for useon board ship in many cases. In all cases found, thePSC Officer took measures to correct the defects.Considering the potential consequences of poorsecuring of cargo, the figure of 31% is cause for greatconcern.
The Paris MOU will continue to check ships carryingcargo requiring securing during routine inspection; the inspection will check: • the quality of the lashing material• and whether the lashing plan is in accordance with
the CSM.
As a further check on operational safety, such cargoships will be included in the next ConcentratedInspection Campaign on compliance with the ISMcode in 2002.The particular issue will be whether the control andmaintenance of the lashing material is integrated in the Safety Management System on board.
4. Concentrated Inspection Campaigns
9

Annual Report 2001
5. Membership of the Paris MOU
In preparation for prospective new members of theParis MOU, the Port State Control Committee hasadopted provisional criteria for co-operating status fornon-member States and observer status for newlydeveloped PSC regions.
Specific criteria, including a self-evaluation exercise,have to be met before co-operating status can begranted. Regional agreements seeking observer status mustdemonstrate that their member Authorities have anacceptable overall flag State record and have a similarapproach in terms of commitment and goals to that ofthe Paris MOU.
In 2000 the Committee considered a detailed selfevaluation prepared by the maritime Authorities ofSlovenia and decided unanimously that Sloveniashould be granted co-operating status. In April 2001 aMonitoring Team composed of representatives fromGreece, the United Kingdom and the Secretariat visitedSlovenia to determine whether the existing maritimesafety system is adequate and in line with theinformation provided on the questionnaire. The resultsof the visit, including recommendations, have been
considered and adopted by the Committee. It isanticipated that Slovenia will join the Memorandum asa full member in 2003.
The Committee has also considered a self evaluationby the maritime Authorities of Estonia and decidedunanimously to accept Estonia as a co-operatingmember. A Monitoring Team will visit Estonia in April2002.
10
Annual Report 2001
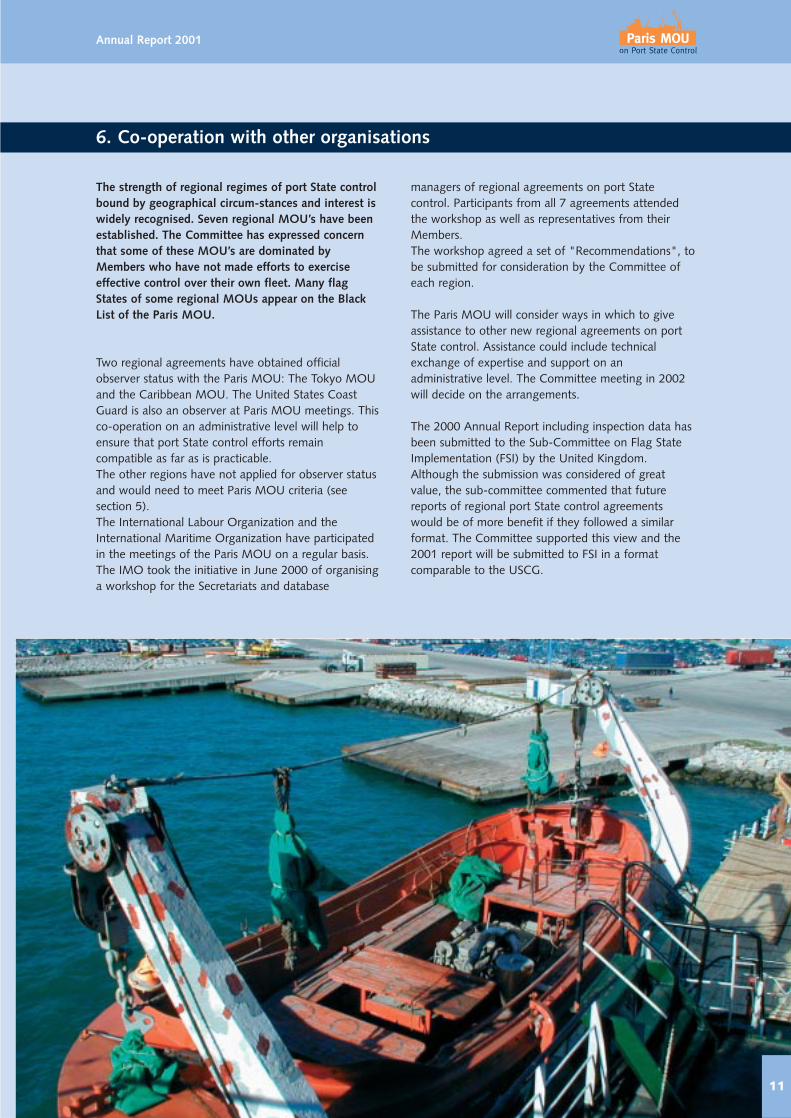
The strength of regional regimes of port State controlbound by geographical circum-stances and interest iswidely recognised. Seven regional MOU’s have beenestablished. The Committee has expressed concernthat some of these MOU’s are dominated byMembers who have not made efforts to exerciseeffective control over their own fleet. Many flagStates of some regional MOUs appear on the BlackList of the Paris MOU.
Two regional agreements have obtained officialobserver status with the Paris MOU: The Tokyo MOUand the Caribbean MOU. The United States CoastGuard is also an observer at Paris MOU meetings. Thisco-operation on an administrative level will help toensure that port State control efforts remaincompatible as far as is practicable. The other regions have not applied for observer statusand would need to meet Paris MOU criteria (seesection 5). The International Labour Organization and theInternational Maritime Organization have participatedin the meetings of the Paris MOU on a regular basis. The IMO took the initiative in June 2000 of organisinga workshop for the Secretariats and database
managers of regional agreements on port Statecontrol. Participants from all 7 agreements attendedthe workshop as well as representatives from theirMembers.The workshop agreed a set of "Recommendations", tobe submitted for consideration by the Committee ofeach region.
The Paris MOU will consider ways in which to giveassistance to other new regional agreements on portState control. Assistance could include technicalexchange of expertise and support on anadministrative level. The Committee meeting in 2002will decide on the arrangements.
The 2000 Annual Report including inspection data hasbeen submitted to the Sub-Committee on Flag StateImplementation (FSI) by the United Kingdom.Although the submission was considered of greatvalue, the sub-committee commented that futurereports of regional port State control agreementswould be of more benefit if they followed a similarformat. The Committee supported this view and the2001 report will be submitted to FSI in a formatcomparable to the USCG.
6. Co-operation with other organisations
11

12
Annual Report 2001
7. Facts and figures
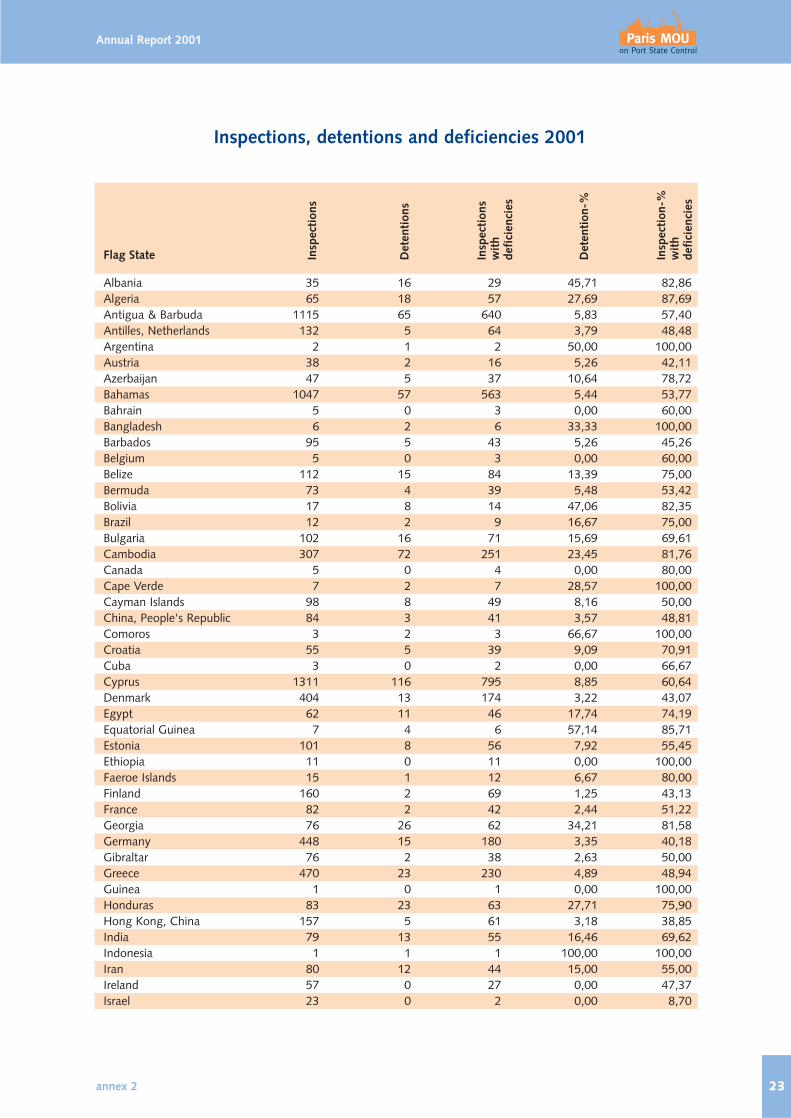
IntroductionDuring 2001, 18,681 inspections were carried out inthe Paris MOU region on 11,658 foreign shipsregistered in 107 different flag States. The number ofinspections is slightly higher than the inspectionfigure for 2000 (18,559), and overall the figuresappear to have stabilized.
The number of individual ships inspected in 2001,11,658, shows a moderate increase of 300 comparedwith the number inspected in 2000 (11,358). Over a 3year period this number has also levelled off, indicatingthat the Paris Memorandum has probably reached theceiling of ships qualifying for an inspection.
The overall inspection rate in the region was 27.3% in2001, compared with 28.6% in 2000, 27.6% in 1999and 26.5% in 1998. France, Germany, Ireland, theNetherlands and Sweden did not reach the 25%inspection commitment of the Memorandum.A chart showing the individual efforts of Paris MOUmembers is included in the statistical annexes to thisAnnual Report.
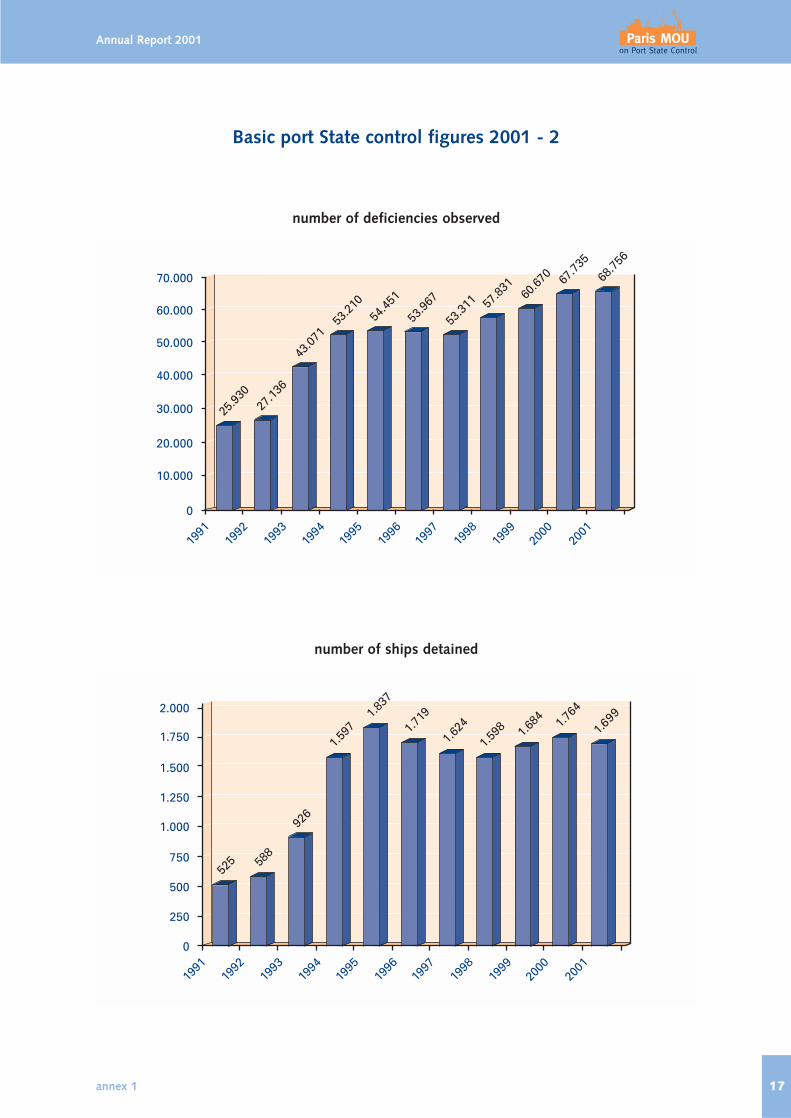
DetentionsDetention rates are expressed as a percentage of thenumber of inspections, rather than the number ofindividual ships inspected. The change was introducedin 1999 to take account of the fact that many shipshave been detained more than once during any oneyear. The number of ships detained in 2001 for deficienciesclearly hazardous to safety, health or the environmentamounted to 1,699. It compares with the number of1,764 detained in 2000, 1,684 in 1999, and 1,598 in1998. The slight decrease of 65 ships compared to2000, has reduced the average detention percentageto 9.09% in 2001, compared with 9.50% in 2000,9.15% in 1999 and 9.06% in 1998.
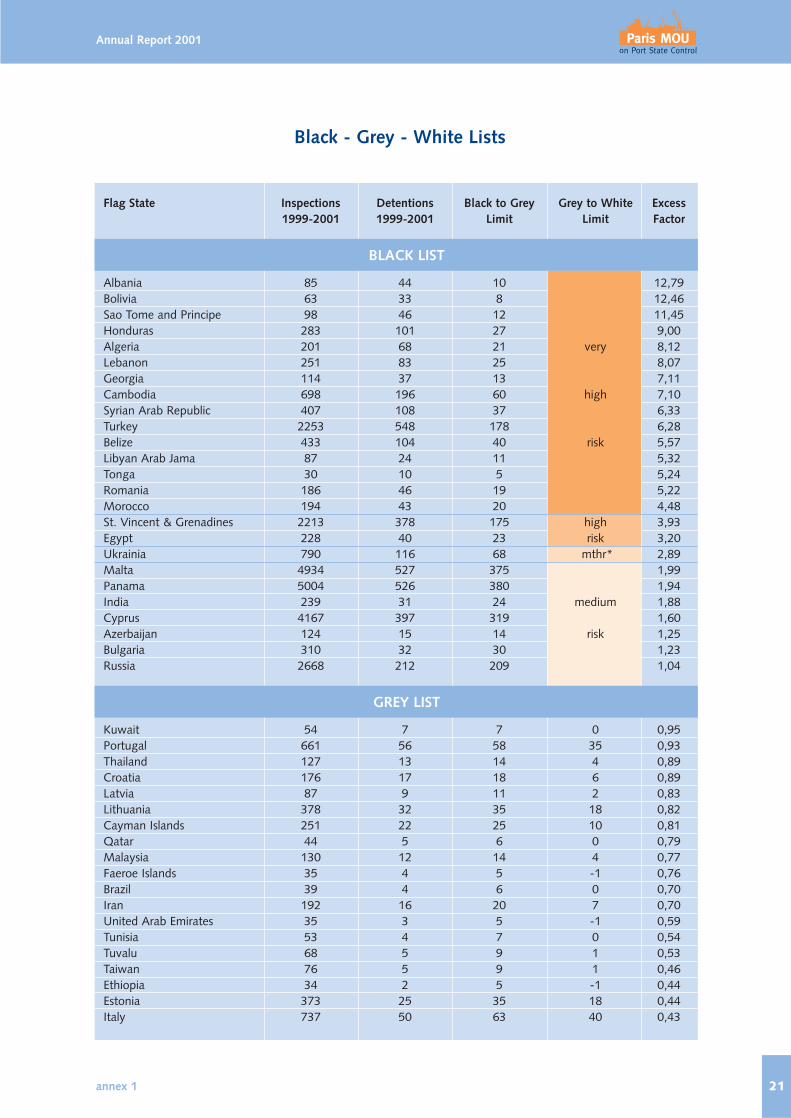
"Black, Grey and White List"In the 1999 Annual Report the traditional "black list"of flags was replaced by a "Black, Grey and WhiteList". The tables are still based on performance over a3-year rolling period but now indicate the fullspectrum between quality flags and flags with a poorperformance which are considered a high or very highrisk.
Again, a "hard core" of flag States appear on the"Black List". Most flags which were considered "very
high risk" in 2000 remain so in 2001. The poorestperforming flags are still Albania, Bolivia, Sao Tome &Principe and Honduras."Newcomer" in the category of very high risk is Tonga. Flags which have moved from the "Grey List" to the"Black List" are India, Azerbaijan and Bulgaria.
On a more positive note: Thailand, Croatia, Latvia,Lithuania and the Faeroe Islands have moved downfrom the "Black List" to the upper levels of the "GreyList" and will hopefully continue this trend.
The "White List" represents quality flags with aconsistently low detention record. The Paris MOUflags of the United Kingdom, Finland, Sweden,Denmark and Germany are placed highest in terms ofperformance. The Republic of Korea and the UnitedStates of America have moved down to the "GreyList".New to the "White List" are Poland, Greece, theBahamas, Hong Kong and Israel.

Flag States with an average performance are shown onthe "Grey List". Their appearance on this list may actas an incentive to improve and move to the "WhiteList". At the same time flags at the lower end of the"Grey List" should be careful not to neglect controlover their ships and risk ending up on the "Black List"next year.
There are signs that several flags appearing on the"White List" now use their ranking to advertisethemselves as quality registers and are making effortsto reach a higher ranking the following year.
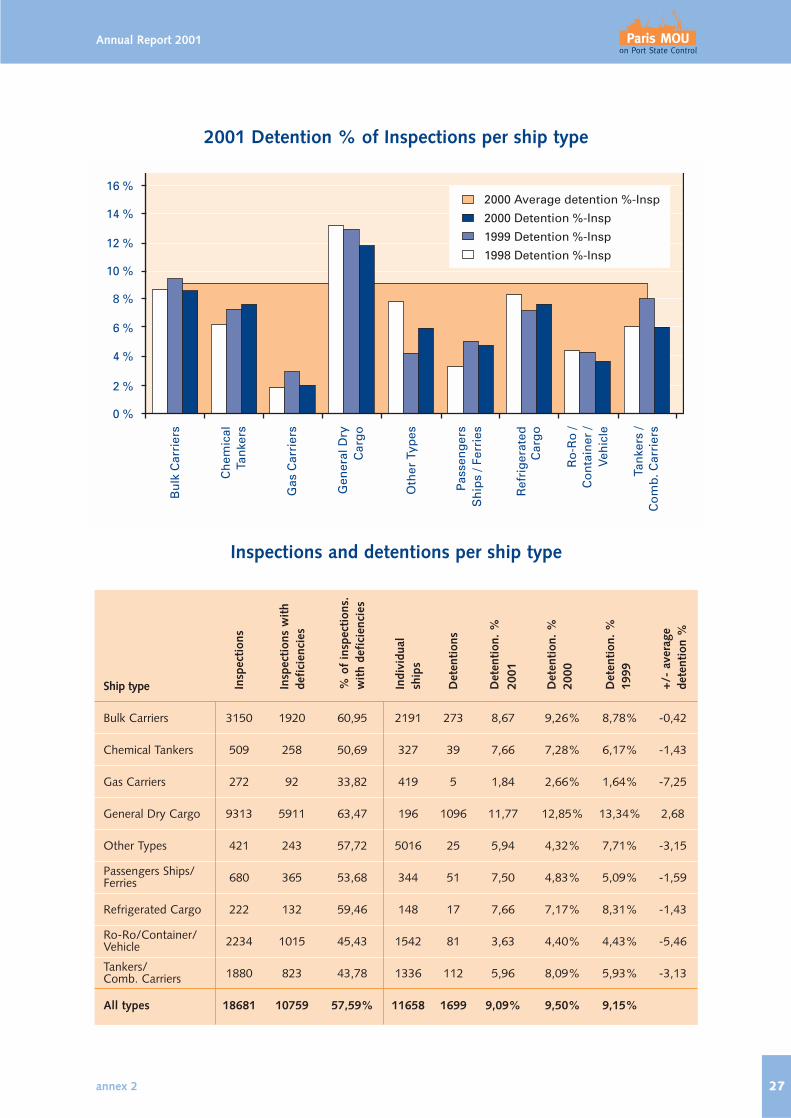
Ship TypesLooking at detentions by ship type over several years,it is noted that general dry cargo ships and bulkcarriers still account for over 80% of all detentions, atrend which is still rising.
This year’s detention percentage showed a significantrise in detentions of passenger ships. During 2001 a total of 680 inspections took place onpassenger ships, of which 54% showed deficiencies.Since 1998 the detention percentage has more thandoubled from 3.2% to 7.5% (51 detentions in 2001).Statistical annexes to this report show the detentionpercentage for each ship type in 2001, 2000 and1999.
Banning of ShipsAt the end of 2001 a total of 19 ships were bannedfrom the Paris MOU region, because they failed to callat an agreed repair yard (9), jumped detentions (8) orwere not certified in accordance with the ISM Code(2). During the year 6 ships were placed under thebanning measures, the remaining ships were banned inprevious years.By the end of 2001 the ban had been lifted on 3 shipsafter verification that all deficiencies had been rectified. An up-to-date list of banned ships can be found onthe internet site of the Paris MOU on Port StateControl.
Performance of Classification SocietiesDetails of the responsibility of classification societies fordetainable deficiencies have been published since1999. When one or more detainable deficiencies areattributed to a classification society in accordance withthe criteria it is recorded and class is informed. Out of1,699 detentions recorded in 2001, 22% (380) wereconsidered class related, the same percentage as in2000. When considering the rate of class related detentionsas a percentage of inspections in 2001, theInternational Register of Shipping (U.S.A.) 43.8%,
Register of Shipping (Albania) 36.4%, HondurasInternational Naval Survey and Inspection Bureau23.5%, Panama Register Corporation 18.2% andRomanian Naval Register 14.5% scored highest asindicated in Model 2 in the Statistical Annex.
DeficienciesA total of 68,756 deficiencies were recorded duringport State control inspections in 2001, only a slightincrease (1.5%) on the number of 67,735 recorded in2000 (60,670 in 1999).With some exceptions, ships older than 15 years show
substantially more deficiencies than ships of less than 5years.The trends in key safety areas are shown below. Moredetailed information may be found in the statisticalpublication of the Paris MOU, the 2001 Blue Book.
SafetyIn 2001, deficiencies in vital safety areas such as lifesaving appliances, fire fighting equipment, safety ingeneral and navigation accounted for 53% of the totalnumber of deficiencies.Deficiencies in these areas increased by 8% from33,542 in 1999 to 36,329 in 2001.Older ships (≥ 15 years) show 29,592 deficiencies,compared to younger ships (< 5 years) with 1,549deficiencies, a rate 19 times higher.
Marine environmentMARPOL73/78 Annex I, II, III and V deficiencies haveincreased by 18%, from 5,011 in 1999 to 5,930 in2001.
Annual Report 2001
13

In 2001 older ships (≥ 15 years) show 4,564deficiencies, compared to younger ships (< 5 years)with 404 deficiencies, a deficiency rate 11 timeshigher.
Working and living conditionsMajor categories related to working and livingconditions are "crew and accommodation", "food and catering", "working places" and "accidentprevention". Deficiencies in these areas increased by13%, from 4,686 in 1999 to 5,278 in 2001. In 2001 older ships (≥ 15 years) show 4,555deficiencies, compared to younger ships (< 5 years)with 138 deficiencies, a deficiency rate 33 timeshigher.
Certification of crewCompliance with the standards for training,certification and watch keeping for seafarers indicatedan increase of 6%, from 1,232 in 1999 to 1,302 in2001.Older ships (≥ 15 years) show 1,069 deficiencies in2001, compared to younger ships (< 5 years) with 81deficiencies, a deficiency rate 13 times higher.
OperationalAlthough MARPOL operational deficiencies havedropped substantially, SOLAS related operational
deficiencies have steadily increased from 975 in 1999to 1262 deficiencies in 2001 (29%). A trend that wasobserved last year with concern.In 2001 older ships (≥ 15 years) show 1,307deficiencies, compared to younger ships (< 5 years)with 114 deficiencies, a rate 11 times higher.
ManagementThe International Safety Management Code came intoforce for certain categories of ships from 1 July 1998.In the year under review 1,239 (major) non-conformities were recorded, an increase of nearly150% when compared with the 1999 results. These figures are alarming, since they provide a clearindication that management systems are not workingfor certain ships.
Older ships (≥ 15 years) show 994 (major) non-conformities, compared to younger ships (< 5 years)with 73 (major) non-conformities, a rate 14 timeshigher.Most prominent are older bulk carriers (≥ 15 years),which score a non-conformity rate 37 times higherthan younger ships (< 5 years). Other ship types ofover 15 years show lower rates, although ISMcompliance of older tankers and passenger shipsshould be closely monitored.
Annual Report 2001
14

Annual Report 2001
15
Statistical Annexes tothe Annual Report 2001

16 annex 1
Annual Report 2001
number of inspections
Basic port State control figures 2001 - 1
number of individual ships inspected
Annual Report 2001
17annex 1
number of ships detained
Basic port State control figures 2001 - 2
number of deficiencies observed

18 annex 1
Annual Report 2001
Basic port State control figures 2001 - 3
detentions in % of inspections

Annual Report 2001
19annex 1
Inspection efforts - 1
Inspection efforts of members compared to target
20 annex 1
Annual Report 2001
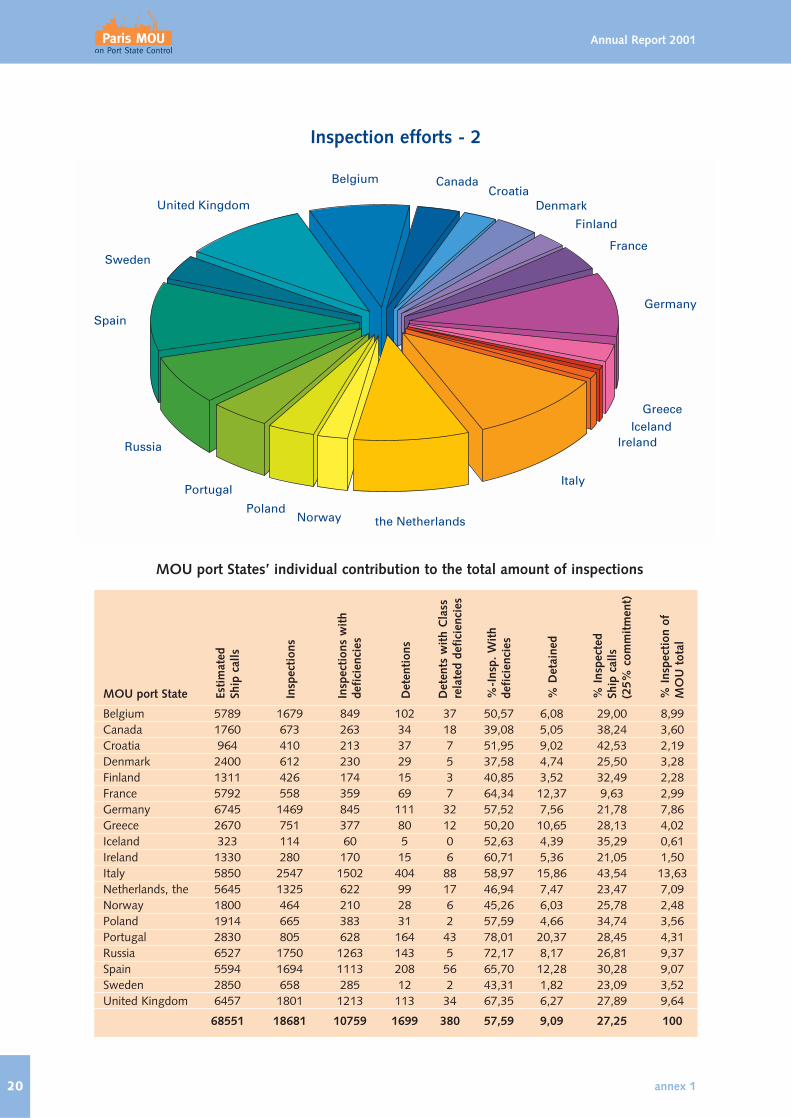
Inspection efforts - 2
MOU port States’ individual contribution to the total amount of inspections
MOU port State
Belgium 5789 1679 849 102 37 50,57 6,08 29,00 8,99Canada 1760 673 263 34 18 39,08 5,05 38,24 3,60Croatia 964 410 213 37 7 51,95 9,02 42,53 2,19Denmark 2400 612 230 29 5 37,58 4,74 25,50 3,28Finland 1311 426 174 15 3 40,85 3,52 32,49 2,28France 5792 558 359 69 7 64,34 12,37 9,63 2,99Germany 6745 1469 845 111 32 57,52 7,56 21,78 7,86Greece 2670 751 377 80 12 50,20 10,65 28,13 4,02Iceland 323 114 60 5 0 52,63 4,39 35,29 0,61Ireland 1330 280 170 15 6 60,71 5,36 21,05 1,50Italy 5850 2547 1502 404 88 58,97 15,86 43,54 13,63Netherlands, the 5645 1325 622 99 17 46,94 7,47 23,47 7,09Norway 1800 464 210 28 6 45,26 6,03 25,78 2,48Poland 1914 665 383 31 2 57,59 4,66 34,74 3,56Portugal 2830 805 628 164 43 78,01 20,37 28,45 4,31Russia 6527 1750 1263 143 5 72,17 8,17 26,81 9,37Spain 5594 1694 1113 208 56 65,70 12,28 30,28 9,07Sweden 2850 658 285 12 2 43,31 1,82 23,09 3,52United Kingdom 6457 1801 1213 113 34 67,35 6,27 27,89 9,64
68551 18681 10759 1699 380 57,59 9,09 27,25 100
Esti
mat
edSh
ip c
alls
Insp
ecti
ons
Insp
ecti
ons
wit
hde
fici
enci
es
Det
enti
ons
Det
ents
wit
h C
lass
rela
ted
defi
cien
cies
%-I
nsp.
Wit
hde
fici
enci
es
% D
etai
ned
% I
nspe
cted
Ship
cal
ls(2
5% c
omm
itm
ent)
% I
nspe
ctio
n of
MO
U t
otal
Annual Report 2001
21annex 1
Black - Grey - White Lists
Flag State Inspections Detentions Black to Grey Grey to White Excess1999-2001 1999-2001 Limit Limit Factor
BLACK LIST
Albania 85 44 10 12,79Bolivia 63 33 8 12,46Sao Tome and Principe 98 46 12 11,45Honduras 283 101 27 9,00Algeria 201 68 21 very 8,12Lebanon 251 83 25 8,07Georgia 114 37 13 7,11Cambodia 698 196 60 high 7,10Syrian Arab Republic 407 108 37 6,33Turkey 2253 548 178 6,28Belize 433 104 40 risk 5,57Libyan Arab Jama 87 24 11 5,32Tonga 30 10 5 5,24Romania 186 46 19 5,22Morocco 194 43 20 4,48St. Vincent & Grenadines 2213 378 175 high 3,93Egypt 228 40 23 risk 3,20Ukrainia 790 116 68 mthr* 2,89Malta 4934 527 375 1,99Panama 5004 526 380 1,94India 239 31 24 medium 1,88Cyprus 4167 397 319 1,60Azerbaijan 124 15 14 risk 1,25Bulgaria 310 32 30 1,23Russia 2668 212 209 1,04
GREY LIST
Kuwait 54 7 7 0 0,95Portugal 661 56 58 35 0,93Thailand 127 13 14 4 0,89Croatia 176 17 18 6 0,89Latvia 87 9 11 2 0,83Lithuania 378 32 35 18 0,82Cayman Islands 251 22 25 10 0,81Qatar 44 5 6 0 0,79Malaysia 130 12 14 4 0,77Faeroe Islands 35 4 5 -1 0,76Brazil 39 4 6 0 0,70Iran 192 16 20 7 0,70United Arab Emirates 35 3 5 -1 0,59Tunisia 53 4 7 0 0,54Tuvalu 68 5 9 1 0,53Taiwan 76 5 9 1 0,46Ethiopia 34 2 5 -1 0,44Estonia 373 25 35 18 0,44Italy 737 50 63 40 0,43

22 annex 1
Annual Report 2001
Flag State Inspections Detentions Black to Grey Grey to White Excess1999-2001 1999-2001 Limit Limit Factor
GREY LIST
Gibraltar 126 8 14 4 0,42Saudi Arabia 81 4 10 1 0,30Antilles, Netherlands 322 18 31 15 0,22Korea, Republic of 95 4 11 2 0,21Vanuatu 120 5 13 3 0,17Philippines 250 12 25 10 0,11Spain 150 6 16 5 0,10U.S.A. 141 5 15 4 0,06
WHITE LIST
Barbados 266 11 11 -0,04Poland 285 12 12 -0,05Greece 1409 77 82 -0,14Bahamas 3164 184 197 -0,15Marshall Islands 413 18 20 -0,18Hong Kong, China 382 16 18 -0,21Antigua and Barbuda 3005 161 187 -0,30Austria 134 3 4 -0,35Japan 86 1 2 -0,37Bermuda 203 6 8 -0,37Luxemburg 162 4 5 -0,41Singapore 652 27 34 -0,43China, People's Republic 319 10 14 -0,55Man, Isle of 465 15 23 -0,68Liberia 2659 108 164 -0,75Israel 75 0 1 -0,79Norway 2665 97 164 -0,90France 289 6 13 -0,94Ireland 198 3 7 -0,97Netherlands, the 2617 84 161 -1,05Germany 1609 48 95 -1,07Denmark 1327 38 77 -1,08Sweden 821 16 45 -1,35Finland 506 6 25 -1,56United Kingdom 644 6 34 -1,72
* mthr = medium to high risk
* Explanatory note on page 32
Inspections, detentions and deficiencies 2001
Flag State
Albania 35 16 29 45,71 82,86Algeria 65 18 57 27,69 87,69Antigua & Barbuda 1115 65 640 5,83 57,40Antilles, Netherlands 132 5 64 3,79 48,48Argentina 2 1 2 50,00 100,00Austria 38 2 16 5,26 42,11Azerbaijan 47 5 37 10,64 78,72Bahamas 1047 57 563 5,44 53,77Bahrain 5 0 3 0,00 60,00Bangladesh 6 2 6 33,33 100,00Barbados 95 5 43 5,26 45,26Belgium 5 0 3 0,00 60,00Belize 112 15 84 13,39 75,00Bermuda 73 4 39 5,48 53,42Bolivia 17 8 14 47,06 82,35Brazil 12 2 9 16,67 75,00Bulgaria 102 16 71 15,69 69,61Cambodia 307 72 251 23,45 81,76Canada 5 0 4 0,00 80,00Cape Verde 7 2 7 28,57 100,00Cayman Islands 98 8 49 8,16 50,00China, People's Republic 84 3 41 3,57 48,81Comoros 3 2 3 66,67 100,00Croatia 55 5 39 9,09 70,91Cuba 3 0 2 0,00 66,67Cyprus 1311 116 795 8,85 60,64Denmark 404 13 174 3,22 43,07Egypt 62 11 46 17,74 74,19Equatorial Guinea 7 4 6 57,14 85,71Estonia 101 8 56 7,92 55,45Ethiopia 11 0 11 0,00 100,00Faeroe Islands 15 1 12 6,67 80,00Finland 160 2 69 1,25 43,13France 82 2 42 2,44 51,22Georgia 76 26 62 34,21 81,58Germany 448 15 180 3,35 40,18Gibraltar 76 2 38 2,63 50,00Greece 470 23 230 4,89 48,94Guinea 1 0 1 0,00 100,00Honduras 83 23 63 27,71 75,90Hong Kong, China 157 5 61 3,18 38,85India 79 13 55 16,46 69,62Indonesia 1 1 1 100,00 100,00Iran 80 12 44 15,00 55,00Ireland 57 0 27 0,00 47,37Israel 23 0 2 0,00 8,70
Annual Report 2001
23annex 2
Insp
ecti
ons
Det
enti
ons
Insp
ecti
ons
wit
hde
fici
enci
es
Det
enti
on-%
Insp
ecti
on-%
wit
hde
fici
enci
es

24 annex 2
Annual Report 2001
Insp
ecti
ons
Det
enti
ons
Insp
ecti
ons
wit
hde
fici
enci
es
Det
enti
on-%
Insp
ecti
on-%
wit
hde
fici
enci
es
Inspections, detentions and deficiencies 2001
Flag State
Italy 243 13 105 5,35 43,21Japan 27 0 7 0,00 25,93Kampuchea, Republic of 2 1 2 50,00 100,00Kazakhstan 1 0 1 0,00 100,00Korea, Republic of 31 3 17 9,68 54,84Korea, Democratic People’s Rep. 5 3 4 60,00 80,00Kuwait 15 2 9 13,33 60,00Latvia 20 1 10 5,00 50,00Lebanon 91 32 81 35,16 89,01Liberia 842 25 378 2,97 44,89Libyan Arab Jama 21 3 15 14,29 71,43Lithuania 135 10 101 7,41 74,81Luxemburg 61 2 26 3,28 42,62Malaysia 45 3 30 6,67 66,67Malta 1603 152 985 9,48 61,45Man, Isle of 162 4 70 2,47 43,21Marshall Islands 176 9 79 5,11 44,89Mauritius 4 0 2 0,00 50,00Mexico 1 0 1 0,00 100,00Moldavia 1 0 1 0,00 100,00Morocco 80 22 71 27,50 88,75Myanmar, Union of 12 0 7 0,00 58,33Netherlands 945 23 443 2,43 46,88Nigeria 3 3 3 100,00 100,00Norway 823 32 384 3,89 46,66Pakistan 8 2 6 25,00 75,00Panama 1714 177 1016 10,33 59,28Philippines 63 1 42 1,59 66,67Poland 63 1 30 1,59 47,62Portugal 218 15 127 6,88 58,26Qatar 11 1 9 9,09 81,82Register Withdrawn 4 2 3 50,00 75,00Romania 68 16 52 23,53 76,47Russia 865 65 475 7,51 54,91Sao Tome and Principe 65 30 63 46,15 96,92Saudi Arabia 26 0 15 0,00 57,69Singapore 193 12 91 6,22 47,15South Africa 2 0 1 0,00 50,00Spain 56 1 29 1,79 51,79St. Vincent & Grenadines 786 136 560 17,30 71,25Sudan 1 0 1 0,00 100,00Sweden 258 5 101 1,94 39,15Switzerland 19 0 3 0,00 15,79Syrian Arab Republic 149 30 132 20,13 88,59Taiwan 18 1 10 5,56 55,56Tanzania, United Republic 1 1 1 100,00 100,00

Annual Report 2001
25annex 2
Insp
ecti
ons
Det
enti
ons
Insp
ecti
ons
wit
hde
fici
enci
es
Det
enti
on-%
Insp
ecti
on-%
wit
hde
fici
enci
es
Inspections, detentions and deficiencies 2001
Flag State
Thailand 36 0 25 0,00 69,44Togo 1 1 1 100,00 100,00Tonga 30 10 23 33,33 76,67Tunisia 10 1 8 10,00 80,00Turkey 862 212 694 24,59 80,51Turkmenistan 5 2 5 40,00 100,00Tuvalu 21 2 16 9,52 76,19U.S.A. 32 1 18 3,13 56,25Ukrainia 256 38 187 14,84 73,05United Arab Emirates 14 1 6 7,14 42,86United Kingdom 248 0 97 0,00 39,11Vanuatu 49 2 24 4,08 48,98Viet Nam 3 0 2 0,00 66,67Yugoslavia 3 0 3 0,00 100,00
Totals and averages 18681 1699 10759 9,09% 57,59%

2001 detentions per flag State, exeeding average percentage
• Only flags with more than 20 port State control inspections in 2001 are recorded in this table and the graph on the next page
• The light area at the bottom of the graph repesents the 2001 average detention percentage (9,09%)
26 annex 2
Annual Report 2001
Flag Inspections Detentions Detentions % Excess of average
Sao Tome and Principe 65 30 46,15 37,06Albania 35 16 45,71 36,62Lebanon 91 32 35,16 26,07Georgia 76 26 34,21 25,12Tonga 30 10 33,33 24,24Honduras 83 23 27,71 18,62Algeria 65 18 27,69 18,60Morocco 80 22 27,50 18,41Turkey 862 212 24,59 15,50Romania 68 16 23,53 14,44Cambodia 307 72 23,45 14,36Syrian Arab Republic 149 30 20,13 11,04Egypt 62 11 17,74 8,65St. Vincent & Grenadines 786 136 17,30 8,21India 79 13 16,46 7,37Bulgaria 102 16 15,69 6,60Iran 80 12 15,00 5,91Ukrainia 256 38 14,84 5,75Libyan Arab Jama 21 3 14,29 5,20Belize 112 15 13,39 4,30Azerbaijan 47 5 10,64 1,55Panama 1714 177 10,33 1,24Korea, Republic of 31 3 9,68 0,59Tuvalu 21 2 9,52 0,43Malta 1603 152 9,48 0,39
2001 Detention % of Inspections per ship type
Inspections and detentions per ship type
Annual Report 2001
27annex 2
Ship type
Bulk Carriers 3150 1920 60,95 2191 273 8,67 9,26% 8,78% -0,42
Chemical Tankers 509 258 50,69 327 39 7,66 7,28% 6,17% -1,43
Gas Carriers 272 92 33,82 419 5 1,84 2,66% 1,64% -7,25
General Dry Cargo 9313 5911 63,47 196 1096 11,77 12,85% 13,34% 2,68
Other Types 421 243 57,72 5016 25 5,94 4,32% 7,71% -3,15
Passengers Ships/ 680 365 53,68 344 51 7,50 4,83% 5,09% -1,59Ferries
Refrigerated Cargo 222 132 59,46 148 17 7,66 7,17% 8,31% -1,43
Ro-Ro/Container/ 2234 1015 45,43 1542 81 3,63 4,40% 4,43% -5,46Vehicle
Tankers/ 1880 823 43,78 1336 112 5,96 8,09% 5,93% -3,13Comb. Carriers
All types 18681 10759 57,59% 11658 1699 9,09% 9,50% 9,15%
Insp
ecti
ons
Insp
ecti
ons
wit
hde
fici
enci
es
% o
f in
spec
tion
s.w
ith
defi
cien
cies
Indi
vidu
alsh
ips
Det
enti
ons
Det
enti
on.
%20
01
Det
enti
on.
%20
00
Det
enti
on.
%19
99
+/-
ave
rage
dete
ntio
n %

28 annex 3
Annual Report 2001
Major categories of deficiencies in relation to inspections/ship
NUMBER OF DEF. IN % OF ratio of def. ratio of def. toDEFICIENCIES TOTAL NUMBER To inspections x 100 indiv. ships x 100
1999 2000 2001 1999 2000 2001 1999 2000 2001 1999 2000 2001
Ship's certificates and3596 3465 3581 5,9% 5,1% 5,2% 19,5% 18,8% 19,2% 32,0% 30,8% 30,7%documents
Training certification and1232 1179 1302 2,0% 1,7% 1,9% 6,7% 6,4% 7,0% 11,0% 10,5% 11,2%
watchkeeping for seafarers
Crew and Accommodation1889 1963 2113 3,1% 2,9% 3,1% 10,3% 10,7% 11,3% 16,8% 17,5% 18,1%(ILO 147)
Food and catering 954 1031 876 1,6% 1,5% 1,3% 5,2% 5,6% 4,7% 8,5% 9,2% 7,5%(ILO 147)
Working space507 678 703 0,8% 1,0% 1,0% 2,8% 3,7% 3,8% 4,5% 6,0% 6,0%(ILO 147)
Life saving appliances 10882 10942 10516 17,9% 16,2% 15,3% 59,1% 59,5% 56,3% 96,7% 97,3% 90,2%
Fire Safety measures 8052 8789 8547 13,3% 13,0% 12,4% 43,8% 47,8% 45,8% 71,6% 78,1% 73,3%
Accident prevention 1336 1506 1586 2,2% 2,2% 2,3% 7,3% 8,2% 8,5% 11,9% 13,4% 13,6%(ILO147)
Safety in general 7965 9243 8951 13,1% 13,7% 13,0% 43,3% 50,2% 47,9% 70,8% 82,2% 76,8%
Alarm – signals 292 330 326 0,5% 0,5% 0,5% 1,6% 1,8% 1,7% 2,6% 2,9% 2,8%
Carriage of cargo722 836 1323 1,2% 1,2% 1,9% 3,9% 4,5% 7,1% 6,4% 7,4% 11,3%and dangerous goods
Load lines 3308 3816 3906 5,5% 5,6% 5,7% 18,0% 20,7% 20,9% 29,4% 33,9% 33,5%
Mooring arrangements603 878 1109 1,0% 1,3% 1,6% 3,3% 4,8% 5,9% 5,4% 7,8% 9,5%(ILO 147)
Propulsion & aux machinery 2966 3671 3713 4,9% 5,4% 5,4% 16,1% 20,0% 19,9% 26,4% 32,6% 31,8%
Safety of navigation 6643 8055 8315 10,9% 11,9% 12,1% 36,1% 43,8% 44,5% 59,1% 71,6% 71,3%
Radio communication 2439 2638 2703 4,0% 3,9% 3,9% 13,3% 14,3% 14,5% 21,7% 23,5% 23,2%
MARPOL - annex I 4276 4875 5116 7,0% 7,2% 7,4% 23,2% 26,5% 27,4% 38,0% 43,3% 43,9%
Oil tankers, chemical151 212 151 0,2% 0,3% 0,2% 0,8% 1,2% 0,8% 1,3% 1,9% 1,3%tankers and gas carriers
MARPOL - annex II 67 71 43 0,1% 0,1% 0,1% 0,4% 0,4% 0,2% 0,6% 0,6% 0,4%
SOLAS related operational 975 1132 1262 1,6% 1,7% 1,8% 5,3% 6,2% 6,8% 8,7% 10,1% 10,8%deficiencies
MARPOL related 558 618 456 0,9% 0,9% 0,7% 3,0% 3,4% 2,4%5 5,0% 5,5% 3,9%operational deficiencies
MARPOL - annex III 36 31 13 0,1% 0,0% 0,0% 0,2% 0,2% 0,1% 0,3% 0,3% 0,1%
MARPOL - annex V 632 742 758 1,0% 1,1% 1,1% 3,4% 4,0% 4,1% 5,6% 6,6% 6,5%

Annual Report 2001
29annex 3
NUMBER OF DEF. IN % OF ratio of def. ratio of def. toDEFICIENCIES TOTAL NUMBER To inspections x 100 indiv. ships x 100
1999 2000 2001 1999 2000 2001 1999 2000 2001 1999 2000 2001
ISM 498 929 1239 0,8% 1,4% 1,8% 2,7% 5,0% 6,6% 4,4% 8,3% 10,6%
Bulks carriers - 9 50 0,0% 0,1% 0,0% 0,3% 0,1% 0,4%Additional safety measures
Other def. clearly 41 44 33 0,1% 0,1% 0,1% 0,2% 0,2% 0,2% 0,4% 0,4% 0,3%hazardous safety
Other def. not 50 52 65 0,1% 0,1% 0,1% 0,3% 0,3% 0,3% 0,4% 0,5% 0,6%clearly hazardous
TOTAL 60670 67735 68756

Model 1 - Detentions with class related detainable deficiencies in % of
total number of detentions (per classification society)
Classification Society
No Class Recorded 94 18 82 19,15 % -3,22 %
Class Withdrawn 80 19 75 23,75 % 1,38 %
Class Not Specified 77 30 61 38,96 % 16,59 %
American Bureau of Shipping ABS 106 23 90 21,70 % -0,67 %
Biro Klasifikasi Indonesia BKI 1 1 1 100,00 % 77,63 %
Bulgarski Koraben Registar BKR 26 11 25 42,31 % 19,94 %
Bureau Veritas (France) BV 199 32 175 16,08 % -6,29 %
Ceskoslovensky Lodin Register (Czechosl.) CS - - -
China Classification Society CCS 8 3 8 37,50 % 15,13 %
China Corporation Register of Shipping CCRS 1 0 1 0,00 % -22,37 %
Croatian Register of Shipping CRS 15 5 14 33,33 % 10,97 %
Cyprus Bureau of Shipping CBS - - -
Det Norske Veritas (Norway) DNVC 89 20 83 22,47 % 0,11 %
Fidenavis Sa (Spain) 1 0 1 0,00 % -22,37 %
Germanischer Lloyd GL 190 16 180 8,42 % -13,95 %
Hellenic Register of Shipping (Greece) HRS 44 8 36 18,18 % -4,18 %
Honduras Inter. Naval Surve. And Insp. Bur. HINSIB 6 4 4 66,67 % 44,30 %
Inclamar (Cyprus) INC 12 5 9 41,67 % 19,30 %
Indian Register of Shipping IRS 5 0 4 0,00 % -22,37 %
International Naval Surveys Bureau (Greece) INSB 40 11 25 27,50 % 5,13 %
International Register of Shipping (USA) IS 10 7 8 70,00 % 47,63 %
Isthmus Bureau Shipping Classification Div (Panama) IBS 5 4 5 80,00 % 57,63 %
Korean Register of Shipping (South Korea) KRS 20 7 15 35,00 % 12,63 %
Lloyd's Register of Shipping (U.K.) LRS 207 50 178 24,15 % 1,79 %
Nippon Kaiji Kyokai (Japan) NKK 89 24 80 26,97 % 4,60 %
Panama Maritime Surveyors Bureau Inc PMSB 4 2 2 50,00 % 27,63 %
Panama Register Corporation PRC 3 2 2 66,67 % 44,30 %
Polski Rejestr Statkow (Poland) PRS 40 9 34 22,50 % 0,13 %
Register of Shipping (Albania) RS 6 4 6 66,67 % 44,30 %
Register of Shipping People's R.C. (China) - - -
Registri Laknori Shqiptar (Iceland) RLS 1 1 1 100,00 % 77,63 %
Registro Cubano De Buques (Cuba) RCB 2 1 1 50,00 % 27,63 %
Registro Italiano Navale RINA 56 11 53 19,64 % -2,72 %
RINAVE Portuguesa RP 4 0 4 0,00 % -22,37 %
Romanian Naval Register RNR 18 10 14 55,56 % 33,19 %
Russian Maritime Register of Shipping RMRS 143 24 127 16,78 % -5,58 %
Russian River Register RR 21 7 21 33,33 % 10,97 %
Turkisch Lloyd TL 76 11 55 14,47 % -7,89 %
Vietnam Register of Shipping VRS - - -
*) The information contained in the statistical material of Models 1-4 concerning classification societies were collected during the
calendar year 2001 on the basis of provisional criteria for the assessment of class responsibility. Due to updating anomalies the
figures may include a small margin of error. This margin is not greater than 1,5 percent to either side.
30 annex 4
Annual Report 2001
Tota
l nu
mbe
r of
dete
ntio
ns
+/-
Per
cent
age
Ave
rage
Det
enti
ons
wit
hcl
ass
rela
ted
defi
cien
cies
Num
ber
of
indi
vidu
al s
hips
Perc
enta
geD
eten
tion
s w
ith
clas
s re
late
d de
fici
enci
es

Model 2 - Detentions of ships with class related detainable deficiencies
per Classification Society (Cases in which more than 10 inspections are involved)
Classification Society
No Class Recorded 930 698 18 1,94 % -0,05 % 2,58 % -0,60 %
Class Withdrawn 370 279 19 5,14 % 3,15 % 6,81 % 3,63 %
Class Not Specified 219 136 30 13,70 % 11,71 % 22,06 % 18,88 %
American Bureau of Shipping ABS 1116 746 23 2,06 % 0,07 % 3,08 % -0,10 %
Bulgarski Koraben Registar BKR 133 74 11 8,27 % 6,28 % 14,86 % 11,68 %
Bureau Veritas (France) BV 2222 1325 32 1,44 % -0,55 % 2,42 % -0,77 %
China Classification Society CCS 134 105 3 2,24 % 0,25 % 2,86 % -0,32 %
China Corporation Register of Shipping CCRS 16 13 0 0,00 % -1,99 % 0,00 % -3,18 %
Croatian Register of Shipping CRS 126 76 5 3,97 % 1,98 % 6,58 % 3,40 %
Det Norske Veritas (Norway) DNVC 2046 1390 20 0,98 % -1,01 % 1,44 % -1,74 %
Germanischer Lloyd GL 3348 1859 16 0,48 % -1,51 % 0,86 % -2,32 %
Hellenic Register of Shipping (Greece) HRS 167 92 8 4,79 % 2,80 % 8,70 % 5,51 %
Honduras Inter. Naval Surve. And Insp. Bur. HINSIB 17 8 4 23,53 % 21,54 % 50,00 % 46,82 %
Inclamar (Cyprus) INC 34 23 5 14,71 % 12,72 % 21,74 % 18,56 %
Indian Register of Shipping IRS 27 17 0 0,00 % -1,99 % 0,00 % -3,18 %
International Naval Surveys Bureau (Greece) INSB 90 43 11 12,22 % 10,23 % 25,58 % 22,40 %
International Register of Shipping (USA) IS 16 10 7 43,75 % 41,76 % 70,00 % 66,82 %
Korean Register of Shipping (South Korea) KRS 144 106 7 4,86 % 2,87 % 6,60 % 3,42 %
Lloyd's Register of Shipping (U.K.) LRS 3081 1962 50 1,62 % -0,37 % 2,55 % -0,63 %
Nippon Kaiji Kyokai (Japan) NKK 1309 961 24 1,83 % -0,16 % 2,50 % -0,68 %
Panama Register Corporation PRC 11 5 2 18,18 % 16,19 % 40,00 % 36,82 %
Polski Rejestr Statkow (Poland) PRS 326 166 9 2,76 % 0,77 % 5,42 % 2,24 %
Register of Shipping (Albania) RS 11 8 4 36,36 % 34,37 % 50,00 % 46,82 %
Registro Italiano Navale RINA 600 371 11 1,83 % -0,16 % 2,96 % -0,22 %
RINAVE Portuguesa (Portugal) RP 37 19 0 0,00 % -1,99 % 0,00 % -3,18 %
Romanian Naval Register RNR 69 34 10 14,49 % 12,50 % 29,41 % 26,23 %
Russian Maritime Register of Shipping RMRS 1701 952 24 1,41 % -0,58 % 2,52 % -0,66 %
Russian River Register RR 142 90 7 4,93 % 2,94 % 7,78 % 4,60 %
Turkisch Lloyd (Turkey) TL 202 91 11 5,45 % 3,46 % 12,09 % 8,91 %
Annual Report 2001
31annex 4
Tota
l nu
mbe
r of
insp
ecti
ons
Num
ber
ofin
divi
dual
shi
psin
spec
ted
Tota
l nu
mbe
r of
dete
ntio
ns
Det
enti
on-%
of
tota
l nu
mbe
r of
insp
ecti
ons
+/-
Per
cent
age
Ave
rage
Det
enti
on-%
of
indi
vidu
al s
hips
insp
ecte
d
+/-
Per
cent
age
Ave
rage

Model 1 - Detentions with class related detainable deficiencies in %
of total number of detentions (per Classification Society)
(Cases in which more than 10 detentions are involved, see table on page 24)
Model 2 - Detentions of ships with class related detainable
deficiencies per Classification Society
(Cases in which more than 10 inspections are involved, see table on page 25)
32 annex 4
Annual Report 2001

Model 3 – Number of detentions per Classification Society
(individual ships with class related detainable deficiencies)
Number of ships with class relateddetainable deficiencies, 3
Classification Society detained once detained twice detained thrice
No Class Recorded 18 0 0Class Withdrawn 17 1 0Class Not Specified 24 3 0American Bureau 0f Shipping 21 1 0Biro Klasifikasi Indonesia 1 0 0Bulgarski Koraben Registar 11 0 0Bureau Veritas (France) 32 0 0China Classification Society (Ccs) 3 0 0China Corporation Register of Shipping - - -Croatian Register of Shipping (Croatia) 5 0 0Det Norske Veritas (Norway) 20 0 0Fidenavis Sa (Spain) - - -Germanischer Lloyd (Germany) 16 0 0Hellenic Register of Shipping (Greece) 8 0 0Honduras Inter. Naval Surve. And Insp. Bur. 2 1 0Inclamar 3 1 0Indian Register of Shipping (India) - - -International Naval Surveys Bureau (Insb) 6 1 1International Register of Shipping (IS) 3 2 0Isthmus Bureau Shipping Classification Div 4 0 0Korean Register of Shipping (South Korea) 3 2 0Lloyd's Register of Shipping (U.K.) 42 4 0Nippon Kaiji Kyokai (Japan) 18 3 0Panama Maritime Surveyors Bureau Inc 2 0 0Panama Register Corporation (Panama) 2 0 0Polski Rejestr Statkow (Poland) 7 1 0Register of Shipping (Albania) 4 0 0Registri Laknori Shqiptar (Iceland) 1 0 0Registro Cubano De Buques (Cuba) 1 0 0Registro Italiano Navale (Italy) 11 0 0RINAVE Portuguesa (Portugal) - - -Romanian Naval Register (Romania) 7 0 1Russian Maritime Register of Shipping 24 0 0Russian River Register 7 0 0Turkisch Lloyd (Turkey) 11 0 0
3 No ship has been detained more than 3 times in 2001.
Annual Report 2001
33annex 4

34 annex 4
Annual Report 2001
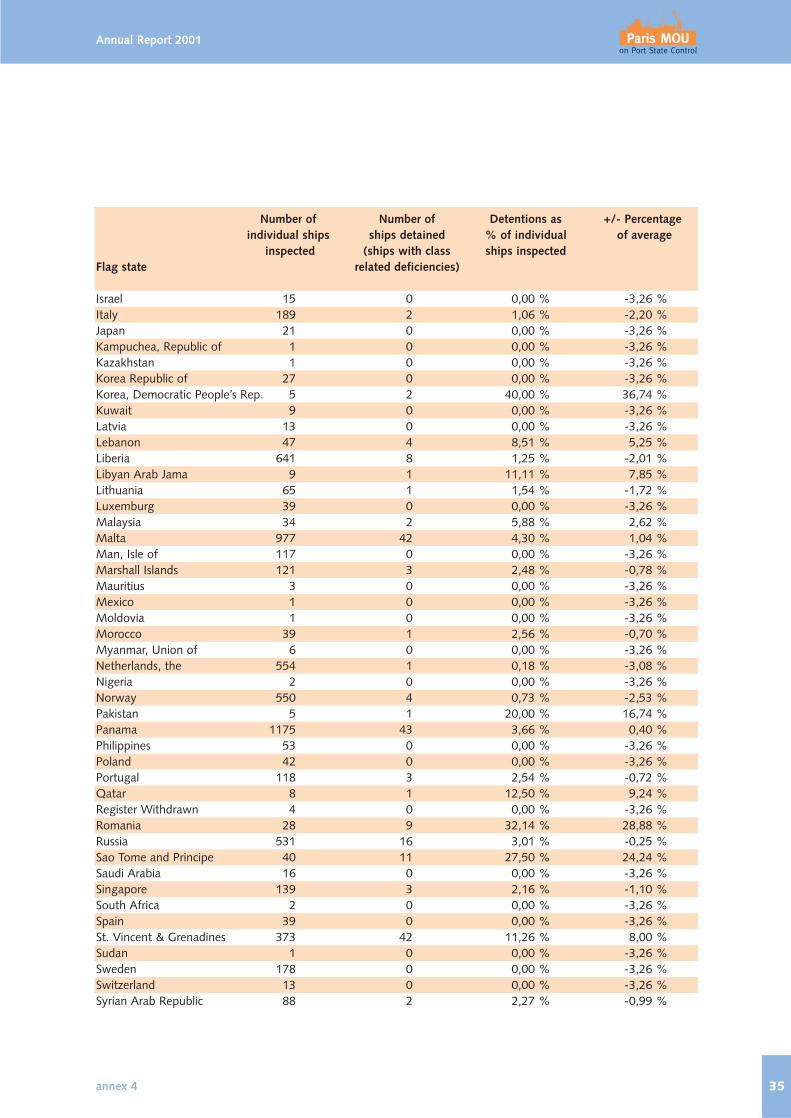
Model 4 - Detentions of ships with class related detainable
deficiencies per flag state
Number of Number of Detentions as +/- Percentageindividual ships ships detained % of individual of average
inspected (ships with class ships inspectedFlag state related deficiencies)
Albania 25 10 40,00 % 36,74 %Algeria 28 2 7,14 % 3,88 %Antigua and Barbuda 581 7 1,20 % -2,05 %Antilles, Netherlands 82 1 1,22 % -2,04 %Argentina 2 1 50,00 % 46,74 %Austria 21 0 0,00 % -3,26 %Azerbaijan 24 0 0,00 % -3,26 %Bahamas 652 8 1,23 % -2,03 %Bahrain 5 0Bangladesh 4 0 0,00 % -3,26 %Barbados 52 1 1,92 % -1,34 %Belgium 5 0Belize 63 4 6,35 % 3,09 %Bermuda 46 3 6,52 % 3,26 %Bolivia 10 5 50,00 % 46,74 %Brazil 8 0 0,00 % -3,26 %Bulgaria 60 7 11,67 % 8,41 %Cambodia 163 15 9,20 % 5,94 %Canada 5 0Cape Verde 3 0 0,00 % -3,26 %Cayman Islands 68 2 2,94 % -0,32 %China, People's Republic 67 1 1,49 % -1,77 %Comoros 2 1 50,00 % 46,74 %Croatia 38 1 2,63 % -0,63 %Cuba 2 0Cyprus 776 33 4,25 % 0,99 %Denmark 278 2 0,72 % -2,54 %Egypt 35 1 2,86 % -0,40 %Equatorial Guinea 6 3 50,00 % 46,74 %Estonia 58 1 1,72 % -1,54 %Ethiopia 6 0Faeroe Islands 9 0 0,00 % -3,26 %Finland 107 0 0,00 % -3,26 %France 66 0 0,00 % -3,26 %Georgia 40 10 25,00 % 21,74 %Germany 293 1 0,34 % -2,92 %Gibraltar 43 0 0,00 % -3,26 %Greece 348 8 2,30 % -0,96 %Guinea 1 0Honduras 38 6 15,79 % 12,53 %Hong Kong, China 128 1 0,78 % -2,48 %India 48 3 6,25 % 2,99 %Indonesia 1 1 100,00 % 96,74 %Iran 54 5 9,26 % 6,00 %Ireland 33 0 0,00 % -3,26 %
Number of Number of Detentions as +/- Percentageindividual ships ships detained % of individual of average
inspected (ships with class ships inspectedFlag state related deficiencies)
Israel 15 0 0,00 % -3,26 %Italy 189 2 1,06 % -2,20 %Japan 21 0 0,00 % -3,26 %Kampuchea, Republic of 1 0 0,00 % -3,26 %Kazakhstan 1 0 0,00 % -3,26 %Korea Republic of 27 0 0,00 % -3,26 %Korea, Democratic People’s Rep. 5 2 40,00 % 36,74 %Kuwait 9 0 0,00 % -3,26 %Latvia 13 0 0,00 % -3,26 %Lebanon 47 4 8,51 % 5,25 %Liberia 641 8 1,25 % -2,01 %Libyan Arab Jama 9 1 11,11 % 7,85 %Lithuania 65 1 1,54 % -1,72 %Luxemburg 39 0 0,00 % -3,26 %Malaysia 34 2 5,88 % 2,62 %Malta 977 42 4,30 % 1,04 %Man, Isle of 117 0 0,00 % -3,26 %Marshall Islands 121 3 2,48 % -0,78 %Mauritius 3 0 0,00 % -3,26 %Mexico 1 0 0,00 % -3,26 %Moldovia 1 0 0,00 % -3,26 %Morocco 39 1 2,56 % -0,70 %Myanmar, Union of 6 0 0,00 % -3,26 %Netherlands, the 554 1 0,18 % -3,08 %Nigeria 2 0 0,00 % -3,26 %Norway 550 4 0,73 % -2,53 %Pakistan 5 1 20,00 % 16,74 %Panama 1175 43 3,66 % 0,40 %Philippines 53 0 0,00 % -3,26 %Poland 42 0 0,00 % -3,26 %Portugal 118 3 2,54 % -0,72 %Qatar 8 1 12,50 % 9,24 %Register Withdrawn 4 0 0,00 % -3,26 %Romania 28 9 32,14 % 28,88 %Russia 531 16 3,01 % -0,25 %Sao Tome and Principe 40 11 27,50 % 24,24 %Saudi Arabia 16 0 0,00 % -3,26 %Singapore 139 3 2,16 % -1,10 %South Africa 2 0 0,00 % -3,26 %Spain 39 0 0,00 % -3,26 %St. Vincent & Grenadines 373 42 11,26 % 8,00 %Sudan 1 0 0,00 % -3,26 %Sweden 178 0 0,00 % -3,26 %Switzerland 13 0 0,00 % -3,26 %Syrian Arab Republic 88 2 2,27 % -0,99 %
Annual Report 2001
35annex 4
36 annex 4
Annual Report 2001
Number of Number of Detentions as +/- Percentageindividual ships ships detained % of individual of average
inspected (ships with class ships inspectedFlag state related deficiencies)
Taiwan 15 0 0,00 % -3,26 %Tanzania United Republic 1 0 0,00 % -3,26 %Thailand 25 0 0,00 % -3,26 %Togo 1 1 100,00 % 96,74 %Tonga 24 3 12,50 % 9,24 %Tunisia 7 0 0,00 % -3,26 %Turkey 450 21 4,67 % 1,41 %Turkmenistan 3 0 0,00 % -3,26 %Tuvalu 11 0 0,00 % -3,26 %U.S.A. 26 0 0,00 % -3,26 %Ukrainia 155 7 4,52 % 1,26 %United Arab Emirates 11 1 9,09 % 5,83 %United Kingdom 172 0 0,00 % -3,26 %Vanuatu 30 1 3,33 % 0,07 %Viet Nam 2 0 0,00 % -3,26 %Yugoslavia 1 0 0,00 % -3,26 %
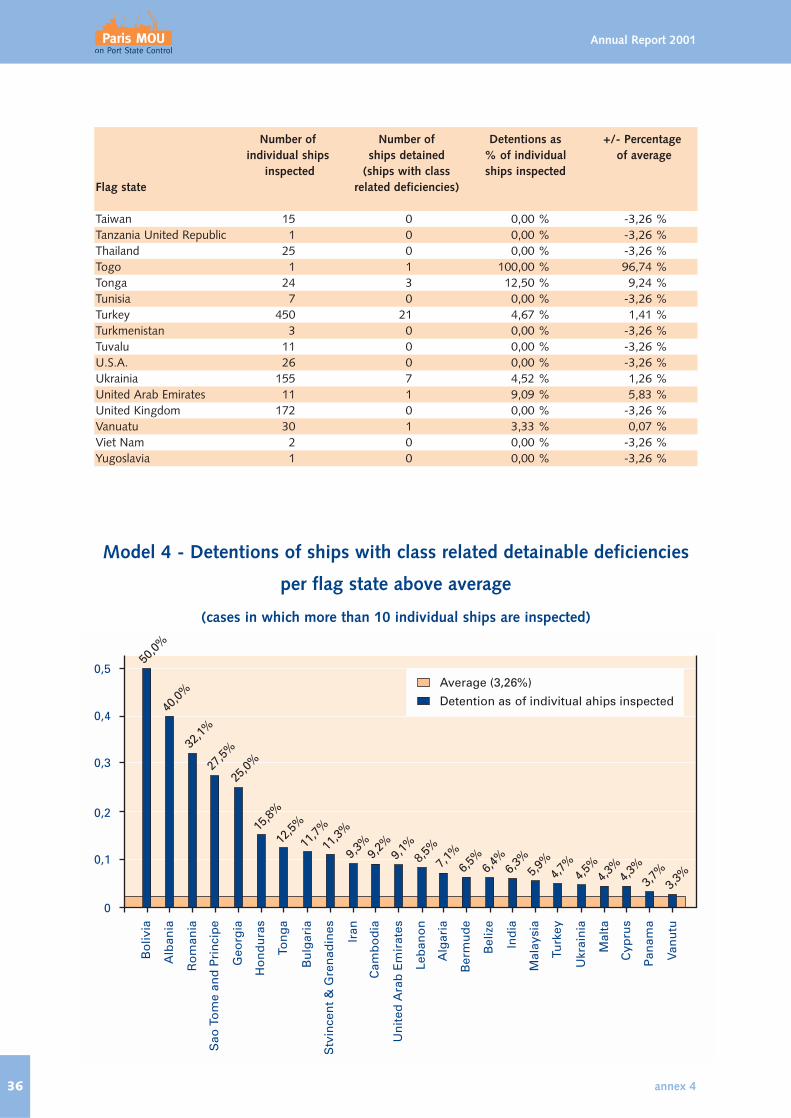
Model 4 - Detentions of ships with class related detainable deficiencies
per flag state above average
(cases in which more than 10 individual ships are inspected)

Annual Report 2001
37annex 4
Explanatory note – Black, Grey and White lists
The new normative listing of flag States provides anindependent categorization that has been prepared onthe basis of Paris MOU port State inspection results.Compared to the calculation method of previous year,this system has the advantage of providing an excesspercentage that is significant and also reviewing thenumber of inspections and detentions over a 3-yearperiod at the same time, based on binomial calculus.
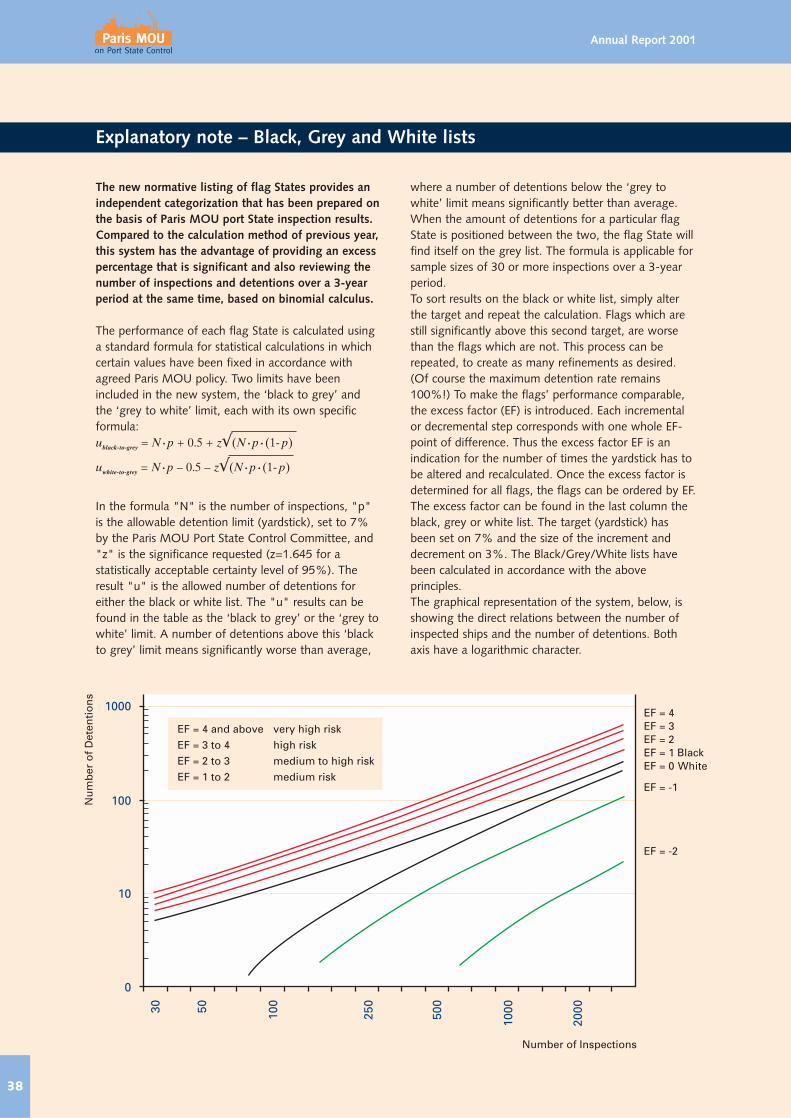
The performance of each flag State is calculated usinga standard formula for statistical calculations in whichcertain values have been fixed in accordance withagreed Paris MOU policy. Two limits have beenincluded in the new system, the ‘black to grey’ and the ‘grey to white’ limit, each with its own specificformula:
In the formula "N" is the number of inspections, "p"is the allowable detention limit (yardstick), set to 7%by the Paris MOU Port State Control Committee, and"z" is the significance requested (z=1.645 for astatistically acceptable certainty level of 95%). Theresult "u" is the allowed number of detentions foreither the black or white list. The "u" results can befound in the table as the ‘black to grey’ or the ‘grey towhite’ limit. A number of detentions above this ‘blackto grey’ limit means significantly worse than average,
where a number of detentions below the ‘grey towhite’ limit means significantly better than average.When the amount of detentions for a particular flagState is positioned between the two, the flag State willfind itself on the grey list. The formula is applicable forsample sizes of 30 or more inspections over a 3-yearperiod.To sort results on the black or white list, simply alterthe target and repeat the calculation. Flags which arestill significantly above this second target, are worsethan the flags which are not. This process can berepeated, to create as many refinements as desired.(Of course the maximum detention rate remains100%!) To make the flags’ performance comparable,the excess factor (EF) is introduced. Each incrementalor decremental step corresponds with one whole EF-point of difference. Thus the excess factor EF is anindication for the number of times the yardstick has tobe altered and recalculated. Once the excess factor isdetermined for all flags, the flags can be ordered by EF.The excess factor can be found in the last column theblack, grey or white list. The target (yardstick) hasbeen set on 7% and the size of the increment anddecrement on 3%. The Black/Grey/White lists havebeen calculated in accordance with the aboveprinciples.The graphical representation of the system, below, isshowing the direct relations between the number ofinspected ships and the number of detentions. Bothaxis have a logarithmic character.
38
Annual Report 2001
ublack-to-grey = N • p + 0.5 + z√(N • p • (1- p)
uwhite-to-grey = N • p _ 0.5 _ z√(N • p • (1- p)

Example flag on Black list:Ships of St Vincent & Grenadines were subject to 2213inspections of which 378 resulted in a detention. The"black to grey limit" is 175 detentions. The excessfactor is 3,93
N = total inspectionsP = 7%Q= 3%Z = 1.645
How to determine the black to grey limit:
The excess factor is 3,93. This means that ‘p’ has to beadjusted in the formula. The black to grey limit has anexcess factor of 1, so to determine the new value for‘p’, ‘q’ has to be multiplied with 2,93, and theoutcome has to be added to the normal value for ‘p’:
p + 2.93q = 0,07 + (2,93 • 0,03) = 0,1579
Example flag on Grey list:Ships of Estonia were subject to 373 inspections, ofwhich 25 resulted in a detention. The ‘ black to greylimit" is 35 and the "grey to white limit" is 18. Theexcess factor is 0,44.
How to determine the black to grey limit:
How to determine the grey to white limit:
To determine the excess factor the following formula isused:ef = Detentions - grey to white limit / grey to black
limit - grey to white limitef = (25-18 / (35-18)ef = 0,44
Example flag on White list:Ships of Singapore were subject to 652 inspections ofwhich 27 resulted in detention. The "grey to whitelimit" is 34 detentions. The excess factor is -0,43.
How to determine the grey to white limit:
The excess factor is -0,43 This means that ‘p’ has to beadjusted in the formula. The grey to white limit has anexcess factor of 0, so to determine the new value for’p’, ‘q’ has to be multiplied with -0,43, and theoutcome has to be added to the normal value for ‘p’:
p + (-0.43q) = 0.07 + (-0.43 • 0.03) = 0,0571
Annual Report 2001
39
ublacktogrey = N • p + 0.5 + z√(N • p • (1- p)
ublacktogrey = 2213 • 0.07 + 0.5 + 1.645 √2213 • 0.07 • 0.93
ublacktogrey = 175
uexcessfactor = 2213 • 0.1579 + 0.5 + 1.645 √2213 • 0.1579 • 0.8421
uexcessfactor = 378
ublacktogrey = 373 • 0.07 + 0.5 + 1.645 √373 • 0.07 • 0.93
ublacktogrey = 35
ugreytowhite = N • p _ 0.5 _ z√(N • p • (1-p)
ugreytowhite = 373 • 0.07 _ 0.5 + 1.645 √373 • 0.07 • 0.93
ugreytowhite = 18
ugreytowhite = N • p _ 0,5 _ z√N • p(1-p)
ugreytowhite = 652 • 0.07 _ 0.5 _ 1.645 √652 • 0.07 • 0.93
ugreytowhite = 34
uexcessfactor = 652 • 0.0571 _ 0.5 _ 1.645 √652 • 0.0571 • 0.9429
uexcessfactor = 27

40
Annual Report 2001
Address Secretariat
Jan van Nassaustraat 125
P.O.Box 90653
2509 LR The Hague
Telephone: +31 70 351 1508
Fax: +31 70 351 1599
Staff
Mr. Richard W.J. SchiferliGeneral Secretary
Telephone: +31 70 351 1509
E-mail: [email protected]
Mr. Michael VoogelSecretary
Telephone: +31 70 351 1510
E-mail: [email protected]
Ms. Carien DroppersAssistant secretary
Telephone: +31 70 351 1507
E-mail: [email protected]
Mr. Alexander SindramICT Advisor
Telephone: +31 70 351 1375
E-mail: [email protected]
Mr. Roy WelbornOffice Manager
Telephone: +31 70 351 1508
E-mail: [email protected]
Colophon
Layout and designSecretariat Paris MOU
Abstrakt, Leidschendam
PhotographsRichard W. J. Schiferli
Paris MOU Authorities
Ministry of Transport
Litho and printCentre Administratif des Affaires Maritimes,
Saint-Malo, France
Web siteThe Paris MOU maintains a website which
can be found at www.parismou.org.
The site contains information on operation
of the Paris MOU and a database of
inspection results.
Secretariat Paris Memorandum of Understanding on Port State Control

Annual Report 2001
41
MaritimeAuthorities
EuropeanCommission
Co-operatingMaritime
Authorities
Port State Control Committee
MOU Advisory Board (MAB)
Paris MOU Secretariat
Technical WorkingGroups
SIReNaCInformation System
Owners, flag States andclassification societies
Ship inspection servicesof Paris MOU port States
Observers:IMO, ILO,
other MOU’s
Paris MOU fact sheet - organizational structure

42
Annual Report 2001

Annual Report 2001
43

Annual Report 2001