Embed Size (px)
DESCRIPTION
Paris MoU consists of 27 participating maritime Administrations and covers the waters of the European coastal States and the North Atlantic basin from North America to Europe.
Citation preview
Annual Report2013
TH
E P
AR
IS M
EM
OR
AN
DU
M O
F U
ND
ER
STA
ND
ING
ON
PO
RT
STA
TE
CO
NT
RO
L
Port State ControlConsolidating Progress


3ANNUAL REPORT 2013
Annual Report
2013
Contents
Statement by Paris MoU chairman 4Statement by the Secretary General 6Executive summary 8Paris MoU developments 10Facts & Figures 2013 18Statistical Annexes Annual Report 2013 23White list 31Grey List 33Black List 35Explanatory note - “White”, “Grey” and “Black List” 58Secretariat Paris Memorandum of Understanding on Port State Control 60

4
PORT STATE CONTROL - CONSOLIDATING PROGRESS
2013:a busy and important
year for the Paris MoU
The year 2013 was a busy and important year for the Paris MoU as
a Harmonized Verification Programme (HAVEP) was conducted
on cruise liners and a Concentrated Inspection Campaign (CIC)
on Propulsion and Auxiliary Machinery was carried out during
inspections of other ship types. We will share the results of the
HAVEP and CIC with the wider maritime transport community
through the International Maritime Organization (IMO).
This year also saw the entry into
force of the International Labour
Organization’s (ILO) Maritime
Labour Convention (MLC) in August.
This was a key event in our industry
and the Convention will play an
important part of port State control
in the coming years.
We held our Port State Control
Committee’s 46th Meeting in
Valetta, Malta, in May 2013. The
meeting coincided with the European
Maritime Day being held in Malta
and this provided an opportunity to
place the work of the Paris MoU in a
wider context. The meeting adopted
several significant matters improving
Statement by the
Paris MoU chairman

5ANNUAL REPORT 2013
The Paris MoU Secretariat again
continued to serve its members well
during the year and I would like to
thank them for their contribution.
I also wish to thank the Member
Authorities for their contributions
to all of the different fora of the
Paris MoU, including: the Technical
Evaluation Group (TEG) and its
Chairman; all of the contributors to our
Task Forces; and finally to the members
of the MoU Advisory Board (MAB),
all of whom have made a tremendous
contribution during the year.
I would also like to thank the
European Commission and the
European Maritime Safety Agency
(EMSA) for the excellent co-operation
and strong working relationship with
the Paris MoU. In conclusion, the
Port State Control Officers (PSCOs)
and Administrators in the Member
Authorities of the Paris MoU are the
people who ensure the success of our
endeavours. They are the ones who are
the core of the Paris MoU and continue
to deliver on our common objectives.
They deserve our special thanks and
appreciation.
Brian Hogan
the port State control regime, many
of which you can read about in this
Annual Report. The meeting itself was
a success and strengthens the Paris
MoU for the future and Malta is to
be complimented on the hosting and
organisation for our meeting.
The Paris MoU relationship with other
regional port State control agreements
is growing. We are very proud of our
co-operation with them and with the
United States Coast Guard. We are
also very proud of the role played by
MoUs at the IMO meetings. This year
we also welcomed back the Viña del
Mar Agreement as an observer at
Paris MoU meetings.
6
PORT STATE CONTROL - CONSOLIDATING PROGRESS
Gearing up for the Maritime Labour Convention
“The Maritime Labour Convention is
not about paperwork but about people and
their working and living environment on board.
Since the adoption of the Maritime Labour Convention (MLC)
in February 2006, it took a further 7 years for it to enter into
force. Time was needed for flag States, port States, Recognized
Organizations (ROs) and the maritime industry to prepare for
this and meet the requirements of the Convention.
Although the Paris MoU already had 30
years of experience with enforcement
of working and living conditions under
the umbrella of ILO Convention No.
147, new areas of compliance would
now be included. These areas include
employment agreements, hours of
work and rest, payment of wages,
repatriation at the end of contract and
seafarers’ complaint handling.
Several maritime conferences were
dedicated to the MLC, 2006 and
included sessions questioning what
port State control would do after entry
into force. For the Paris MoU it has
been clear from the start: the MLC
would become a “relevant instrument”
Statement by the
Secretary General
”

7ANNUAL REPORT 2013
work and rest (5) quantity of provisions
(4) and sanitary facilities (2).
Overall the entry into force of the MLC
has gone relatively smoothly from a
port State control point of view. The
“seafarers’ bill of rights” has made a
significant contribution in securing
decent working and living conditions
on board ships.
The Paris MoU has firmly supported
these goals in the past and will
continue to do so in the future.
Richard W.J. Schiferli
entered into force for them. For these
members the “old” Convention No.
147 would remain relevant.
Closer to the entry into force date the
maritime industry expressed concerns
that port States could be overzealous
in their enforcement and large
numbers of ships would be detained.
A resolution adopted by the ILO
invited port States to take a pragmatic
approach. And the Paris MoU has
done exactly that. By issuing a press
release, flag States and the industry
were informed how ships would be
treated in our ports. Ships have been
detained only in cases of significant
non-compliance. Since the MLC
entered into force, detentions were
issued against 21 ships for detainable
MLC deficiencies with regard to wages
(10), calculation and payment of
wages (7), fitness for duty – hours of
and enforcement would take place
including the principle of “no more
favourable treatment” for flags which
had not ratified.
In order to reach a harmonized
approach our members had to
agree on formal amendments of the
Memorandum to form a base line
for enforcement. The PSCOs needed
practical guidelines to assist them
during inspections. Several training
courses would be needed to bring the
level of knowledge, in particular on the
new areas, to the required level.
In May 2013 the amendments were
adopted, the guidelines agreed and
the training completed. The Paris
MoU was ready for 20 August 2013,
when the MLC came into force. Some
Member States could not apply the
new instrument because it had not

PORT STATE CONTROL - CONSOLIDATING PROGRESS
Executive summary One ship, the ro-ro cargo ship “Carolyn”,
flag United Republic of Tanzania, was
banned twice in one year - once by
Malta in February and again by Italy in
November 2013.
Considered to be the worldwide index for
flag performance, the Paris MoU “White,
Grey and Black Lists” indicate further
improvements towards quality shipping.
Last year Thailand and the United States
of America were congratulated for their
efforts to move up to the “White List”.
This year Kazakhstan, Saudi Arabia and
Switzerland moved from the “Grey List”
to the “White List”. A very successful
achievement and an example to other
flags that, through determined actions
and political courage, changes can be
made. Portugal and Vanuatu moved
from the “White List” to the “Grey
List”. Georgia, Lebanon, Saint Kitts
and Nevis, Libya and Albania moved
from the “Black List” to the “Grey
List”. The worst performing flag of last
8
With a total number of 28 ships refused access to Paris MoU ports,
this was the highest number recorded since 2005. Although it was
anticipated that the number of banned ships would rise, an increase
of 87% compared to last year was not anticipated. Most ships have
been banned for multiple detentions (17), while a significant number
(9) were banned for failing to call at an indicated repair yard. Over a
3 year period the flags of the United Republic of Tanzania, the
Republic of Moldova, Saint Vincent and the Grenadines and Togo
have recorded the highest number of bannings.
9ANNUAL REPORT 2013
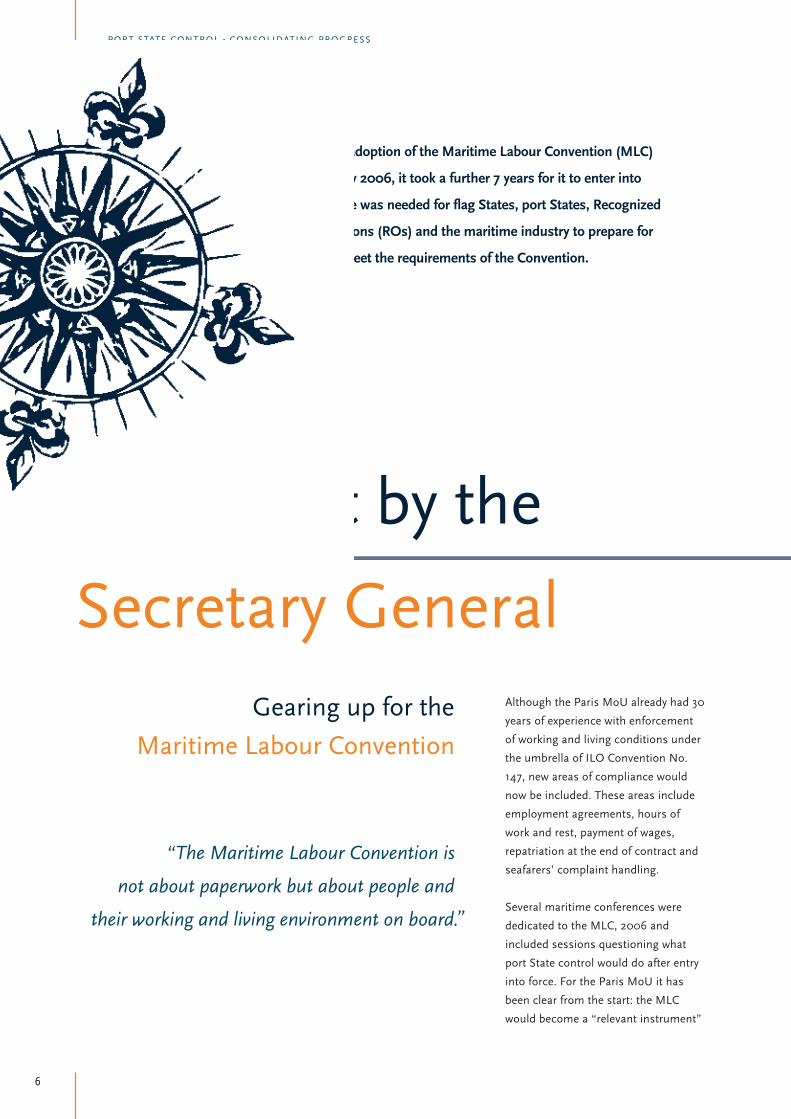
The introduction of the New Inspection
Regime in 2011 has also had an
impact on the 2013 figures. A decrease
in total number of inspections
has continued, as well as the total
number of deficiencies. Compared to
2012 the detention percentage has
slightly increased to 3.8%. Italy, the
Netherlands, Spain and the United
Kingdom contribute most to the
overall inspection efforts in terms of
percentage. High Risk Ships have been
operating mostly in the southern part
of the region, while Low Risk Ships
have been calling in the north-western
part of the region.
With 1,188 inspections and 154
detentions the ships flying a “black
listed flag“ score a detention rate of
12.96%. For ships flying a “grey listed
flag” the detention rate is 7.64% (851
inspections, 65 detentions) and for
ships flying a “white listed flag” 2.82%
(15,551 inspections and 439 detentions).
year the Plurinational State of Bolivia
disappeared from the “Black List” due
to an insufficient number of inspections
and was replaced by the United
Republic of Tanzania.
There are now 46 flags on the “White
List”, 1 more compared with last year.
France is still leading the list, followed
by Norway and Sweden. Several flags
have made a significant move upwards
on the “White List” into the top 10:
Norway, Italy, the United Kingdom
and Finland. Other flags have made
a significant move downwards in the
“White List” and are no longer in the
top 10: Bahamas and Greece.
Recognized Organizations (ROs) are
delegated by flag States to carry out
statutory surveys on behalf of flags.
For this very reason, it is important to
monitor their performance. The best
performing RO over the period 2011-
2013 was Lloyds Register (LR), followed
by American Bureau of Shipping (ABS)
and Det Norske Veritas (DNV). Korean
Register of Shipping (KRS) has dropped
out of the top 5 and has been replaced
by Nippon Kaiji Kyokai (NKK).
Phoenix Register of Shipping (PH.R.S)
showed a remarkable increase in
performance and moved from “very
low performance” to “medium
performance”. INCLAMAR is now at
the bottom of the list in terms of poor
performance. For several years a joint
submission with the Tokyo MoU to IMO
has addressed the correlation between
flags and ROs working on their behalf.
For the first time this information has
been published in the Annual Report.
The combinations of the Republic
of Moldova with Dromon Bureau of
Shipping and Maritime Lloyd (Georgia),
as well as Togo with International Naval
Surveys Bureau, and Sierra Leone with
Phoenix Register of Shipping resulted
each in a 9% detention rate over a
3-year rolling period.

10
PORT STATE CONTROL - CONSOLIDATING PROGRESS
Paris MoUdevelopments
Once a year the Port State Control Committee (PSCC), which is
the executive body of the Paris MoU, meets in one of the Member
States. The Committee considers policy matters concerning
regional enforcement of port State control, reviews the work of
the Technical Evaluation Group and Task Forces and decides on
administrative procedures.
The Task Forces, of which 10 were
active in 2013, are each assigned
a specific work programme
to investigate improvement
of operational, technical and
administrative port State control
procedures. Reports of the Task
Forces are submitted to the Technical
Evaluation Group (TEG) in which all
Paris MoU members and observers
are represented. The evaluation of the
TEG is submitted to the Committee
for final consideration and decision-
making.
The MoU Advisory Board (MAB)
advises the Port State Control
Committee on matters of a political
and strategic nature, and provides
direction to the Task Forces and
Secretariat between meetings of the
Committee. The Board meets several
times a year and in 2013 comprised
participants from Germany, Italy,
Norway, Russian Federation and the
European Commission.
In addition, the Committee considered
a number of options for other joint
CICs with the Tokyo MoU for 2016 and
beyond. The report of the CIC on Fire
Safety Systems, carried out in September
to November of 2012, was presented
to PSCC46. Concerns were expressed
on the high percentage of CIC related
detentions. The results will be published
and submitted to the IMO in 2014.
The Committee also agreed on PSC
guidelines for the Ballast Water
Management Convention. The proposed
guidelines will be submitted to the
IMO correspondence group of FSI for
consideration.
The Committee also considered the first
results of the Harmonized Verification
Programme on operational safety of
passenger ships.
The Committee adopted the 2012
Annual Report, including the new White,
Grey and Black List and the performance
Port State Control Committee
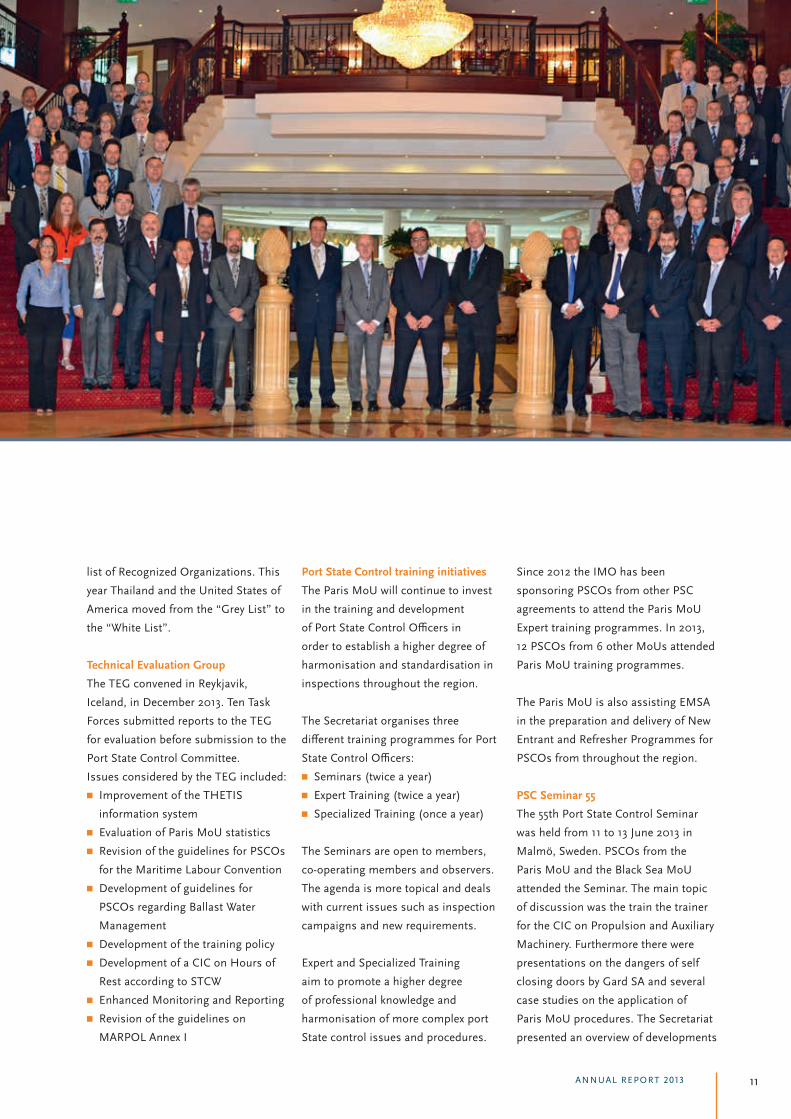
The Port State Control Committee
held its 46th meeting in Valletta, Malta
from 20-24 May 2013. The MoU has
27 member States. The Committee
adopted amendments to the
Memorandum to include the Maritime
Labour Convention 2006 as a relevant
instrument. Guidelines for port State
control under this Convention were
also agreed, providing practical
guidance for PSCOs to inspect ships
starting 20 August 2013.
High importance was given to
Concentrated Inspection Campaigns
(CICs). A CIC on Propulsion and
Auxiliary Machinery was scheduled
from September to November 2013.
A CIC on Hours of Rest under the
STCW Convention was scheduled in
2014 and a CIC focussing on Crew
Familiarisation and Entry of Enclosed
Spaces in 2015. These campaigns will
be carried out jointly with the Tokyo
MoU and other MoUs may join as well.
11ANNUAL REPORT 2013
Since 2012 the IMO has been
sponsoring PSCOs from other PSC
agreements to attend the Paris MoU
Expert training programmes. In 2013,
12 PSCOs from 6 other MoUs attended
Paris MoU training programmes.
The Paris MoU is also assisting EMSA
in the preparation and delivery of New
Entrant and Refresher Programmes for
PSCOs from throughout the region.
PSC Seminar 55
The 55th Port State Control Seminar
was held from 11 to 13 June 2013 in
Malmö, Sweden. PSCOs from the
Paris MoU and the Black Sea MoU
attended the Seminar. The main topic
of discussion was the train the trainer
for the CIC on Propulsion and Auxiliary
Machinery. Furthermore there were
presentations on the dangers of self
closing doors by Gard SA and several
case studies on the application of
Paris MoU procedures. The Secretariat
presented an overview of developments
list of Recognized Organizations. This
year Thailand and the United States of
America moved from the “Grey List” to
the “White List”.
Technical Evaluation Group
The TEG convened in Reykjavik,
Iceland, in December 2013. Ten Task
Forces submitted reports to the TEG
for evaluation before submission to the
Port State Control Committee.
Issues considered by the TEG included:■ Improvement of the THETIS
information system
■ Evaluation of Paris MoU statistics
■ Revision of the guidelines for PSCOs
for the Maritime Labour Convention
■ Development of guidelines for
PSCOs regarding Ballast Water
Management
■ Development of the training policy
■ Development of a CIC on Hours of
Rest according to STCW
■ Enhanced Monitoring and Reporting
■ Revision of the guidelines on
MARPOL Annex I
Port State Control training initiatives
The Paris MoU will continue to invest
in the training and development
of Port State Control Officers in
order to establish a higher degree of
harmonisation and standardisation in
inspections throughout the region.
The Secretariat organises three
different training programmes for Port
State Control Officers:
■ Seminars (twice a year)
■ Expert Training (twice a year)
■ Specialized Training (once a year)
The Seminars are open to members,
co-operating members and observers.
The agenda is more topical and deals
with current issues such as inspection
campaigns and new requirements.
Expert and Specialized Training
aim to promote a higher degree
of professional knowledge and
harmonisation of more complex port
State control issues and procedures.

12
PORT STATE CONTROL - CONSOLIDATING PROGRESS
in the Paris MoU and a representative
from EMSA gave a presentation on
the developments within the EU and
EMSA.
PSC Seminar 56
The 56th Port State Control Seminar
was held from 5 to 7 November
2013 in St George’s Bay, Malta.
PSCOs from the Paris MoU member
States attended the Seminar as
well as a PSCO from a co-operating
member. The main topics of
discussion were the Ballast Water
Management Convention, the
inspection of commercial yachts and
the PSCCInstruction on ISM. The
Secretariat presented an overview of
developments in the Paris MoU.
Train the Trainer MLC, 2006
In February 2013 two special 1.5 day
“train-the-trainer” programmes were
held in The Hague, Netherlands,
providing member States with up
Kingdom, Germany, the Netherlands,
Spain, Italy and several Recognized
Organizations, P&I Clubs and service
companies, among others, provided
lecturers.
The 9th Expert Training “Safety and
Environment”
The ninth Expert Training programme
was held in The Hague, Netherlands,
in March 2013. Important issues
during this training were MARPOL,
SOLAS, Load Lines, life saving
appliances and oil filtering equipment.
Participants from the Black Sea MoU,
Indian Ocean MoU, Caribbean MoU,
Mediterranean MoU, Riyadh MoU and
the Viña del Mar Agreement took part
in the training.
The 5th Specialized Training on Bulk
Cargoes
The fifth Specialized Training
programme on Bulk Cargoes was held
in Gijon, Spain, in April 2013. During
to date information on the MLC,
2006. The program focussed on the
PSCCInstruction and the application
of the MLC in PSC inspections.
Expert and Specialized Training
For the Expert Training the central
themes are “The Human Element”
and “Safety and Environment”. The
theme of the Specialized Training
changes every year. In 2013 this
training dealt with ships carrying
bulk cargoes, bulk carriers and
more complex related issues. Both
training programmes are intended
for experienced PSCOs. Using
that experience, the participants
can work together to establish a
higher degree of harmonisation and
standardisation of their inspection
practice. Lecturers for the training
programmes are invited from the
Paris MoU Authorities and the
maritime industry. For the training
programmes in 2013 the United

13ANNUAL REPORT 2013
Detention Review Panel
Flag States or ROs which cannot
resolve a dispute concerning a
detention with the port State may
submit their case for review. The
detention review panel comprises
representatives of four different MoU
Authorities, on a rotating basis, plus
the Secretariat.
In 2013 the Secretariat received seven
requests for review. Three cases did
not comply with the requirements for
consideration. These cases were either
submitted beyond the 120 days limit,
were handled at National Courts or
originated from ship owners instead of
flag States or ROs.
Four cases met the criteria and were
submitted to MoU members for review.
In two cases the detention review
panel concluded that the port State’s
decision to detain was not justified.
The panel requested this port State
to reconsider the detention. In two
cases the panel concluded that the
detaining port State would not have to
reconsider the decision to detain.
Quality management
Since 15 March 2011 the Paris MoU
Secretariat has been ISO9001:2008
certified for its services and products.
During 2013, the Secretariat has
focused on improvement of the Quality
Manual and also making preparations
for recertification for a new 3-year
period in 2014. The outcome of
the third general customer survey
concerning the products and services
of the Secretariat shows that the
overall scores have improved and
that the customer service especially
was highly rated by the Paris MoU
Member States.
the training, the construction and
certification, and the procedures
for more detailed and expanded
inspections, of ships carrying
bulk cargoes were discussed. Also
discussed were the properties of
different types of bulk cargoes and
the important issues for port State
control in each case highlighted.
The 12th Expert Training “The
Human Element”
In October 2013 the twelfth Expert
Training programme was held
in Leiden, Netherlands, with the
Human Element as the central
theme. The programme was
dedicated to the MLC, 2006. Both
the articles of the Convention as well
as the flag State requirements and
the PSC inspection procedures were
discussed. Representatives from
the ITF and ICS also attended the
training to discuss with PSCOs their
involvement in the MLC, specifically
were a Rectification Action Plan has
been issued during a PSC inspection.
Participants from Member States
as well as from the Black Sea MoU,
Indian Ocean MoU, Caribbean MoU,
Mediterranean MoU, Riyadh MoU
and the Viña del Mar Agreement
took part in the training.
Training in cooperation with EMSA
The Paris MoU assists EMSA in the
training delivered to PSCOs from all
Member States.
New Entrant and Refresher PSC
Seminars
In 2013 the fully established
Professional Development
Scheme (PDS) of the Paris MoU
encompassed 4 EMSA/Paris MoU
Seminars for PSCOs.
The Paris MoU inspection regime
focuses on sub-standard shipping and
pivots on rewarding good performing
ships in terms of the inspection
frequency. It translates to “less, but
better inspections”. The regime is
underpinned by new and enhanced
procedures, all aiming at providing
more guidance for better inspections.
These ongoing improvements
and performance measurement
through inspection results require
strict adherence to the established
procedures. For the seminars
organised for PSCOs held during
2013 the earlier adopted approach
was followed in order to maximise
the awareness concerning procedures
governing port State control
inspections.
The overarching goal for the seminars
remained the establishment of
a common understanding and
harmonised approach in the area of
the Paris MoU. Feedback sessions
with participants during the seminars
indicated that indeed a wider
understanding of the procedures
and the available tools such as the
Paris MoU manual, RuleCheck and
the distance learning modules was
established. The constantly evolving
methodology of delivering the lectures
during the seminars is deemed
effective in achieving the goals.
All seminars were organised by EMSA
and held at its premises in Lisbon,
Portugal. Lecturers were provided
both by EMSA and the Paris MoU
Secretariat. The 171 participants
attending these Seminars during
2013 originated from all Paris MoU
Member States.
14
PORT STATE CONTROL - CONSOLIDATING PROGRESS
Paris MoU on the Internet
In 2013 the website enjoyed an ever
increasing demand from a variety of
visitors. In particular from flag and
port States, government agencies,
charterers, insurers and classification
societies. They were able to monitor
their performance and the performance
of others on a continuous basis.
The port State enters ships that are
currently under detention in a listing.
Validated port State control reports
could be accessed and offered visitors
more detailed information.
Since the contract with the hosting
provider expired, a new party was
contracted to host the Paris MoU
website. The wish to make the site
more user-friendly was also taken
into account. This resulted in the
development of a new design of the
website, which started in the summer
of 2013. The new restyled and more
contemporary website was launched
on 1st November 2013.
To increase public awareness of unsafe
ships, particularly serious port State
control detentions are published under
the heading ‘Caught in the Net’. These
detentions are described in detail and
illustrated with photographs.
In 2013 details were published of the
following ships:■ Suat Bey, flag Panama
■ Safi, flag Togo
■ Oceanic Force, flag Comoros
The annual award for best contribution
to the ‘Caught in the Net’ has been
presented to port State Italy.

15ANNUAL REPORT 2013
purpose ships with 1,270 (33%)
inspections, followed by bulk carriers
with 805 (21%) inspections, container
ships with 458 (12%) inspections,
chemical tankers with 343 (9%)
inspections and oil tankers with
272 (7%) inspections.
Of the ships detained for CIC-related
deficiencies, 34 (50%) were general
cargo/multipurpose ships, 9 (13%)
were bulk carriers and 9 (13%) were
container ships. Among the other
detained ships were 6 oil tankers,
4 chemical tankers and 3 refrigerated
cargo ships. 54% of the detained
ships were over 20 years old.
Other information of interest such as
the current detentions and bannings,
monthly detention lists, the Annual
Report, the performance lists and
news items can be downloaded
from the website, which is found at
www.parismou.org.
Concentrated Inspection Campaigns
Several Concentrated Inspection
Campaigns (CICs) have been held in
the Paris MoU region over the past
years. These campaigns focus on a
particular area of compliance with
international regulations with the
aim of gathering information and
enforcing the level of compliance. Each
campaign is prepared by experts and
identifies a number of specific items
for inspection. Experience shows
that they serve to draw attention to
the chosen area of compliance.
CIC 2013 Propulsion and Auxiliary
Machinery
During the period from 1 September
2013 to 30 November 2013 a CIC
was carried out on Propulsion and
Auxiliary Machinery.
The CIC questionnaire was completed
during 3,879 inspections, a total of
1,105 CIC-related deficiencies were
recorded and 68 ships (1.8%) were
detained for CIC-related deficiencies.
During the campaign most inspections
concerned general cargo/multi-

PORT STATE CONTROL - CONSOLIDATING PROGRESS
16
Analysis of the recorded deficiencies
shows that most deficiencies relate
to propulsion main engine (20%),
cleanliness of the engine room (18%),
emergency source of power/emergency
generator (12%) and emergency
lighting/batteries/switches (12%).
Most inspections were carried out on
ships under the flags of Panama (495
inspections), Liberia (322 inspections),
Malta (317 inspections) and Antigua
and Barbuda (246 inspections).
The flags with the highest number of
CIC-topic related detentions were the
United Republic of Tanzania with
6 CIC-topic related detentions during
27 inspections and Togo with 4
CIC-topic related detentions during
35 inspections.
MoU, Mediterranean MoU, Black Sea
MoU, Riyadh MoU and the Viña del
Mar Agreement. The United States
Coast Guard is also an observer at
Paris MoU meetings.
The International Labour Organization
and the International Maritime
Organization have participated in
the meetings of the Paris MoU on a
regular basis since 1982. In 2006 the
Paris MoU obtained official status at
the IMO as an Inter Governmental
Organization. A delegation of the
MoU participated in the 21st session
of the Sub-Committee on Flag State
Implementation in March 2013.
The 2011 Annual Report including
inspection data in a new format, the
Co-operation with other organizations
Nine regional MoUs have been
established so far.
In order to provide co-operation
to these MoUs, they may apply for
observer status. Regional agreements
seeking observer status must
demonstrate that their Member
Authorities invest in training of
PSCOs, publish inspection data, have
a code of good practice, have been
granted official IGO-status at IMO
and have a similar approach in terms
of commitment and goals to that of
the Paris MoU.
Six regional agreements have
obtained official observer status to the
Paris MoU: the Tokyo MoU, Caribbean

17ANNUAL REPORT 2013
there are further ties with the Black
Sea MoU. Malta and Cyprus are also
members of the Mediterranean MoU.
The Netherlands and France have ties
to the Caribbean MoU. France is also
member of the Indian Ocean MoU.
performance of flags and Recognized
Organizations, a combined list of
flags targeted by the Paris MoU,
Tokyo MoU and USCG and the results
of the 2011 CIC on Structural Safety
and the International Convention on
Load Lines and information on the
improvement of flag performance were
submitted to the Sub-Committee on
Flag State Implementation.
Membership of the Paris MoU
In preparation for prospective new
members of the Paris MoU, the Port
State Control Committee has adopted
criteria for co-operating status for non-
member States and observer/associate
status for other PSC regions.
Specific criteria, including a self-
evaluation exercise, have to be met
before co-operating status can be
granted.
In 2011 the Maritime Authority of
Montenegro joined the MoU as a co-
operating member with the prospect
of becoming a full member in the
future.
The Paris MoU currently has 8
members with dual or even triple
membership: Canada and the
Russian Federation with the Tokyo
MoU, while the Russian Federation
is also a member of the Black Sea
MoU. With Bulgaria and Romania
18
PORT STATE CONTROL - CONSOLIDATING PROGRESS
Inspections
With a total number of 17,687
inspections performed in 2013 the
inspection figures showed a decrease
of 3% compared with the figures
of 2012. Each individual ship was
inspected an average of 1.3 times per
year, a rate which has been comparable
to that of 2012.
The drop in the number of inspections
that started with the introduction of
the New Inspection Regime in January
2011, has continued in 2012 and 2013.
New features of this inspections
regime are that the annual inspection
target for each Member State is based
on ship movement data rather than
individual ship calls. Also dedicated
quality shipping is awarded with longer
intervals between inspections. As
a result, the number of inspections
performed in the region has dropped,
but the detention rate increases.
that some ships are detained more
than once a year.
Compared with 2012, the number of
detentions has decreased by one from
669 to 668 detentions. The average
detention rate in 2013 is 3.78%. In
2012 the detention rate was 3.65%.
In 2011 the detention rate was 3.61%.
This is the third year that the average
detention rate has increased.
“White, Grey and Black List”
The “White, Grey and Black (WGB)
List” presents the full spectrum,
from quality flags to flags with a poor
performance that are considered
high or very high risk. It is based on
the total number of inspections and
detentions over a 3-year rolling period
for flags with at least 30 inspections in
the period.
On the “White, Grey and Black list”
for 2013 a total number of 75 flags are
Deficiencies
In 2011 the number of deficiencies
recorded was 50,738. In 2012 the
number of deficiencies was 49,261.
In 2013 the number of deficiencies
decreased further to 49,074.
During 58% of all inspections
performed, one or more deficiencies
were recorded. In 2012 this figure was
57%.
The average number of deficiencies
per inspection also increased from
2.7 in 2012 to 2.8 in 2013.
Detentions
Some deficiencies are clearly
hazardous to safety, health or the
environment and the ship is detained
until they are rectified. Detention
rates are expressed as a percentage
of the number of inspections, rather
than the number of individual ships
inspected to take account of the fact
Facts & Figures2013
In the following pages the facts and figures of 2013 are listed.
The trend that begun in 2011 when the New Inspection Regime
entered into force has continued. For the third year in a row the
inspection figures show a decrease in the number of inspections
but an increase in the detention rate.
19ANNUAL REPORT 2013
Ship type
In 2013 the top 5 detention rates were
for: general cargo/multipurpose ships
at 6.28% (up from 5.99% in 2012);
commercial yachts at 6.00% (not listed
in 2012), tugs at 5.88% (up from 3.39%
in 2012); refrigerated cargo ships at
5.25% (up from 4.23% in 2012) and
bulk carriers at 3.55% (up from 2.60%
in 2012). The remaining ship types
have lower detention rates and they
are similar to or lower than the 2012
detention rates.
Performance of Recognized
Organizations
For several years the Committee has
closely monitored the performance of
classification societies acting as ROs
for flags. To calculate the performance
of the Recognized Organizations, the
same formula to calculate the excess
factor of the flags is used. A minimum
number of 60 inspections per RO
are needed before the performance
listed: 46 on the “White List”, 19 on
the “Grey List” and 10 on the “Black
list”. In 2012 the number of flags
listed totalled 78 flags, namely 45 on
the “White List”, 19 on the “Grey List”
and 14 on the “Black List”.
The “White List” represents quality
flags with a consistently low detention
record. Compared with last year,
the number of flags on the “White
List” has increased by 1 flag to a
total number of 46 flags. New on the
“White List” are Kazakhstan, Saudi
Arabia and Switzerland, which last
year were on the “Grey List”.
France has been placed highest on
the list in terms of performance. The
next in line of the best performing
flags in 2013 are Norway, Sweden,
Denmark and Italy.
Flags with an average performance
are shown on the “Grey List”. Their
appearance on this list may act as an
incentive to improve and move to the
“White List”. At the same time flags at
the lower end of the “Grey List” should
be careful not to neglect control over
their ships and risk ending up on the
“Black List” next year.
On this year’s “Grey List” a total
number of 19 flags is recorded. Last
year the “Grey List” also recorded
19 flags. New on the “Grey List” are
Georgia, Lebanon, Saint Kitts and
Nevis, Libya and Albania, which last
year were on the “Black List”.
The poorest performing flags are
the United Republic of Tanzania,
Honduras, Dominica and Togo.
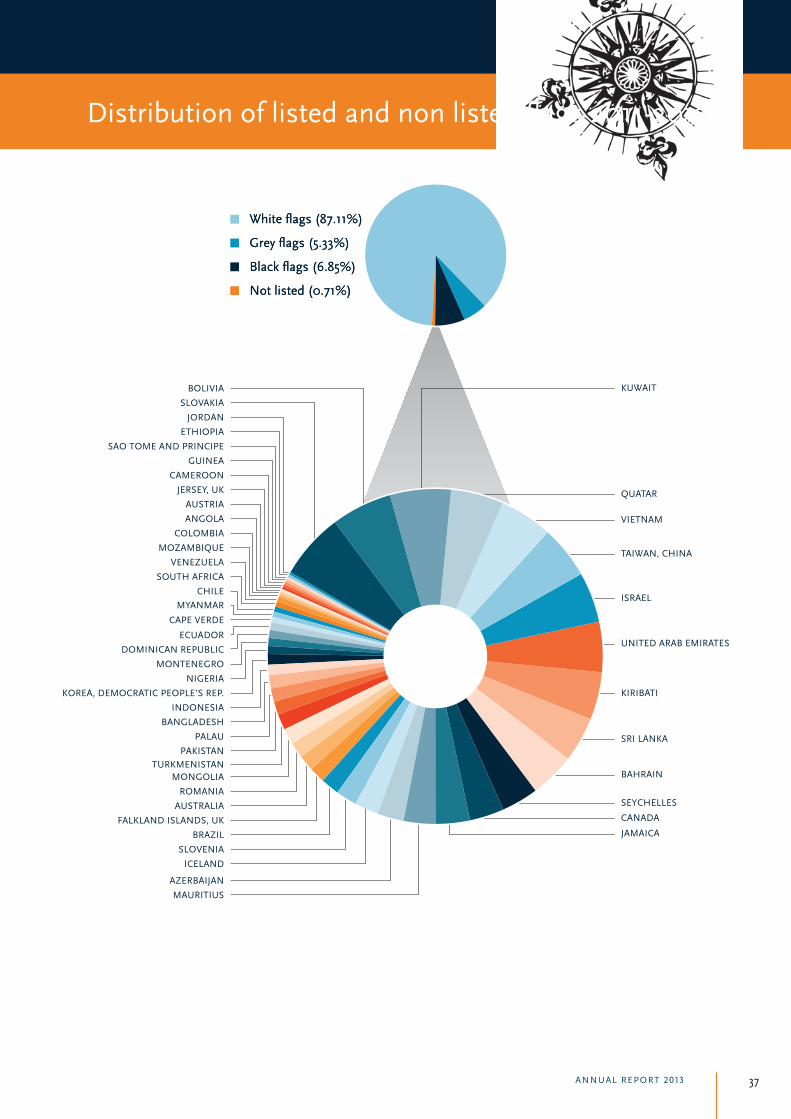
A graph of the distribution of listed
and not listed flags indicates that only
0.7% of the ships inspected are from
flags not listed on the WGB list.

PORT STATE CONTROL - CONSOLIDATING PROGRESS
is taken into account for the list. In
2013 36 ROs are recorded on the
performance list.
Among the best performing
Recognized Organizations were:
■ Lloyd’s Register (LR)
■ American Bureau of Shipping (ABS)
■ Det Norske Veritas (DNV)
The lowest performing Recognized
Organizations were:
■ INCLAMAR
■ Bulgarian Register of Shipping (BRS)
■ Universal Shipping Bureau Inc. (USB)
Compared with last year’s performance
level, a small shift in RO performance
Refusal of access of ships
A total of 28 ships were banned from
the Paris MoU region in 2013 for
reasons of multiple detentions (17),
failure to call at an indicated repair
yard (9) and jumping detention (2).
A number of ships remain banned
from previous years.
Deficiencies per major category
The number of deficiencies in
the following areas (certificate &
documentation, fire safety, safety
of navigation and working &
living conditions) accounted for
approximately 55% of the total number
of deficiencies. The trends in these
areas are clarified below.
in 2013 can be noticed. This year fewer
organisations have been placed in the
very low performing parts of the list
and more organisations have been
placed in the medium part of the list.
Details of the responsibility of
Recognized Organizations for
detainable deficiencies have been
published since 1999. When one
or more detainable deficiencies
are attributed to a Recognized
Organization in accordance with
the criteria, it is recorded “RO
responsible” and the RO is informed.
Out of 668 detentions recorded in
2013, 106 or 15.87% were considered
RO related.
20

21ANNUAL REPORT 2013
On 20 August 2013 the Maritime
Labour Convention 2006 entered into
force. Only Member States of the Paris
MoU that had ratified the MLC, 2006
on or before 20 August 2012 were
entitled to conduct PSC inspections
on MLC, 2006 requirements from 20
August 2013. For member States of
the Paris MoU that have not ratified
the MLC, 2006, enforcement of
the Merchant Shipping (Minimum
Standards) Convention (ILO 147)
and the protocol of 1996 to that
Convention (ILO P147) will initially
continue.
Management
The number of ISM related
deficiencies showed an increase
of 4.9% from 1,736 in 2012 to 1,821
in 2013.
Certificate & Documentation
The number of deficiencies recorded
as related to ships’ certificates, crew
certificates and documents showed a
decrease of 4.5% from 7,158 in 2012 to
6,836 in 2013.
Safety of navigation
In 2013, deficiencies in Safety of
Navigation accounted for 13.98% of
all deficiencies recorded (an increase
from 13.84% in 2012). The number of
deficiencies in Safety of Navigation
shows an increase of 0.7%, from 6,816
deficiencies in 2012 to 6,861 in 2013.
Fire safety
In 2013 deficiencies in fire safety
accounted for 13.57% of all deficiencies
recorded (a decrease from 15.20%
in 2012). The number of deficiencies
in this area decreased by 11.1% from
7,488 in 2012 to 6,657 in 2013.
Pollution prevention
Deficiencies in MARPOL Annex I
show a decrease of 5.9% in 2013
(1,060), compared with 2012 (1,127).
Deficiencies in MARPOL Annex IV
show an increase of 5.2% in 2013 (341),
compared with 2012 (324). Deficiencies
in MARPOL Annex VI show an increase
of 9.6% in 2013 (492), compared with
2012 (449).
Working and living conditions
In 2013, deficiencies in working and
living conditions accounted for 14.82%
of all deficiencies recorded (an increase
from 14.71% in 2012). Deficiencies
in working conditions (ILO P147)
decreased by 9.6% from 5,067 in 2012
to 4,579 in 2013. Deficiencies in living
conditions (ILO P147) decreased
by 10.8% from 2,182 in 2012 to 1,946
in 2013.
2
3ANNUAL REPORT 2013
Annual Report2013
Statistical Annexes
24
PORT STATE CONTROL - CONSOLIDATING PROGRESS
Basic port State control figures 2013
Number of individual ships inspected
Number ofinspections
25,000
20,000
15,000
10,000
5,000
02004 2005 2006 2007 2008 2009 2010 2011 2012 2013
20,31
621
,302
21,56
622
,877 24
,647
24,18
6
24,058
19,058
18,30
8
17,687
Number ofdetentions
1,600
1,400
1,200
1,000
800
600
400
200
02004 2005 2006 2007 2008 2009 2010 2011 2012 2013
1,187
9941,1
74 1,250
1,220
1,059
790
688669
668
16,000
14,000
12,000
10,000
8,000
6,000
4,000
2,000
02004 2005 2006 2007 2008 2009 2010 2011 2012 2013
12,53
813,
02413,
417
14,18
2 15,23
7
14,75
314
,762
15,26
8
14,646
14,10
8

25ANNUAL REPORT 2013
Number ofdeficiencies
90,000
80,000
70,000
60,000
50,000
40,000
30,000
20,000
10,000
02004 2005 2006 2007 2008 2009 2010 2011 2012 2013
64,113
62,434 66,14
2 74,71
3 83,75
1
71,911
64,698
50,73
8
49,26
1
49,074
Detentions in %of inspections
8.00%
7.00%
6.00%
5.00%
4.00%
3.00%
2.00%
1.00%
0.00%2004 2005 2006 2007 2008 2009 2010 2011 2012 2013
5.84%
4.67%
5.44%
5.46%
4.95%
4.38%
3.28% 3.6
1%3.6
5%3.7
8%
Note: The New Inspection Regime entered into force on the 1st of January 2011. Consequently the targeting of ships for
inspection has changed; inspection figures from 2011 onwards should not be compared to the ones from 2010 and before.
Note: The cut-off date for inspection data to be included in the Annual Report 2013 was 15 January 2014. Changes to
inspection data after this date have as a rule not been taken into account.
26
PORT STATE CONTROL - CONSOLIDATING PROGRESS
Inspection efforts 2013
HRS, SRS and LRS inspections per member state
Commitment
1,800
1,600
1,400
1,200
1,000
800
600
400
200
0
Belg
ium
Bulg
aria
Cana
da
Croa
tia
Cypr
us
Den
mar
k
Esto
nia
Finl
and
Fran
ce
Ger
man
y
Gre
ece
Icel
and
Irela
nd Italy
Latv
ia
Lith
uani
a
Mal
ta
Net
herla
nds
Nor
way
Pola
nd
Port
ugal
Rom
ania
Russ
ian
Fede
ratio
n
Slov
ania
Spai
n
Swed
en
Uni
ted
King
dom
High Risk Ship Inspection Standard Risk Ship Inspection Low Risk Ship Inspection Ship Risk Profile unknown
Belg
ium
Bulg
aria
Cana
da
Croa
tia
Cypr
us
Den
mar
k
Esto
nia
Finl
and
Fran
ce
Ger
man
y
Gre
ece
Icel
and
Irel
and
Ital
y
Latv
ia
Lith
uani
a
Mal
ta
Net
herla
nds
Nor
way
Pola
nd
Port
ugal
Rom
ania
Russ
ian
Fede
ratio
n
Slov
enia
Spai
n
Swed
en
Uni
ted
King
dom
1,800
1,600
1,400
1,200
1,000
800
600
400
200
0
Inspections
Commitment
1,00
1
516
873
201
100
360
141
272
1,27
4
1,27
2
1,01
7
61 287
1,37
7
204
156
190
1,48
6
607
366
400
747
765
184
1,51
3
340
1,46
9
1,24
4
318
756
257
234
539
330
316
1,34
5
1,26
6
793
73 283
1,35
3
454
361
180
1,68
2
658
523
629
454
731
206
1,55
6
657
1,53
5
CommitmentInspections relevant for commitment
27ANNUAL REPORT 2013
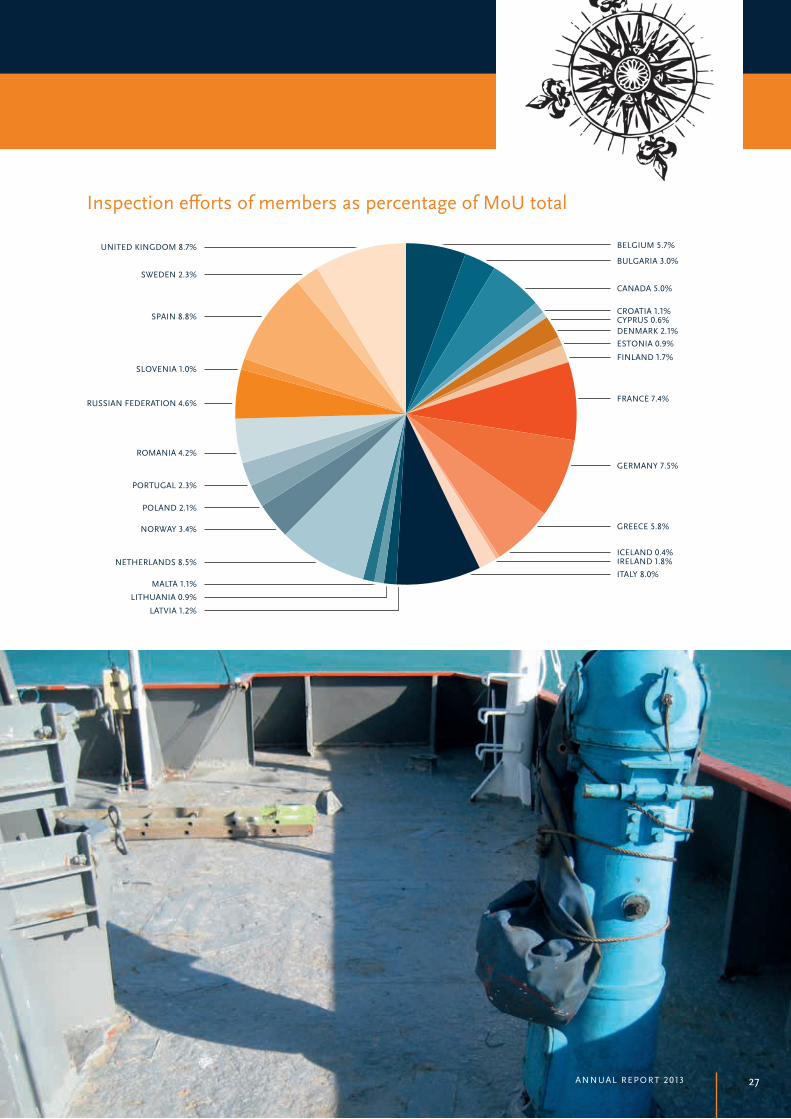
Inspection efforts of members as percentage of MoU total
BELGIUM 5.7%
SWEDEN 2.3%
SPAIN 8.8%
SLOVENIA 1.0%
RUSSIAN FEDERATION 4.6%
ROMANIA 4.2%
PORTUGAL 2.3%
POLAND 2.1%
NORWAY 3.4%
NETHERLANDS 8.5%
MALTA 1.1%
LITHUANIA 0.9%
LATVIA 1.2%
UNITED KINGDOM 8.7%
BULGARIA 3.0%
CANADA 5.0%
CROATIA 1.1%CYPRUS 0.6%DENMARK 2.1%ESTONIA 0.9%
FINLAND 1.7%
FRANCE 7.4%
GERMANY 7.5%
GREECE 5.8%
ICELAND 0.4%IRELAND 1.8%ITALY 8.0%

28
PORT STATE CONTROL - CONSOLIDATING PROGRESS
MoU port State
Tota
l nr o
f In
spec
tions
Insp
ectio
ns w
ith
defic
ienc
ies
Insp
ectio
ns w
ith
dete
ntio
ns
Insp
ectio
ns w
ith R
O
rela
ted
deta
inab
le
defic
ienc
ies
% In
spec
tions
with
de
ficie
ncie
s
% D
eten
tions
% In
spec
tion
of
MoU
tota
l
% H
RS
% S
RS
% L
SR
% S
RP U
nkno
wn
Belgium 1,003 687 21 3 68.50 2.10 5.70 1.30 78.20 17.10 3.40
Bulgaria 536 368 20 9 68.70 3.70 3.00 19.00 68.30 8.60 4.10
Canada 890 462 33 5 51.90 3.70 5.00 1.90 68.40 15.10 14.60
Croatia 200 125 13 3 62.50 6.50 1.10 19.00 70.50 5.50 5.00
Cyprus 100 60 8 1 60.00 8.00 0.60 9.00 83.00 6.00 2.00
Denmark 379 172 3 0 45.40 0.80 2.10 2.10 74.70 13.50 9.80
Estonia 151 57 1 0 37.70 0.70 0.90 1.30 76.80 17.20 4.60
Finland 294 82 3 0 27.90 1.00 1.70 1.00 81.60 16.30 1.00
France 1,305 770 41 3 59.00 3.10 7.40 4.10 73.80 18.30 3.80
Germany 1,325 661 29 3 49.90 2.20 7.50 1.10 71.80 22.90 4.20
Greece 1,027 718 49 7 69.90 4.80 5.80 18.50 68.80 4.90 7.80
Iceland 63 30 2 1 47.60 3.20 0.40 6.30 65.10 23.80 4.80
Ireland 313 212 23 2 67.70 7.30 1.80 4.80 75.70 18.20 1.30
Italy 1,420 866 131 24 61.00 9.20 8.00 7.90 78.00 7.50 6.60
Latvia 204 55 1 0 27.00 0.50 1.20 4.90 76.50 14.20 4.40
Lithuania 160 88 4 1 55.00 2.50 0.90 2.50 85.00 10.60 1.90
Malta 190 110 17 3 57.90 8.90 1.10 6.80 74.70 4.20 14.20
Netherlands 1,496 865 57 7 57.80 3.80 8.50 2.80 71.20 16.30 9.70
Norway 609 203 9 1 33.30 1.50 3.40 1.60 80.00 11.50 6.90
Poland 376 279 12 2 74.20 3.20 2.10 2.90 77.10 13.30 6.60
Portugal 400 164 9 2 41.00 2.30 2.30 5.00 77.50 13.00 4.50
Romania 747 444 16 2 59.40 2.10 4.20 24.60 64.80 4.80 5.80
Russian Federation1 822 621 37 3 75.50 4.50 4.60 19.80 70.80 6.40 2.90
Slovenia 185 118 12 3 63.80 6.50 1.00 7.00 81.10 8.60 3.20
Spain 1,554 959 63 14 61.70 4.10 8.80 4.50 79.10 9.30 7.10
Sweden 398 112 3 0 28.10 0.80 2.30 0.50 72.40 23.60 3.50
United Kingdom 1,540 1,043 51 7 67.70 3.30 8.70 2.70 74.30 16.40 6.60
Total 17,687 10,331 668 106 58.40 3.78 100.00 6.60 74.00 13.20 6.20
1 Only inspections in the Russian ports of the Baltic, Azov, Caspian and Barents Sea are included.
MoU port States’s individual contributions to the total amount of inspections

29ANNUAL REPORT 2013

1France
278
0
27
12
-1.92
2Norway
1,470
16
119
86
-1.79
3Sweden
476
4
43
24
-1.69
4Denmark
1,099 14
91
63
-1.68
5Italy
1,243
17
102
72
-1.66
6Hong Kong, China
1,583
23
128
94
-1.66
7United Kingdom
1,513
23
123
89
-1.62
8Finland
421
4
39
20
-1.61
9Germany
881 12
75
49
-1.61
10Croatia
147
0
16
5
-1.59
11Bahamas
2,414
42
190
148
-1.59
12Isle of Man, UK
677
9
59
36
-1.57
13Liberia
4,046
82
310
256
-1.53
14Singapore
1,367
26
112
80
-1.46
15Belgium
235
2
23
10
-1.42
16Greece
966
19
81
54
-1.38
17Marshall Islands
2,521
63
198
155
-1.31
18China
202
2
21
8
-1.26
19Netherlands
3,083
83
240
192
-1.26
20Iran, Islamic Republic of
92
0
11
2
-1.07
21Gibraltar, UK
885
24
75
49
-1.06
22Malta
4,426
149
338
281
-1.05
23Cyprus
1,940
64
155
117
-0.98
24Cayman Islands, UK
332
8
31
15
-0.87
25Barbados
356
9
33
17
-0.85
26United States of America
269
6
26
11
-0.84
27Latvia
75
0
9
1
-0.79
28Russian Federation
1,390
51
113
81
-0.79
29Estonia
74
0
9
1
-0.77
30Bermuda, UK
254
6
25
11
-0.76
31Japan
71
0
9
1
-0.71
32Korea, Republic of
103
1
12
2
-0.69
33Kazakhstan
69
0
9
1
-0.67
34Turkey
1,650
69
133
98
-0.64
35Saudi Arabia
65
0
8
1
-0.57
36Panama
6,238
305
470
403
-0.55
37Antigua and Barbuda
3,746
178
288
236
-0.55
38Faroe Islands, DK
241
7
24
10
-0.50
39Ireland
88
1
11
2
-0.42
40Philippines
198
6
20
7
-0.32
41Spain
210
7
21
8
-0.23
42Luxembourg
185
6
19
7
-0.18
43Poland
162
5
17
5
-0.14
44Switzerland
99
2
12
2
-0.13
45Lithuania
176
6
18
6
-0.06
30
PORT STATE CONTROL - CONSOLIDATING PROGRESS
1France
278
0
27
12
-1.92
2Norway
1,470
16
119
86
-1.79
3Sweden
476
4
43
24
-1.69
4Denmark
1,099 14
91
63
-1.68
5Italy
1,243
17
102
72
-1.66
6Hong Kong, China
1,583
23
128
94
-1.66
7United Kingdom
1,513
23
123
89
-1.62
8Finland
421
4
39
20
-1.61
9Germany
881 12
75
49
-1.61
10Croatia
147
0
16
5
-1.59
11Bahamas
2,414
42
190
148
-1.59
12Isle of Man, UK
677
9
59
36
-1.57
13Liberia
4,046
82
310
256
-1.53
14Singapore
1,367
26
112
80
-1.46
15Belgium
235
2
23
10
-1.42
16Greece
966
19
81
54
-1.38
17Marshall Islands
2,521
63
198
155
-1.31
18China
202
2
21
8
-1.26
19Netherlands
3,083
83
240
192
-1.26
20Iran, Islamic Republic of
92
0
11
2
-1.07
21Gibraltar, UK
885
24
75
49
-1.06
22Malta
4,426
149
338
281
-1.05
23Cyprus
1,940
64
155
117
-0.98
24Cayman Islands, UK
332
8
31
15
-0.87
25Barbados
356
9
33
17
-0.85
26United States of America
269
6
26
11
-0.84
27Latvia
75
0
9
1
-0.79
28Russian Federation
1,390
51
113
81
-0.79
29Estonia
74
0
9
1
-0.77
30Bermuda, UK
254
6
25
11
-0.76
31Japan
71
0
9
1
-0.71
32Korea, Republic of
103
1
12
2
-0.69
33Kazakhstan
69
0
9
1
-0.67
34Turkey
1,650
69
133
98
-0.64
35Saudi Arabia
65
0
8
1
-0.57
36Panama
6,238
305
470
403
-0.55
37Antigua and Barbuda
3,746
178
288
236
-0.55
38Faroe Islands, DK
241
7
24
10
-0.50
39Ireland
88
1
11
2
-0.42
40Philippines
198
6
20
7
-0.32
41Spain
210
7
21
8
-0.23
42Luxembourg
185
6
19
7
-0.18
43Poland
162
5
17
5
-0.14
44Switzerland
99
2
12
2
-0.13
45Lithuania
176
6
18
6
-0.06
31ANNUAL REPORT 2013
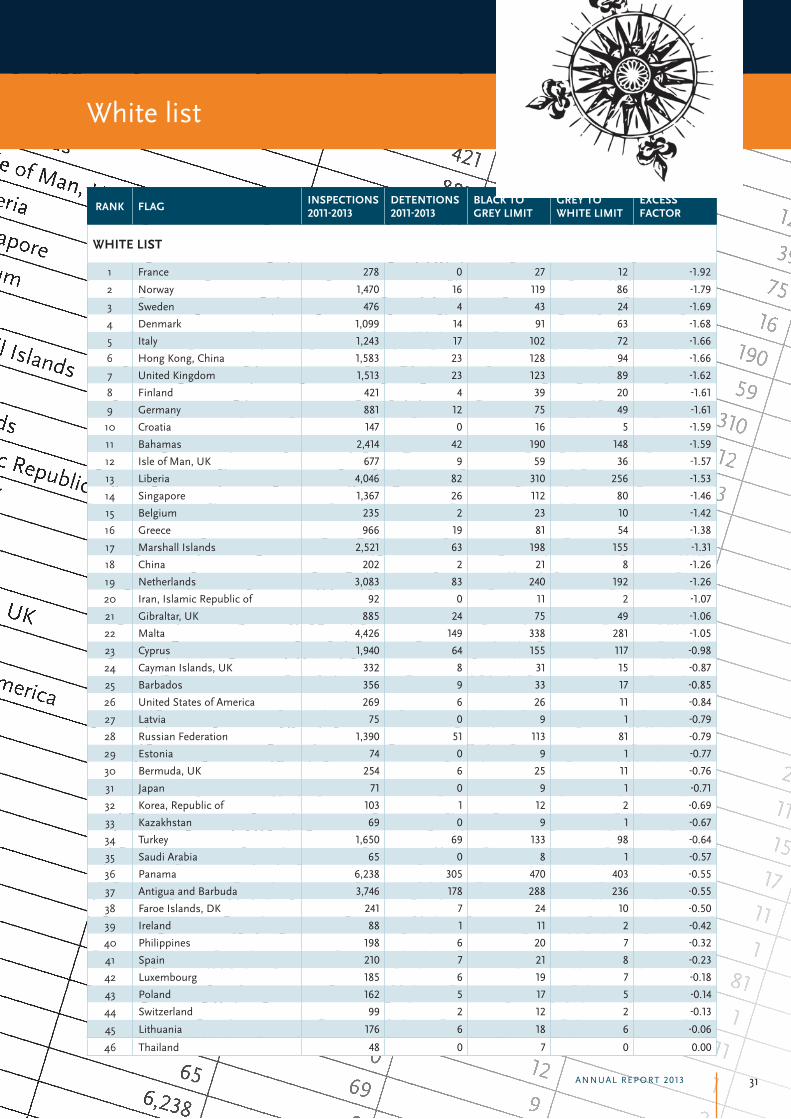
RANK FLAG INSPECTIONS 2011-2013
DETENTIONS 2011-2013
BLACK TO GREY LIMIT
GREY TO WHITE LIMIT
EXCESS FACTOR
WHITE LIST
1 France 278 0 27 12 -1.92
2 Norway 1,470 16 119 86 -1.79
3 Sweden 476 4 43 24 -1.69
4 Denmark 1,099 14 91 63 -1.68
5 Italy 1,243 17 102 72 -1.66
6 Hong Kong, China 1,583 23 128 94 -1.66
7 United Kingdom 1,513 23 123 89 -1.62
8 Finland 421 4 39 20 -1.61
9 Germany 881 12 75 49 -1.61
10 Croatia 147 0 16 5 -1.59
11 Bahamas 2,414 42 190 148 -1.59
12 Isle of Man, UK 677 9 59 36 -1.57
13 Liberia 4,046 82 310 256 -1.53
14 Singapore 1,367 26 112 80 -1.46
15 Belgium 235 2 23 10 -1.42
16 Greece 966 19 81 54 -1.38
17 Marshall Islands 2,521 63 198 155 -1.31
18 China 202 2 21 8 -1.26
19 Netherlands 3,083 83 240 192 -1.26
20 Iran, Islamic Republic of 92 0 11 2 -1.07
21 Gibraltar, UK 885 24 75 49 -1.06
22 Malta 4,426 149 338 281 -1.05
23 Cyprus 1,940 64 155 117 -0.98
24 Cayman Islands, UK 332 8 31 15 -0.87
25 Barbados 356 9 33 17 -0.85
26 United States of America 269 6 26 11 -0.84
27 Latvia 75 0 9 1 -0.79
28 Russian Federation 1,390 51 113 81 -0.79
29 Estonia 74 0 9 1 -0.77
30 Bermuda, UK 254 6 25 11 -0.76
31 Japan 71 0 9 1 -0.71
32 Korea, Republic of 103 1 12 2 -0.69
33 Kazakhstan 69 0 9 1 -0.67
34 Turkey 1,650 69 133 98 -0.64
35 Saudi Arabia 65 0 8 1 -0.57
36 Panama 6,238 305 470 403 -0.55
37 Antigua and Barbuda 3,746 178 288 236 -0.55
38 Faroe Islands, DK 241 7 24 10 -0.50
39 Ireland 88 1 11 2 -0.42
40 Philippines 198 6 20 7 -0.32
41 Spain 210 7 21 8 -0.23
42 Luxembourg 185 6 19 7 -0.18
43 Poland 162 5 17 5 -0.14
44 Switzerland 99 2 12 2 -0.13
45 Lithuania 176 6 18 6 -0.06
46 Thailand 48 0 7 0 0.00
White list

32
47India
106
3
12
3
0.04
48Tunisia
48
1
7
0
0.15
49Portugal
366
20
34
17
0.17
50Vanuatu
236
12
23
10
0.17
51Malaysia
61
2
8
0
0.20
52Bulgaria
58
2
8
0
0,22
53Curacao
262
16
26
11
0.34
54Syrian Arab Republic
42
2
6
0
0.35
55Egypt
69
4
9
1
0.40
56Morocco
65
4
8
1
0.43
57Ukraine
237
17
24
10
0.53
58Algeria
79
6
10
1
0.56
59Georgia
160
13
17
5
0.65
60Lebanon
81
7
10
1
0.66
61Saint Kitts and Nevis
307
24
29
14
0.66
62Libya
44
5
6
0
0.79
63Tuvalu
42
5
6
0
0.82
64Albania
117
13
13
3
0.98
65Belize
570
50
50
29
0.98
PORT STATE CONTROL - CONSOLIDATING PROGRESS

33ANNUAL REPORT 2013
47India
106
3
12
3
0.04
48Tunisia
48
1
7
0
0.15
49Portugal
366
20
34
17
0.17
50Vanuatu
236
12
23
10
0.17
51Malaysia
61
2
8
0
0.20
52Bulgaria
58
2
8
0
0,22
53Curacao
262
16
26
11
0.34
54Syrian Arab Republic
42
2
6
0
0.35
55Egypt
69
4
9
1
0.40
56Morocco
65
4
8
1
0.43
57Ukraine
237
17
24
10
0.53
58Algeria
79
6
10
1
0.56
59Georgia
160
13
17
5
0.65
60Lebanon
81
7
10
1
0.66
61Saint Kitts and Nevis
307
24
29
14
0.66
62Libya
44
5
6
0
0.79
63Tuvalu
42
5
6
0
0.82
64Albania
117
13
13
3
0.98
65Belize
570
50
50
29
0.98
RANK FLAG INSPECTIONS 2011-2013
DETENTIONS 2011-2013
BLACK TO GREY LIMIT
GREY TO WHITE LIMIT
EXCESS FACTOR
GREY LIST
47 India 106 3 12 3 0.04
48 Tunisia 48 1 7 0 0.15
49 Portugal 366 20 34 17 0.17
50 Vanuatu 236 12 23 10 0.17
51 Malaysia 61 2 8 0 0.20
52 Bulgaria 58 2 8 0 0.22
53 Curacao 262 16 26 11 0.34
54 Syrian Arab Republic 42 2 6 0 0.35
55 Egypt 69 4 9 1 0.40
56 Morocco 65 4 8 1 0.43
57 Ukraine 237 17 24 10 0.53
58 Algeria 79 6 10 1 0.56
59 Georgia 160 13 17 5 0.65
60 Lebanon 81 7 10 1 0.66
61 Saint Kitts and Nevis 307 24 29 14 0.66
62 Libya 44 5 6 0 0.79
63 Tuvalu 42 5 6 0 0.82
64 Albania 117 13 13 3 0.98
65 Belize 570 50 50 29 0.98
Grey list
66Cambodia
526
47
47
Medium
1.19
Risk1,00
428
42
39
1.20
67Saint Vincent and the Grenadines
1004
87
84
1,09
68Comoros
350
37
33
1,35
69Cook Islands
240
29
24
1,62
70Sierra Leone
355
42
33
1,73
71Moldova, Republic of
611
73
54
1,96
72Togo
282
37
27
MEDIUM TO HIGH RISK 2,00
73Dominica
103
18
12
2,59
74Honduras
30
7
5
2,65
75Tanzania, United Republic of
289
53
28
HIGH RISK 3,58
72Togo
231
35
23
2.50
77Tanzania, United Republic of
234
37
23
2.70
78Bolivia
39
10
6High Risk
3.66
34
PORT STATE CONTROL - CONSOLIDATING PROGRESS

35ANNUAL REPORT 2013
66Cambodia
526
47
47
Medium
1.19
Risk1,00
428
42
39
1.20
67Saint Vincent and the Grenadines
1004
87
84
1,09
68Comoros
350
37
33
1,35
69Cook Islands
240
29
24
1,62
70Sierra Leone
355
42
33
1,73
71Moldova, Republic of
611
73
54
1,96
72Togo
282
37
27
MEDIUM TO HIGH RISK 2,00
73Dominica
103
18
12
2,59
74Honduras
30
7
5
2,65
75Tanzania, United Republic of
289
53
28
HIGH RISK 3,58
72Togo
231
35
23
2.50
77Tanzania, United Republic of
234
37
23
2.70
78Bolivia
39
10
6High Risk
3.66
RANK FLAG INSPECTIONS 2011-2013
DETENTIONS 2011-2013
BLACK TO GREY LIMIT
GREY TOWHITE LIMIT
EXCESSFACTOR
BLACK LIST
66 Cambodia 526 47 47
MediumRisk
1.00
67 Saint Vincent and the Grenadines 1,004 87 84 1.09
68 Comoros 350 37 33 1.35
69 Cook Islands 240 29 24 1.62
70 Sierra Leone 355 42 33 1.73
71 Moldova, Republic of 611 73 54 1.96
72 Togo 282 37 27
Medium to High Risk
2.00
73 Dominica 103 18 12 2.59
74 Honduras 30 7 5 2.65
75 Tanzania, United Republic of 289 53 28 High Risk 3.58
Black list
36
PORT STATE CONTROL - CONSOLIDATING PROGRESS
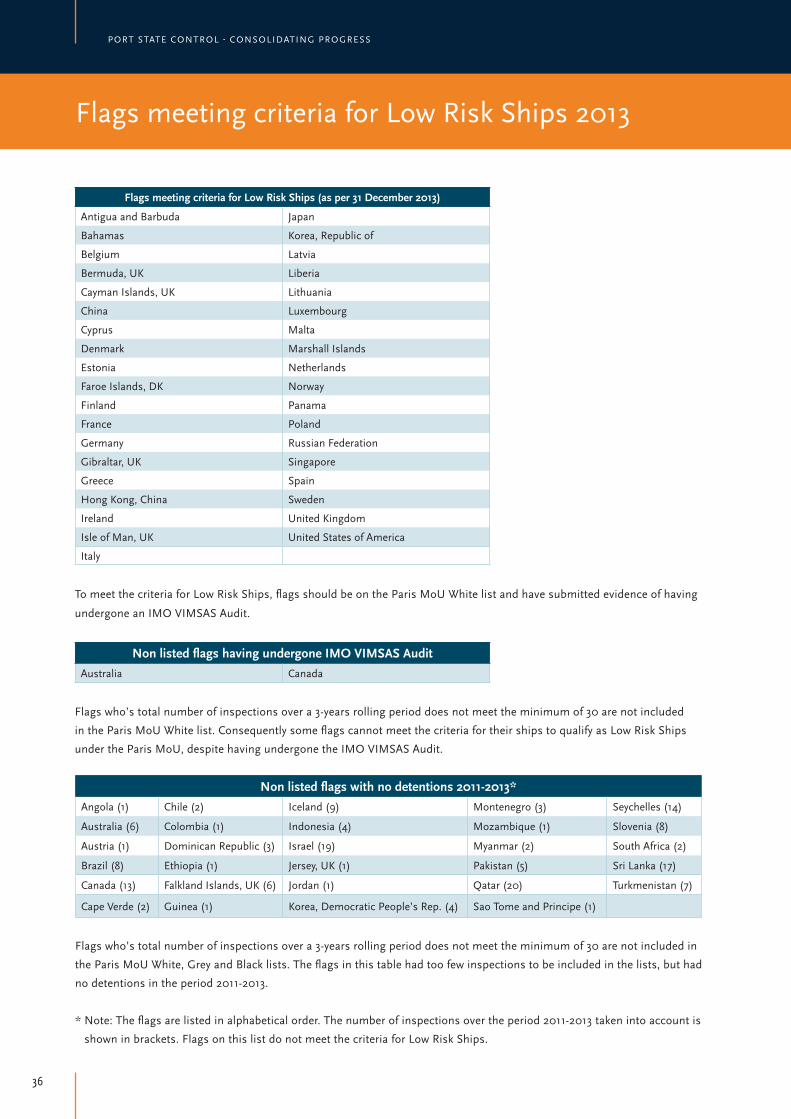
Flags meeting criteria for Low Risk Ships 2013
Flags meeting criteria for Low Risk Ships (as per 31 December 2013)
Antigua and Barbuda Japan
Bahamas Korea, Republic of
Belgium Latvia
Bermuda, UK Liberia
Cayman Islands, UK Lithuania
China Luxembourg
Cyprus Malta
Denmark Marshall Islands
Estonia Netherlands
Faroe Islands, DK Norway
Finland Panama
France Poland
Germany Russian Federation
Gibraltar, UK Singapore
Greece Spain
Hong Kong, China Sweden
Ireland United Kingdom
Isle of Man, UK United States of America
Italy
To meet the criteria for Low Risk Ships, flags should be on the Paris MoU White list and have submitted evidence of having
undergone an IMO VIMSAS Audit.
Non listed flags having undergone IMO VIMSAS AuditAustralia Canada
Flags who’s total number of inspections over a 3-years rolling period does not meet the minimum of 30 are not included
in the Paris MoU White list. Consequently some flags cannot meet the criteria for their ships to qualify as Low Risk Ships
under the Paris MoU, despite having undergone the IMO VIMSAS Audit.
Non listed flags with no detentions 2011-2013*Angola (1) Chile (2) Iceland (9) Montenegro (3) Seychelles (14)
Australia (6) Colombia (1) Indonesia (4) Mozambique (1) Slovenia (8)
Austria (1) Dominican Republic (3) Israel (19) Myanmar (2) South Africa (2)
Brazil (8) Ethiopia (1) Jersey, UK (1) Pakistan (5) Sri Lanka (17)
Canada (13) Falkland Islands, UK (6) Jordan (1) Qatar (20) Turkmenistan (7)
Cape Verde (2) Guinea (1) Korea, Democratic People’s Rep. (4) Sao Tome and Principe (1)
Flags who’s total number of inspections over a 3-years rolling period does not meet the minimum of 30 are not included in
the Paris MoU White, Grey and Black lists. The flags in this table had too few inspections to be included in the lists, but had
no detentions in the period 2011-2013.
* Note: The flags are listed in alphabetical order. The number of inspections over the period 2011-2013 taken into account is
shown in brackets. Flags on this list do not meet the criteria for Low Risk Ships.
37ANNUAL REPORT 2013
Distribution of listed and non listed flags 2011-2013
White flags (87.11%)
Grey flags (5.33%)
Black flags (6.85%)
Not listed (0.71%)
TAIWAN, CHINA
VIETNAM
QUATAR
KUWAIT
ISRAEL
UNITED ARAB EMIRATES
KIRIBATI
SRI LANKA
BAHRAIN
SEYCHELLES
CANADA
JAMAICA
SOUTH AFRICAVENEZUELA
MOZAMBIQUECOLOMBIA
ANGOLAAUSTRIA
JERSEY, UKCAMEROON
GUINEASAO TOME AND PRINCIPE
ETHIOPIAJORDAN
SLOVAKIABOLIVIA
BRAZILFALKLAND ISLANDS, UK
AUSTRALIAROMANIA
MONGOLIA
MAURITIUSAZERBAIJAN
ICELANDSLOVENIA
INDONESIABANGLADESH
PALAUPAKISTAN
TURKMENISTAN
KOREA, DEMOCRATIC PEOPLE’S REP.NIGERIA
MONTENEGRODOMINICAN REPUBLIC
ECUADOR
CAPE VERDE
CHILEMYANMAR
White flags (87.11%)
Grey flags (5.33%)
Black flags (6.85%)
Not listed (0.71%)
38
PORT STATE CONTROL - CONSOLIDATING PROGRESS
Flag
Nr o
f In
spec
tions
Insp
ectio
ns
with
de
ficie
ncie
s
Insp
ectio
ns
with
de
tent
ions
Nr o
f In
divi
dual
sh
ips
insp
ecte
d
% o
f In
spec
tions
w
ith
defic
ienc
ies
% o
f In
spec
tions
w
ith
dete
ntio
ns
Albania 31 30 4 13 96.80 12.90
Algeria 30 22 4 20 73.30 13.33
Antigua and Barbuda 1,182 764 48 802 64.60 4.06
Australia 2 1 0 2 50.00 0.00
Azerbaijan 1 1 0 1 100.00 0.00
Bahamas 736 394 12 584 53.50 1.63
Bahrain 4 3 1 3 75.00 25.00
Barbados 128 71 2 87 55.50 1.56
Belgium 65 35 0 58 53.80 0.00
Belize 197 167 22 149 84.80 11.17
Bermuda, UK 85 34 1 76 40.00 1.18
Bolivia 2 2 0 1 100.00 0.00
Brazil 1 1 0 1 100.00 0.00
Bulgaria 12 10 0 10 83.30 0.00
Cambodia 135 127 16 94 94.10 11.85
Cameroon 1 1 1 1 100.00 100.00
Canada 2 2 0 2 100.00 0.00
Cayman Islands,UK 111 54 3 107 48.60 2.70
China 71 38 0 65 53.50 0.00
Comoros 90 86 11 66 95.60 12.22
Cook Islands 107 88 18 75 82.20 16.82
Croatia 50 28 0 35 56.00 0.00
Curacao 68 55 5 51 80.90 7.35
Cyprus 649 361 26 489 55.60 4.01
Denmark 337 140 4 294 41.50 1.19
Dominica 23 19 4 16 82.60 17.39
Ecuador 1 1 0 1 100.00 0.00
Egypt 17 12 0 11 70.60 0.00
Estonia 21 5 0 16 23.80 0.00
Ethiopia 1 0 0 1 0.00 0.00
Falkland Islands, UK 2 1 0 2 50.00 0.00
Faroe Islands, DK 87 38 3 55 43.70 3.45
Finland 147 81 2 108 55.10 1.36
France 82 43 0 66 52.40 0.00
Georgia 2 2 0 1 100.00 0.00
Germany 251 136 5 209 54.20 1.99
Gibraltar, UK 282 152 5 211 53.90 1.77
Greece 290 140 9 256 48.30 3.10
Honduras 8 7 1 7 87.50 12.50
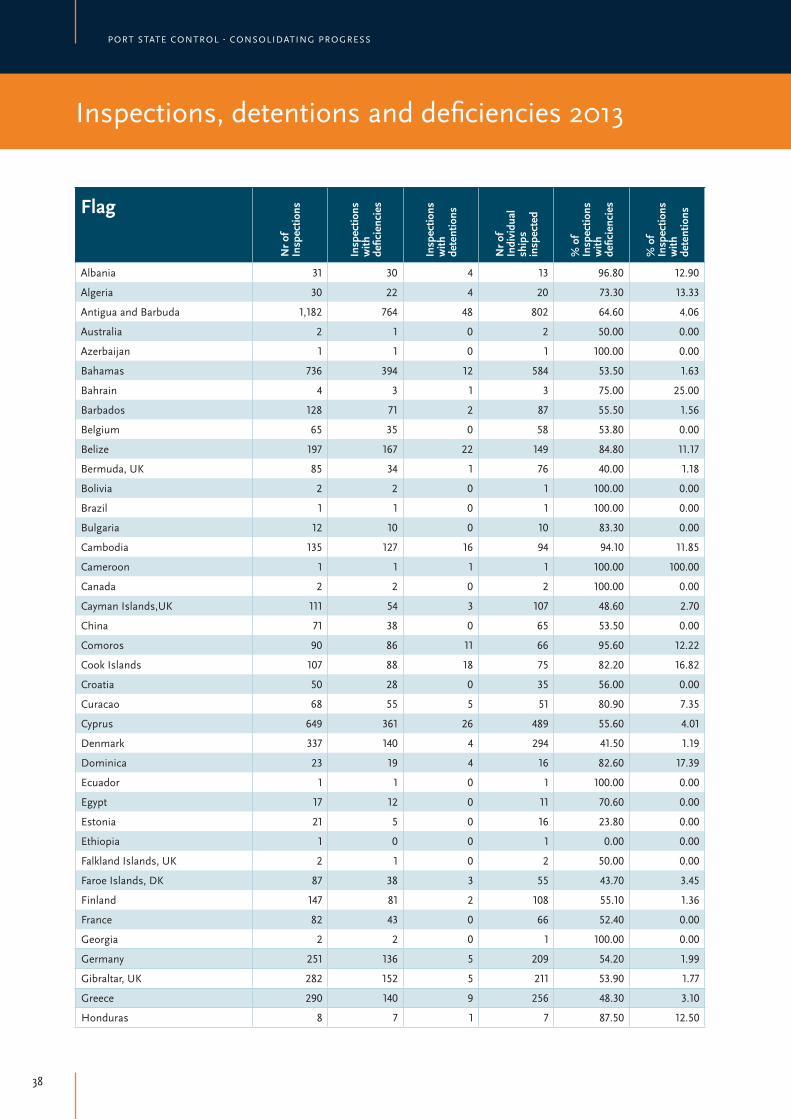
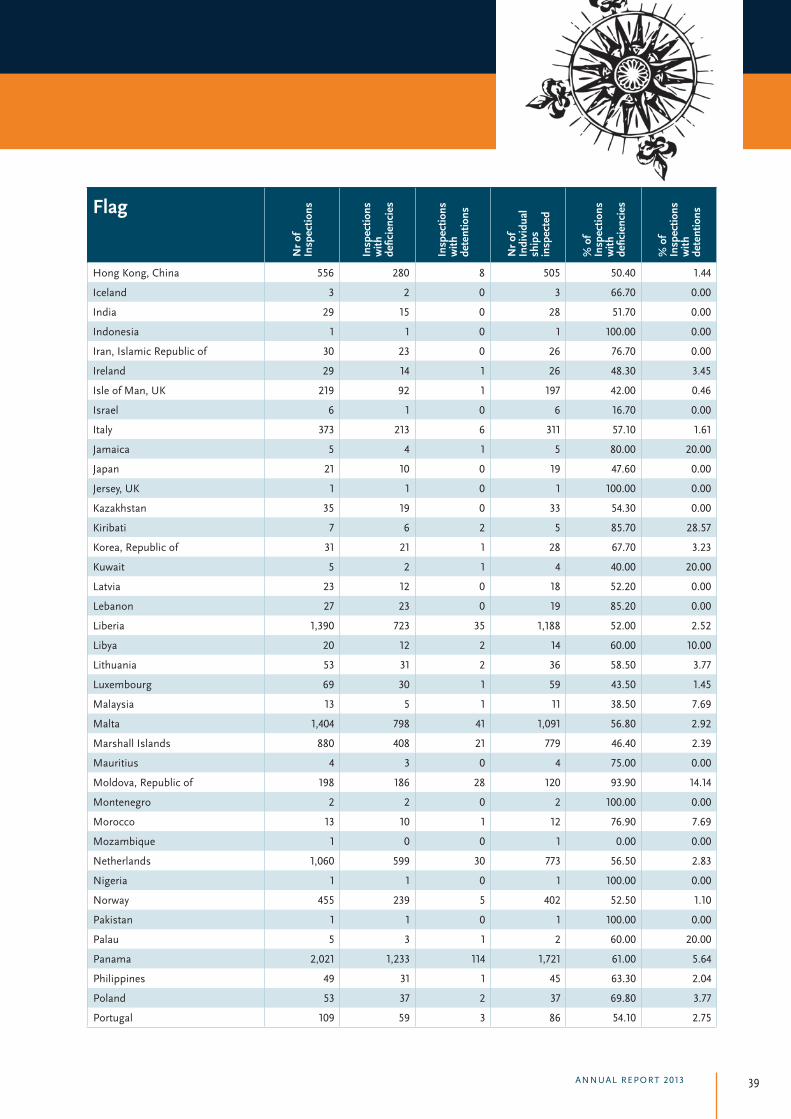
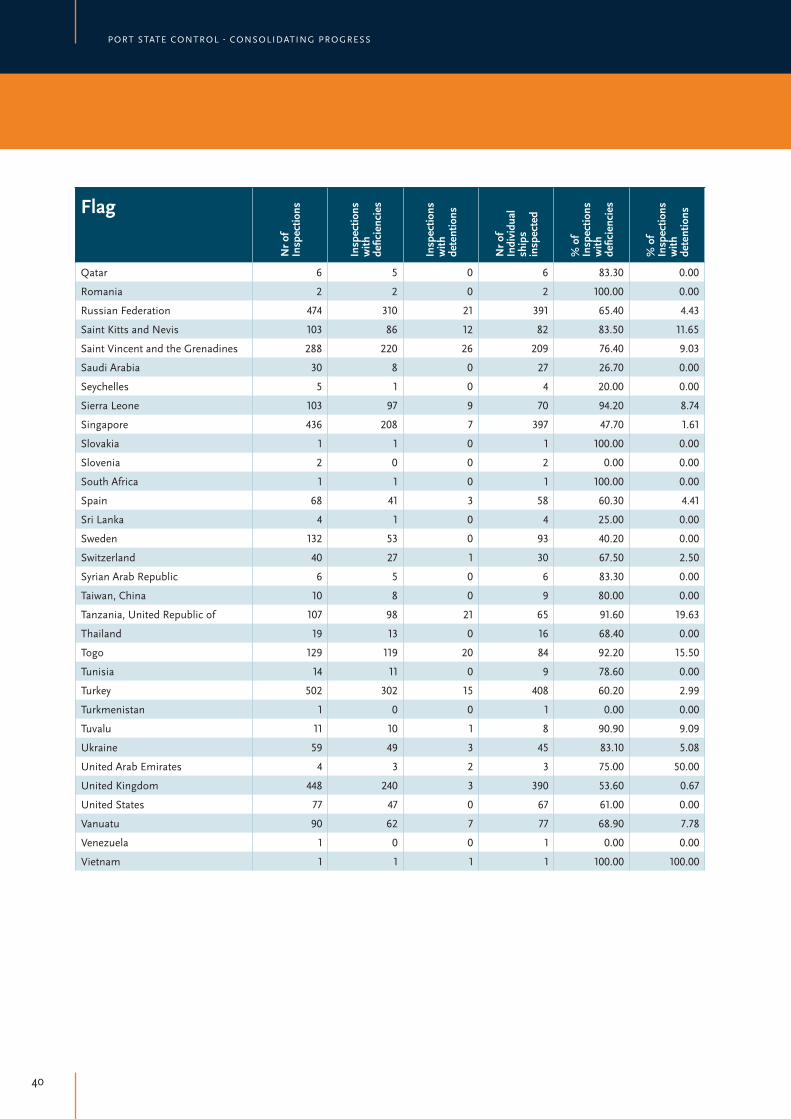
Inspections, detentions and deficiencies 2013
39ANNUAL REPORT 2013
Flag
Nr o
f In
spec
tions
Insp
ectio
ns
with
de
ficie
ncie
s
Insp
ectio
ns
with
de
tent
ions
Nr o
f In
divi
dual
sh
ips
insp
ecte
d
% o
f In
spec
tions
w
ith
defic
ienc
ies
% o
f In
spec
tions
w
ith
dete
ntio
ns
Hong Kong, China 556 280 8 505 50.40 1.44
Iceland 3 2 0 3 66.70 0.00
India 29 15 0 28 51.70 0.00
Indonesia 1 1 0 1 100.00 0.00
Iran, Islamic Republic of 30 23 0 26 76.70 0.00
Ireland 29 14 1 26 48.30 3.45
Isle of Man, UK 219 92 1 197 42.00 0.46
Israel 6 1 0 6 16.70 0.00
Italy 373 213 6 311 57.10 1.61
Jamaica 5 4 1 5 80.00 20.00
Japan 21 10 0 19 47.60 0.00
Jersey, UK 1 1 0 1 100.00 0.00
Kazakhstan 35 19 0 33 54.30 0.00
Kiribati 7 6 2 5 85.70 28.57
Korea, Republic of 31 21 1 28 67.70 3.23
Kuwait 5 2 1 4 40.00 20.00
Latvia 23 12 0 18 52.20 0.00
Lebanon 27 23 0 19 85.20 0.00
Liberia 1,390 723 35 1,188 52.00 2.52
Libya 20 12 2 14 60.00 10.00
Lithuania 53 31 2 36 58.50 3.77
Luxembourg 69 30 1 59 43.50 1.45
Malaysia 13 5 1 11 38.50 7.69
Malta 1,404 798 41 1,091 56.80 2.92
Marshall Islands 880 408 21 779 46.40 2.39
Mauritius 4 3 0 4 75.00 0.00
Moldova, Republic of 198 186 28 120 93.90 14.14
Montenegro 2 2 0 2 100.00 0.00
Morocco 13 10 1 12 76.90 7.69
Mozambique 1 0 0 1 0.00 0.00
Netherlands 1,060 599 30 773 56.50 2.83
Nigeria 1 1 0 1 100.00 0.00
Norway 455 239 5 402 52.50 1.10
Pakistan 1 1 0 1 100.00 0.00
Palau 5 3 1 2 60.00 20.00
Panama 2,021 1,233 114 1,721 61.00 5.64
Philippines 49 31 1 45 63.30 2.04
Poland 53 37 2 37 69.80 3.77
Portugal 109 59 3 86 54.10 2.75
40
PORT STATE CONTROL - CONSOLIDATING PROGRESS
Flag
Nr o
f In
spec
tions
Insp
ectio
ns
with
de
ficie
ncie
s
Insp
ectio
ns
with
de
tent
ions
Nr o
f In
divi
dual
sh
ips
insp
ecte
d
% o
f In
spec
tions
w
ith
defic
ienc
ies
% o
f In
spec
tions
w
ith
dete
ntio
ns
Qatar 6 5 0 6 83.30 0.00
Romania 2 2 0 2 100.00 0.00
Russian Federation 474 310 21 391 65.40 4.43
Saint Kitts and Nevis 103 86 12 82 83.50 11.65
Saint Vincent and the Grenadines 288 220 26 209 76.40 9.03
Saudi Arabia 30 8 0 27 26.70 0.00
Seychelles 5 1 0 4 20.00 0.00
Sierra Leone 103 97 9 70 94.20 8.74
Singapore 436 208 7 397 47.70 1.61
Slovakia 1 1 0 1 100.00 0.00
Slovenia 2 0 0 2 0.00 0.00
South Africa 1 1 0 1 100.00 0.00
Spain 68 41 3 58 60.30 4.41
Sri Lanka 4 1 0 4 25.00 0.00
Sweden 132 53 0 93 40.20 0.00
Switzerland 40 27 1 30 67.50 2.50
Syrian Arab Republic 6 5 0 6 83.30 0.00
Taiwan, China 10 8 0 9 80.00 0.00
Tanzania, United Republic of 107 98 21 65 91.60 19.63
Thailand 19 13 0 16 68.40 0.00
Togo 129 119 20 84 92.20 15.50
Tunisia 14 11 0 9 78.60 0.00
Turkey 502 302 15 408 60.20 2.99
Turkmenistan 1 0 0 1 0.00 0.00
Tuvalu 11 10 1 8 90.90 9.09
Ukraine 59 49 3 45 83.10 5.08
United Arab Emirates 4 3 2 3 75.00 50.00
United Kingdom 448 240 3 390 53.60 0.67
United States 77 47 0 67 61.00 0.00
Vanuatu 90 62 7 77 68.90 7.78
Venezuela 1 0 0 1 0.00 0.00
Vietnam 1 1 1 1 100.00 100.00
41ANNUAL REPORT 2013

42
PORT STATE CONTROL - CONSOLIDATING PROGRESS
Flag
Nr o
f In
spec
tions
Insp
ectio
ns
with
de
tent
ions
% o
f In
spec
tions
w
ith
dete
ntio
ns
Exce
ss o
f av
erag
e 20
13
Det
entio
ns %
20
12
Exce
ss o
f av
erag
e 20
12
Cyprus 649 26 4.01 0.23 3.80 0.14
Antigua and Barbuda 1,182 48 4.06 0.28 5.46 1.80
Spain 68 3 4.41 0.63 5.97 2.32
Russian Federation 474 21 4.43 0.65 4.21 0.56
Ukraine 59 3 5.08 1.30 4.88 1.22
Panama 2,021 114 5.64 1.86 4.69 1.03
Curacao 68 5 7.35 3.57 4.71 1.05
Vanuatu 90 7 7.78 4.00 4.35 0.69
Sierra Leone 103 9 8.74 4.96 11.54 7.88
Saint Vincent and the Grenadines 288 26 9.03 5.25 7.45 3.80
Libya 20 2 10.00 6.22 0.00 -3.65
Belize 197 22 11.17 7.39 7.85 4.20
Saint Kitts and Nevis 103 12 11.65 7.87 3.88 0.23
Cambodia 135 16 11.85 8.07 7.43 3.77
Comoros 90 11 12.22 8.44 13.11 9.46
Albania 31 4 12.90 9.12 4.76 1.11
Algeria 30 4 13.33 9.55 4.35 0.69
Moldova, Republic of 198 28 14.14 10.36 11.98 8.33
Togo 129 20 15.50 11.72 9.88 6.22
Cook Islands 107 18 16.82 13.04 9.21 5.56
Dominica 23 4 17.39 13.61 17.14 13.49
Tanzania, United Republic of 107 21 19.63 15.85 14.53 10.88
Only flags with 20 and more port State control inspections in 2013 and with a detention percentage exceeding the average
percentage of 3.78% are recorded in this graph.
2013 detentions per flag, exceeding average percentage

43ANNUAL REPORT 2013
2013 detentions per flag, exceeding average percentage
■ Only flags with 20 and more port State control inspections in 2013 and with a detention percentage exceeding the average
percentage of 3.78% are recorded in this graph. In 2012 the average detentions percentage was 3.65%.
■ The grey column represents the 2013 average detention percentage (3.78%).
2013 detentions per flag, exceeding average percentage
Cyprus
Antigua and Barbuda
Spain
Russian Federation
Ukraine
Panama
Curacao
Vanuatu
Sierra Leone
Saint Vincent and the Grenadines
Libya
Belize
Saint Kitts and Nevis
Cambodia
Comoros
Albania
Algeria
Moldova, Republic of
Togo
Cook Islands
Dominica
Tanzania, United Republic of
0.00 5.00 10.00 15.00 20.00 25.00
Detention percentage 2013
Detention percentage 2012
Average dentention % 2013

44
PORT STATE CONTROL - CONSOLIDATING PROGRESS
Inspections and detentions 2013 PER SHIP TYPE
Ship type
Nr o
f Ins
pect
ions
Insp
ectio
ns w
ith
defic
ienc
ies
% o
f ins
pect
ions
w
ith d
efici
enci
es
Nr o
f Ind
ivid
ual
ship
s in
spec
ted
Insp
ectio
ns w
ith
dete
ntio
ns
% o
f det
entio
ns
to in
spec
tions
20
13
% o
f det
entio
ns
to in
spec
tions
20
12
% o
f det
entio
ns
to in
spec
tions
20
11
+ /
- ave
rage
de
tent
ion
3.78
%
Bulk carrier 3,237 1,851 57 2,814 115 3.55 2.60 3.25 -0.23
Chemical tanker 1,408 713 51 1,173 24 1.70 1.67 1.47 -2.08
Combination carrier 10 3 30 9 - 0.00 0.00 0.00 -3.78
Commercial yacht 50 32 64 48 3 6.00 0.00 0.00 2.22
Container 1,839 943 51 1,498 47 2.56 2.62 1.40 -1.22
Gas carrier 385 175 45 333 6 1.56 1.10 1.12 -2.22
General cargo/multipurpose 5,745 3,932 68 4,020 361 6.28 5.99 6.02 2.50
Heavy load 36 26 72 33 1 2.78 9.68 0.00 -1.00
High speed passenger craft 71 50 70 43 1 1.41 2.86 1.32 -2.37
NLS tanker 69 22 32 59 - 0.00 0.00 2.17 -3.78
Offshore supply 462 258 56 428 5 1.08 2.12 2.16 -2.70
Oil tanker 1,161 477 41 1,061 18 1.55 1.21 1.28 -2.23
Other 153 123 80 121 8 5.23 5.50 5.97 1.45
Other special activities 776 436 56 712 18 2.32 4.34 4.08 -1.46
Passenger ship 340 194 57 250 2 0.59 1.72 4.42 -3.19
Refrigerated cargo 343 221 64 277 18 5.25 4.23 4.12 1.47
Ro-Ro cargo 760 388 51 651 22 2.89 3.64 2.52 -0.89
Ro-Ro passenger ship 509 293 58 281 6 1.18 1.83 1.70 -2.60
Special purpose ship 129 66 51 118 1 0.78 1.68 1.68 -3.00
Tug 204 128 63 179 12 5.88 3.39 3.33 2.10
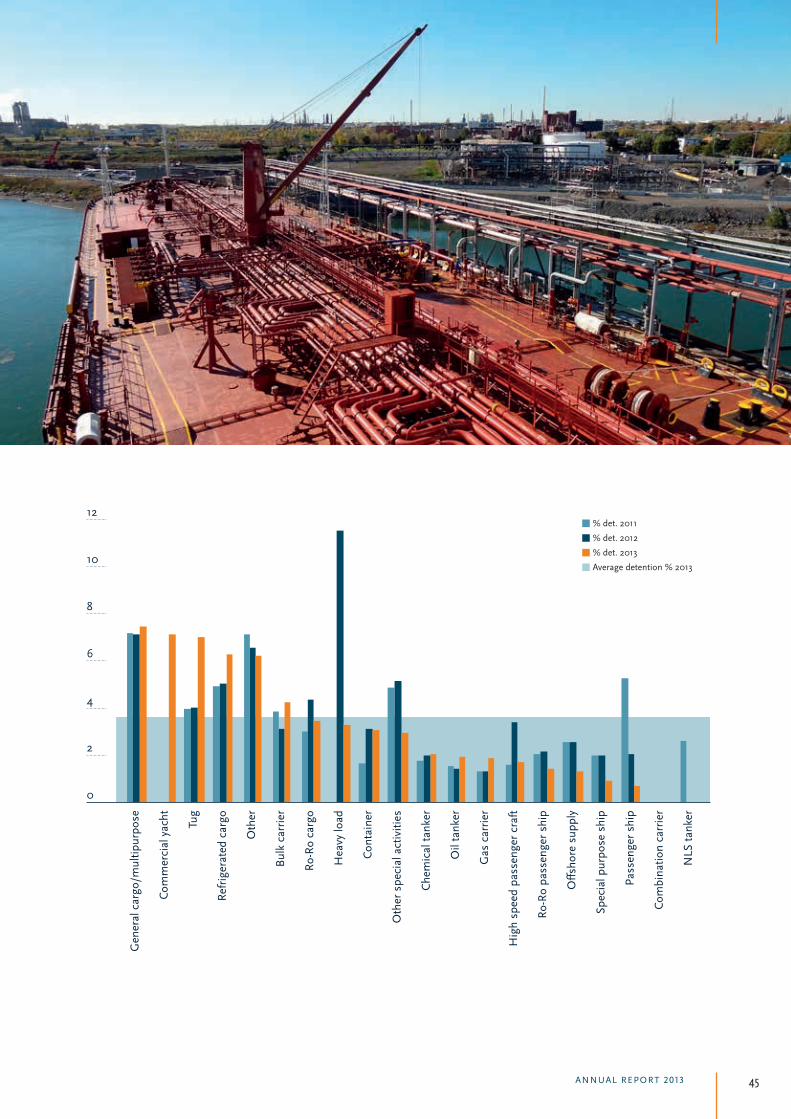
45ANNUAL REPORT 2013
12
10
8
6
4
2
0
% det. 2011
% det. 2012
% det. 2013
Average detention % 2013
Gen
eral
car
go/m
ultip
urpo
se
Com
mer
cial
yac
ht
Tug
Refr
iger
ated
car
go
Oth
er
Bulk
car
rier
Ro-R
o ca
rgo
Hea
vy lo
ad
Cont
aine
r
Oth
er s
peci
al a
ctiv
ities
Che
mic
al ta
nker
Oil
tank
er
Gas
car
rier
Hig
h sp
eed
pass
enge
r cra
ft
Ro-R
o pa
ssen
ger s
hip
Offs
hore
sup
ply
Spec
ial p
urpo
se s
hip
Pass
enge
r shi
p
Com
bina
tion
carr
ier
NLS
tank
er

46
PORT STATE CONTROL - CONSOLIDATING PROGRESS
Major categories of deficiencies 2011-2013
2011 2012 2013
Deficiencies Main Group Category of deficiencies Def Def % Def Def % Def Def %
Certificates & Documentation
Crew Certificates 1,101 2.15 1,005 2.04 1,013 2.06
Documents 3,491 6.83 3,297 6.69 3,069 6.25
Ship Certificates 3,046 5.96 2,856 5.80 2,754 5.61
Structural Condition 2,808 5.49 2,216 4.50 2,202 4.49
Water/Weathertight condition 2,597 5.08 2,121 4.31 2,111 4.30
Emergency Systems 1,952 3.82 2,029 4.12 2,184 4.45
Radio Communication 1,704 3.33 1,476 3.00 1,301 2.65
Cargo operations including equipment 332 0.65 319 0.65 329 0.67
Fire safety 6,591 12.89 7,488 15.20 6,657 13.57
Alarms 464 0.91 398 0.81 490 1.00
Working and Living Conditions (ILO 147)**
Living Conditions 2,313 4.52 2,182 4.43 1,946 3.97
Working conditions 5,252 10.27 5,067 10.29 4,579 9.33
Working and Living Conditions (MLC, 2006)*
MLC, 2006 Title 1 14 0.03
MLC, 2006 Title 2 88 0.18
MLC, 2006 Title 3 258 0.53
MLC, 2006 Title 4 390 0.79
Safety of Navigation 6,528 12.76 6,816 13.84 6,861 13.98
Life saving appliances 4,782 9.35 4,393 8.92 4,526 9.22
Dangerous goods 125 0.24 98 0.20 100 0.20
Propulsion and auxiliary machinery 2,951 5.77 2,442 4.96 2,710 5.52
Pollution prevention
Anti Fouling 15 0.03 23 0.05 25 0.05
Marpol Annex I 1,318 2.58 1,127 2.29 1,060 2.16
Marpol Annex II 36 0.07 29 0.06 30 0.06
Marpol Annex III 18 0.04 12 0.02 9 0.02
Marpol Annex IV 253 0.49 324 0.66 341 0.69
Marpol Annex V 347 0.68 303 0.62 889 1.81
Marpol Annex VI 358 0.70 449 0.91 492 1.00
ISM 1,644 3.21 1,736 3.52 1,821 3.71
ISPS 518 1.01 485 0.98 401 0.82
Other 602 1.18 570 1.16 424 0.86
* On 20 August 2013 the Maritime Labour Convention 2006 entered into force. Only Member States of the Paris MoU
that had ratified the MLC, 2006 on or before 20 August 2012 were entitled to conduct PSC inspections on MLC,2006
requirements from 20 August 2013.
** For Member States of the Paris MoU that have not ratified the MLC, 2006, enforcement of the Merchant Shipping
Convention (ILO 147) and the protocol of 1996 to the Merchant Shipping Convention (ILO P147) will initially continue.

47ANNUAL REPORT 2013
Major categories of deficiencies 2011-2013
Top 5 categories of deficiencies 2013
Category of deficiencies Deficiencies % Deficiencies
Safety of Navigation 6,861 13.98
Fire safety 6,657 13.57
Working and Living Conditions - Working Conditions 4,579 9.33
Life saving appliances 4,526 9.22
Certificates and Documentation - Document 3,069 6.25
Top 5 deficiencies 2013
Deficiencies Deficiencies % Deficiencies
ISM 1,821 3.71
Nautical publications 1,432 2.92
Charts 1,401 2.85
Fire doors/openings in fire-resisting divisions 1,106 2.25
Oil record book 753 1.53
Top 5 deficiencies MLC, 2006 2013
MLC deficiencies top 5 Deficiencies % Deficiencies
Electrical 66 0.13
Access / structural features (ship) 44 0.09
Sanitary Facilities 38 0.08
Cold room, cold room cleanliness, cold room temperature 36 0.07
Personal equipment 30 0.06
Top 5 detainable deficiencies MLC, 2006 2013
MLC detainable deficiencies top 5 Deficiencies % Deficiencies
Wages 10 0.02
Calculation and payment of wages 7 0.01
Fitness for duty - work and rest hours 5 0.01
Provisions quantity 4 0.01
Sanitary Facilities 2 0.00
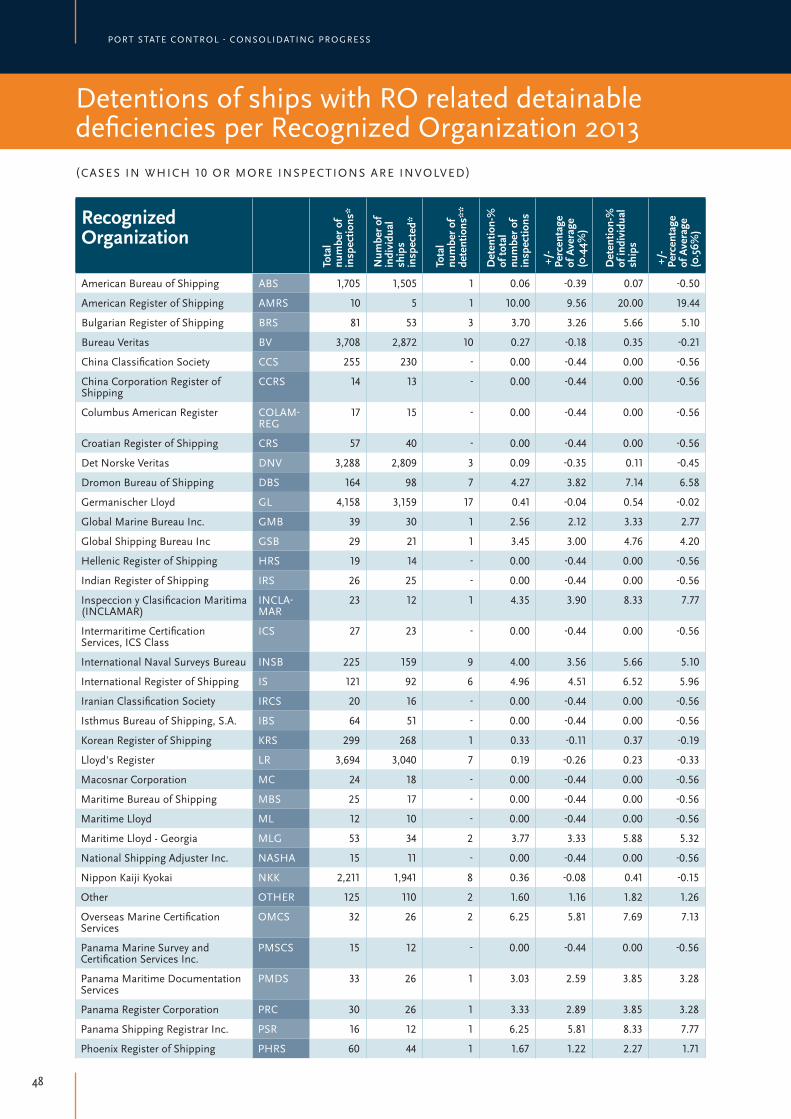
48
PORT STATE CONTROL - CONSOLIDATING PROGRESS
Recognized Organization
Tota
l nu
mbe
r of
insp
ectio
ns*
Num
ber o
f in
divi
dual
sh
ips
insp
ecte
d*
Tota
l nu
mbe
r of
dete
ntio
ns**
Det
entio
n-%
of
tota
l nu
mbe
r of
insp
ectio
ns
+/-
Pe
rcen
tage
of
Ave
rage
(0
.44%
)
Det
entio
n-%
of
indi
vidu
al
ship
s
+/-
Pe
rcen
tage
of
Ave
rage
(0
.56%
)
American Bureau of Shipping ABS 1,705 1,505 1 0.06 -0.39 0.07 -0.50
American Register of Shipping AMRS 10 5 1 10.00 9.56 20.00 19.44
Bulgarian Register of Shipping BRS 81 53 3 3.70 3.26 5.66 5.10
Bureau Veritas BV 3,708 2,872 10 0.27 -0.18 0.35 -0.21
China Classification Society CCS 255 230 - 0.00 -0.44 0.00 -0.56
China Corporation Register of Shipping
CCRS 14 13 - 0.00 -0.44 0.00 -0.56
Columbus American Register COLAM-REG
17 15 - 0.00 -0.44 0.00 -0.56
Croatian Register of Shipping CRS 57 40 - 0.00 -0.44 0.00 -0.56
Det Norske Veritas DNV 3,288 2,809 3 0.09 -0.35 0.11 -0.45
Dromon Bureau of Shipping DBS 164 98 7 4.27 3.82 7.14 6.58
Germanischer Lloyd GL 4,158 3,159 17 0.41 -0.04 0.54 -0.02
Global Marine Bureau Inc. GMB 39 30 1 2.56 2.12 3.33 2.77
Global Shipping Bureau Inc GSB 29 21 1 3.45 3.00 4.76 4.20
Hellenic Register of Shipping HRS 19 14 - 0.00 -0.44 0.00 -0.56
Indian Register of Shipping IRS 26 25 - 0.00 -0.44 0.00 -0.56
Inspeccion y Clasificacion Maritima (INCLAMAR)
INCLA-MAR
23 12 1 4.35 3.90 8.33 7.77
Intermaritime Certification Services, ICS Class
ICS 27 23 - 0.00 -0.44 0.00 -0.56
International Naval Surveys Bureau INSB 225 159 9 4.00 3.56 5.66 5.10
International Register of Shipping IS 121 92 6 4.96 4.51 6.52 5.96
Iranian Classification Society IRCS 20 16 - 0.00 -0.44 0.00 -0.56
Isthmus Bureau of Shipping, S.A. IBS 64 51 - 0.00 -0.44 0.00 -0.56
Korean Register of Shipping KRS 299 268 1 0.33 -0.11 0.37 -0.19
Lloyd's Register LR 3,694 3,040 7 0.19 -0.26 0.23 -0.33
Macosnar Corporation MC 24 18 - 0.00 -0.44 0.00 -0.56
Maritime Bureau of Shipping MBS 25 17 - 0.00 -0.44 0.00 -0.56
Maritime Lloyd ML 12 10 - 0.00 -0.44 0.00 -0.56
Maritime Lloyd - Georgia MLG 53 34 2 3.77 3.33 5.88 5.32
National Shipping Adjuster Inc. NASHA 15 11 - 0.00 -0.44 0.00 -0.56
Nippon Kaiji Kyokai NKK 2,211 1,941 8 0.36 -0.08 0.41 -0.15
Other OTHER 125 110 2 1.60 1.16 1.82 1.26
Overseas Marine Certification Services
OMCS 32 26 2 6.25 5.81 7.69 7.13
Panama Marine Survey and Certification Services Inc.
PMSCS 15 12 - 0.00 -0.44 0.00 -0.56
Panama Maritime Documentation Services
PMDS 33 26 1 3.03 2.59 3.85 3.28
Panama Register Corporation PRC 30 26 1 3.33 2.89 3.85 3.28
Panama Shipping Registrar Inc. PSR 16 12 1 6.25 5.81 8.33 7.77
Phoenix Register of Shipping PHRS 60 44 1 1.67 1.22 2.27 1.71
Detentions of ships with RO related detainable deficiencies per Recognized Organization 2013(CASES IN WHICH 10 OR MORE INSPECTIONS ARE INVOLVED)

ANNUAL REPORT 2013 49
Detentions of ships with RO related detainable deficiencies per Recognized Organization 2013
Recognized Organization
Tota
l nu
mbe
r of
insp
ectio
ns*
Num
ber o
f in
divi
dual
sh
ips
insp
ecte
d*
Tota
l nu
mbe
r of
dete
ntio
ns
** Det
entio
n-%
of
tota
l nu
mbe
r of
insp
ectio
ns
+/-
Pe
rcen
tage
of
Ave
rage
(0
,44%
)
Det
entio
n-%
of
indi
vidu
al
ship
s
+/-
Pe
rcen
tage
of
Ave
rage
(0
,56%
)
Polski Rejestr Statkow (Polish Register of Shipping)
PRS 132 95 - 0.00 -0.44 0.00 -0.56
Register of Shipping (Albania) RSA 31 13 - 0.00 -0.44 0.00 -0.56
Registro Italiano Navale RINA 982 764 4 0.41 -0.04 0.52 -0.04
Russian Maritime Register of Shipping
RMRS 1,349 1,042 4 0.30 -0.15 0.38 -0.18
Shipping Register of Ukraine SRU 200 128 3 1.50 1.06 2.34 1.78
Turkish Lloyd TL 245 195 1 0.41 -0.04 0.51 -0.05
Universal Shipping Bureau Inc. USB 49 38 4 8.16 7.72 10.53 9.96
Venezuelan Register of Shipping VRS 67 43 3 4.48 4.03 6.98 6.42
* As more than one Recognized Organization might have issued or endorsed statutory certificates with regard to the same
ship, an inspection can be relevant for more than one RO and might appear multiple times in this column.
** Only detentions with RO related detainable deficiencies are taken into account.
* Only ROs with 10 and more port State control inspections in 2013 and with a detention percentage exceeding the average
percentage of 0.44% are recorded in this graph. In 2012 the average detentions percentage was also 0.44%.
* The grey column represents the 2013 average detention percentage (0.44%).
% of detentions of ships with RO related detainable deficiencies per Recognized Organization 2012-2013(CASES IN WHICH MORE THAN 10 INSPECTIONS ARE INVOLVED )
Shipping Register of Ukraine
Other
Phoenix Register of Shipping
Global Marine Bureau Inc.
Panama Maritime Documentation Services
Panama Register Corporation
Global Shipping Bureau Inc.
Bulgarian Register of Shipping
Maritime Lloyd - Georgia
International Naval Surveys Bureau
Dromon Bureau of Shipping
Inspeccion y Clasificacion Maritima (INCLAMAR)
Venezuelan Register of Shipping
International Register of Shipping
Panama Shipping Registrar Inc.
Overseas Marine Certification Services
Universal Shipping Bureau Inc.
American Register of Shipping
-2% 0% 2% 4% 6% 8% 10% 12% 14% 16%
Average detention percentage 2013 (0.44%)
+/- Percentage of Average 2012 (0.44%)
+/- Percentage of Average 2013 (0.44%)
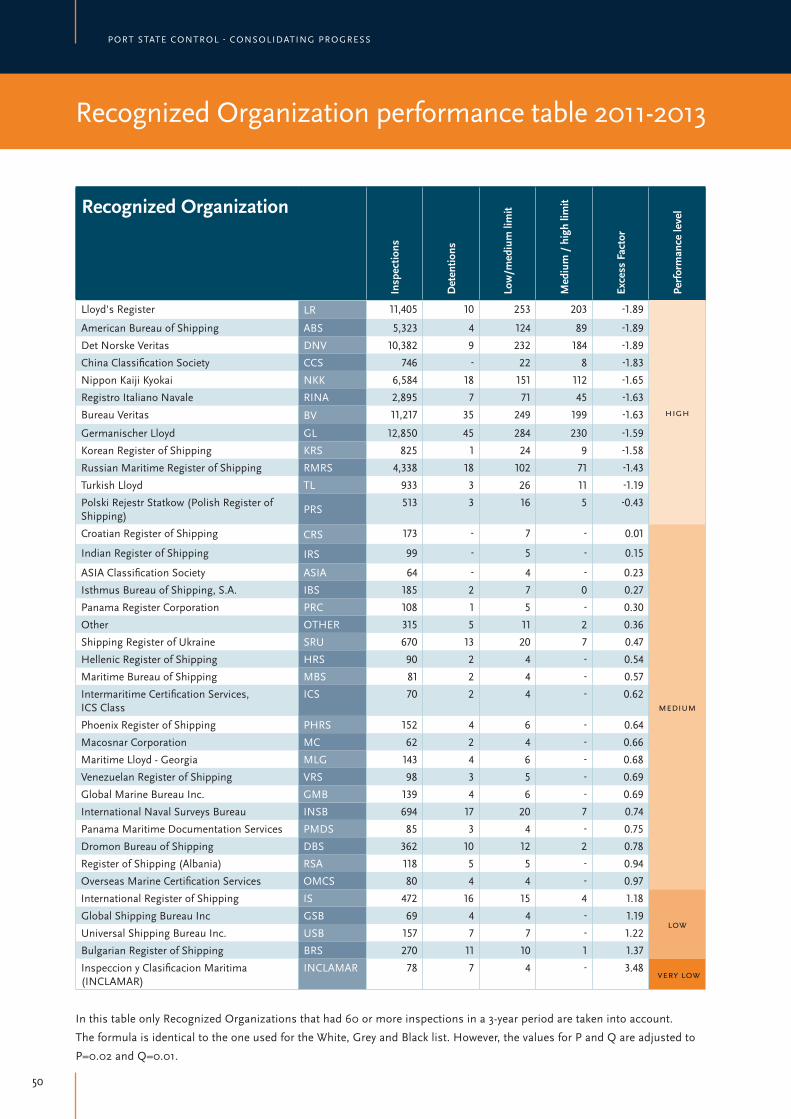
50
PORT STATE CONTROL - CONSOLIDATING PROGRESS
Recognized Organization
Insp
ectio
ns
Det
entio
ns
Low
/med
ium
lim
it
Med
ium
/ h
igh
limit
Exce
ss F
acto
r
Perf
orm
ance
leve
l
Lloyd's Register LR 11,405 10 253 203 -1.89
high
American Bureau of Shipping ABS 5,323 4 124 89 -1.89
Det Norske Veritas DNV 10,382 9 232 184 -1.89
China Classification Society CCS 746 - 22 8 -1.83
Nippon Kaiji Kyokai NKK 6,584 18 151 112 -1.65
Registro Italiano Navale RINA 2,895 7 71 45 -1.63
Bureau Veritas BV 11,217 35 249 199 -1.63
Germanischer Lloyd GL 12,850 45 284 230 -1.59
Korean Register of Shipping KRS 825 1 24 9 -1.58
Russian Maritime Register of Shipping RMRS 4,338 18 102 71 -1.43
Turkish Lloyd TL 933 3 26 11 -1.19
Polski Rejestr Statkow (Polish Register of Shipping)
PRS 513 3 16 5 -0.43
Croatian Register of Shipping CRS 173 - 7 - 0.01
medium
Indian Register of Shipping IRS 99 - 5 - 0.15
ASIA Classification Society ASIA 64 - 4 - 0.23
Isthmus Bureau of Shipping, S.A. IBS 185 2 7 0 0.27
Panama Register Corporation PRC 108 1 5 - 0.30
Other OTHER 315 5 11 2 0.36
Shipping Register of Ukraine SRU 670 13 20 7 0.47
Hellenic Register of Shipping HRS 90 2 4 - 0.54
Maritime Bureau of Shipping MBS 81 2 4 - 0.57
Intermaritime Certification Services, ICS Class
ICS 70 2 4 - 0.62
Phoenix Register of Shipping PHRS 152 4 6 - 0.64
Macosnar Corporation MC 62 2 4 - 0.66
Maritime Lloyd - Georgia MLG 143 4 6 - 0.68
Venezuelan Register of Shipping VRS 98 3 5 - 0.69
Global Marine Bureau Inc. GMB 139 4 6 - 0.69
International Naval Surveys Bureau INSB 694 17 20 7 0.74
Panama Maritime Documentation Services PMDS 85 3 4 - 0.75
Dromon Bureau of Shipping DBS 362 10 12 2 0.78
Register of Shipping (Albania) RSA 118 5 5 - 0.94
Overseas Marine Certification Services OMCS 80 4 4 - 0.97
International Register of Shipping IS 472 16 15 4 1.18
lowGlobal Shipping Bureau Inc GSB 69 4 4 - 1.19
Universal Shipping Bureau Inc. USB 157 7 7 - 1.22
Bulgarian Register of Shipping BRS 270 11 10 1 1.37
Inspeccion y Clasificacion Maritima (INCLAMAR)
INCLAMAR 78 7 4 - 3.48very low
In this table only Recognized Organizations that had 60 or more inspections in a 3-year period are taken into account.
The formula is identical to the one used for the White, Grey and Black list. However, the values for P and Q are adjusted to
P=0.02 and Q=0.01.
Recognized Organization performance table 2011-2013

51ANNUAL REPORT 2013
Recognized Organization performance table 2011-2013
Recognized Organization
Cert
ifica
tes
Nr o
f RO
de
tain
able
de
ficie
ncie
s
%
defe
icie
ncie
s /
cert
ifica
tes
American Bureau of Shipping ABS 12,237 5 0.04
Bulgarian Register of Shipping BRS 745 4 0.54
Bureau Veritas BV 25,700 19 0.07
China Classification Society CCS 2,022 - 0.00
Croatian Register of Shipping CRS 514 - 0.00
Det Norske Veritas DNV 22,856 3 0.01
Dromon Bureau of Shipping DBS 1,527 18 1.18
Germanischer Lloyd GL 34,360 42 0.12
Global Marine Bureau Inc. GMB 370 2 0.54
Inspeccion y Clasificacion Maritima (INCLAMAR) INCLAMAR 195 1 0.51
International Naval Surveys Bureau INSB 1,636 57 3.48
International Register of Shipping IS 776 27 3.48
Iranian Classification Society IRCS 105 - 0.00
Isthmus Bureau of Shipping, S.A. IBS 341 - 0.00
Korean Register of Shipping KRS 2,829 6 0.21
Lloyd's Register LR 22,579 11 0.05
Maritime Bureau of Shipping MBS 248 - 0.00
Maritime Lloyd - Georgia MLG 450 4 0.89
Nippon Kaiji Kyokai NKK 19,191 13 0.07
Other OTHER 431 8 1.86
Overseas Marine Certification Services OMCS 181 4 2.21
Panama Maritime Documentation Services PMDS 96 1 1.04
Panama Register Corporation PRC 70 12 17.14
Panama Shipping Registrar Inc. PSR 98 1 1.02
Phoenix Register of Shipping PHRS 410 7 1.71
Polski Rejestr Statkow (Polish Register of Shipping) PRS 800 - 0.00
Register of Shipping (Albania) RSA 351 - 0.00
Registro Italiano Navale RINA 5,905 6 0.10
Russian Maritime Register of Shipping RMRS 11,177 12 0.11
Shipping Register of Ukraine SRU 1,641 3 0.18
Turkish Lloyd TL 1,224 2 0.16
Universal Shipping Bureau Inc. USB 236 36 15.25
Venezuelan Register of Shipping VRS 601 12 2.00
Number of certificates covering RO responsible detainable deficiencies 2013

52
PORT STATE CONTROL - CONSOLIDATING PROGRESS
Flags on the “Black List” in combination with Recognized Organizations that act on their behalf with a combined lower performance 2011-2013
“Black” flags with corresponding RO with an excess factor ≥ 0.50 detentions period 2011-2013
Flag State Recognized Organization
Nr o
f In
spec
tions
Insp
ectio
ns
with
de
tent
ions
Det
entio
ns
% (+/-
) Av
erag
e de
t %
2.0
4
Cambodia Global Marine Bureau Inc. 39 1 2.56 0.52
International Register of Shipping 20 0 0.00 -2.04
Comoros Bulgarian Register of Shipping 21 1 4.76 2.72
International Naval Surveys Bureau 35 1 2.86 0.82
Phoenix Register of Shipping 13 0 0.00 -2.04
Moldova, Republic of Bulgarian Register of Shipping 31 1 3.23 1.19
Dromon Bureau of Shipping 22 2 9.09 7.05
Maritime Bureau of Shipping 25 0 0.00 -2.04
Maritime Lloyd - Georgia 22 2 9.09 7.05
Venezuelan Register of Shipping 13 1 7.69 5.65
Saint Vincent and the Grenadines Hellenic Register of Shipping 12 0 0.00 -2.04
International Naval Surveys Bureau 53 1 1.89 -0.15
Sierra Leone Dromon Bureau of Shipping 63 0 0.00 -2.04
International Register of Shipping 23 1 4.35 2.31
Phoenix Register of Shipping 11 1 9.09 7.05
Togo Dromon Bureau of Shipping 62 3 4.84 2.80
International Naval Surveys Bureau 44 3 6.82 4.78
Note: Criteria were developed to identify flag States and Recognized Organizations acting on their behalf that jointly have
a lower performance. The targeted flags are the flags placed on the “Black List”. The targeted Recognized Organizations
are ROs which act on behalf of a flag on the “Black List” and have an excess factor of ≥ 0.50 on the RO performance list in
combination with ≥ 10 inspections for this flag.
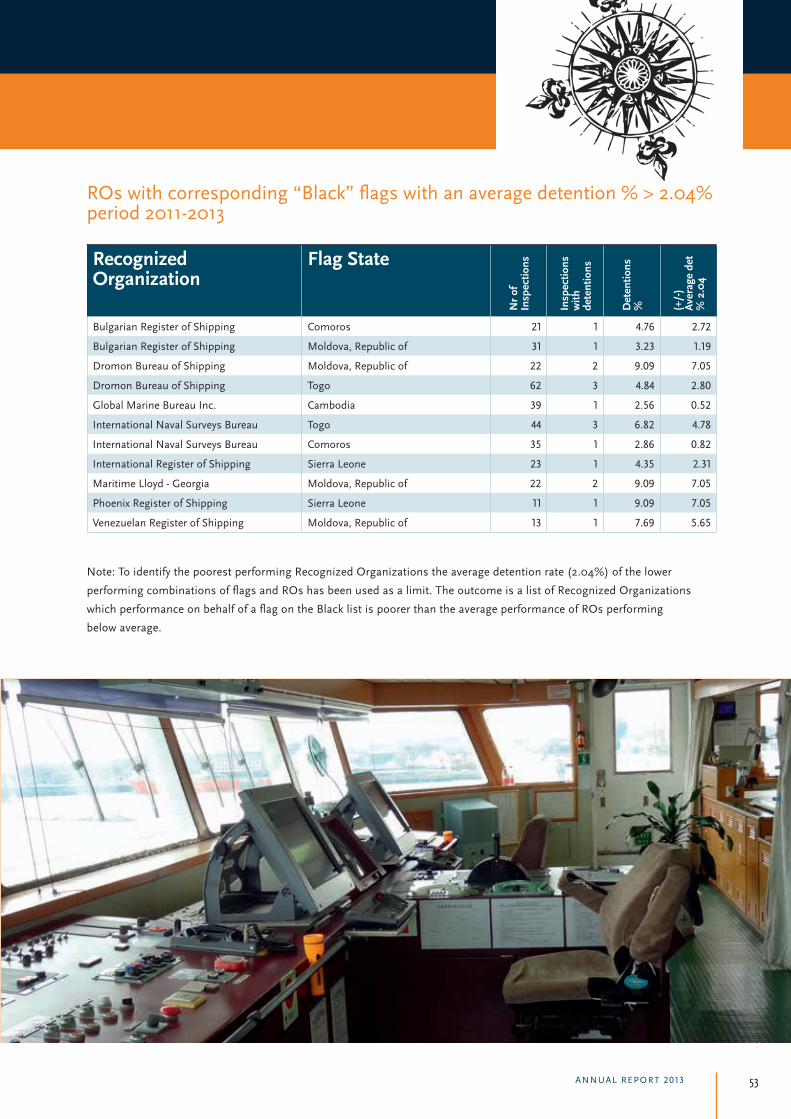
53ANNUAL REPORT 2013
ROs with corresponding “Black” flags with an average detention % > 2.04% period 2011-2013
Recognized Organization
Flag State
Nr o
f In
spec
tions
Insp
ectio
ns
with
de
tent
ions
Det
entio
ns
% (+/-
) Av
erag
e de
t %
2.0
4
Bulgarian Register of Shipping Comoros 21 1 4.76 2.72
Bulgarian Register of Shipping Moldova, Republic of 31 1 3.23 1.19
Dromon Bureau of Shipping Moldova, Republic of 22 2 9.09 7.05
Dromon Bureau of Shipping Togo 62 3 4.84 2.80
Global Marine Bureau Inc. Cambodia 39 1 2.56 0.52
International Naval Surveys Bureau Togo 44 3 6.82 4.78
International Naval Surveys Bureau Comoros 35 1 2.86 0.82
International Register of Shipping Sierra Leone 23 1 4.35 2.31
Maritime Lloyd - Georgia Moldova, Republic of 22 2 9.09 7.05
Phoenix Register of Shipping Sierra Leone 11 1 9.09 7.05
Venezuelan Register of Shipping Moldova, Republic of 13 1 7.69 5.65
Note: To identify the poorest performing Recognized Organizations the average detention rate (2.04%) of the lower
performing combinations of flags and ROs has been used as a limit. The outcome is a list of Recognized Organizations
which performance on behalf of a flag on the Black list is poorer than the average performance of ROs performing
below average.

54
PORT STATE CONTROL - CONSOLIDATING PROGRESS
FlagFa
iled
to c
all
at in
dica
ted
repa
ir ya
rd
Jum
ped
dete
ntio
n
Multiple detentions
Tota
l Ban
ned
ship
s
1st ban 2nd ban 3rd ban
Albania 1 1
Belize 1 2 3
Bolivia 1 1
Cambodia 1 1
Comoros 2 2
Curacao 1 1
Dominica 1 1
Libya 1 1
Moldova, Republic of 1 9 1 11
Mongolia 1 1
Panama 1 1 2
Russian Federation 1 1
Saint Kitts and Nevis 2 2
Saint Vincent and the Grenadines 1 7 8
Sierra Leone 2 1 3
Tanzania, United Republic of 2 2 8 1 13
Togo 3 5 8
Turkey 1 1
Ukraine 1 1 2
Total 13 4 43 3 0 63
Refusal of access (banning) per flag 2011-2013
30
25
20
15
10
5
020062005 2007 2008 2009 2010 2011 20132012
Multiple detentionsFailed to call at indicated repair yard
Jumped detentionsNo valid ISM code certificate
50454035302520151050
Failed to callat indicatedrepair yard
Jumpeddetention
Multipledetentions
1st ban
2nd ban
Refusal of access 2005-2013 2011-2013

ANNUAL REPORT 2013 55

56
PORT STATE CONTROL - CONSOLIDATING PROGRESS
Number of ships inspected during CIC
Nr o
f in
divi
dual
sh
ips
insp
ecte
d du
ring
CIC
Nr o
f in
spec
tions
pe
rfor
med
w
ith a
CIC
qu
estio
nnai
re
Nr o
f in
spec
tions
w
ithou
t a C
IC
ques
tionn
aire
Inspections 4,126 3,879 444
Inspections with detentions 186 166 20
Detentions with CIC-topic related deficiencies 73 68 5
Number of inspections performed per ship during CIC N
r of s
hips
% o
f tot
al
1 3,808 99.1%
2 34 0.9%
3 1 0.0%
Total 3,843 100.0%
Ship type
Nr o
f in
spec
tions
Nr o
f de
tent
ions
dete
ntio
n as
% o
f in
spec
tions
dete
ntio
ns
CIC
-topi
c re
late
d
dete
ntio
ns
CIC
-topi
c re
late
d as
% o
f in
spec
tions
Bulk carrier 805 29 3.6% 9 1.1%
Chemical tanker 343 5 1.5% 4 1.2%
Combination carrier 3 0 0.0% 0 0.0%
Commercial yacht 15 1 6.7% 0 0.0%
Container 458 12 2.6% 9 2.0%
Gas carrier 102 1 1.0% 0 0.0%
General cargo/multipurpose 1,270 91 7.2% 34 2.7%
Heavy load 4 0 0.0% 0 0.0%
High speed passenger craft 2 0 0.0% 0 0.0%
NLS tanker 14 0 0.0% 0 0.0%
Offshore supply 81 2 2.5% 1 1.2%
Oil tanker 272 9 3.3% 6 2.2%
Other 33 0 0.0% 0 0.0%
Other special activities 147 6 4.1% 1 0.7%
Passenger ship 16 0 0.0% 0 0.0%
Refrigerated cargo 82 5 6.1% 3 3.7%
Ro-Ro cargo 142 2 1.4% 1 0.7%
Ro-Ro passenger ship 23 0 0.0% 0 0.0%
Special purpose ship 21 0 0.0% 0 0.0%
Tug 46 3 6.5% 0 0.0%
Total 3,879 166 4.3 68 1.8%
CIC 2013 on Propulsion and Auxiliary Machinery

57ANNUAL REPORT 2013

58
PORT STATE CONTROL - CONSOLIDATING PROGRESS
Explanatory note – “White”, “Grey” and “Black List”
The performance of each Flag is
calculated using a standard formula for
statistical calculations in which certain
values have been fixed in accordance
with agreed Paris MoU policy. Two
limits have been included in the
system, the ‘black to grey’ and the
‘grey to white’ limit, each with its own
specific formula:
ublack _ to_ grey = N ⋅ p+ 0.5+ z (N ⋅ p ⋅ (1− p)
uwhite_ to_ grey = N ⋅ p− 0.5− z (N ⋅ p ⋅ (1− p)
In the formula “N” is the number
of inspections, “p” is the allowable
detention limit (yardstick), set to 7%
by the Paris MoU Port State Control
Committee, and “z” is the significance
requested (z=1.645 for a statistically
acceptable certainty level of 95%).
The result “u“ is the allowed number
of detentions for either the black or
white list. The “u“ results can be found
in the table. A number of detentions
above this ‘black to grey’ limit means
significantly worse than average, where
a number of detentions below the
‘grey to white’ limit means significantly
better than average. When the amount
of detentions for a particular Flag is
positioned between the two, the Flag
will find itself on the grey list. The
formula is applicable for sample sizes
of 30 or more inspections over a 3-year
period.
To sort results on the black or white
list, simply alter the target and repeat
the calculation. Flags which are still
significantly above this second target,
are worse than the flags which are
not. This process can be repeated to
create as many refinements as desired.
(Of course the maximum detention
rate remains 100%!) To make the
flags’ performance comparable, the
excess factor (EF) is introduced.
Each incremental or decremental
step corresponds with one whole
EF-point of difference. Thus the EF
is an indication for the number of
times the yardstick has to be altered
and recalculated. Once the excess
factor is determined for all flags,
the flags can be ordered by EF. The
excess factor can be found in the
last column of the White, Grey or
Black list. The target (yardstick) has
been set on 7% and the size of the
increment and decrement on 3%.
The White/Grey/Black lists have been
calculated in accordance with the
principles above.
The graphical representation of the
system below is showing the direct
relations between the number of
inspected ships and the number
of detentions. Both axes have a
logarithmic character as the ‘black to
grey’ or the ‘grey to white’ limit.
The normative listing of Flags provides an independent categorization
that has been prepared on the basis of Paris MoU port State
inspection results over a 3-year period, based on binomial calculus.
Num
ber o
f Det
entio
ns
Number of Inspections
EF= 4EF= 3EF= 2EF= 1 BlackEF= 0 White
EF= -1
EF= -2
EF= 4 and above very high riskEF= 3 to 4 high riskEF= 2 to 3 medium to high riskEF= 1 to 2 medium risk
1000
100
10
1

59ANNUAL REPORT 2013
Example flag on Black list:
Ships of Flag A were subject to 108 inspections of
which 25 resulted in a detention. The “black to grey limit”
is 12 detentions. The excess factor is 4.26.
N = total inspections
P = 7%
Q = 3%
Z = 1.645
How to determine the black to grey limit:
µblacktogrey = N ⋅ p+ 0.5+ z N ⋅ p ⋅ (1− p)
µblacktogrey =108 ⋅0.07+ 0.5+1.645 108 ⋅0.07 ⋅0.93
µblacktogrey =12
The excess factor is 4.26. This means that ‘p’ has to be
adjusted in the formula. The black to grey limit has an
excess factor of 1. so to determine the new value for ‘p’.
‘q’ has to be multiplied with 3.26 and the outcome has to
be added to the normal value for ‘p’:
p+3,26q = 0,07+ (3, 26 ⋅0,03) = 0,1678
µexcessfactor =108 ⋅0.1678+ 0.5+1.645 108 ⋅0.1678 ⋅0.8322µexcessfactor = 25
Example flag on Grey list:
Ships of Flag B were subject to 141 inspections. of which
10 resulted in a detention. The ‘ black to grey limit” is 15
and the “ grey to white limit” is 4. The excess factor is
0.51. How to determine the black to grey limit:
µblacktogrey =141⋅0.07+ 0.5+1.645 141⋅0.07 ⋅0.93µblactogrey =15
How to determine the grey to white limit:
µgreytowhite = N ⋅ p− 0.5− z N ⋅ p ⋅ (1− p)µgreytowhite =141⋅0.07− 0.5−1.645 141⋅0.07 ⋅0.93µgreytowhite = 4
To determine the excess factor the following formula
is used: ef = Detentions – grey to white limit / grey to
black limit – grey to white limit
ef = (10− 4) / (15− 4)ef = 0,51
Example flag on White list:
Ships of Flag C were subject to 297 inspections of which
11 resulted in detention. The “grey to white limit” is 13
detentions. The excess factor is –0.28. How to determine
the grey to white limit:
µgreytowhite = N ⋅ p− 0,5− z N ⋅ p(1− p)µgreytowhite = 297 ⋅0.07− 0.5−1.645 297 ⋅0.07 ⋅0.93µgreytowhite =13
The excess factor is - 0.28 This means that ‘p’ has to be
adjusted in the formula. The grey to white limit has an
excess factor of 0. so to determine the new value for ’p’.
‘q’ has to be multiplied with –0.28. and the outcome has
to be added to the normal value for ‘p’:
p+ (−0.28q) = 0.07+ (−0.28 ⋅0.03) = 0.0616
µexcessfactor = 297 ⋅0.0616− 0.5−1.645 297 ⋅0.0616 ⋅0.9384µexcessfactor =11

60
PORT STATE CONTROL - CONSOLIDATING PROGRESS
Secretariat Paris Memorandum of Understanding on Port State Control
Colophon
Layout and design
The KEY Agency
Photographs
Cover photo: DOI - Omar Camilleri,
Transport Malta, Malta
Guardia Costiera, Italy
Transport Canada Marine Safety,
Canada
Department of Transport,
Tourism and Sport, Ireland
Paris MoU Authorities
Secretariat
Address Secretariat
Koningskade 4
P.O. Box 16191
2500 BD The Hague
The Netherlands
Telephone: +31 70 456 1508
Fax: +31 70 456 1599
www.parismou.org
E-mail: [email protected]
Staff
Mr. Richard W.J. Schiferli
Secretary General
Telephone: +31 70 456 1509
E-mail: [email protected]
Mrs. Carien Droppers
Deputy Secretary General
Telephone: +31 70 456 1507
E-mail: [email protected]
Mr. Ivo Snijders
Secretary
Telephone: +31 70 456 1849
E-mail: [email protected]
Mr. Peter Aarsen
Secretary
Telephone: +31 70 456 1510
E-mail: [email protected]
Mrs. Linda Korpershoek
Secretary
Telephone: +31 70 456 1627
E-mail: [email protected]
Mr. Lourens van ‘t Wout
ICT Advisor
Telephone: +31 70 456 1375
E-mail: [email protected]
Mrs. Melany Cadogan - Eskici
Office Manager
Telephone: +31 70 456 1436
E-mail: [email protected]
Mrs. Ingrid de Vree
Management Assistant
Telephone: +31 70 456 1508
E-mail: [email protected]
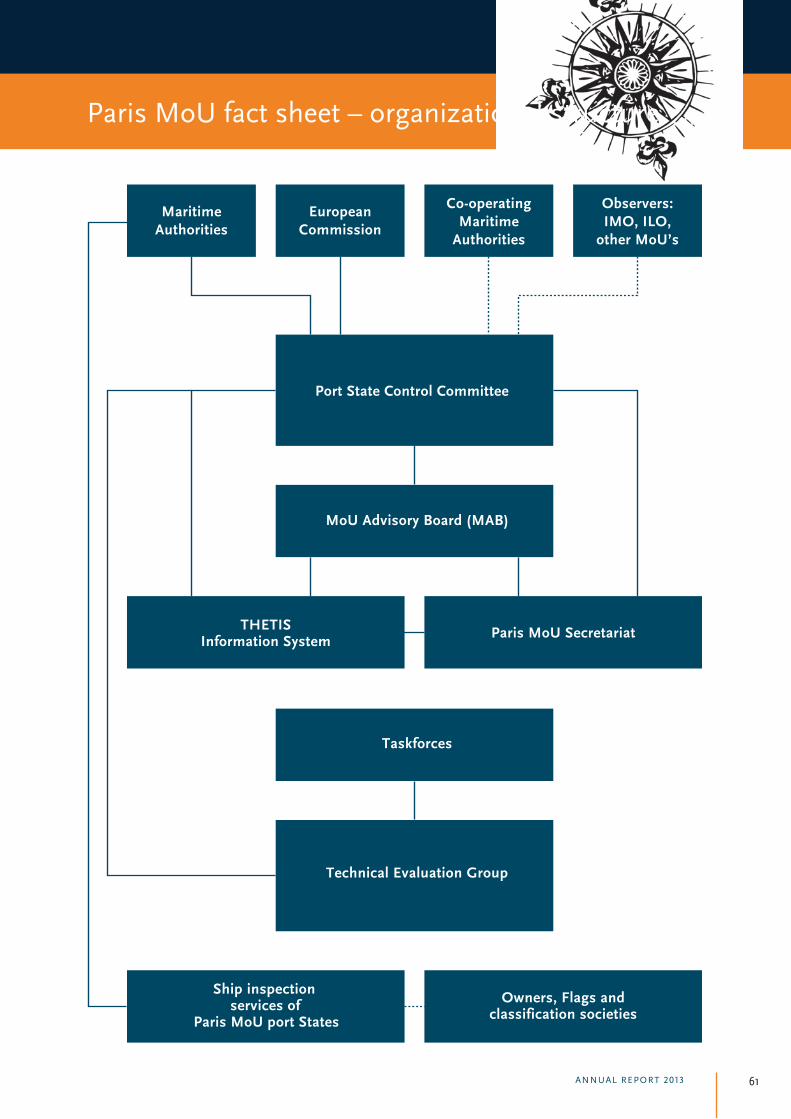
61ANNUAL REPORT 2013
Paris MoU fact sheet – organizational structure
MaritimeAuthorities
EuropeanCommission
Co-operatingMaritime
Authorities
Observers:IMO, ILO,
other MoU’s
Port State Control Committee
MoU Advisory Board (MAB)
THETISInformation System
Paris MoU Secretariat
Taskforces
Technical Evaluation Group
Ship inspection services of
Paris MoU port States
Owners, Flags andclassification societies


TH
E P
AR
IS M
EM
OR
AN
DU
M O
F U
ND
ER
STA
ND
ING
ON
PO
RT
STA
TE
CO
NT
RO
L