Embed Size (px)
Citation preview

Paris MOU on Port State Control

Paris MOU Annual Report 1999
Paris MOU on Port State Control
1. Executive summary 1
2. Paris MOU developments 2
3. Control initiatives on the Y2K problem 5
4. Concentrated Inspection Campaigns 6
5. Membership to the Paris MOU 7
6. Co-operation with other organisations 7
7. Facts and figures 8
Annex 1 - Inspections •= Basic port State control figures 12 •= Inspection efforts Paris MOU members 15 •= Black – Grey – White List 17
Annex 2 - Detentions •= Inspections and detentions per flag State 19 •= Flag States exceeding average detention percentage 22 •= Inspections and detentions per ship type 23
Annex 3 - Deficiencies •= Summary of major categories of deficiencies 24 •= Inspections with deficiencies per flag State 25 •= Specification of most common deficiencies 27
Annex 4 – Class performance •= Detentions with class related detainable deficiencies 33
Percentage of total (per classification society) •= Detentions with class related detainable deficiencies 34
Ratio per classifiction society •= Number of detentions per class society 36 •= Detentions with class related detainable deficiencies 37
Per flag State Explanatory note – Black, Grey and White lists 40
Paris MOU Secretariat colophon, address and staff 41
Paris MOU organizational structure sheet 42
Paris MOU Annual Report 1999
1
Paris MOU on Port State Control
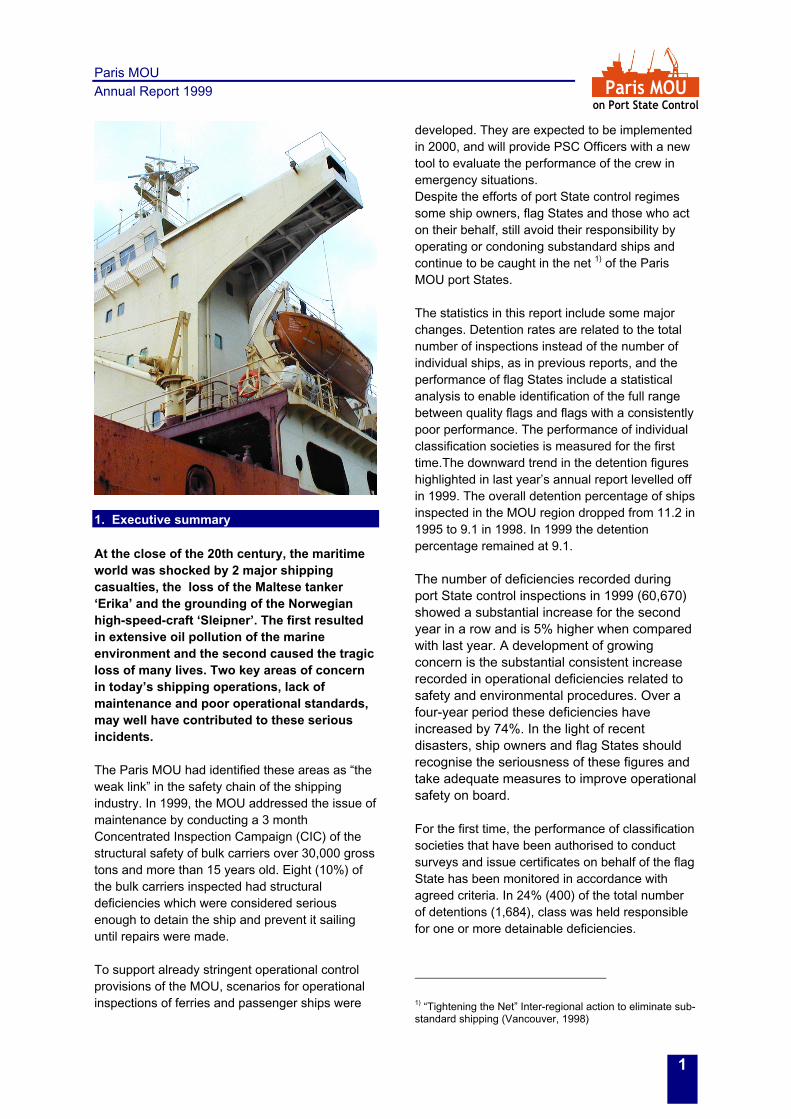
1. Executive summary At the close of the 20th century, the maritime world was shocked by 2 major shipping casualties, the loss of the Maltese tanker ‘Erika’ and the grounding of the Norwegian high-speed-craft ‘Sleipner’. The first resulted in extensive oil pollution of the marine environment and the second caused the tragic loss of many lives. Two key areas of concern in today’s shipping operations, lack of maintenance and poor operational standards, may well have contributed to these serious incidents. The Paris MOU had identified these areas as “the weak link” in the safety chain of the shipping industry. In 1999, the MOU addressed the issue of maintenance by conducting a 3 month Concentrated Inspection Campaign (CIC) of the structural safety of bulk carriers over 30,000 gross tons and more than 15 years old. Eight (10%) of the bulk carriers inspected had structural deficiencies which were considered serious enough to detain the ship and prevent it sailing until repairs were made. To support already stringent operational control provisions of the MOU, scenarios for operational inspections of ferries and passenger ships were
developed. They are expected to be implemented in 2000, and will provide PSC Officers with a new tool to evaluate the performance of the crew in emergency situations. Despite the efforts of port State control regimes some ship owners, flag States and those who act on their behalf, still avoid their responsibility by operating or condoning substandard ships and continue to be caught in the net 1) of the Paris MOU port States. The statistics in this report include some major changes. Detention rates are related to the total number of inspections instead of the number of individual ships, as in previous reports, and the performance of flag States include a statistical analysis to enable identification of the full range between quality flags and flags with a consistently poor performance. The performance of individual classification societies is measured for the first time.The downward trend in the detention figures highlighted in last year’s annual report levelled off in 1999. The overall detention percentage of ships inspected in the MOU region dropped from 11.2 in 1995 to 9.1 in 1998. In 1999 the detention percentage remained at 9.1. The number of deficiencies recorded during port State control inspections in 1999 (60,670) showed a substantial increase for the second year in a row and is 5% higher when compared with last year. A development of growing concern is the substantial consistent increase recorded in operational deficiencies related to safety and environmental procedures. Over a four-year period these deficiencies have increased by 74%. In the light of recent disasters, ship owners and flag States should recognise the seriousness of these figures and take adequate measures to improve operational safety on board. For the first time, the performance of classification societies that have been authorised to conduct surveys and issue certificates on behalf of the flag State has been monitored in accordance with agreed criteria. In 24% (400) of the total number of detentions (1,684), class was held responsible for one or more detainable deficiencies.
1) “Tightening the Net” Inter-regional action to eliminate sub-standard shipping (Vancouver, 1998)

Paris MOU
Annual Report 1999
2
Paris MOU on Port State Control
Measures to concentrate PSC efforts on potentially sub-standard ships by using a targeting system are being implemented in order to use resources effectively and to benefit ships with a good safety record. The Paris MOU made a significant step towards increased transparency in deciding to make information on port State control inspection results available to industry and other interested parties through EQUASIS. 2. Paris MOU developments GENERAL Once a year the Port State Control Committee, which is the executive body of the Paris MOU, meets in one of the Member States. The Committee considers policy matters concerning regional enforcement of port State control, reviews the work of the Technical Evaluation Group and task forces and decides on administrative procedures. The task forces, of which 10 were active in 1999, are each assigned a specific work programme to investigate improvement of operational, technical and administrative port State control procedures. Reports of the task forces are submitted to the Technical Evaluation Group (TEG) at which all the Paris MOU members and observers are represented. The evaluation of the TEG is submitted to the Committee for final consideration and decision making. During the 32nd meeting of the Committee, Alan Cubbin of the UK was elected to the chair for a period of 3 years following the retirement of Capt Odd Vollene. Mr Cubbin is the current Director of the Maritime and Coast Guard Agency's Marine Standards Division and has responsibility for PSC policy in the Agency. The MOU Advisory Board advises the Port State Control Committee on matters of a political and strategic nature, and provides direction to the task forces and Secretariat in
between meetings of the Committee. The board meets several times a year and in 1999 was composed of participants from Canada, Greece, Norway, the United Kingdom and the European Commission. PORT STATE CONTROL COMMITTEE The Port State Control Committee (PSCC) held its 32nd meeting in Stockholm, Sweden on 10-13 May 1999. Important decisions by the Committee included the decision to make more information available to EQUASIS as part of the Paris MOU support for the world wide Quality Shipping Campaign. This decision is in line with those taken by the US Coast Guard and the Tokyo MOU. The initiative also addresses the concerns highlighted in the Action Plan emanating from the Joint Ministerial Conference entitled “Tightening the Net”, held in Vancouver in 1998. The Committee decided to publish monthly a list of companies responsible for the safe operation of ships that have been detained more than once or having more than one ship detained within the previous 12 months. In a further initiative on monitoring the performance of classification societies, the Committee agreed to start publishing data
Operational safety: “a growing concern”

Paris MOU Annual Report 1999
3
Paris MOU on Port State Control
related to their performance in cases of detention. The evaluation of their performance will be based on the criteria adopted by the PSCC last year.As a next step the PSCC will decide on possible changes to the present target factor in order to take into consideration the differing performances of the classification societies. On a more practical note, the committee adopted "Guidelines for control of provisions under STCW 95" with respect to documentation of qualifications and training to be held by officers and crew on board all types of ships. In view of the importance of the Y2K issue to ship safety, the Committee decided that PSC officers should board ships to ask for evidence that the issue had been addressed and that the crew were well trained in using the back-up systems. The Annual Report of the Paris MOU for 1998, and in particular the list of flag States exceeding the average detention percentage, was considered. Each of the flag States in the list received a letter from the Paris MOU Secretariat to inform them that their ships will be targeted for priority inspections for a period of one year. It was with concern that the Committee noted that two of it’s own members, Croatia and the Russian Federation were included in the new list. The results of the Joint Ministerial Conference on port State control, which was held a few months prior to the Committee meeting were submitted by Canada. A number of initiatives emanating from the Ministerial declaration were identified and are being considered for further joint action between the Paris and Tokyo MOU. TECHNICAL EVALUATION GROUP The Technical Evaluation Group (TEG) convened twice during 1999. Several task forces submitted reports to the TEG for evaluation before submission to the Port State Control Committee. Issues being considered by TEG are:
•=requirements for a new Paris MOU inspection report database
•=evaluation of the Concentrated Inspection Campaign on bulk carriers
•=criteria for the assessment of responsibility of classification societies
•=development of a programme for advanced training for PSCO’s
•=harmonised scenario’s for operational control on board ferries and passenger ships
•=preparations for a Concentrated Inspection Campaign on Securing of Cargo
•=evaluation of the target factor for ships •=development of a new Manual for PSCO’s •=guidelines for inspection of working and living
conditions
29th PSC Seminar, Bangor, Northern Ireland.
PORT STATE CONTROL SEMINARS 28TH PSC SEMINAR The 28th Port State Control Seminar of the Paris MOU was held in Antwerp, Belgium on 23-25 June 1999. The Seminar was attended by Port State Control Officers from the Paris MOU, as well as participants from the Viña del Mar Agreement, Estonia, Iceland, Israel and Latvia. The main topics of discussion were the International Maritime Dangerous Goods Code (IMDG Code) and the Global Maritime Distress and Safety System (GMDSS).Particular attention was paid to the "provisional criteria for the responsibility assessment of classification societies". These criteria are used to identify detainable deficiencies

Paris MOU
Annual Report 1999
4
Paris MOU on Port State Control
listed on the PSC inspection report for which class is responsible. 29TH PSC SEMINAR The 29th PSC Seminar was held on 19-21 October 1999, in Bangor, Northern Ireland. It was attended by Port State Control Officers from the Paris MOU, as well as participants from the Tokyo MOU, Viña del Mar Agreement, Estonia, Iceland, Latvia, South Africa and Slovenia. The main focus of the seminar was the preparation for a Concentrated Inspection Campaign on cargo securing, which will be held in 2000. An expert from the Netherlands informed the participants of the procedures and guidelines for the CIC and the requirements of the Cargo Securing Manual. Other items discussed during the seminar were the Y2K problem, class related detainable deficiencies and the results of the Concentrated Inspection Campaign on the structural safety of bulk carriers. DEVELOPMENT OF ADVANCED TRAINING FOR PSCO’S As announced in last year’s report, the Paris MOU has agreed on the need to establish a programme of advanced training of PSCO’s, in order to keep abreast of technological change in the maritime field and of corresponding regulatory developments and to harmonise the PSC activities in the Paris MOU region. The European Commission, which attaches great value to this programme and is therefore prepared to contribute financially, selected a consortium of professional training institutes to develop modules for advanced port State control training. The training material has now been finalised and the first courses are expected to start after the selection of training institutes has been completed. UPGRADING OF SIRENAC INFORMATION SYSTEM In 1998 a major revision of SIReNaC 2, the PSC database of the Paris MOU, which is administered by the Centre Administratif des Affaires Maritimes in St. Malo, France, was completed. New initiatives are already under consideration to further enhance the system to meet the needs of users. In addition to the database, a new statistical information system has been developed to allow for various queries by the MOU Members and the European Commission. This “info-centre” will enable on-line retrieval of information on
2 Système d’Information Relatif aux Navires Contrôllés.
inspections in response to structured queries and is expected to be operational in 2000. The figures presented in this report have been produced with the assistance of the info-centre. PARIS MOU ON THE INTERNET. The Paris MOU Internet site on the World Wide Web has been in increasingly popular demand from a variety of visitors. These include governmental agencies, charterers, insurers, classification societies, ship owners and a wide range of other users. In particular the monthly information on detentions, the annual report and news items have been downloaded in large numbers from the website, which can be found at “www.parismou.org”. The website was expanded during 1999 and contains up-to-date information on the operation of the Paris MOU, including – •=general information on port State control •=an electronic copy of the Annual Report •=down-loadable text of the Paris MOU, including
PSC procedures •=contact addresses of the participating maritime
Authorities •=a database of detained ships, including down-
loadable monthly lists of detentions •=a list of ships which have been banned from the
Paris MOU region •=important PSC related news items. During 1999 the website was visited by a large number of countries and organizations (altogether 10,794), with a total of 823,629 consultations for information, an average of 2,866 per day. A total of 5,878 megabytes of information was downloaded from the site.
Paris MOU Annual Report 1999
5
Paris MOU on Port State Control
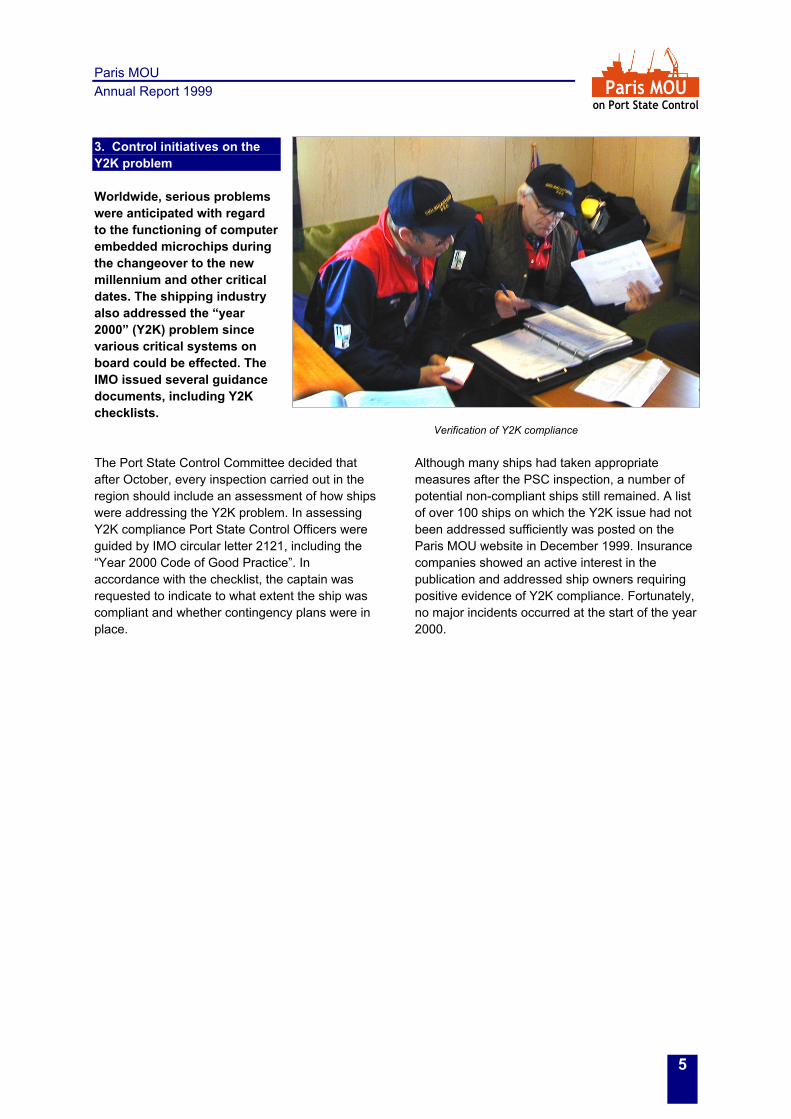
3. Control initiatives on the Y2K problem Worldwide, serious problems were anticipated with regard to the functioning of computer embedded microchips during the changeover to the new millennium and other critical dates. The shipping industry also addressed the “year 2000” (Y2K) problem since various critical systems on board could be effected. The IMO issued several guidance documents, including Y2K checklists. The Port State Control Committee decided that after October, every inspection carried out in the region should include an assessment of how ships were addressing the Y2K problem. In assessing Y2K compliance Port State Control Officers were guided by IMO circular letter 2121, including the “Year 2000 Code of Good Practice”. In accordance with the checklist, the captain was requested to indicate to what extent the ship was compliant and whether contingency plans were in place.
Verification of Y2K compliance Although many ships had taken appropriate measures after the PSC inspection, a number of potential non-compliant ships still remained. A list of over 100 ships on which the Y2K issue had not been addressed sufficiently was posted on the Paris MOU website in December 1999. Insurance companies showed an active interest in the publication and addressed ship owners requiring positive evidence of Y2K compliance. Fortunately, no major incidents occurred at the start of the year 2000.

Paris MOU
Annual Report 1999
6
Paris MOU on Port State Control 4. Concentrated Inspection Campaigns Over the past years several concentrated inspection campaigns have been held in the Paris MOU region. These campaigns focus on a particular area of compliance with international regulations with the aim of gathering information on, and enforcing, the level of compliance. Each campaign is prepared by experts and focuses on a number of specific items for inspection. Experience shows that they serve to draw attention to the chosen area of compliance. The structural condition of large bulk carriers has been a growing cause for concern for many years. Older ships in particular, that carry bulk cargoes have been involved in serious casualties. The Port State Control Committee was in full agreement that every action should be taken to identify bulk carriers that may have structural problems. The Committee decided to launch a concentrated inspection campaign of bulk carriers over 30.000 GT and more than 15 years old that were due for an expanded inspection. Specific guide-lines were developed to assist Port State Control Officers in these pections. The vessels selected were given notice to make the necessary preparations for a structural inspection which included inspection of ballast tanks and cargo holds. Although checks on the structural safety of large bulk carriers calling at European and Canadian ports show that some improvements have been made in recent years, the campaign that took place from 1 April to 30 June 1999 revealed that serious defects are still being found. The detention rate of bulk carriers during the campaign was 10% compared with a rate of 13.9% for all bulk carriers inspected in 1998. When taking into account the greater scrutiny that
the ships received during this campaign, the results suggest that the situation is improving. The recent decline in loss figures for this type of vessel has also been encouraging. Nevertheless the level of deficiencies being found during the campaign leaves no room for complacency. All of the detained ships had been surveyed by members of the International Association of Classification Societies (IACS) under the enhanced survey programme. Eight of the bulk carriers inspected had structural deficiencies, which were considered serious enough to detain the ship and prevent it sailing until repairs were made. The defects found were varied but included holes in decks and hatch covers, badly wasted and cracked longitudinal and transverse stiffeners in holds and tanks. When
Campaign on bulk carriers confirmed structural problems. damaged air pipes and other loadline items are taken into account a total of 40 ships, just over half, were found to have at least one deficiency (some of them minor) affecting the structural safety of the ship. Inspectors found that in all cases cargo operations were being carried out in accordance with the plan agreed with the terminal and that bending and sheer stresses were being maintained within maximum limits.

Paris MOU Annual Report 1999
7
Paris MOU on Port State Control
The relatively small sample of inspections made it difficult to draw any conclusions relating to the flag, class, age, tonnage of the ship or the cargo being carried. Bahamas, Cyprus and Panamanian registered and Lloyds Register and Class NK classed ships recorded the most problems in terms of structural defects and detentions.
Port State Control training in Iceland
5. Membership to the Paris MOU In preparation for prospective new members of the Paris MOU provisional criteria for co-operating status or observer status for non-member states and newly developed PSC regions were agreed by the Committee. Specific criteria, including a self-evaluation exercise, have to be met before co-operating status can be granted. Authorities which are a member of another regional agreement, or located in the region of another regional agreement, or located outside the regional scope of the Paris MOU are not eligible for co-operating status. Regional agreements seeking observer status should demonstrate that their member Authorities have an acceptable overall flag State record and have a similar approach in terms of commitment and goals to that of the Paris MOU.
The maritime Authority of Iceland, which has been a co-operating member to the Paris MOU since May 1996, applied for full membership during the 32nd meeting of the Port State Control Committee in 1999. The Committee welcomed the initiative by the Icelandic Maritime Authority and agreed that a fact finding mission should take place in March
2000 in order to assess whether the qualitative criteria of the MOU are met. In preparation for the assessment a port State control training course was organised in Iceland by the Maritime and Coastguard Agency (UK) and the Secretariat during September 1999. 6. Co-operation with other organisations The strength of regional regimes of port State control bound by geographical circum-stances and interest is
widely recognised. During the Joint Ministerial Conference in Vancouver, the existing co-operation between the Paris and Tokyo Memorandum of Understanding was firmly reinforced. The Secretariats of both regions have participated in each other’s meetings. The Paris MOU has also provided advice in setting up port State control regimes in Latin America and the Caribbean. Co-operation on an administrative level will help to ensure that port State control efforts remain compatible as far as practicable. The long-standing co-operation with the United States Coast Guard has been extended by giving the Coast Guard access to the SIReNaC database. Since the early days the International Labour Organization and the International Maritime Organization have participated in the meetings of the Paris MOU. Port State Control initiatives from the Paris MOU have been introduced in the work of the IMO,

Paris MOU
Annual Report 1999
8
Paris MOU on Port State Control
resulting in international agreed standards for control procedures laid down in IMO Resolution A.787(19). The 1998 Annual Report, including inspection data, has been submitted by the United Kingdom to the Sub-Committee on Flag State Implementation. IMO members appearing on the list of targeted flag States are invited to comment on what steps will be taken to improve their safety record. During the 32nd meeting of the Port State Control Committee in 1999, criteria for granting observer status to newly emerging PSC regions in other areas of the world were adopted. Such regions are required to meet the criteria before observer status can be achieved. The Caribbean MOU on Port State Control was the first regional organisation to be measured against these criteria and was granted official observer status to the Paris MOU. 7. Facts and figures INTRODUCTION During 1999, 18,399 inspections were carried out in the Paris MOU region on 11,248 foreign ships registered in 104 different flag States. The number of inspections is slightly higher than the inspection figure for 1998 (17,643) and nearly 10% higher than the number of inspections carried out in 1997 (16,813), (16,070 in 1996). The number of individual ships inspected in 1999, 11,248, shows a slight increase of 80 compared with the number inspected in 1998 (11,168) and an increase of 529 compared with 1997 (10,719) (10,256 in 1996). This marginal increase may indicate that the Paris Memorandum is slowly
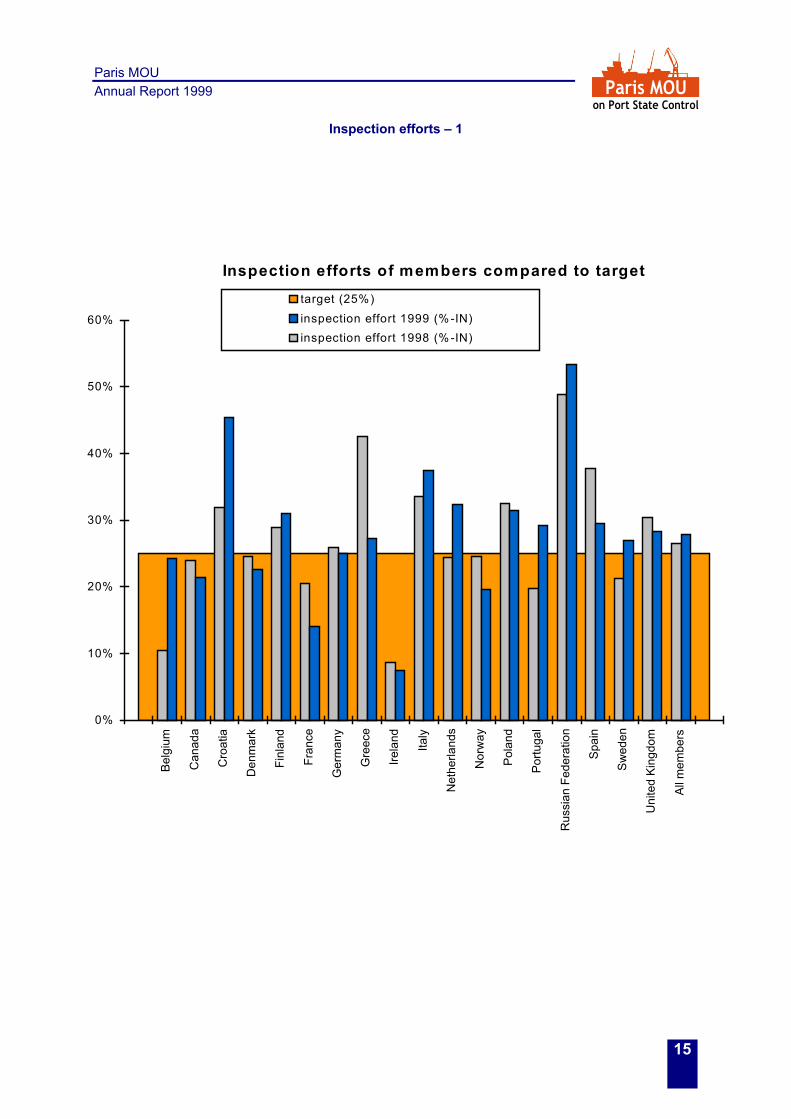
Hygienic conditions leave room for improvement reaching the ceiling of ships qualifying for an inspection. The overall inspection rate in the region was 27.6% in 1999, compared with 26.5% in 1998, 25.6% in 1997 and 24.5% in 1996. The slightly increased overall figure for 1999 also indicates that despite the fact that the Paris MOU members have targeted potentially substandard ships, extra effort was made to increase the number of inspections. A chart showing the individual efforts of the Paris MOU members is included in the statistical annexes to this Annual Report. The EU Directive on Port State Control which entered into force in 1996, makes the inspection commitment mandatory for EU Member States. DETENTIONS As mentioned earlier, several changes have been made in the presentations of PSC statistics. The Committee decided that detention percentages

Paris MOU Annual Report 1999
9
Paris MOU on Port State Control
should be expressed in relation to the number of inspections, rather than individual ships. Since many ships have been detained more than once during an annual period, it is appropriate to relate detentions to inspections. Since the number of inspections is always higher than the number of individual ships, the detention percentage based on inspections is correspondingly lower. For comparison a table indicating the relationship of inspections to individual ships has been included in Annex 1. The number of ships detained in 1999 for deficiencies clearly hazardous to safety, health or the environment amounted to 1,684. It compares with the number detained in 1998 of 1,598, 1,624 in 1997, 1,719 in 1996 and 1,837 in 1995. After 4 years of gradual decrease in detentions, the slight increase can be explained by more rigorous targeting of potentially substandard ships. Also more PSC efforts have been aimed at areas such as operational control, MARPOL and safety management systems. This annual report contains 3 new tables, replacing the “black list” of flags with a consistent poor safety record.Each table is still based on the 3-year rolling average principle but now indicate the full spectrum between quality flags and flags with a poor performance. As expected a “hard core” of States that have persistently figured in the list of “targeted” flags since it was introduced in this annual report in 1992, are still present on the “Black List”. The following 6 flag States have maintained a poor performance and have been included in the top 10 for 4 consecutive years, Belize, Honduras, Lebanon, Romania, Syrian Arab Republic and Turkey. Estonia and Iran are no longer included in the 1999 list. Albania, Azerbaijan, Bangladesh, Cuba, Georgia, Latvia, Mauritius and Pakistan have now been included. Quality flags can be found in the new “White List” and may pride themselves on a fleet of ships with a consistently low detention record. The flags of
Japan, Germany, Ireland, Finland and the Netherlands are placed highest on the list. These flags will also find their ships subject to less port State control inspections since there is evidence that they are capable of running a reputable register.
Flag States with an average performance have been indicated in the new “Grey List”. These flags may find their appearance on this list an incentive to improve and move to the “White List”. At the same time these flags should be careful not to neglect control over their ships and risk ending up on the “Black List” next year. Looking at detentions by ship type over several years, it is noted that general dry cargo ships and bulk carriers still account for over 75% of all detentions. On a more positive note an improvement is seen in the detention rate in 1999 of bulk carriers and chemical tankers compared with 1998 figures.
Proper maintenance: an ISM issue The number of detained passenger ships and ferries increased from 22 in 1998 to 37 in 1999. This fact combined with an increase in safety related operational deficiencies is grounds for maintaining intensified control on these ships. Statistical annexes to this report show the detention percentage for each ship type in 1999, 1998 and 1997. In summary, although the percentage of ships detained has decreased from 11.21% in 1995 to 9.15% in 1999, the actual number of ships detained in 1999 of 1,684 is still unacceptably high. BANNING OF SHIPS During 1999 a total of 9 ships were banned from the Paris MOU, because they failed to call at an agreed repair yard (4), jumped detentions (4) or were not certified in accordance with the ISM Code (1). By the end of 1999 the ban had been lifted on 9 ships after verification that all deficiencies had been rectified. The banning remained in place for 12 other ships.

Paris MOU
Annual Report 1999
10
Paris MOU on Port State Control
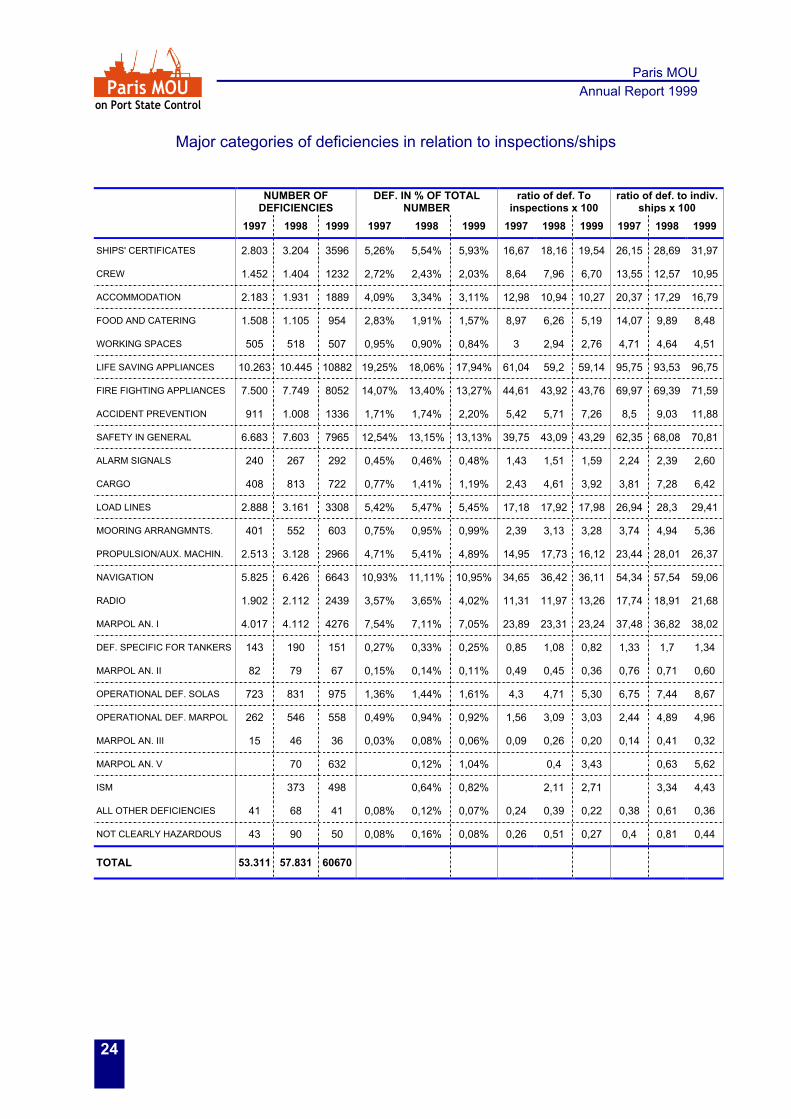
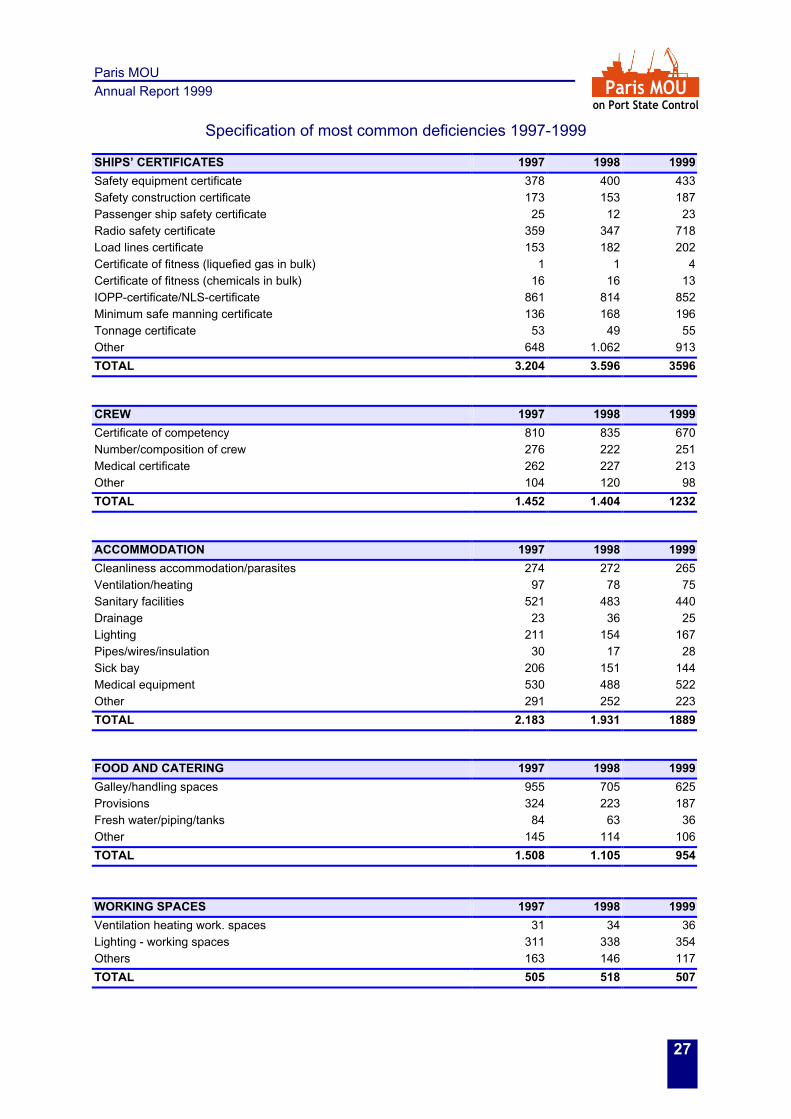
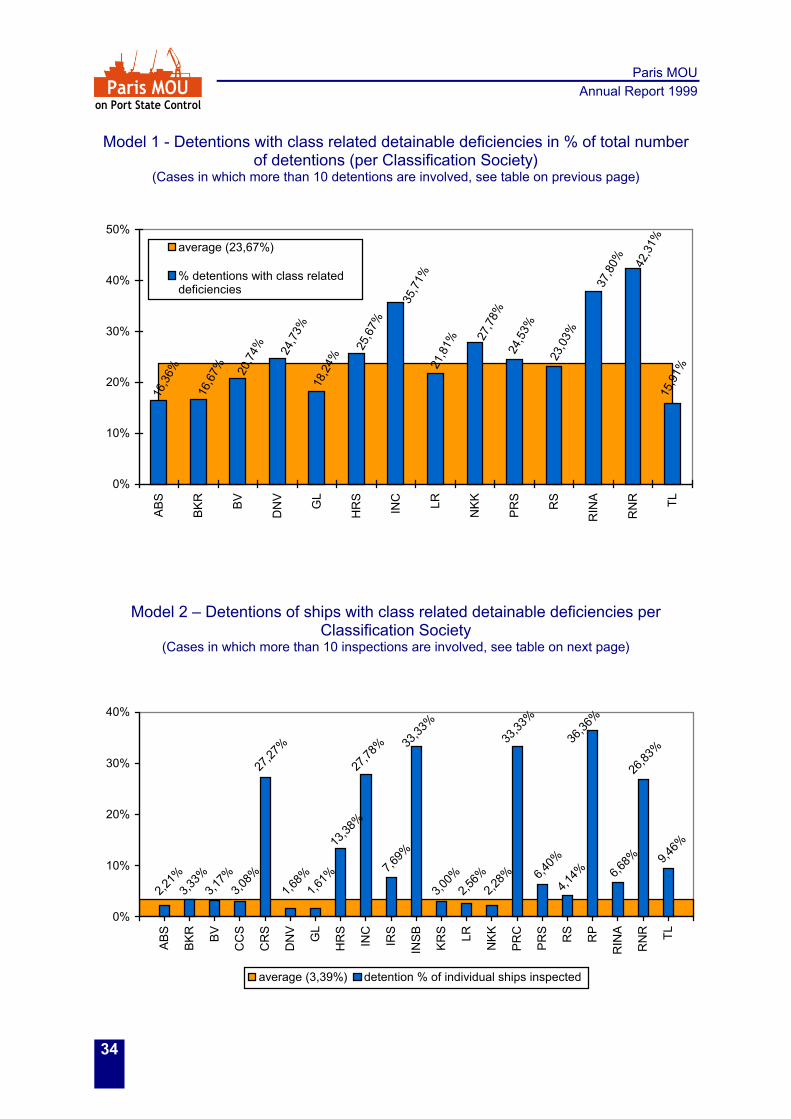
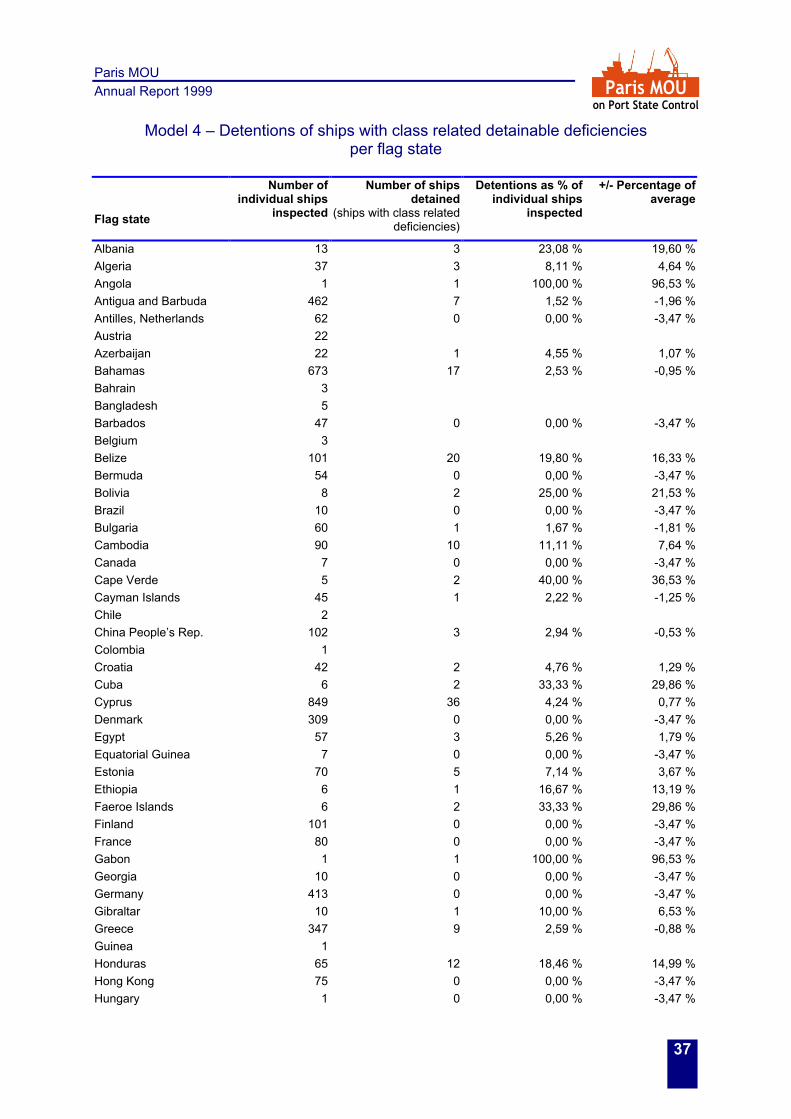
PERFORMANCE OF CLASSIFICATION SOCIETIES During 1999 information was recorded in the database concerning responsibility of classification societies for detainable deficiencies. When one or more detainable deficiencies could be attributed to the responsibility of a classification society in accordance with the criteria this was recorded and the class was informed accordingly. Out of 1,684 detentions 24% (400) were considered class related. When considering the ratio between detentions and individual ships inspected where 10 or more inspections were involved, Registro Internacional Navale (Portugal) 36.4%, International Naval Surveys Bureau (U.S.A.) 33.3%, Panama Register Corp 33.3%, Inclamar (Cyprus) 27.8% and Croatian Register of Shipping 27.3% scored highest. On the other hand, when comparing absolute numbers Lloyd’s Register of Shipping (U.K.) 53, Bureau Veritas (France) 45, Register of Shipping (Russia) 41, RINA (Italy) 31 and Germanischer Lloyd (Germany) 29 were involved in most class related detentions. DEFICIENCIES A total of 60,670 deficiencies were recorded during port State control inspections in 1999, a substantial increase (5%) on the number of 57,831 recorded in 1998 (53,331 in 1997). The increase in the number of deficiencies recorded may be a product of more selective targeting of ships for inspection. Prime safety areas, such as life saving appliances, fire fighting equipment, safety in general and navigation, still account for 55% of the total number of deficiencies. An increase in SOLAS and MARPOL operational deficiencies noted last year, remains a cause of concern. SOLAS related operational deficiencies increased
from 723 in 1997 to 975 deficiencies in 1999, MARPOL related operational deficiencies from 262 in 1997 to 558 in 1999. Garbage management violations increased from 70 in 1998 to 632 in 1999. The International Safety Management Code came into force for certain categories of ships from 1 July 1998. In the year under review 498 deficiencies were recorded. The figures indicate that older ships have more problems with the implementation of a management system. On ships older than 15 years the number of deficiencies is 6 times higher than on ships of less than 5 years old. The numbers of deficiencies for major categories of deficiencies may be expressed as a ratio of the number of inspections or as a ratio of the number of ships involved. The deficiency ratio for 1999 in relation to the number of individual ships involved amounted to 5.39 (1998: 5.17, 1997: 4.97; 1996: 5.26). However, the above deficiency ratios have been expressed in relation to all ships involved in port State control inspections, irrespective of whether or not deficiencies were found. Obviously, only ships in which deficiencies were found are responsible for the total number of deficiencies. Considering that in 10,255 inspections (55.74% of all inspections) deficiencies were noted, it is this number that is responsible for the total of 60,670 deficiencies. This implies that the deficiency ratio for inspections in which deficiencies were noted amounted to 5.92 (1998: 5.98; 1997: 6.02; 1996: 6.23), which is a decrease for the fourth year in a row.
Garbage management has become a focal area

Paris MOU Annual Report 1999
11
Paris MOU on Port State Control

Paris MOU
Annual Report 1999
12
Paris MOU on Port State Control
Basic port State control figures 1999 - 1
10.10
110
.455
11.25
2
10.69
4
10.56
3
10.25
610
.719 11
.16811
.248
9.000
9.500
10.000
10.500
11.000
11.500
12.000
1991
1992
1993
1994
1995
1996
1997
1998
1999
number of individual ships inspected
14.37
914
.783
17.29
4
16.96
4
16.38
1
16.07
0 16.81
317
.643
18.39
9
12.000
13.000
14.000
15.000
16.000
17.000
18.000
1991
1992
1993
1994
1995
1996
1997
1998
1999
number of inspections

Paris MOU Annual Report 1999
13
Paris MOU on Port State Control
Basic port State control figures 1999 - 2
25.93
027
.136
43.07
153
.21054
.451
53.96
7
53.31
157
.831
60.67
0
0
10.000
20.000
30.000
40.000
50.000
60.000
1991
1992
1993
1994
1995
1996
1997
1998
1999
number of deficiencies observed
525 58
892
6
1.597
1.837
1.719
1.624
1.598 1.6
84
0
250
500
750
1.000
1.250
1.500
1.750
2.000
1991
1992
1993
1994
1995
1996
1997
1998
1999
number of ships detained

Paris MOU
Annual Report 1999
14
Paris MOU on Port State Control
Basic port State control figures 1999 - 3
5,20% 5,6
2% 8,23%
14,93
% 17,39
%
16,76
%
15,15
%
14,31
%14
,97%
0%
5%
10%
15%
20%
1991
1992
1993
1994
1995
1996
1997
1998
1999
detentions in % of individual ships
3,65%
3,98%
6,39%
9,41% 11
,21%
10,70
%
9,66%
9,06%
9,15%
0%
5%
10%
15%
20%
1991
1992
1993
1994
1995
1996
1997
1998
1999
detentions in % of inspections
Paris MOU Annual Report 1999
15
Paris MOU on Port State Control
Inspection efforts – 1
Inspection efforts of members compared to target
0%
10%
20%
30%
40%
50%
60%
Belg
ium
Can
ada
Cro
atia
Den
mar
k
Finl
and
Fran
ce
Ger
man
y
Gre
ece
Irela
nd
Italy
Net
herla
nds
Nor
way
Pola
nd
Portu
gal
Rus
sian
Fed
erat
ion
Spai
n
Swed
en
Uni
ted
King
dom
All m
embe
rs
target (25%)inspection effort 1999 (%-IN)inspection effort 1998 (%-IN)

Paris MOU
Annual Report 1999
16
Paris MOU on Port State Control
Inspection efforts – 2 MOU port States’ individual contribution to the total amount of inspections
MOU port State Es
timat
ed
Ship
cal
ls
Insp
ectio
ns
Insp
ectio
ns
with
de
ficie
ncie
s
Det
entio
ns
Det
ents
with
C
lass
rela
ted
defic
ienc
ies
%-In
sp. W
ith
defic
ienc
ies
% D
etai
ned
% In
spec
ted
Ship
cal
ls
(25%
com
mitm
ent)
% In
spec
tion
of M
OU
tota
l Belgium 5686 1383 750 168 56 54,2 12,1 24,3% 7,5% Canada 3299 707 333 75 15 47,1 10,6 21,4% 3,8% Croatia 964 438 282 53 18 64,4 12,1 45,4% 2,4% Denmark 2600 590 166 31 11 28,1 5,3 22,7% 3,2% Finland 1442 448 171 34 12 38,2 7,6 31,1% 2,4% France 5792 819 426 91 51 52,0 11,1 14,1% 4,5% Germany 6980 1743 955 110 27 54,8 6,3 25,0% 9,5% Greece 2670 730 524 155 33 71,8 21,2 27,3% 4,0% Ireland 1330 100 68 11 5 68,0 11,0 7,5% 0,5% Italy 5850 2194 1023 211 43 46,6 9,6 37,5% 11,9% Netherlands the 5645 1825 912 139 20 50,0 7,6 32,3% 9,9% Norway 1830 358 130 24 19 36,3 6,7 19,6% 2,0% Poland 1914 601 356 37 12 59,2 6,2 31,4% 3,3% Portugal 2600 758 472 57 10 62,3 7,5 29,2% 4,1% Russian Federation 2726 1454 956 161 3 65,7 11,1 53,3% 7,9% Spain 5594 1654 1059 176 24 64,0 10,6 29,6% 9,0% Sweden 2700 727 307 17 4 42,2 2,3 26,9% 4,0% United Kingdom 6588 1870 1365 134 34 73,0 7,2 28,4% 10,2%
66210 18399 10255 1684 397 55,7% 9,15% 27,8% 100,0%
Russian Federation
6,51%
Portugal4,12%
Netherlands9,92%
Poland3,27%
Norway1,95%
Italy11,92%
Greece3,97%
France4,45%
Finland2,43%
Belgium7,52%
Canada3,84%
Denmark3,21%
Croatia2,38%
Germany9,47%
United Kingdom10,16%
Ireland0,54%
Sweden3,95%
Spain8,99%

Paris MOU Annual Report 1999
17
Paris MOU on Port State Control
Black – Grey – White Lists*
Flag state Inspections
1997-1999 Detentions1997-1999
Black to Grey Limit
(max allowed detentions)
Grey to White Limit
(min required detentions)
Excess Factor
B L A C K L I S T
Albania 36 18 5 10,50 Honduras 457 162 41 9,25 Belize 497 156 44 7,99 Lebanon 194 62 19 7,50 Syrian Arab Republic 359 109 33 7,47 Romania 310 79 29 5,83 Cambodia 286 71 27 5,57 Turkey 1987 436 158 5,48 Georgia 33 10 5 4,61 Algeria 179 40 18 4,47 Libyan Arab J. 105 25 12 4,42 St. Vincent and Gren. 1901 331 151
very
high
risk
4,00 Egypt 225 45 22 3,93 Morocco 193 39 19 3,88 Mauritius 33 8 5 3,03 Bangladesh 33 8 5
high risk
3,03 Ukraine 815 105 69 2,34 Malta 4225 467 323 2,09 Pakistan 35 7 5 2,06 Cyprus 4439 480 339
medium to high risk
2,02 Panama 4545 471 346 1,88 Malaysia 129 18 14 1,79 Cuba 62 10 8 1,76 Russian Federation 3143 308 244 1,65 Bulgaria 305 34 29 1,46 Thailand 125 16 13 1,45 Latvia 157 19 16 1,40 Croatia 202 23 20 1,34 Azerbaidzhan 97 12 11
medium
risk
1,16
G R E Y L I S T Lithuania 383 35 35 19 0,97 Faeroe Islands 43 6 6 -1 0,96 Kuwait 45 5 6 -1 0,78 Iran 146 13 15 5 0,75 Italy 623 48 54 33 0,70 Philippines 311 24 29 14 0,64 India 216 17 21 9 0,64 Antilles, Netherlands 248 19 24 11 0,62 Estonia 421 31 38 21 0,58 Cayman Islands 147 11 15 5 0,56 Tunisia 66 5 8 1 0,55 Portugal 520 37 46 27 0,53
� � � better performance � � � better perform
ance � � � better performance � � � better

Paris MOU
Annual Report 1999
18
Paris MOU on Port State Control
Flag state Inspections 1997-1999
Detentions1997-1999
Black to Grey Limit
(max allowed detentions)
Grey to White Limit
(min required detentions)
Excess Factor
Brazil 60 4 7 1 0,47 Qatar 48 3 6 -1 0,45 Tuvalu 76 4 9 2 0,34 Saudi Arabia 79 4 9 2 0,32 Greece 1477 97 120 87 0,31 Israel 99 5 11 3 0,29 Myanmar 32 1 5 -1 0,28 Vanuatu 134 7 14 5 0,28 Ethiopia 36 1 5 -1 0,25 Taiwan 103 4 11 3 0,16 Spain 139 6 15 5 0,16 Man, Isle of 407 22 37 20 0,14 Hong Kong 266 13 25 12 0,12 Luxembourg 113 4 12 3 0,11 Poland 407 21 37 20 0,08 Switzerland 64 1 8 1 0,05 China 458 23 41 23 0,02
W H I T E L I S T Barbados 298 13 14 -0,02 Korea, Republic of 155 5 6 -0,04 Bahamas 3142 184 196 -0,13 Antigua and Barbuda 2222 118 136 -0,28 Bermuda 184 5 7 -0,40 USA 161 4 6 -0,40 Liberia 2680 130 166 -0,47 Singapore 672 27 36 -0,49 France 303 9 14 -0,60 Austria 134 2 5 -0,70 Marshall Islands 324 9 15 -0,71 United Kingdom 521 15 27 -0,85 Denmark 1204 40 70 -0,89 Norway 2638 88 163 -1,01 Sweden 802 21 44 -1,07 Netherlands 2185 66 133 -1,10 Finland 439 8 22 -1,23 Ireland 243 3 10 -1,25 Germany 1814 42 109 -1,34 Japan 98 0 3 -2,00
� � better performance � � � better perform
ance � � � better performance �
* Explanatory note on page 40 p=7% z95% = 1.645 q = 3%

Paris MOU Annual Report 1999
19
Paris MOU on Port State Control
Inspections, detentions and deficiencies 1999
Flag state In
spec
tions
Det
entio
ns
Insp
ectio
ns
with
de
ficie
ncie
s
Det
entio
n-%
Insp
ectio
n-%
w
ith
defic
ienc
ies
Albania 15 9 14 60,0% 93,3%Algeria 60 24 56 40,0% 93,3%Angola 1 1 1 100,0% 100,0%Antigua and Barbuda 884 42 483 4,8% 54,6%Antilles, Netherlands 100 8 53 8,0% 53,0%Austria 43 0 12 0,0% 27,9%Azerbaijan 34 6 28 17,6% 82,4%Bahamas 1101 59 591 5,4% 53,7%Bahrain 5 0 2 0,0% 40,0%Bangladesh 10 0 10 0,0% 100,0%Barbados 86 1 47 1,2% 54,7%Belgium 3 0 1 0,0% 33,3%Belize 188 56 161 29,8% 85,6%Bermuda 69 2 24 2,9% 34,8%Bolivia 10 7 10 70,0% 100,0%Brazil 19 2 11 10,5% 57,9%Bulgaria 111 9 73 8,1% 65,8%Cambodia 158 48 141 30,4% 89,2%Canada 7 2 7 28,6% 100,0%Cape Verde 11 3 10 27,3% 90,9%Cayman Islands 59 5 28 8,5% 47,5%Chile 2 0 1 0,0% 50,0%China People's Rep. 132 3 62 2,3% 47,0%Colombia 1 0 1 0,0% 100,0%Croatia 66 5 32 7,6% 48,5%Cuba 12 3 11 25,0% 91,7%Cyprus 1455 145 916 10,0% 63,0%Denmark 459 9 171 2,0% 37,3%Egypt 87 19 68 21,8% 78,2%Equatorial Guinea 7 1 6 14,3% 85,7%Estonia 136 8 80 5,9% 58,8%Ethiopia 14 1 10 7,1% 71,4%Faeroe Islands 11 2 9 18,2% 81,8%Finland 170 4 77 2,4% 45,3%France 112 1 47 0,9% 42,0%Gabon 1 1 1 100,0% 100,0%Georgia 13 2 12 15,4% 92,3%Germany 647 17 242 2,6% 37,4%Gibraltar 12 2 9 16,7% 75,0%Greece 496 29 210 5,8% 42,3%Guinea 1 0 0 0,0% 0,0%Honduras 124 51 103 41,1% 83,1%Hong Kong 101 5 55 5,0% 54,5%Hungary 2 1 2 50,0% 100,0%Iceland 2 0 1 0,0% 50,0%

Paris MOU
Annual Report 1999
20
Paris MOU on Port State Control
Flag state In
spec
tions
Det
entio
ns
Insp
ectio
ns
with
de
ficie
ncie
s
Det
entio
n-%
Insp
ectio
n-%
w
ith
defic
ienc
ies
India 83 10 64 12,0% 77,1%Indonesia 3 0 3 0,0% 100,0%Iran 52 1 31 1,9% 59,6%Ireland 71 1 40 1,4% 56,3%Israel 29 0 3 0,0% 10,3%Italy 229 18 117 7,9% 51,1%Japan 34 0 11 0,0% 32,4%Korea Democratic Republic 4 2 4 50,0% 100,0%Korea, Republic of 36 0 17 0,0% 47,2%Kuwait 18 3 13 16,7% 72,2%Latvia 41 6 27 14,6% 65,9%Lebanon 77 23 67 29,9% 87,0%Liberia 933 38 419 4,1% 44,9%Libyan Arab J. 37 10 29 27,0% 78,4%Lithuania 123 12 84 9,8% 68,3%Luxemburg 44 1 16 2,3% 36,4%Malaysia 42 5 24 11,9% 57,1%Malta 1571 167 937 10,6% 59,6%Man, Isle of 140 7 55 5,0% 39,3%Marshall Islands 112 3 48 2,7% 42,9%Mauritius 10 1 6 10,0% 60,0%Mexico 4 0 2 0,0% 50,0%Morocco 55 13 45 23,6% 81,8%Myanmar, Union of 6 0 3 0,0% 50,0%Netherlands, the 788 23 338 2,9% 42,9%Nigeria 2 1 2 50,0% 100,0%Norway 939 30 426 3,2% 45,4%Pakistan 10 2 9 20,0% 90,0%Panama 1626 157 912 9,7% 56,1%Philippines 105 7 58 6,7% 55,2%Poland 118 6 53 5,1% 44,9%Portugal 212 19 117 9,0% 55,2%Qatar 17 2 11 11,8% 64,7%Romania 71 21 56 29,6% 78,9%Russian Federation 937 85 550 9,1% 58,7%Sao Tome and Principe 5 2 5 40,0% 100,0%Saudi Arabia 30 3 15 10,0% 50,0%Singapore 224 9 89 4,0% 39,7%Slovakia 1 0 0 0,0% 0,0%South Africa 6 1 1 16,7% 16,7%Spain 41 2 17 4,9% 41,5%Sri Lanka 10 0 3 0,0% 30,0%St Vincent & Grenadines 663 119 436 17,9% 65,8%Sudan 2 1 2 50,0% 100,0%Sweden 275 7 100 2,5% 36,4%Switzerland 22 0 6 0,0% 27,3%Syrian Arab Republic 124 41 112 33,1% 90,3%
Paris MOU Annual Report 1999
21
Paris MOU on Port State Control
Flag state In
spec
tions
Det
entio
ns
Insp
ectio
ns
with
de
ficie
ncie
s
Det
entio
n-%
Insp
ectio
n-%
w
ith
defic
ienc
ies
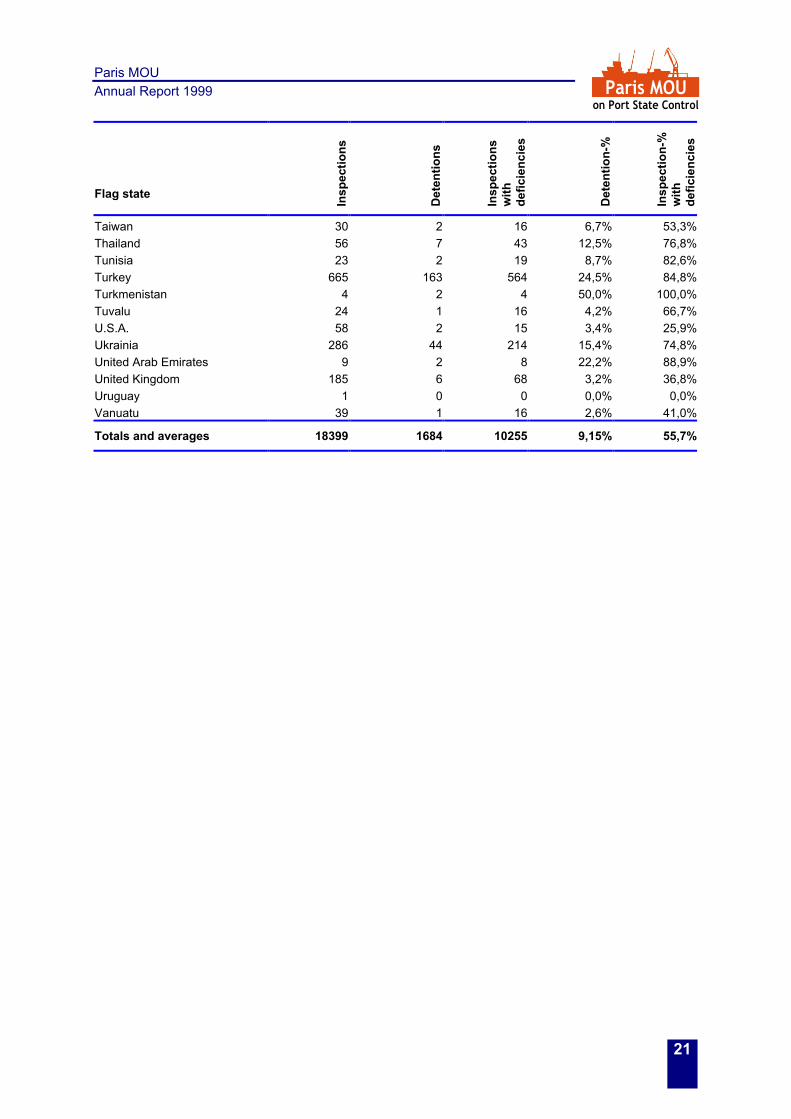
Taiwan 30 2 16 6,7% 53,3%Thailand 56 7 43 12,5% 76,8%Tunisia 23 2 19 8,7% 82,6%Turkey 665 163 564 24,5% 84,8%Turkmenistan 4 2 4 50,0% 100,0%Tuvalu 24 1 16 4,2% 66,7%U.S.A. 58 2 15 3,4% 25,9%Ukrainia 286 44 214 15,4% 74,8%United Arab Emirates 9 2 8 22,2% 88,9%United Kingdom 185 6 68 3,2% 36,8%Uruguay 1 0 0 0,0% 0,0%Vanuatu 39 1 16 2,6% 41,0%
Totals and averages 18399 1684 10255 9,15% 55,7%

Paris MOU
Annual Report 1999
22
Paris MOU on Port State Control
1999 detentions per Flag state, exceeding average percentage •= Only flags with more than 20 port State control inspections in 1999 are recorded in this table and the graph
on the next page •= The light area at the bottom of the graph represents the 1999 average detention percentage (9,15%)
Flag Inspections Detentions Detention %
Excess of average %
HONDURAS 124 51 41,13% 31,98% ALGERIA 60 24 40,00% 30,85% SYRIAN ARAB REPUBLIC 124 41 33,06% 23,91% CAMBODIA 158 48 30,38% 21,23% LEBANON 77 23 29,87% 20,72% BELIZE 188 56 29,79% 20,64% ROMANIA 71 21 29,58% 20,43% TURKEY 665 163 24,51% 15,36% MOROCCO 55 13 23,64% 14,49% EGYPT 87 19 21,84% 12,69% ST. VINCENT & GRENADINES 663 119 17,95% 8,80% AZERBAIDZHAN 34 6 17,65% 8,50% UKRAINIA 286 44 15,38% 6,23% LATVIA 41 6 14,63% 5,48% THAILAND 56 7 12,50% 3,35% INDIA 83 10 12,05% 2,90% MALAYSIA 42 5 11,90% 2,75% MALTA 1571 167 10,63% 1,48% CYPRUS 1455 145 9,97% 0,82% LITHUANIA 123 12 9,76% 0,61% PANAMA 1626 157 9,66% 0,51%
0%
5%
10%
15%
20%
25%
30%
35%
40%
45%
HO
ND
UR
AS
ALG
ERIA
SYR
IAN
AR
AB R
EP.
CAM
BOD
IA
LEBA
NO
N
BELI
ZE
RO
MAN
IA
TUR
KEY
MO
RO
CC
O
EGYP
T
ST. V
INC
ENT
& G
R.
AZER
BAID
ZHAN
UKR
AIN
IA
LATV
IA
THAI
LAN
D
IND
IA
MAL
AYSI
A
MAL
TA
CYP
RU
S
LITH
UAN
IA
PAN
AMA
Average detention percentage (9,15%)
Actual detention percentage

Paris MOU Annual Report 1999
23
Paris MOU on Port State Control
Inspections and detentions per ship type
SHIP TYPE In
spec
tions
Insp
ectio
ns
with
de
ficie
ncie
s
% o
f in
spec
tions
. w
ith
defic
ienc
ies
Indi
vidu
al
ship
s
Det
entio
ns
Det
entio
n. %
+/-
ave
rage
de
tent
ion
%
Bulk Carriers 5037 2894 57,45% 3361 442 8,78% -0,37%
Chemical Tankers 891 410 46,02% 591 55 6,17% -2,98%
Gas Carriers 244 75 30,74% 183 4 1,64% -7,51%
General Dry Cargo 6363 4151 65,24% 3567 849 13,34% 4,19%
Other Types 441 251 56,92% 364 34 7,71% -1,44%
Passengers Ships / Ferries 727 322 44,29% 400 37 5,09% -4,06%
Refrigerated Cargo 842 470 55,82% 575 70 8,31% -0,84%
Ro-Ro / Container / Vehicle 2370 1066 44,98% 1558 105 4,43% -4,72%
Tankers / Comb. Carriers 1484 616 41,51% 1051 88 5,93% -3,22%
All types 18399 10255 55,74% 11650 1684 9,15%
1999 Detention % of Inspections per ship type
0%
2%
4%
6%
8%
10%
12%
14%
16%
Bulk
Car
riers
Che
mic
al ta
nker
s
Gas
car
riers
Gen
eral
dry
car
go
Oth
er ty
pes
Pass
. Shi
ps /
ferri
es
Ref
ridge
rate
d ca
rgo
Ro-
ro /
cont
aine
r / v
ehic
le
tank
ers
/ com
b. C
arrie
rs
1999 Avarage Detention %-Insp
1999 Detention %-Insp
1999 % of Inspections w ith deficiencies
0%
10%
20%
30%
40%
50%
60%
70%
Bulk
Car
riers
Che
mic
al ta
nker
s
Gas
car
riers
Gen
eral
dry
car
go
Oth
er ty
pes
Pass
. Shi
ps /
ferri
es
Ref
ridge
rate
d ca
rgo
Ro-
ro /
cont
aine
r / v
ehic
le
tank
ers
/ com
b. C
arrie
rs
1999 Avarage (55,74 %-Insp)
1999 Detention %-Insp
Paris MOU
Annual Report 1999
24
Paris MOU on Port State Control
Major categories of deficiencies in relation to inspections/ships
NUMBER OF DEFICIENCIES
DEF. IN % OF TOTAL NUMBER
ratio of def. To inspections x 100
ratio of def. to indiv. ships x 100
1997 1998 1999 1997 1998 1999 1997 1998 1999 1997 1998 1999
SHIPS' CERTIFICATES 2.803 3.204 3596 5,26% 5,54% 5,93% 16,67 18,16 19,54 26,15 28,69 31,97
CREW 1.452 1.404 1232 2,72% 2,43% 2,03% 8,64 7,96 6,70 13,55 12,57 10,95
ACCOMMODATION 2.183 1.931 1889 4,09% 3,34% 3,11% 12,98 10,94 10,27 20,37 17,29 16,79
FOOD AND CATERING 1.508 1.105 954 2,83% 1,91% 1,57% 8,97 6,26 5,19 14,07 9,89 8,48
WORKING SPACES 505 518 507 0,95% 0,90% 0,84% 3 2,94 2,76 4,71 4,64 4,51
LIFE SAVING APPLIANCES 10.263 10.445 10882 19,25% 18,06% 17,94% 61,04 59,2 59,14 95,75 93,53 96,75
FIRE FIGHTING APPLIANCES 7.500 7.749 8052 14,07% 13,40% 13,27% 44,61 43,92 43,76 69,97 69,39 71,59
ACCIDENT PREVENTION 911 1.008 1336 1,71% 1,74% 2,20% 5,42 5,71 7,26 8,5 9,03 11,88
SAFETY IN GENERAL 6.683 7.603 7965 12,54% 13,15% 13,13% 39,75 43,09 43,29 62,35 68,08 70,81
ALARM SIGNALS 240 267 292 0,45% 0,46% 0,48% 1,43 1,51 1,59 2,24 2,39 2,60
CARGO 408 813 722 0,77% 1,41% 1,19% 2,43 4,61 3,92 3,81 7,28 6,42
LOAD LINES 2.888 3.161 3308 5,42% 5,47% 5,45% 17,18 17,92 17,98 26,94 28,3 29,41
MOORING ARRANGMNTS. 401 552 603 0,75% 0,95% 0,99% 2,39 3,13 3,28 3,74 4,94 5,36
PROPULSION/AUX. MACHIN. 2.513 3.128 2966 4,71% 5,41% 4,89% 14,95 17,73 16,12 23,44 28,01 26,37
NAVIGATION 5.825 6.426 6643 10,93% 11,11% 10,95% 34,65 36,42 36,11 54,34 57,54 59,06
RADIO 1.902 2.112 2439 3,57% 3,65% 4,02% 11,31 11,97 13,26 17,74 18,91 21,68
MARPOL AN. I 4.017 4.112 4276 7,54% 7,11% 7,05% 23,89 23,31 23,24 37,48 36,82 38,02
DEF. SPECIFIC FOR TANKERS 143 190 151 0,27% 0,33% 0,25% 0,85 1,08 0,82 1,33 1,7 1,34
MARPOL AN. II 82 79 67 0,15% 0,14% 0,11% 0,49 0,45 0,36 0,76 0,71 0,60
OPERATIONAL DEF. SOLAS 723 831 975 1,36% 1,44% 1,61% 4,3 4,71 5,30 6,75 7,44 8,67
OPERATIONAL DEF. MARPOL 262 546 558 0,49% 0,94% 0,92% 1,56 3,09 3,03 2,44 4,89 4,96
MARPOL AN. III 15 46 36 0,03% 0,08% 0,06% 0,09 0,26 0,20 0,14 0,41 0,32
MARPOL AN. V 70 632 0,12% 1,04% 0,4 3,43 0,63 5,62
ISM 373 498 0,64% 0,82% 2,11 2,71 3,34 4,43
ALL OTHER DEFICIENCIES 41 68 41 0,08% 0,12% 0,07% 0,24 0,39 0,22 0,38 0,61 0,36
NOT CLEARLY HAZARDOUS 43 90 50 0,08% 0,16% 0,08% 0,26 0,51 0,27 0,4 0,81 0,44
TOTAL 53.311 57.831 60670

Paris MOU Annual Report 1999
25
Paris MOU on Port State Control
Inspections with deficiencies FLAGS Inspections
1999Inspections with
deficiencies Percentage with
deficienciesAlbania 15 14 93,33%Algeria 60 56 93,33%Angola 1 1 100,00%Antigua and Barbuda 884 483 54,64%Antilles, Netherlands 100 53 53,00%Austria 43 12 27,91%Azerbaijan 34 28 82,35%Bahamas 1101 591 53,68%Bahrain 5 2 40,00%Bangladesh 10 10 100,00%Barbados 86 47 54,65%Belgium 3 1 33,33%Belize 188 161 85,64%Bermuda 69 24 34,78%Bolivia 10 10 100,00%Brazil 19 11 57,89%Bulgaria 111 73 65,77%Cambodia 158 141 89,24%Canada 7 7 100,00%Cape Verde 11 10 90,91%Cayman Islands 59 28 47,46%Chile 2 1 50,00%China People’s Republic 132 62 46,97%Colombia 1 1 100,00%Croatia 66 32 48,48%Cuba 12 11 91,67%Cyprus 1455 916 62,96%Denmark 459 171 37,25%Egypt 87 68 78,16%Equatorial Guinea 7 6 85,71%Estonia 136 80 58,82%Ethiopia 14 10 71,43%Faeroe Islands 11 9 81,82%Finland 170 77 45,29%France 112 47 41,96%Gabon 1 1 100,00%Georgia 13 12 92,31%Germany 647 242 37,40%Gibraltar 12 9 75,00%Greece 496 210 42,34%Guinea 1 0 0,00%Honduras 124 103 83,06%Hong Kong 101 55 54,46%Hungary 2 2 100,00%Iceland 2 1 50,00%India 83 64 77,11%Indonesia 3 3 100,00%Iran 52 31 59,62%Ireland 71 40 56,34%Israel 29 3 10,34%Italy 229 117 51,09%Japan 34 11 32,35%Korea, Democratic Republic 4 4 100,00%

Paris MOU
Annual Report 1999
26
Paris MOU on Port State Control
FLAGS Inspections1999
Inspections with deficiencies
Percentage with deficiencies
Korea, Republic of 36 17 47,22%Kuwait 18 13 72,22%Latvia 41 27 65,85%Lebanon 77 67 87,01%Liberia 933 419 44,91%Libyan Arab J. 37 29 78,38%Lithuania 123 84 68,29%Luxemburg 44 16 36,36%Malaysia 42 24 57,14%Malta 1571 937 59,64%Man, Isle of 140 55 39,29%Marshall Islands 112 48 42,86%Mauritius 10 6 60,00%Mexico 4 2 50,00%Morocco 55 45 81,82%Myanmar, Union of 6 3 50,00%Netherlands, the 788 338 42,89%Nigeria 2 2 100,00%Norway 939 426 45,37%Pakistan 10 9 90,00%Panama 1626 912 56,09%Philippines 105 58 55,24%Poland 118 53 44,92%Portugal 212 117 55,19%Qatar 17 11 64,71%Romania 71 56 78,87%Russian Federation 937 550 58,70%Sao Tome and Principe 5 5 100,00%Saudi Arabia 30 15 50,00%Singapore 224 89 39,73%Slovakia 1 0 0,00%South Africa 6 1 16,67%Spain 41 17 41,46%Sri Lanka 10 3 30,00%St Vincent & Grenadines 663 436 65,76%Sudan 2 2 100,00%Sweden 275 100 36,36%Switzerland 22 6 27,27%Syrian Arab Republic 124 112 90,32%Taiwan 30 16 53,33%Thailand 56 43 76,79%Tunisia 23 19 82,61%Turkey 665 564 84,81%Turkmenistan 4 4 100,00%Tuvalu 24 16 66,67%U.S.A. 58 15 25,86%Ukrainia 286 214 74,83%United Arab Emirates 9 8 88,89%United Kingdom 185 68 36,76%Uruguay 1 0 0,00%Vanuatu 39 16 41,03%TOTAL 18399 10255 55,74%
Paris MOU Annual Report 1999
27
Paris MOU on Port State Control
Specification of most common deficiencies 1997-1999 SHIPS’ CERTIFICATES 1997 1998 1999Safety equipment certificate 378 400 433Safety construction certificate 173 153 187Passenger ship safety certificate 25 12 23Radio safety certificate 359 347 718Load lines certificate 153 182 202Certificate of fitness (liquefied gas in bulk) 1 1 4Certificate of fitness (chemicals in bulk) 16 16 13IOPP-certificate/NLS-certificate 861 814 852Minimum safe manning certificate 136 168 196Tonnage certificate 53 49 55Other 648 1.062 913TOTAL 3.204 3.596 3596 CREW 1997 1998 1999Certificate of competency 810 835 670Number/composition of crew 276 222 251Medical certificate 262 227 213Other 104 120 98TOTAL 1.452 1.404 1232 ACCOMMODATION 1997 1998 1999Cleanliness accommodation/parasites 274 272 265Ventilation/heating 97 78 75Sanitary facilities 521 483 440Drainage 23 36 25Lighting 211 154 167Pipes/wires/insulation 30 17 28Sick bay 206 151 144Medical equipment 530 488 522Other 291 252 223TOTAL 2.183 1.931 1889 FOOD AND CATERING 1997 1998 1999Galley/handling spaces 955 705 625Provisions 324 223 187Fresh water/piping/tanks 84 63 36Other 145 114 106TOTAL 1.508 1.105 954 WORKING SPACES 1997 1998 1999Ventilation heating work. spaces 31 34 36Lighting - working spaces 311 338 354Others 163 146 117TOTAL 505 518 507

Paris MOU
Annual Report 1999
28
Paris MOU on Port State Control
LIFE SAVING APPLIANCES 1997 1998 1999Life boats 1580 1759 1674Life boat inventory 1047 936 935Rescue boats 185 200 249Rescue boat inventory 94 94 109Life rafts 831 849 815Launching/embarkation/stowage arrangements for boats/rafts 1771 1867 1975Distress signals/pyrotechnics 305 314 298Life buoys 1615 1726 1899Life jackets/immersion suits/thermal protective aids 1029 1007 1009Radio equipment for survival craft/EPIRB’s 315 391 570Line throwing apparatus 278 290 253Training/instruction manual/record of inspection/maintenance 540 584 697Other 673 428 399TOTAL 10.263 10.445 10882 FIRE FIGHTING APPLIANCES 1997 1998 1999Prevention 377 533 570Inert gas system 16 32 34Detection 205 292 302Fire fighting equipment 1055 1214 1203Fixed fire extinguishing installation 929 943 878Appliances (general equipment) 1037 871 1039Personal equipment 682 609 657Pumps 616 646 625Fire dampers/valves/quick dosing devices/remote control 2209 2210 2247International shore connection 57 84 83Other 317 315 414TOTAL 7.500 7.749 8052 ACCIDENT PREVENTION 1997 1998 1999Personal equipment 107 132 157Protection machines/machinery part 330 341 386Pipes/wires/insulation 174 186 202Other 300 349 591TOTAL 911 1.008 1336

Paris MOU Annual Report 1999
29
Paris MOU on Port State Control
SAFETY IN GENERAL 1997 1998 1999Dosing devices/watertight doors 309 293 420Signs/indications 668 1024 1145Safety plan 405 453 501Musters and drills 266 382 432Stability/strength 110 92 133Construction decks/beams/hull/bulkheads 757 933 1056Steering gear 350 371 356Hull damage impairing seaworthiness 192 189 158Ballast tanks/fuel tanks/other tanks 224 243 227Emergency lighting/batteries/switches 590 669 616Electrical equipment in general 715 768 794Pilot ladders 269 267 226Gangway/accommodation ladders 429 462 459Means of escape 384 417 354Other 1015 1040 1088TOTAL 6.683 7.603 7965 ALARM SIGNALS 1997 1998 1999General alarm 42 74 65Fire alarm 60 55 62Other 138 138 165TOTAL 240 267 292 CARGO 1997 1998 1999Stowage 45 71 73Grain 29 58 41Dangerous goods 93 93 65Loading and unloading equipment 152 162 167Holds and tanks 60 71 84Cargo securing manual - 246 208Other 29 112 84TOTAL 408 813 722 LOAD LINES 1997 1998 1999Overloading 33 40 27Freeboard marks 361 356 375Railings/catwalks 271 300 257Cargo hatchways/other hatchways 241 294 316Portable/non-portable hatchway covers (beams/tarpaulins etc.) 295 299 393Windows/side scuttles 238 234 207Doors 427 433 535Ventilators/air pipes/casings 621 714 662Other 401 491 536TOTAL 2.888 3.161 3308

Paris MOU
Annual Report 1999
30
Paris MOU on Port State Control
MOORING ARRANGEMENTS 1997 1998 1999Ropes/wires 72 118 199Anchoring devices 136 210 174Winches/capstans 86 100 95Other 107 124 135TOTAL 401 552 603 PROPULSION AND AUXILIARY MACHINERY 1997 1998 1999Propulsion/main engines 299 409 380Cleanliness of engine room 966 1128 1023Auxiliary machinery 412 604 674Bilge pumping arrangements 104 120 120Guards/fencing 174 173 137Insulation 75 88 62Other 483 606 570TOTAL 2.513 3.128 2966 NAVIGATION 1997 1998 1999Navigational equipment 358 413 455Radar 255 284 284Gyro compass 176 163 204Magnetic compass 581 772 905Lights/shapes/sounds/signals 742 652 632Signalling lamp 145 169 166Nautical charts 1264 1356 1430Nautical publications 2052 2270 2134Other 252 347 433TOTAL 5.825 6.426 6643 RADIO 1997 1998 1999Auto alarm/2182 kHz watch receiver 153 113 33Main installation 214 201 104Reserve installation 208 237 332VHF installation 80 129 146Direction finder 80 82 92EPIRB’s/radar transponder 675 705 748Other 492 645 984TOTAL 1.902 2.112 2439

Paris MOU Annual Report 1999
31
Paris MOU on Port State Control
MARINE POLLUTION – ANNEX I 1997 1998 1999MARPOL SOPEP 206 467 666Oil record book 1774 1530 1506Retention of oil on board 545 466 385Oily water separating equipment 534 619 729Oil discharge monitor and control system 236 240 22215 ppm alarm arrangements 218 249 275Standard discharge connection 44 35 39Pollution report – annex I 19 25 21Other 441 481 433TOTAL 4.017 4.112 4276 DEFICIENCIES SPECIFIC FOR TANKERS 1997 1998 1999Pump rooms/cargo handling spaces 18 11 26Cargo transfer 15 18 25instrumentation 21 44 15Fire protection cargo deck area 4 4 10Personal protection 14 18 18Other 71 95 57TOTAL 143 190 151 MARINE POLLUTION – ANNEX II 1997 1998 1999Cargo record book 28 22 20P + A manual 19 18 7Efficient stripping 2 1 5Residue discharge systems 3 5 1Ventilation procedures/equipment 4 1 6Ship type designation – annex II 3 0 Pollution report – annex II 0 1 2Other 23 31 26TOTAL 82 79 67
OPERATIONAL CONTROL SOLAS 1997 1998 1999Musters/drills/communication 269 316 352Fire/damage control plan 177 185 220Bridge/engine room/cargo operations 57 84 76Manuals/instructions/etc. 162 190 295Other 58 56 32TOTAL 723 831 975 OPERATIONAL CONTROL MARPOL 1997 1998 1999Oil/oily mixtures in machinery spaces 85 102 106garbage 138 381 382Other 39 63 70TOTAL 262 546 558

Paris MOU
Annual Report 1999
32
Paris MOU on Port State Control
MARINE POLLUTION – ANNEX III 1997 1998 1999Marine pollution – annex III 15 46 36TOTAL 15 46 36 MARINE POLLUTION – ANNEX V 1997 1998 1999Marine pollution – annex V - 70 632TOTAL - 70 632 ISM 1997 1998 1999ISM - 373 498TOTAL - 373 498 ALL OTHER DEFICIENCIES 1997 1998 1999All other deficiencies 41 68 41TOTAL 41 68 41 OTHER DEFICENCIES, NOT CLEARLY HAZARDOUS 1997 1998 1999Other deficiencies, not clearly hazardous 43 90 50TOTAL 43 90 50
TOTAL DEFICIENCIES 53.311 57.831 60.670

Paris MOU Annual Report 1999
33
Paris MOU on Port State Control
Model 1 - Detentions with class related detainable deficiencies in % of total number of detentions (per classification society)
Classification Society To
tal n
umbe
r of
dete
ntio
ns
Det
entio
ns w
ith
clas
s re
late
d de
ficie
ncie
s
Num
ber o
f in
divi
dual
shi
ps
Perc
enta
ge
Det
entio
ns w
ith
clas
s re
late
d de
ficie
ncie
s
+/- P
erce
ntag
e A
vera
ge
NO CLASS RECORDED 155 30 137 19,35 % -4,31 %CLASS WITHDRAWN 70 17 66 24,29 % 0,62 %CLASS NOT SPECIFIED 30 7 22 23,33 % -0,34 %AMERICAN BUREAU OF SHIPPING 110 18 100 16,36 % -7,31 %BIRO KLASIFIKASI INDONESIA 0 0 BULGARSKI KORABEN REGISTAR 12 2 12 16,67 % -7,00 %BUREAU VERITAS (FRANCE) 217 45 198 20,74 % -2,93 %CESKOSLOVENSKY LODIN REGISTER (CZECHOSL.) 2 0 2 0,00 % -23,67 %CHINA CLASSIFICATION SOCIETY (CCS) 4 4 4 100,00 % 76,33 %CHINA CORPORATION REGISTER OF SHIPPING 1 0 1 0,00 % -23,67 %CROATIAN REGISTER OF SHIPPING (CROATIA) 6 3 3 50,00 % 26,33 %DET NORSKE VERITAS (NORWAY) 93 23 90 24,73 % 1,06 %GERMANISCHER LLOYD (GERMANY) 159 29 144 18,24 % -5,43 %HELLENIC REGISTER OF SHIPPING (GREECE) 74 19 60 25,68 % 2,01 %HONDURAS INTER. NAVAL SURVE. AND INSP. BUR. 5 3 5 60,00 % 36,33 %INCLAMAR (CYPRUS) 14 5 11 35,71 % 12,05 %INDIAN REGISTER OF SHIPPING (INDIA) 3 1 3 33,33 % 9,66 %INTERNATIONAL NAVAL SURVEYS BUREAU (INSB) 10 3 7 30,00 % 6,33 %KOREAN REGISTER OF SHIPPING (SOUTH KOREA) 9 3 8 33,33 % 9,66 %LLOYD'S REGISTER OF SHIPPING (U.K.) 243 53 217 21,81 % -1,86 %NATIONAL SHIPPING ADJUSTERS INC 0 0 NIPPON KAIJI KYOKAI (JAPAN) 72 20 69 27,78 % 4,11 %NV UNITAS (BELGIUM) 0 0 PANAMA BUREAU OF SHIPPING (PANAMA) 3 1 3 33,33 % 9,66 %PANAMA MARITIME SURVEYORS BUREAU INC 4 3 3 75,00 % 51,33 %PANAMA REGISTER CORP (PANAMA) 1 1 1 100,00 % 76,33 %POLSKI REJESTR STATKOW (POLAND) 53 13 44 24,53 % 0,86 %REGISTER OF SHIPPING (RUSSIAN FED.) 178 41 166 23,03 % -0,63 %REGISTER OF SHIPPING PEOPLE'S R.C. (CHINA) 0 0 REGISTRI LAKNORI SHQIPTAR (ICELAND) 0 0 REGISTRO CUBANO DE BUQUES (CUBA) 1 1 1 100,00 % 76,33 %REGISTRO INTERNACIONAL NAVALE (PORTUGAL) 7 4 5 57,14 % 33,47 %REGISTRO ITALIANO NAVALE (ITALY) 82 31 72 37,80 % 14,14 %REGISTROL NAVAL ROMAN (ROMANIA) 26 11 22 42,31 % 18,64 %REJNOJ REGISTER RSFSR 0 0 SOCIEDAD DE REGISTRO/CLASS/MEXICANA SA 2 2 2 100,00 % 76,33 %TURKU LLOYD VAKFI (TURKEY) 44 7 37 15,91 % -7,76 %VIETNAM REGISTER OF SHIPPING (VIETNAM) 0 0 *) The information contained in the statistical material of Models 1-4 concerning classification societies were collected during the calendar year 1999 on the basis of provisional criteria for the assessment of class responsibility. Due to updating anomalies the figures may include a small margin of error. This margin is not greater than 3 percent to either side.
Paris MOU
Annual Report 1999
34
Paris MOU on Port State Control
Model 1 - Detentions with class related detainable deficiencies in % of total number of detentions (per Classification Society)
(Cases in which more than 10 detentions are involved, see table on previous page)
Model 2 – Detentions of ships with class related detainable deficiencies per Classification Society
(Cases in which more than 10 inspections are involved, see table on next page) 15
,91%21
,81% 24,5
3%
23,0
3%
37,8
0% 42,3
1%
27,7
8%
16,3
6%
35,7
1%
25,6
7%
18,2
4%
20,7
4%
16,6
7%
24,7
3%
0%
10%
20%
30%
40%
50%
ABS
BKR BV
DN
V GL
HR
S
INC LR
NKK
PRS
RS
RIN
A
RN
R TL
average (23,67%)
% detentions with class relateddeficiencies
33,33
%
9,46%
36,36
%
6,40%
2,56%
26,83
%
6,68%
4,14%
2,28%
1,61%
27,78
%
7,69%
33,33
%
3,00%
13,38
%
1,68%
27,27
%
3,08%
3,33%
2,21%
3,17%
0%
10%
20%
30%
40%
ABS
BKR BV
CC
S
CR
S
DN
V GL
HR
S
INC
IRS
INSB
KRS LR
NKK
PRC
PRS
RS
RP
RIN
A
RN
R TL
average (3,39%) detention % of individual ships inspected

Paris MOU Annual Report 1999
35
Paris MOU on Port State Control
Model 2 – Detentions of ships with class related detainable deficiencies per Classification Society
(Cases in which more than 10 inspections are involved)
Classification Society To
tal n
umbe
r of
insp
ectio
ns
Num
ber o
f in
divi
dual
shi
ps
insp
ecte
d To
tal n
umbe
r of
dete
ntio
ns
Det
entio
n-%
of
tota
l num
ber o
f in
spec
tions
+/- P
erce
ntag
e of
A
vera
ge
Det
entio
n-%
of
indi
vidu
al s
hips
in
spec
ted
+/- P
erce
ntag
e of
A
vera
ge
NO CLASS RECORDED 813 596 30 3,69 % 1,58 % 5,03 % 1,64 %CLASS WITHDRAWN 289 215 17 5,88 % 3,77 % 7,91 % 4,52 %CLASS NOT SPECIFIED 78 51 7 8,97 % 6,87 % 13,73 % 10,33 %AMERICAN BUREAU OF SHIPPING 1203 813 18 1,50 % -0,61 % 2,21 % -1,18 %BULGARSKI KORABEN REGISTAR 110 60 2 1,82 % -0,29 % 3,33 % -0,06 %BUREAU VERITAS (FRANCE) 2353 1418 45 1,91 % -0,20 % 3,17 % -0,22 %CHINA CLASSIFICATION SOCIETY (CCS) 175 130 4 2,29 % 0,18 % 3,08 % -0,31 %CHINA CORPORATION REGISTER OF SHIPPING 17 12 -0 0,00 % -2,11 % 0,00 % -3,39 %CROATIAN REGISTER OF SHIPPING (CROATIA) 25 11 3 12,00 % 9,89 % 27,27 % 23,88 %DET NORSKE VERITAS (NORWAY) 2090 1371 23 1,10 % -1,01 % 1,68 % -1,71 %GERMANISCHER LLOYD (GERMANY) 3278 1803 29 0,88 % -1,22 % 1,61 % -1,78 %HELLENIC REGISTER OF SHIPPING (GREECE) 260 142 19 7,31 % 5,20 % 13,38 % 9,99 %INCLAMAR (CYPRUS) 30 18 5 16,67 % 14,56 % 27,78 % 24,39 %INDIAN REGISTER OF SHIPPING (INDIA) 25 13 1 4,00 % 1,89 % 7,69 % 4,30 %INTERNATIONAL NAVAL SURVEYS BUREAU (INSB) 20 9 3 15,00 % 12,89 % 33,33 % 29,94 %KOREAN REGISTER OF SHIPPING (SOUTH KOREA) 138 100 3 2,17 % 0,06 % 3,00 % -0,39 %LLOYD'S REGISTER OF SHIPPING (U.K.) 3271 2067 53 1,62 % -0,49 % 2,56 % -0,83 %NIPPON KAIJI KYOKAI (JAPAN) 1222 877 20 1,64 % -0,47 % 2,28 % -1,11 %PANAMA REGISTER CORP (PANAMA) 10 3 1 10,00 % 7,89 % 33,33 % 29,94 %POLSKI REJESTR STATKOW (POLAND) 358 203 13 3,63 % 1,52 % 6,40 % 3,01 %REGISTER OF SHIPPING (RUSSIAN FED.) 1706 991 41 2,40 % 0,29 % 4,14 % 0,75 %REGISTRO INTERNACIONAL NAVALE (PORTUGAL) 32 11 4 12,50 % 10,39 % 36,36 % 32,97 %REGISTRO ITALIANO NAVALE (ITALY) 778 464 31 3,98 % 1,88 % 6,68 % 3,29 %REGISTROL NAVAL ROMAN (ROMANIA) 69 41 11 15,94 % 13,83 % 26,83 % 23,44 %REJNOJ REGISTER RSFSR 11 9 TURKU LLOYD VAKFI (TURKEY) 131 74 7 5,34 % 3,23 % 9,46 % 6,07 %

Paris MOU
Annual Report 1999
36
Paris MOU on Port State Control
Model 3 – Number of detentions per Classification Society (individual ships with class related detainable deficiencies)
Number of ships with class related
detainable deficiencies,1 Classification Society
detained once detained twiceNO CLASS RECORDED 28 1CLASS WITHDRAWN 15 1CLASS NOT SPECIFIED 3 2AMERICAN BUREAU OF SHIPPING 16 1BULGARSKI KORABEN REGISTAR 2 -BUREAU VERITAS (FRANCE) 43 1CESKOSLOVENSKY LODIN REGISTER (CZECHOSL.) - -CHINA CLASSIFICATION SOCIETY (CCS) 4 -CHINA CORPORATION REGISTER OF SHIPPING - -CROATIAN REGISTER OF SHIPPING (CROATIA) 3 -DET NORSKE VERITAS (NORWAY) 21 1GERMANISCHER LLOYD (GERMANY) 27 1HELLENIC REGISTER OF SHIPPING (GREECE) 13 3HONDURAS INTER. NAVAL SURVE. AND INSP. BUR. 3 -INCLAMAR (CYPRUS) 3 1INDIAN REGISTER OF SHIPPING (INDIA) 1 -INTERNATIONAL NAVAL SURVEYS BUREAU (INSB) 3 -KOREAN REGISTER OF SHIPPING (SOUTH KOREA) 3 -LLOYD'S REGISTER OF SHIPPING (U.K.) 49 2NIPPON KAIJI KYOKAI (JAPAN) 20 -PANAMA BUREAU OF SHIPPING (PANAMA) 1 -PANAMA MARITIME SURVEYORS BUREAU INC 1 1PANAMA REGISTER CORP (PANAMA) 1 -POLSKI REJESTR STATKOW (POLAND) 13 -REGISTER OF SHIPPING (RUSSIAN FED.) 41 -REGISTRO CUBANO DE BUQUES (CUBA) 1 -REGISTRO INTERNACIONAL NAVALE (PORTUGAL) 4 -REGISTRO ITALIANO NAVALE (ITALY) 29 1REGISTROL NAVAL ROMAN (ROMANIA) 9 1SOCIEDAD DE REGISTRO/CLASS/MEXICANA SA 2 -TURKU LLOYD VAKFI (TURKEY) 7 -
1 No ship has been detained more than 2 times in 1999
Paris MOU Annual Report 1999
37
Paris MOU on Port State Control
Model 4 – Detentions of ships with class related detainable deficiencies per flag state
Flag state
Number of individual ships
inspected
Number of ships detained
(ships with class related deficiencies)
Detentions as % of individual ships
inspected
+/- Percentage of average
Albania 13 3 23,08 % 19,60 %Algeria 37 3 8,11 % 4,64 %Angola 1 1 100,00 % 96,53 %Antigua and Barbuda 462 7 1,52 % -1,96 %Antilles, Netherlands 62 0 0,00 % -3,47 %Austria 22 Azerbaijan 22 1 4,55 % 1,07 %Bahamas 673 17 2,53 % -0,95 %Bahrain 3 Bangladesh 5 Barbados 47 0 0,00 % -3,47 %Belgium 3 Belize 101 20 19,80 % 16,33 %Bermuda 54 0 0,00 % -3,47 %Bolivia 8 2 25,00 % 21,53 %Brazil 10 0 0,00 % -3,47 %Bulgaria 60 1 1,67 % -1,81 %Cambodia 90 10 11,11 % 7,64 %Canada 7 0 0,00 % -3,47 %Cape Verde 5 2 40,00 % 36,53 %Cayman Islands 45 1 2,22 % -1,25 %Chile 2 China People’s Rep. 102 3 2,94 % -0,53 %Colombia 1 Croatia 42 2 4,76 % 1,29 %Cuba 6 2 33,33 % 29,86 %Cyprus 849 36 4,24 % 0,77 %Denmark 309 0 0,00 % -3,47 %Egypt 57 3 5,26 % 1,79 %Equatorial Guinea 7 0 0,00 % -3,47 %Estonia 70 5 7,14 % 3,67 %Ethiopia 6 1 16,67 % 13,19 %Faeroe Islands 6 2 33,33 % 29,86 %Finland 101 0 0,00 % -3,47 %France 80 0 0,00 % -3,47 %Gabon 1 1 100,00 % 96,53 %Georgia 10 0 0,00 % -3,47 %Germany 413 0 0,00 % -3,47 %Gibraltar 10 1 10,00 % 6,53 %Greece 347 9 2,59 % -0,88 %Guinea 1 Honduras 65 12 18,46 % 14,99 %Hong Kong 75 0 0,00 % -3,47 %Hungary 1 0 0,00 % -3,47 %

Paris MOU
Annual Report 1999
38
Paris MOU on Port State Control
Flag state
Number of individual ships
inspected
Number of ships detained
(ships with class related deficiencies)
Detentions as % of individual ships
inspected
+/- Percentage of average
Iceland 2 India 46 4 8,70 % 5,22 %Indonesia 3 Iran 37 0 0,00 % -3,47 %Ireland 36 0 0,00 % -3,47 %Israel 16 Italy 161 7 4,35 % 0,88 %Japan 27 Korea, Democratic Rep. 4 0 0,00 % -3,47 %Korea, Republic of 28 0 0,00 % -3,47 %Kuwait 13 1 7,69 % 4,22 %Latvia 23 0 0,00 % -3,47 %Lebanon 48 5 10,42 % 6,94 %Liberia 679 8 1,18 % -2,29 %Libyan Arab J. 16 2 12,50 % 9,03 %Lithuania 66 4 6,06 % 2,59 %Luxemburg 26 0 0,00 % -3,47 %Malaysia 32 1 3,13 % -0,35 %Malta 950 42 4,42 % 0,95 %Man, Isle of 94 1 1,06 % -2,41 %Marshall Islands 76 0 0,00 % -3,47 %Mauritius 6 0 0,00 % -3,47 %Mexico 4 Morocco 38 3 7,89 % 4,42 %Myanmar, Union of 4 Netherlands, the 468 2 0,43 % -3,04 %Nigeria 2 0 0,00 % -3,47 %Norway 596 7 1,17 % -2,30 %Pakistan 4 0 0,00 % -3,47 %Panama 1113 52 4,67 % 1,20 %Philippines 71 1 1,41 % -2,06 %Poland 65 3 4,62 % 1,14 %Portugal 110 6 5,45 % 1,98 %Qatar 11 0 0,00 % -3,47 %Romania 41 10 24,39 % 20,92 %Russian Federation 596 20 3,36 % -0,12 %Sao Tome and Principe 3 0 0,00 % -3,47 %Saudi Arabia 17 2 11,76 % 8,29 %Singapore 166 2 1,20 % -2,27 %Slovakia 1 South Africa 4 0 0,00 % -3,47 %Spain 33 0 0,00 % -3,47 %Sri Lanka 6 St Vincent & Grenadines 351 36 10,26 % 6,78 %Sudan 2 0 0,00 % -3,47 %Sweden 176 1 0,57 % -2,90 %Switzerland 13

Paris MOU Annual Report 1999
39
Paris MOU on Port State Control
Flag state
Number of individual ships
inspected
Number of ships detained
(ships with class related deficiencies)
Detentions as % of individual ships
inspected
+/- Percentage of average
Syrian Arab Republic 79 3 3,80 % 0,33 %Taiwan 18 0 0,00 % -3,47 %Thailand 32 5 15,63 % 12,15 %Tunisia 12 0 0,00 % -3,47 %Turkey 380 20 5,26 % 1,79 %Turkmenistan 3 0 0,00 % -3,47 %Tuvalu 11 0 0,00 % -3,47 %U.S.A. 44 0 0,00 % -3,47 %Ukrainia 189 6 3,17 % -0,30 %United Arab Emirates 7 1 14,29 % 10,81 %United Kingdom 138 0 0,00 % -3,47 %Uruguay 1 Vanuatu 31 0 0,00 % -3,47 %
Model 4 – Detentions of ships with class related detainable deficiencies per flag state above average (cases in which more than 10 individual ships are inspected)
4,67
%4,
62%
4,55
%4,
42%
4,35
%4,
24%
3,80
%
5,26
%
6,06
%
7,14
%
7,89
%
4,76
%
5,26
%
5,45
%
7,69
%11,7
6%
10,4
2%10
,26%
8,70
%8,
11%11
,11%
12,5
0%15,6
3%18,4
6%23,0
8%
24,3
9%
19,8
0%
0%
10%
20%
30%
40%
Rom
ania
Alba
nia
Beliz
e
Hon
dura
s
Thai
land
Liby
an A
rab
J.
Saud
i Ara
bia
Cam
bodi
a
Leba
non
St V
ince
nt &
Gre
nadi
nes
Indi
a
Alge
ria
Mor
occo
Kuw
ait
Esto
nia
Lith
uani
a
Portu
gal
Egyp
t
Turk
ey
Cro
atia
Pana
ma
Pola
nd
Azer
baija
n
Mal
ta
Italy
Cyp
rus
Syria
n Ar
ab R
epub
lic
average (3,47%)
detentions as % of individual ships inspected

Paris MOU
Annual Report 1999
40
Paris MOU on Port State Control
1
10
100
1000
30 50 100
250
500
1000
2000
Number of Inspections
Num
ber o
f Det
entio
ns EF= 4 EF= 3 EF= 2 EF= 1 Black EF= 0 White EF= -1 EF= -2
EF= 4 and above very high risk EF= 3 to 4 high risk EF= 2 to 3 medium to high risk EF= 1 to 2 medium risk
Explanatory note – Black, Grey and White lists The new normative listing of flag States provides an independent categorization that has been prepared on the basis of Paris MOU port State inspection results. Compared to the calculation method of previous year, this system has the advantage of providing an excess percentage that is significant and also reviewing the number of inspections and detentions over a 3-year period at the same time, based on binomial calculus. The performance of each flag State is calculated using a standard formula for statistical calculations in which certain values have been fixed in accordance with agreed Paris MOU policy. Two limits have been included in the new system, the ‘black to grey’ and the ‘grey to white’ limit, each with its own specific formula:
)1((5.0
)1((5.0
__
__
ppNzpNu
ppNzpNu
greytowhite
greytoblack
−⋅⋅−−⋅=
−⋅⋅++⋅=
In the formula “N” is the number of inspections, “p” is the allowable detention limit (yardstick), set to 7% by the Paris MOU Port State Control Committee, and “z” is the significance requested (z=1.645 for a statistically acceptable certainty level of 95%). The result “u“ is the allowed number of detentions for either the black or white list. The “u“ results can be found in the table as the ‘black to grey’ or the ‘grey to white’ limit. A number of detentions above this ‘black to grey’ limit means significantly worse than average, where a number of detentions below the ‘grey to white’ limit means significantly better than average. When the amount of detentions for a particular flag State is positioned between the two, the flag State will find itself on the grey list. The formula is applicable for sample sizes of 30 or more inspections.
To sort results on the black or white list, simply alter the target and repeat the calculation. Flags which are still significantly above this second target, are worse than the flags which are not. This process can be repeated, to create as many refinements as desired. (Of course the maximum detention rate remains 100%!) To make the flags’ performance comparable, the excess factor (EF) is introduced. Each incremental or decremental step corresponds with one whole EF-point of difference. Thus the excess factor EF is an indication for the number of times the yardstick has to be altered and recalculated. Once the excess factor is determined for all flags, the flags can be ordered by EF. The excess factor can be found in the last column the black, grey or white list. The target (yardstick) has been set on 7% and the size of the increment and decrement on 3%. The Black/Grey/White lists have been calculated in accordance with the above principles. The graphical representation of the system, below, is showing the direct relations between the number of inspected ships and the number of detentions. Both axis have a logarithmic character. A more detailed article is available at ‘www.parismou.org/AnnRep.html’

Paris MOU Annual Report 1999
41
Paris MOU on Port State Control
Secretariat Paris Memorandum of Understanding on Port State Control
pho
to: R
. Pie
rsm
a
Address Secretariat: Nieuwe Uitleg 1 PO Box 20904 2500 EX The Hague The Netherlands Telephone: +31 70 351 1508 Fax: +31 70 351 1599 Colophon Layout and design Secretariat Paris MOU Photographs Richard W. J. Schiferli Port State Authorities Litho and print Centre Administratif des Affaires Maritimes, Saint-Malo, France Web site The Paris MOU maintains a web site: www.par ismou.org . The site contains general information on the Paris MOU, up-to-date port State control developments and specifics on detained ships, as well as a version of this annual report in PDF-format.
Staff Mr. Richard W.J. Schiferli Secretary Telephone: +31 70 351 1509 E-mail: [email protected] Mr. Michael Voogel Deputy Secretary Telephone: +31 70 351 1510 E-mail: [email protected] Mrs. Natascha Dofferhoff Assistant Secretary Telephone: +31 70 351 1507 E-mail: [email protected] Mr. Arjan Ommering ICT Expert Telephone: +31 70 351 1375 E-mail: [email protected] Mr. Roy Welborn Office Manager Telephone: +31 70 351 1508 E-mail: [email protected]

Paris MOU
Annual Report 1999
42
Paris MOU on Port State Control
Paris MOU fact sheet – organizational structure
Observers: IMO, ILO,
other MOU’s
European Commission
Co-operating Maritime
Authorities
Maritime Authorities
Port State Control Committee
MOU Advisory Board (MAB)
SIReNaC Information System
Paris MOU Secretariat
Technical Working Groups
Ship inspection services of Paris MOU port States
Owners, flag States and classification societies