Embed Size (px)
Citation preview
Popularity of A level subjects among
UK university students
Statistical Report Series no. 52
Carmen Vidal Rodeiro and Tom Sutch
June 2013
Research Division Assessment Research and Development
Cambridge Assessment 1 Regent Street, Cambridge, CB2 1GG

2
Contents
1. Introduction ……………………….................…………….…………………………………………….... 3
2. Description of the data ...………………………………………………………………………………….. 4
3. Results ……………………………………………….………………..............…………….…………….. 6
3.1 Individual A level subjects ...…..………………………………….................…………….……….. 6
3.2 A level facilitating subjects …………………….………………….................…………….……….. 29
3.3 Combinations of A level subjects .……………….……………….................…………….……….. 34
Appendix A: University subjects and degree subject areas ..………………………………………........ 43
Appendix B: University groups ……………………………………………………………………………… 47
Appendix C: University acceptances by degree subject area and university mission group …...……. 51
Appendix D: Most popular A level subject combinations for degree subject areas …………………… 52

3
1. Introduction
In England the principal measure of academic attainment for 18 year-old pre-university learners is the A level, a general qualification in which learners are awarded grades to reflect their attainment in each subject that they have chosen to study.
In recent years, over 80 different subjects have been offered at A level by the three main awarding bodies in England. Learners can decide which and how many of those subjects they wish to study depending on, for example, their career choices, their academic ability, the provision at their school/college or the advice given to them. Students aiming for university typically study three or four subjects at A level.
Choosing A levels however is not straightforward as some subjects might be seen as providing better grounding for university courses than others.
The aim of this statistical research report was, therefore, to investigate the proportions of students who hold each A level subject (or combinations of A level subjects) when applying for a place at university.
In particular, the research focused on:
the uptake of A level subjects, and combinations of A level subjects, among university applicants and accepted applicants;
a comparison of the uptake of A level subjects, and combinations of A level subjects, between university applicants, accepted applicants and the whole A level cohort;
the uptake of A level subjects, and combinations of A level subjects, among accepted applicants
o by university group,
o by degree subject at university;
a comparison of performance in the most popular A level subjects, and in combinations of A level subjects, between accepted applicants and the whole A level cohort;
the performance in the most popular A level subjects, and in the combinations of A level subjects, among accepted applicants
o by university mission group,
o by degree subject at university1.
The outcomes of this research may inform the usefulness of specific A level subjects or combinations of A level subjects as currency for university study.
1 Analyses looking at A level performance by degree subject at university have been carried out and
are available upon request for each individual subject area. They are not included in this report as they would generate in excess of 30 pages of tables/graphs.

4
2. Description of the data
The main source of data for the analyses carried out in this report was provided by the Universities and Colleges Admissions Service (UCAS2) and contains, for all students applying to study at a UK university during the 2010/11 application cycle and who obtained at least one A level, the following information:
A level subjects studied
Grades achieved in the A level subjects
University mission group (accepted applicants only)
Subject of study at university (accepted applicants only)
Applicant flag
Accept flag
The subject of study at university was provided as a list of 180 subject lines (using the JACS3 system). These relate to the principal subject of the student’s qualification aim. The subject of study was aggregated into 25 broad degree subject areas. Appendix A lists the subject lines and degree subject areas used in this research.
For example, a student accepted to study for a degree in mathematics (G100) would be classified in the subject line ‘Mathematics’ and the subject area ‘Mathematical & Computer Science’. Similarly, a student accepted to study for a degree in statistics (G300) would be classified in the subject line ‘Statistics’ and the subject area ‘Mathematical & Computer Science’. The analyses presented in this report were carried out at degree subject area level.
The higher education institutions are considered in groups through which they share ideas and resources regarding issues and procedures in the higher education sector. The groups provided by UCAS for this research are4: The Russell Group, The 1994 Group, University Alliance and The Million+ Group. Appendix B shows a description of each group and provides a list of its members. It should be noted that some universities might not have joined any of the groups above and therefore would be classified as Other.
Appendix C contains general information on acceptances for higher education courses in the 2010/11 application cycle by university group and subject group5.
Data on the uptake of and performance in A level subjects for the full A level cohort in 2011 was obtained from the National Pupil Database (NPD). This database, compiled by the Department for Education, is a longitudinal database for all children in schools in England, linking student characteristics to school and college learning aims and attainment. The NPD holds pupil and school characteristics such as age, gender, ethnicity, level of deprivation, attendance and exclusions, matched to pupil level attainment data (Key Stage 2 to Key Stage 5 assessments and other external examinations).
2 UCAS cannot accept responsibility for any inferences or conclusions derived from the data by third
parties.
3 The Joint Academic Classification of Subjects (JACS) system is used by the Higher Education
Statistics Agency (HESA) and the Universities and Colleges Admissions Service (UCAS) to classify academic subjects, especially for undergraduate degrees. 4 UCAS did not provide data at individual institution level due to confidentiality issues.
5 Source: http://www.ucas.com/about_us/stat_services/stats_online/data_tables/datasummary.

5
In the following sections of this report, descriptive statistics provide information on the destinations (universities and degree subject areas) of students with each A level subject and with the most popular combinations of A level subjects.

6
3. Results
3.1 Individual A level subjects
3.1.1 Uptake
The tables presented in this section of the report show which individual A level subjects were most commonly held by undergraduates in UK higher education institutions in the academic year 2011/12.
As stated in Sections 1 and 2, the uptake of A level subjects is investigated in five university mission groups and in 25 degree subject areas. In order to simplify the presentation of the results from those analyses, degree subjects areas were grouped in five broad groups, as shown in Table 1, and five separate tables/figures were provided.
Table 1: Classification of degree subject area
Degree subject group Degree subject area
Group 1 Subjects allied to Medicine
Biological Sciences
Medicine & Dentistry
Veterinary Science, Agriculture & related subjects
Group 2 Architecture, Building and Planning
Engineering
Mathematics & Computer Science
Physical Sciences
Technologies
Group 3 Business & Administrative Studies
Mass Communications & Documentation
Creative Arts & Design
Education
Social Studies
Group 4 European Languages, Literature & related subjects
History & Philosophical studies
Law
Linguistics, Classics & related subjects
Non-European Languages & related subjects
Group 5 Combined Arts
Combined Sciences
Combined Social Sciences
Sciences combined with social sciences or arts
Social sciences combined with arts
General, other combined & unknown

7
Some of the tables in this section display a comparison of the uptake of A level subjects between university applicants, accepted applicants and the whole A level cohort. It should be noted though that some A level subjects featured in the UCAS data and not in the June 2011 extract of the NPD. Some examples of this were Divinity, Hindi, Biblical Hebrew or Islamic Studies, which students applying to university held but did not appear in the NPD. One possible explanation for this is that the coding of the subjects was different in both datasets and, for example, Biblical Hebrew, present in the UCAS data as such, appeared in the NPD under ‘Other Classical Languages’.
Table 2 shows the uptake of individual A level subjects among university applicants in the 2010/11 application cycle and it compares that to the uptake of these subjects by the whole A level cohort in 2011. All A level subjects present in the UCAS data were included in the table and were ordered alphabetically. Thus, Accounting, the subject presented first, was taken by 1.5% of the university applicants in the 2010/11 admissions cycle. This compares with Accounting being taken by 1.4% of the accepted applicants for undergraduate courses and 0.9% of the A level cohort in 2011.
The most popular subject among university applicants was Mathematics (around 30% of the accepted applicants held an A level in this subject), followed by Biology, History, Chemistry and English Literature. It should be noted that the order of the subjects by their popularity was fairly similar in all three groups of students.
The percentages of students holding STEM (Science, Technology, Engineering and Mathematics) subjects at A level was higher among accepted applicants and university applicants in general than among all A level students. This pattern was also similar in most humanities subjects but reversed in subjects such as Art & Design, Music, and Design & Technology.
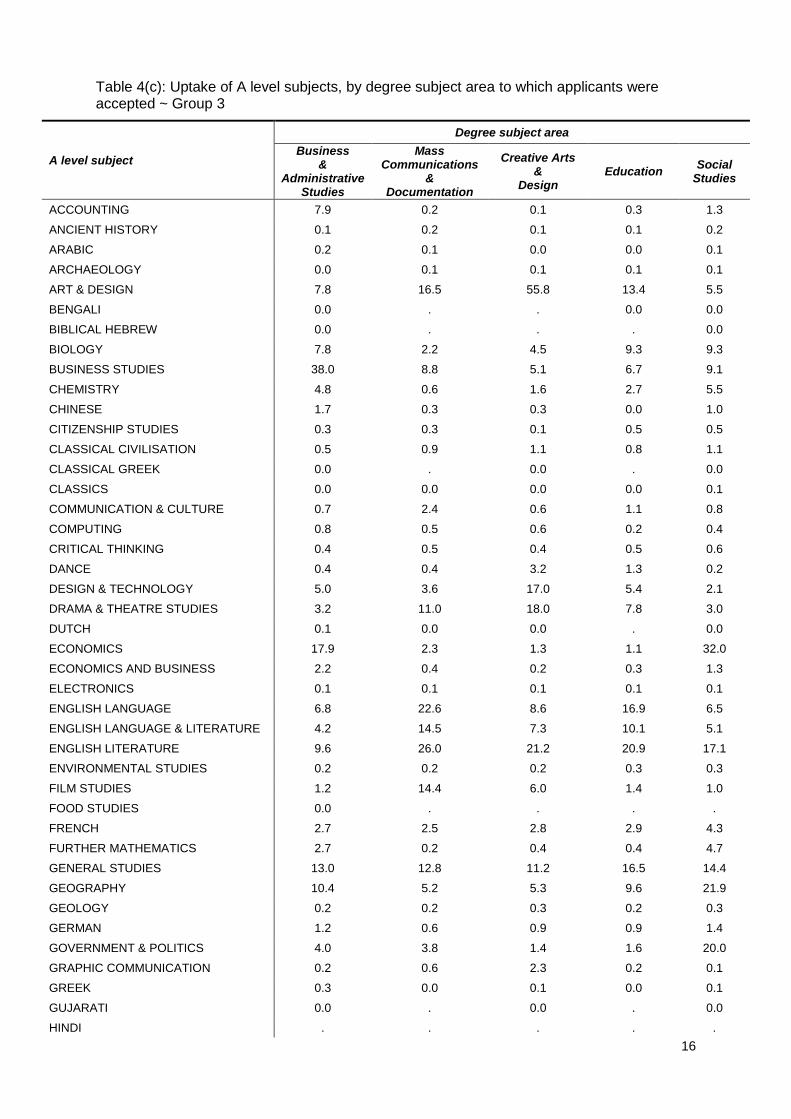
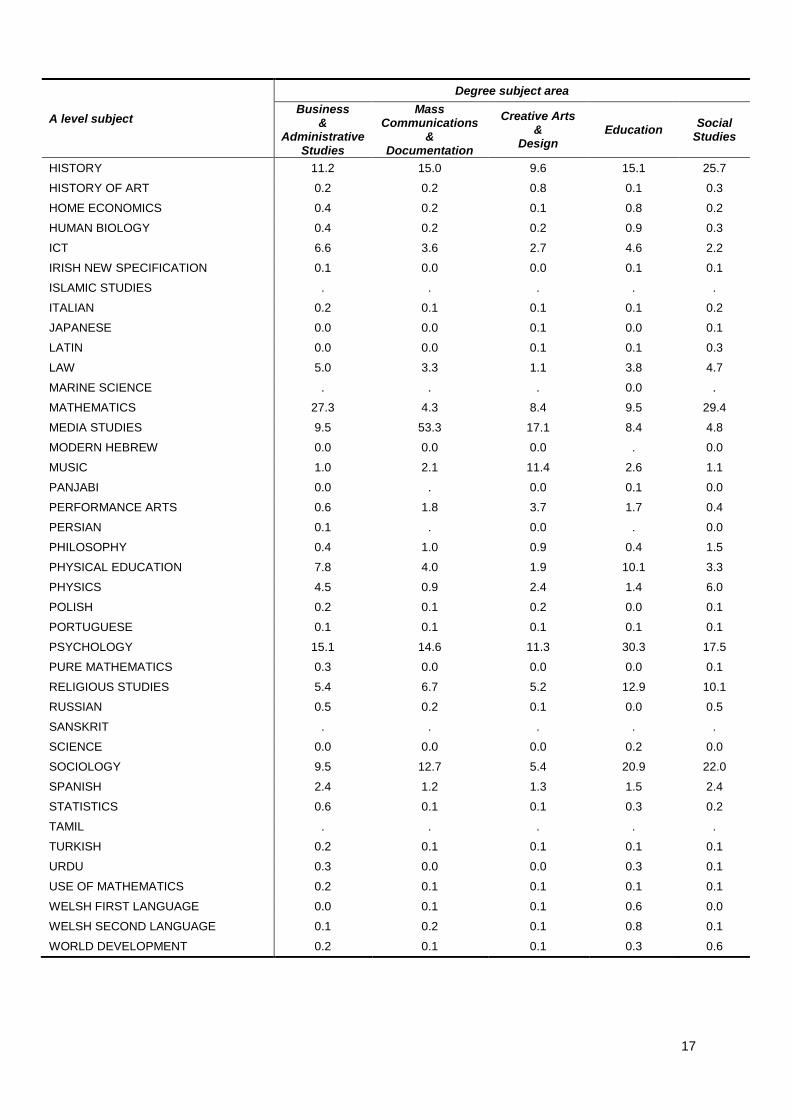
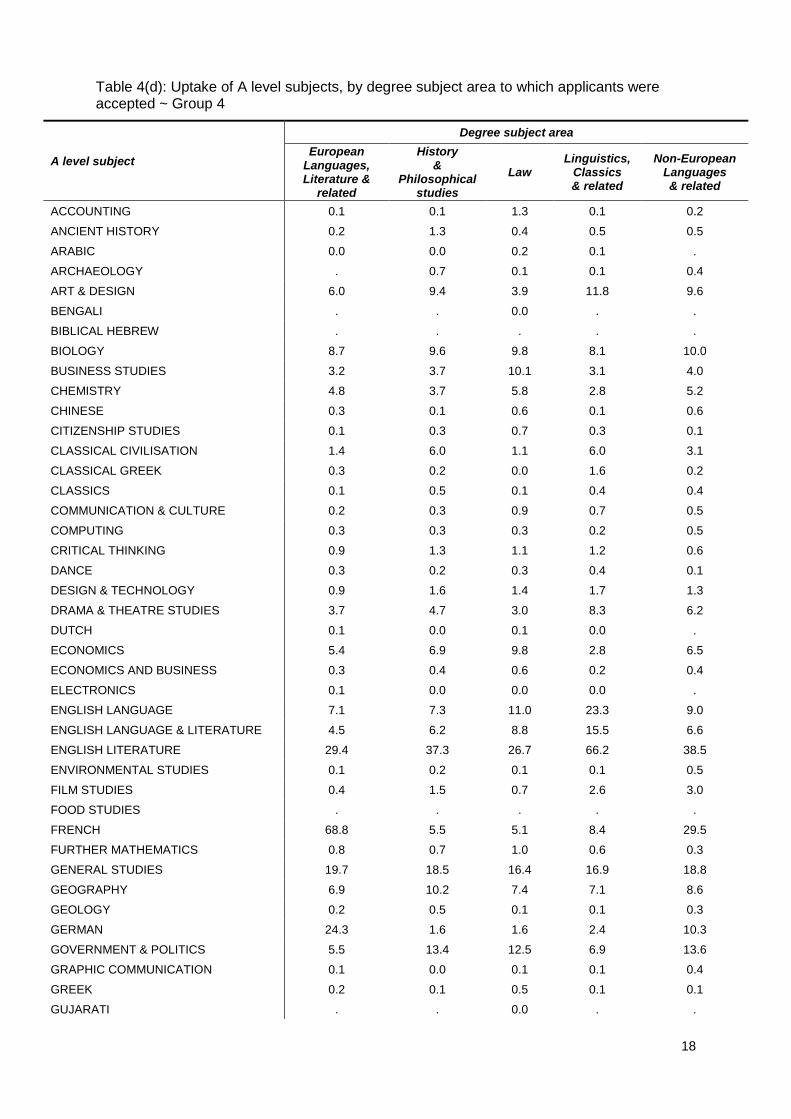
The uptake of individual A level subjects (as above) is presented, broken down by degree subject and university mission group in Table 3 and Tables 4(a) to 4(e), respectively.
Table 3 shows, for example, that Mathematics was taken by 50.9% of the accepted applicants to Russell Group universities, 43.3% of the accepted applicants to universities in the 1994 Group, and 20.9% and 15.7% of the accepted applicants to universities in the University Alliance and the Million+ groups, respectively.
Table 3 also shows that students accepted to Russell Group and 1994 Group universities held in higher proportions A levels in other STEM subjects (e.g. Biology, Chemistry, Physics, Further Mathematics) and in foreign languages (e.g. French, German, Spanish) than students accepted to universities in the University Alliance or the Million+ Group. There was also variation in the uptake between university groups of more applied subjects (e.g. Design & Technology, Art & Design, Business Studies, ICT, Media Studies) or humanities (e.g. Psychology, Sociology). However, higher proportions of students in the University Alliance or the Million+ Group universities held A levels in those subjects than students in universities of the Russell Group and the 1994 Group.
Tables 4(a) to 4(e), presenting the uptake of individual A level subjects by degree subject, show, for example, that Mathematics was taken by 68.2% of the candidates accepted to pursue a degree in ‘Mathematics & Computer Science’, by 33.2% of the candidates accepted to ‘Subjects allied to Medicine’ degrees and by only 18.2% of the candidates accepted to study ‘European Languages, Literature & related subjects’.

8
Table 2: Uptake of A level subjects6
A level subject University applicants
(N = 304867) Accepted applicants
(N = 252126) A level students
(N = 291611) Acceptance
rate (%)
ACCOUNTING 1.5 1.4 0.9 76.4
ANCIENT HISTORY 0.2 0.2 0.2 84.9
ARABIC 0.2 0.1 0.1 69.2
ARCHAEOLOGY 0.1 0.1 0.1 87.3
ART & DESIGN 13.0 12.8 15.8 81.6
BENGALI 0.0 0.0 0.0 82.1
BIBLICAL HEBREW 0.0 0.0 . 66.7
BIOLOGY 21.3 21.3 15.5 82.7
BUSINESS STUDIES 9.6 9.7 7.4 83.4
CHEMISTRY 18.1 18.1 12.1 82.6
CHINESE 0.9 0.8 0.6 77.0
CITIZENSHIP STUDIES 0.2 0.2 0.2 87.0
CLASSICAL CIVILISATION 1.2 1.3 1.0 86.9
CLASSICAL GREEK 0.1 0.1 0.1 88.2
CLASSICS 0.1 0.1 0.1 84.4
COMMUNICATION & CULTURE 0.6 0.6 0.5 83.9
COMPUTING 1.2 1.3 1.0 86.4
CRITICAL THINKING 0.6 0.7 0.5 88.8
DANCE 0.7 0.6 0.7 74.2
DESIGN & TECHNOLOGY 5.6 5.6 5.7 82.9
DIVINITY 0.0 . . 0.0
DRAMA & THEATRE STUDIES 5.3 5.1 4.4 79.5
DUTCH 0.0 0.0 0.0 80.6
ECONOMICS 8.5 8.6 5.8 83.7
ECONOMICS AND BUSINESS 0.7 0.7 0.6 85.9
ELECTRONICS 0.4 0.4 0.3 86.7
ENGLISH LANGUAGE 7.5 7.7 6.7 84.8
ENGLISH LANGUAGE & LITERATURE 5.6 5.7 4.6 84.5
ENGLISH LITERATURE 17.3 17.9 13.2 85.6
ENVIRONMENTAL STUDIES 0.4 0.5 0.4 86.3
FILM STUDIES 2.1 2.1 1.8 82.2
FOOD STUDIES 0.0 0.0 . 55.6
FRENCH 4.6 4.9 3.5 87.9
FURTHER MATHEMATICS 4.8 5.1 3.1 88.4
GENERAL STUDIES 13.7 14.8 13.1 89.4
GEOGRAPHY 10.6 11.2 8.3 87.3
GEOLOGY 0.6 0.6 0.5 87.7
GERMAN 1.6 1.7 1.3 87.6
GOVERNMENT & POLITICS 5.1 5.4 3.8 87.5
GRAPHIC COMMUNICATION 0.4 0.4 . 82.0
6 In the following tables percentages have been rounded and, therefore, even when the uptake is 0.0
there are a very small number of candidates taking the A level subject. ‘.’ indicates that no candidates took the subject.

9
A level subject University applicants
(N = 304867) Accepted applicants
(N = 252126) A level students
(N = 291611) Acceptance
rate (%)
GREEK 0.1 0.1 0.0 85.6
GUJARATI 0.0 0.0 0.0 73.3
HINDI 0.0 0.0 . 25.0
HISTORY 17.4 18.3 13.5 87.1
HISTORY OF ART 0.4 0.4 0.3 82.1
HOME ECONOMICS 0.3 0.3 0.1 79.9
HUMAN BIOLOGY 0.8 0.7 . 81.5
ICT 3.6 3.6 2.5 82.2
IRISH NEW SPECIFICATION 0.1 0.1 . 71.1
ISLAMIC STUDIES 0.0 0.0 . 100.0
ITALIAN 0.2 0.2 0.2 86.4
JAPANESE 0.1 0.1 0.1 81.3
LATIN 0.5 0.5 0.4 88.7
LAW 4.6 4.7 3.6 85.3
MARINE SCIENCE 0.0 0.0 . 42.9
MATHEMATICS 29.4 30.0 20.3 84.5
MEDIA STUDIES 8.1 8.0 6.9 82.2
MODERN HEBREW 0.0 0.0 0.0 69.4
MUSIC 2.9 2.9 3.3 83.1
PANJABI 0.0 0.0 0.0 87.2
PERFORMANCE ARTS 0.9 0.9 0.4 75.8
PERSIAN 0.0 0.1 0.0 89.1
PHILOSOPHY 1.1 1.1 0.9 86.7
PHYSICAL EDUCATION 6.1 6.1 5.1 82.1
PHYSICS 12.4 12.6 8.3 84.4
POLISH 0.1 0.1 0.1 84.1
PORTUGUESE 0.1 0.1 0.1 80.1
PSYCHOLOGY 18.3 18.7 15.2 84.6
PURE MATHEMATICS 0.2 0.2 0.0 79.2
RELIGIOUS STUDIES 7.5 7.7 5.4 84.8
RUSSIAN 0.3 0.3 0.2 87.2
SANSKRIT 0.0 0.0 . 100.0
SCIENCE 0.1 0.1 0.1 83.9
SOCIOLOGY 9.7 9.8 7.4 83.2
SPANISH 2.6 2.8 1.9 86.9
STATISTICS 0.3 0.3 0.2 82.4
TAMIL 0.0 0.0 . 100.0
TURKISH 0.1 0.1 0.1 83.2
URDU 0.2 0.1 0.1 64.4
USE OF MATHEMATICS 0.1 0.1 0.1 81.0
WELSH FIRST LANGUAGE 0.1 0.1 . 88.7
WELSH SECOND LANGUAGE 0.2 0.2 0.0 82.7
WORLD DEVELOPMENT 0.2 0.2 0.1 84.1

10
Table 3: Uptake of A level subjects, by university mission group to which applicants were accepted
A level subject
University Mission Group
Russell Group
(N =61514 )
1994 Group
(N = 32340)
University Alliance
(N = 63027)
Million+ Group
(N = 44226)
Other
(N = 51019)
ACCOUNTING 1.2 1.4 1.5 1.7 1.3
ANCIENT HISTORY 0.3 0.3 0.2 0.1 0.2
ARABIC 0.1 0.1 0.1 0.2 0.1
ARCHAEOLOGY 0.1 0.1 0.1 0.1 0.2
ART & DESIGN 6.9 7.8 14.7 14.8 18.2
BENGALI 0.0 . 0.0 0.0 0.0
BIBLICAL HEBREW 0.0 0.0 0.0 . .
BIOLOGY 30.7 23.2 18.4 14.2 17.9
BUSINESS STUDIES 5.1 7.1 12.9 12.5 9.9
CHEMISTRY 33.5 22.4 11.9 9.0 11.8
CHINESE 1.7 1.6 0.3 0.3 0.4
CITIZENSHIP STUDIES 0.1 0.2 0.3 0.4 0.3
CLASSICAL CIVILISATION 1.8 1.8 0.9 0.8 1.2
CLASSICAL GREEK 0.3 0.2 0.0 . 0.0
CLASSICS 0.1 0.1 0.1 0.0 0.1
COMMUNICATION & CULTURE 0.2 0.3 0.7 1.1 0.7
COMPUTING 1.1 1.5 1.5 1.5 0.9
CRITICAL THINKING 1.0 1.0 0.5 0.4 0.4
DANCE 0.2 0.2 0.6 1.1 1.0
DESIGN & TECHNOLOGY 2.7 3.4 7.6 6.6 7.0
DRAMA & THEATRE STUDIES 3.1 4.9 5.3 6.0 6.3
DUTCH 0.0 0.0 0.0 0.1 0.0
ECONOMICS 13.2 13.9 6.6 4.7 5.3
ECONOMICS AND BUSINESS 0.5 0.7 0.9 0.7 0.6
ELECTRONICS 0.4 0.4 0.5 0.3 0.3
ENGLISH LANGUAGE 4.7 5.4 9.8 9.1 8.7
ENGLISH LANGUAGE & LITERATURE 3.1 4.5 6.5 7.6 6.6
ENGLISH LITERATURE 19.5 22.6 15.5 15.6 17.4
ENVIRONMENTAL STUDIES 0.3 0.4 0.7 0.3 0.5
FILM STUDIES 0.5 1.1 2.6 3.4 2.7
FOOD STUDIES 0.0 . 0.0 0.0 .
FRENCH 8.8 7.5 2.8 2.0 3.3
FURTHER MATHEMATICS 13.2 9.3 1.2 0.7 1.4
GENERAL STUDIES 16.8 16.4 16.4 11.2 12.0
GEOGRAPHY 13.1 13.9 11.5 7.1 10.0
GEOLOGY 0.7 0.8 0.7 0.3 0.5
GERMAN 3.0 2.4 1.1 0.9 1.3
GOVERNMENT & POLITICS 7.3 8.1 4.3 3.4 4.4
GRAPHIC COMMUNICATION 0.1 0.1 0.5 0.6 0.7
GREEK 0.2 0.2 0.1 0.1 0.1

11
A level subject
University Mission Group
Russell Group
(N =61514 )
1994 Group
(N = 32340)
University Alliance
(N = 63027)
Million+ Group
(N = 44226)
Other
(N = 51019)
GUJARATI 0.0 . 0.0 0.0 .
HINDI 0.0 . . . .
HISTORY 22.4 24.5 16.4 12.7 16.0
HISTORY OF ART 0.6 0.5 0.2 0.1 0.3
HOME ECONOMICS 0.2 0.1 0.3 0.2 0.6
HUMAN BIOLOGY 0.5 0.6 0.9 0.8 0.7
ICT 1.7 1.8 4.4 4.7 4.6
IRISH NEW SPECIFICATION 0.2 0.0 0.0 0.0 0.2
ISLAMIC STUDIES . . . 0.0 .
ITALIAN 0.4 0.4 0.1 0.1 0.2
JAPANESE 0.1 0.1 0.0 0.0 0.0
LATIN 1.4 1.0 0.1 0.0 0.1
LAW 2.5 3.6 6.1 6.7 4.4
MARINE SCIENCE . . 0.0 0.0 0.0
MATHEMATICS 50.9 43.3 20.9 15.7 19.4
MEDIA STUDIES 1.8 3.4 10.2 13.6 10.6
MODERN HEBREW 0.0 0.0 0.0 0.0 0.0
MUSIC 2.9 2.9 2.3 2.8 3.4
PANJABI 0.0 0.0 0.0 0.1 0.0
PERFORMANCE ARTS 0.2 0.4 0.9 1.3 1.4
PERSIAN 0.0 0.1 0.0 0.1 0.1
PHILOSOPHY 1.4 1.8 0.8 0.9 1.0
PHYSICAL EDUCATION 2.6 4.3 7.9 7.8 7.3
PHYSICS 23.9 18.8 8.2 5.1 6.8
POLISH 0.1 0.1 0.2 0.2 0.1
PORTUGUESE 0.1 0.1 0.1 0.1 0.1
PSYCHOLOGY 11.8 16.2 22.4 23.9 18.8
PURE MATHEMATICS 0.3 0.4 0.1 0.0 0.1
RELIGIOUS STUDIES 8.4 7.8 6.9 6.5 8.5
RUSSIAN 0.5 0.4 0.1 0.1 0.2
SANSKRIT . 0.0 . . 0.0
SCIENCE 0.0 0.0 0.1 0.0 0.1
SOCIOLOGY 4.6 6.6 11.5 15.2 10.8
SPANISH 4.5 3.9 1.8 1.6 2.0
STATISTICS 0.2 0.3 0.3 0.4 0.2
TAMIL . 0.0 . . 0.0
TURKISH 0.1 0.1 0.1 0.2 0.1
URDU 0.1 0.1 0.1 0.2 0.1
USE OF MATHEMATICS 0.0 0.1 0.2 0.2 0.1
WELSH FIRST LANGUAGE 0.1 0.0 0.2 0.0 0.2
WELSH SECOND LANGUAGE 0.1 0.1 0.3 0.0 0.3
WORLD DEVELOPMENT 0.1 0.2 0.2 0.2 0.2

12
Table 4(a): Uptake of A level subjects, by degree subject area to which applicants were accepted ~ Group 1
A level subject
Degree subject area
Subjects allied to Medicine
Biological Sciences
Medicine &
Dentistry
Veterinary Science, Agriculture &
Related subjects
ACCOUNTING 0.3 0.2 0.1 0.2
ANCIENT HISTORY 0.0 0.1 0.1 0.2
ARABIC 0.3 0.1 0.2 .
ARCHAEOLOGY 0.1 0.1 0.0 0.2
ART & DESIGN 4.4 5.9 1.6 8.5
BENGALI 0.0 0.0 0.0 .
BIBLICAL HEBREW . 0.0 . .
BIOLOGY 66.6 48.9 94.7 64.8
BUSINESS STUDIES 3.0 5.3 0.4 7.3
CHEMISTRY 52.0 28.6 98.2 43.4
CHINESE 0.7 0.5 0.7 0.2
CITIZENSHIP STUDIES 0.1 0.2 0.0 0.2
CLASSICAL CIVILISATION 0.4 0.7 0.2 0.7
CLASSICAL GREEK . 0.0 0.1 0.2
CLASSICS 0.0 0.0 0.1 0.0
COMMUNICATION & CULTURE 0.4 0.4 . 0.2
COMPUTING 0.2 0.3 0.2 0.2
CRITICAL THINKING 0.6 0.7 1.1 0.5
DANCE 0.4 0.4 0.1 0.2
DESIGN & TECHNOLOGY 2.3 2.2 0.2 8.5
DRAMA & THEATRE STUDIES 2.0 2.9 0.2 2.2
DUTCH 0.1 0.0 0.0 .
ECONOMICS 1.9 2.6 2.6 1.8
ECONOMICS AND BUSINESS 0.2 0.3 0.1 0.6
ELECTRONICS 0.1 0.1 0.0 0.0
ENGLISH LANGUAGE 4.3 6.0 0.6 3.6
ENGLISH LANGUAGE & LITERATURE 3.0 4.5 0.5 2.7
ENGLISH LITERATURE 8.0 12.5 4.7 8.5
ENVIRONMENTAL STUDIES 0.3 0.8 0.0 3.2
FILM STUDIES 0.4 0.8 0.0 0.8
FOOD STUDIES 0.0 . . 0.0
FRENCH 2.3 2.6 5.4 1.6
FURTHER MATHEMATICS 0.9 1.0 5.1 1.4
GENERAL STUDIES 13.9 16.7 18.6 15.7
GEOGRAPHY 7.2 10.4 6.3 21.2
GEOLOGY 0.4 0.4 0.3 1.1
GERMAN 0.9 1.1 1.7 0.8
GOVERNMENT & POLITICS 1.0 1.6 0.4 1.0
GRAPHIC COMMUNICATION 0.1 0.1 . 0.1
GREEK 0.1 0.1 0.1 .
GUJARATI 0.0 . . .
HINDI . . . .

13
A level subject
Degree subject area
Subjects allied to Medicine
Biological Sciences
Medicine &
Dentistry
Veterinary Science, Agriculture &
Related subjects
HISTORY 7.2 11.5 5.9 8.4
HISTORY OF ART 0.0 0.1 . 0.3
HOME ECONOMICS 1.2 0.2 0.2 1.5
HUMAN BIOLOGY 3.0 2.0 0.9 0.8
ICT 2.1 2.2 0.4 2.2
IRISH NEW SPECIFICATION 0.1 0.1 0.1 0.1
ISLAMIC STUDIES . . . .
ITALIAN 0.1 0.1 0.1 0.2
JAPANESE 0.0 0.0 . 0.0
LATIN 0.2 0.1 0.8 0.3
LAW 1.8 3.3 0.2 1.3
MARINE SCIENCE . 0.0 . .
MATHEMATICS 33.2 23.6 68.8 27.7
MEDIA STUDIES 2.2 4.0 0.0 2.0
MODERN HEBREW 0.0 0.0 . .
MUSIC 0.9 1.2 1.4 1.6
PANJABI 0.1 0.0 . .
PERFORMANCE ARTS 0.3 0.4 0.0 0.3
PERSIAN 0.1 0.0 0.1 .
PHILOSOPHY 0.4 0.9 0.3 0.3
PHYSICAL EDUCATION 7.3 18.3 1.1 6.6
PHYSICS 7.9 5.5 21.6 11.7
POLISH 0.1 0.1 0.1 0.1
PORTUGUESE 0.0 0.1 0.0 0.0
PSYCHOLOGY 25.3 49.5 5.7 15.2
PURE MATHEMATICS 0.2 0.1 0.2 0.1
RELIGIOUS STUDIES 6.0 6.9 2.7 4.5
RUSSIAN 0.1 0.1 0.3 0.0
SANSKRIT . . . .
SCIENCE 0.1 0.1 0.2 0.0
SOCIOLOGY 9.7 11.2 0.5 4.0
SPANISH 1.3 1.5 2.1 1.0
STATISTICS 0.3 0.2 0.1 0.2
TAMIL . 0.0 . .
TURKISH 0.1 0.2 0.1 .
URDU 0.2 0.1 0.1 .
USE OF MATHEMATICS 0.1 0.1 . 0.2
WELSH FIRST LANGUAGE 0.1 0.1 0.0 0.1
WELSH SECOND LANGUAGE 0.2 0.1 . 0.0
WORLD DEVELOPMENT 0.0 0.1 . 0.1

14
Table 4(b): Uptake of A level subjects, by degree subject area to which applicants were
accepted ~ Group 2
A level subject
Degree subject area
Architecture, Building and
Planning Engineering
Mathematics & Computer Science
Physical Sciences
Technologies
ACCOUNTING 1.0 0.6 2.3 0.2 0.2
ANCIENT HISTORY 0.1 0.0 0.1 0.2 0.3
ARABIC 0.4 0.5 0.2 0.0 .
ARCHAEOLOGY 0.1 0.0 0.0 0.3 .
ART & DESIGN 45.8 4.7 5.0 3.7 10.4
BENGALI 0.0 0.0 0.0 0.0 .
BIBLICAL HEBREW . . . . .
BIOLOGY 9.0 13.4 11.4 37.4 17.7
BUSINESS STUDIES 11.2 4.3 9.3 2.9 6.6
CHEMISTRY 6.9 36.2 19.1 50.3 20.1
CHINESE 1.5 1.8 2.2 0.6 0.6
CITIZENSHIP STUDIES 0.2 0.1 0.2 0.1 0.1
CLASSICAL CIVILISATION 0.9 0.1 0.3 0.6 0.5
CLASSICAL GREEK 0.0 0.0 0.0 0.0 .
CLASSICS 0.1 0.0 0.0 0.0 .
COMMUNICATION & CULTURE 0.2 0.1 0.2 0.1 0.2
COMPUTING 0.8 2.9 11.5 1.2 2.5
CRITICAL THINKING 0.3 0.3 0.7 1.0 0.2
DANCE 0.1 . 0.1 0.1 .
DESIGN & TECHNOLOGY 24.3 16.0 4.3 2.5 11.1
DRAMA & THEATRE STUDIES 1.4 0.4 1.0 1.0 3.9
DUTCH 0.1 0.1 0.0 0.0 .
ECONOMICS 7.5 6.3 10.0 4.4 3.3
ECONOMICS AND BUSINESS 0.8 0.3 0.8 0.3 0.4
ELECTRONICS 0.2 3.5 1.2 0.4 2.2
ENGLISH LANGUAGE 3.8 0.9 2.4 2.1 4.6
ENGLISH LANGUAGE & LITERATURE 2.7 0.6 1.6 1.7 3.9
ENGLISH LITERATURE 7.9 1.6 4.2 5.8 6.8
ENVIRONMENTAL STUDIES 0.5 0.2 0.1 2.9 0.4
FILM STUDIES 0.7 0.3 1.0 0.3 2.5
FOOD STUDIES . . . 0.0 .
FRENCH 1.7 1.6 2.4 2.4 1.2
FURTHER MATHEMATICS 3.9 19.0 30.9 11.0 3.7
GENERAL STUDIES 12.9 11.2 11.9 18.7 12.1
GEOGRAPHY 18.8 7.3 5.5 35.8 8.2
GEOLOGY 0.8 0.5 0.3 5.5 1.1
GERMAN 1.0 0.9 1.1 1.4 0.9
GOVERNMENT & POLITICS 3.2 0.7 1.6 1.5 1.8
GRAPHIC COMMUNICATION 1.5 0.2 0.4 0.1 0.4
GREEK 0.4 0.1 0.2 0.1 .
GUJARATI . 0.0 . . .

15
A level subject
Degree subject area
Architecture, Building and
Planning Engineering
Mathematics & Computer Science
Physical Sciences
Technologies
HINDI . . . . .
HISTORY 10.1 3.6 7.4 8.9 7.9
HISTORY OF ART 0.8 0.0 0.0 0.1 0.2
HOME ECONOMICS 0.2 0.0 0.1 0.1 0.1
HUMAN BIOLOGY 0.2 0.2 0.3 0.7 0.5
ICT 4.6 3.3 12.4 1.8 5.4
IRISH NEW SPECIFICATION 0.1 0.1 0.1 0.0 .
ISLAMIC STUDIES . . . . .
ITALIAN 0.1 0.1 0.1 0.1 0.3
JAPANESE 0.1 0.1 0.1 0.0 .
LATIN 0.1 0.1 0.2 0.3 .
LAW 2.6 0.6 1.6 1.3 1.5
MARINE SCIENCE . . . . .
MATHEMATICS 42.8 85.0 68.2 56.2 35.9
MEDIA STUDIES 4.1 1.2 5.5 1.2 11.1
MODERN HEBREW . . 0.0 . .
MUSIC 1.3 1.8 2.1 1.8 39.1
PANJABI . 0.0 0.0 0.0 .
PERFORMANCE ARTS 0.1 0.0 0.2 0.1 1.5
PERSIAN 0.1 0.1 0.1 0.0 0.1
PHILOSOPHY 0.4 0.2 0.5 0.4 0.5
PHYSICAL EDUCATION 6.2 2.4 2.2 3.3 4.2
PHYSICS 20.8 72.7 32.4 40.1 26.3
POLISH 0.2 0.2 0.2 0.1 0.1
PORTUGUESE 0.1 0.1 0.0 0.1 .
PSYCHOLOGY 7.3 2.7 7.1 8.5 7.5
PURE MATHEMATICS 0.4 0.4 0.5 0.1 .
RELIGIOUS STUDIES 4.6 1.0 2.9 2.9 3.9
RUSSIAN 0.2 0.2 0.3 0.1 0.2
SANSKRIT . . . . .
SCIENCE 0.0 0.0 0.0 0.1 .
SOCIOLOGY 4.0 0.9 3.1 2.2 3.3
SPANISH 1.8 1.2 1.3 1.3 0.8
STATISTICS 0.3 0.3 0.7 0.2 0.1
TAMIL . . . . .
TURKISH 0.4 0.2 0.1 0.0 .
URDU 0.1 0.3 0.1 0.1 .
USE OF MATHEMATICS 0.4 0.2 0.1 0.2 0.2
WELSH FIRST LANGUAGE 0.0 0.0 0.0 0.0 .
WELSH SECOND LANGUAGE 0.0 0.0 0.1 0.1 .
WORLD DEVELOPMENT 0.1 0.0 0.0 0.2 0.1
16
Table 4(c): Uptake of A level subjects, by degree subject area to which applicants were accepted ~ Group 3
A level subject
Degree subject area
Business &
Administrative Studies
Mass Communications
& Documentation
Creative Arts &
Design Education
Social Studies
ACCOUNTING 7.9 0.2 0.1 0.3 1.3
ANCIENT HISTORY 0.1 0.2 0.1 0.1 0.2
ARABIC 0.2 0.1 0.0 0.0 0.1
ARCHAEOLOGY 0.0 0.1 0.1 0.1 0.1
ART & DESIGN 7.8 16.5 55.8 13.4 5.5
BENGALI 0.0 . . 0.0 0.0
BIBLICAL HEBREW 0.0 . . . 0.0
BIOLOGY 7.8 2.2 4.5 9.3 9.3
BUSINESS STUDIES 38.0 8.8 5.1 6.7 9.1
CHEMISTRY 4.8 0.6 1.6 2.7 5.5
CHINESE 1.7 0.3 0.3 0.0 1.0
CITIZENSHIP STUDIES 0.3 0.3 0.1 0.5 0.5
CLASSICAL CIVILISATION 0.5 0.9 1.1 0.8 1.1
CLASSICAL GREEK 0.0 . 0.0 . 0.0
CLASSICS 0.0 0.0 0.0 0.0 0.1
COMMUNICATION & CULTURE 0.7 2.4 0.6 1.1 0.8
COMPUTING 0.8 0.5 0.6 0.2 0.4
CRITICAL THINKING 0.4 0.5 0.4 0.5 0.6
DANCE 0.4 0.4 3.2 1.3 0.2
DESIGN & TECHNOLOGY 5.0 3.6 17.0 5.4 2.1
DRAMA & THEATRE STUDIES 3.2 11.0 18.0 7.8 3.0
DUTCH 0.1 0.0 0.0 . 0.0
ECONOMICS 17.9 2.3 1.3 1.1 32.0
ECONOMICS AND BUSINESS 2.2 0.4 0.2 0.3 1.3
ELECTRONICS 0.1 0.1 0.1 0.1 0.1
ENGLISH LANGUAGE 6.8 22.6 8.6 16.9 6.5
ENGLISH LANGUAGE & LITERATURE 4.2 14.5 7.3 10.1 5.1
ENGLISH LITERATURE 9.6 26.0 21.2 20.9 17.1
ENVIRONMENTAL STUDIES 0.2 0.2 0.2 0.3 0.3
FILM STUDIES 1.2 14.4 6.0 1.4 1.0
FOOD STUDIES 0.0 . . . .
FRENCH 2.7 2.5 2.8 2.9 4.3
FURTHER MATHEMATICS 2.7 0.2 0.4 0.4 4.7
GENERAL STUDIES 13.0 12.8 11.2 16.5 14.4
GEOGRAPHY 10.4 5.2 5.3 9.6 21.9
GEOLOGY 0.2 0.2 0.3 0.2 0.3
GERMAN 1.2 0.6 0.9 0.9 1.4
GOVERNMENT & POLITICS 4.0 3.8 1.4 1.6 20.0
GRAPHIC COMMUNICATION 0.2 0.6 2.3 0.2 0.1
GREEK 0.3 0.0 0.1 0.0 0.1
GUJARATI 0.0 . 0.0 . 0.0
HINDI . . . . .
17
A level subject
Degree subject area
Business &
Administrative Studies
Mass Communications
& Documentation
Creative Arts &
Design Education
Social Studies
HISTORY 11.2 15.0 9.6 15.1 25.7
HISTORY OF ART 0.2 0.2 0.8 0.1 0.3
HOME ECONOMICS 0.4 0.2 0.1 0.8 0.2
HUMAN BIOLOGY 0.4 0.2 0.2 0.9 0.3
ICT 6.6 3.6 2.7 4.6 2.2
IRISH NEW SPECIFICATION 0.1 0.0 0.0 0.1 0.1
ISLAMIC STUDIES . . . . .
ITALIAN 0.2 0.1 0.1 0.1 0.2
JAPANESE 0.0 0.0 0.1 0.0 0.1
LATIN 0.0 0.0 0.1 0.1 0.3
LAW 5.0 3.3 1.1 3.8 4.7
MARINE SCIENCE . . . 0.0 .
MATHEMATICS 27.3 4.3 8.4 9.5 29.4
MEDIA STUDIES 9.5 53.3 17.1 8.4 4.8
MODERN HEBREW 0.0 0.0 0.0 . 0.0
MUSIC 1.0 2.1 11.4 2.6 1.1
PANJABI 0.0 . 0.0 0.1 0.0
PERFORMANCE ARTS 0.6 1.8 3.7 1.7 0.4
PERSIAN 0.1 . 0.0 . 0.0
PHILOSOPHY 0.4 1.0 0.9 0.4 1.5
PHYSICAL EDUCATION 7.8 4.0 1.9 10.1 3.3
PHYSICS 4.5 0.9 2.4 1.4 6.0
POLISH 0.2 0.1 0.2 0.0 0.1
PORTUGUESE 0.1 0.1 0.1 0.1 0.1
PSYCHOLOGY 15.1 14.6 11.3 30.3 17.5
PURE MATHEMATICS 0.3 0.0 0.0 0.0 0.1
RELIGIOUS STUDIES 5.4 6.7 5.2 12.9 10.1
RUSSIAN 0.5 0.2 0.1 0.0 0.5
SANSKRIT . . . . .
SCIENCE 0.0 0.0 0.0 0.2 0.0
SOCIOLOGY 9.5 12.7 5.4 20.9 22.0
SPANISH 2.4 1.2 1.3 1.5 2.4
STATISTICS 0.6 0.1 0.1 0.3 0.2
TAMIL . . . . .
TURKISH 0.2 0.1 0.1 0.1 0.1
URDU 0.3 0.0 0.0 0.3 0.1
USE OF MATHEMATICS 0.2 0.1 0.1 0.1 0.1
WELSH FIRST LANGUAGE 0.0 0.1 0.1 0.6 0.0
WELSH SECOND LANGUAGE 0.1 0.2 0.1 0.8 0.1
WORLD DEVELOPMENT 0.2 0.1 0.1 0.3 0.6
18
Table 4(d): Uptake of A level subjects, by degree subject area to which applicants were accepted ~ Group 4
A level subject
Degree subject area
European Languages, Literature &
related
History &
Philosophical studies
Law Linguistics,
Classics & related
Non-European Languages & related
ACCOUNTING 0.1 0.1 1.3 0.1 0.2
ANCIENT HISTORY 0.2 1.3 0.4 0.5 0.5
ARABIC 0.0 0.0 0.2 0.1 .
ARCHAEOLOGY . 0.7 0.1 0.1 0.4
ART & DESIGN 6.0 9.4 3.9 11.8 9.6
BENGALI . . 0.0 . .
BIBLICAL HEBREW . . . . .
BIOLOGY 8.7 9.6 9.8 8.1 10.0
BUSINESS STUDIES 3.2 3.7 10.1 3.1 4.0
CHEMISTRY 4.8 3.7 5.8 2.8 5.2
CHINESE 0.3 0.1 0.6 0.1 0.6
CITIZENSHIP STUDIES 0.1 0.3 0.7 0.3 0.1
CLASSICAL CIVILISATION 1.4 6.0 1.1 6.0 3.1
CLASSICAL GREEK 0.3 0.2 0.0 1.6 0.2
CLASSICS 0.1 0.5 0.1 0.4 0.4
COMMUNICATION & CULTURE 0.2 0.3 0.9 0.7 0.5
COMPUTING 0.3 0.3 0.3 0.2 0.5
CRITICAL THINKING 0.9 1.3 1.1 1.2 0.6
DANCE 0.3 0.2 0.3 0.4 0.1
DESIGN & TECHNOLOGY 0.9 1.6 1.4 1.7 1.3
DRAMA & THEATRE STUDIES 3.7 4.7 3.0 8.3 6.2
DUTCH 0.1 0.0 0.1 0.0 .
ECONOMICS 5.4 6.9 9.8 2.8 6.5
ECONOMICS AND BUSINESS 0.3 0.4 0.6 0.2 0.4
ELECTRONICS 0.1 0.0 0.0 0.0 .
ENGLISH LANGUAGE 7.1 7.3 11.0 23.3 9.0
ENGLISH LANGUAGE & LITERATURE 4.5 6.2 8.8 15.5 6.6
ENGLISH LITERATURE 29.4 37.3 26.7 66.2 38.5
ENVIRONMENTAL STUDIES 0.1 0.2 0.1 0.1 0.5
FILM STUDIES 0.4 1.5 0.7 2.6 3.0
FOOD STUDIES . . . . .
FRENCH 68.8 5.5 5.1 8.4 29.5
FURTHER MATHEMATICS 0.8 0.7 1.0 0.6 0.3
GENERAL STUDIES 19.7 18.5 16.4 16.9 18.8
GEOGRAPHY 6.9 10.2 7.4 7.1 8.6
GEOLOGY 0.2 0.5 0.1 0.1 0.3
GERMAN 24.3 1.6 1.6 2.4 10.3
GOVERNMENT & POLITICS 5.5 13.4 12.5 6.9 13.6
GRAPHIC COMMUNICATION 0.1 0.0 0.1 0.1 0.4
GREEK 0.2 0.1 0.5 0.1 0.1
GUJARATI . . 0.0 . .

19
A level subject
Degree subject area
European Languages, Literature &
related
History &
Philosophical studies
Law Linguistics,
Classics & related
Non-European Languages & related
HINDI . . 0.0 . .
HISTORY 22.0 76.4 33.0 35.4 41.8
HISTORY OF ART 0.8 2.8 0.1 0.4 0.7
HOME ECONOMICS 0.1 0.1 0.2 0.1 .
HUMAN BIOLOGY 0.2 0.3 0.3 0.3 0.3
ICT 1.0 1.2 2.9 1.4 0.6
IRISH NEW SPECIFICATION 0.0 0.0 0.1 0.4 .
ISLAMIC STUDIES . . . . .
ITALIAN 4.6 0.2 0.2 0.3 1.3
JAPANESE 0.1 0.0 0.0 0.0 2.5
LATIN 2.8 1.4 0.5 4.8 2.8
LAW 1.8 4.0 37.0 3.8 2.7
MARINE SCIENCE . . . . .
MATHEMATICS 18.2 12.9 16.1 9.1 14.1
MEDIA STUDIES 1.4 3.5 4.6 8.9 5.4
MODERN HEBREW . 0.0 . 0.0 .
MUSIC 3.4 2.3 1.0 2.8 3.3
PANJABI . . 0.1 . .
PERFORMANCE ARTS 0.2 0.3 0.4 0.9 0.1
PERSIAN 0.0 0.0 0.1 . .
PHILOSOPHY 1.0 4.8 1.6 2.7 2.8
PHYSICAL EDUCATION 1.4 2.5 2.9 1.5 2.7
PHYSICS 2.0 3.1 2.9 1.1 2.7
POLISH 0.4 0.1 0.3 0.0 0.1
PORTUGUESE 0.5 0.0 0.1 0.1 0.3
PSYCHOLOGY 8.9 13.3 26.8 18.3 12.0
PURE MATHEMATICS 0.0 0.0 0.3 0.0 .
RELIGIOUS STUDIES 6.4 26.3 11.4 12.3 8.4
RUSSIAN 2.1 0.1 0.2 0.1 0.6
SANSKRIT . . . 0.0 .
SCIENCE 0.0 0.0 0.1 0.0 0.1
SOCIOLOGY 2.7 7.8 19.1 9.2 8.0
SPANISH 43.6 2.0 2.8 3.3 21.1
STATISTICS 0.1 0.1 0.2 0.0 0.1
TAMIL . . . . .
TURKISH 0.0 0.1 0.3 0.1 .
URDU . 0.0 0.3 0.1 .
USE OF MATHEMATICS . 0.1 0.1 0.0 0.1
WELSH FIRST LANGUAGE 0.1 0.2 0.2 0.5 0.2
WELSH SECOND LANGUAGE 0.2 0.2 0.2 0.4 0.3
WORLD DEVELOPMENT 0.1 0.2 0.2 0.1 0.4

20
Table 4(e): Uptake of A level subjects, by degree subject area to which applicants were accepted ~ Group 5
A level subject
Degree subject area
Combined Arts
Combined Sciences
Combined Social
Sciences
Sciences combined with social sciences
or arts
Social sciences combined with arts
General, other combined &
unknown
ACCOUNTING 0.1 0.5 3.3 1.1 0.5 0.7
ANCIENT HISTORY 0.4 0.2 0.1 0.1 0.3 .
ARABIC 0.1 0.2 0.1 0.1 0.1 0.2
ARCHAEOLOGY 0.2 0.1 0.1 0.1 0.2 0.1
ART & DESIGN 16.5 5.5 4.4 13.8 13.2 4.9
BENGALI . . . 0.0 . 0.0
BIBLICAL HEBREW . . . . . 0.0
BIOLOGY 5.7 46.3 7.6 13.4 6.8 40.0
BUSINESS STUDIES 3.2 5.1 19.1 11.9 10.8 3.2
CHEMISTRY 1.7 35.2 4.6 6.7 3.0 49.6
CHINESE 0.1 0.7 1.1 0.8 0.5 1.4
CITIZENSHIP STUDIES 0.2 0.1 0.4 0.2 0.3 0.3
CLASSICAL CIVILISATION 3.0 0.6 0.6 0.9 1.6 1.0
CLASSICAL GREEK 0.1 0.0 . . 0.0 0.1
CLASSICS 0.2 . 0.0 0.1 0.1 0.0
COMMUNICATION & CULTURE 1.0 0.3 1.2 0.6 1.2 0.3
COMPUTING 0.3 1.6 0.6 1.2 0.2 0.8
CRITICAL THINKING 0.7 0.5 0.4 0.6 0.5 1.0
DANCE 1.1 0.3 0.3 0.6 0.5 0.2
DESIGN & TECHNOLOGY 2.5 6.4 2.2 8.9 5.3 1.6
DRAMA & THEATRE STUDIES 15.0 1.4 3.5 3.4 5.0 1.9
DUTCH 0.0 0.1 0.0 0.0 0.1 0.0
ECONOMICS 1.8 3.0 30.0 8.2 11.5 6.9
ECONOMICS AND BUSINESS 0.2 0.3 1.6 0.8 1.2 0.3
ELECTRONICS . 0.6 0.1 0.3 0.0 0.2
ENGLISH LANGUAGE 17.1 3.1 6.9 7.6 10.1 4.2
ENGLISH LANGUAGE & LITERATURE 15.4 2.5 5.5 5.2 6.9 3.0
ENGLISH LITERATURE 48.4 6.4 14.3 11.8 25.2 12.0
ENVIRONMENTAL STUDIES 0.1 1.0 0.1 0.4 0.2 0.5
FILM STUDIES 7.0 0.5 1.3 2.1 2.3 0.8
FOOD STUDIES . 0.0 . . . .
FRENCH 12.6 1.9 2.5 2.5 10.5 6.4
FURTHER MATHEMATICS 0.2 7.1 2.6 5.1 0.9 21.2
GENERAL STUDIES 15.8 12.7 13.4 14.5 15.9 14.3
GEOGRAPHY 5.4 12.0 11.0 13.3 10.1 8.2
GEOLOGY 0.1 0.6 0.2 0.5 0.4 0.8
GERMAN 3.8 1.1 0.7 1.2 3.5 2.2
GOVERNMENT & POLITICS 4.9 1.1 8.2 2.3 19.5 3.0
GRAPHIC COMMUNICATION 0.4 0.1 0.2 0.4 0.5 0.1
GREEK 0.1 0.1 . 0.1 0.1 0.1
GUJARATI . . . . . .
HINDI . . . . . .

21
A level subject
Degree subject area
Combined Arts
Combined Sciences
Combined Social
Sciences
Sciences combined with social sciences
or arts
Social sciences combined with arts
General, other combined &
unknown
HISTORY 33.9 6.4 17.6 12.2 38.7 10.7
HISTORY OF ART 0.8 0.0 . 0.2 0.3 0.5
HOME ECONOMICS 0.1 1.4 0.1 0.3 0.3 0.0
HUMAN BIOLOGY 0.4 2.1 0.5 0.9 0.3 0.8
ICT 1.6 4.1 3.4 5.8 1.8 1.8
IRISH NEW SPECIFICATION 0.2 0.1 0.0 0.1 0.1 0.0
ISLAMIC STUDIES . . . . . 0.0
ITALIAN 0.8 0.0 0.2 0.2 0.4 0.3
JAPANESE 0.1 0.1 0.1 0.0 0.1 0.1
LATIN 1.0 0.1 0.1 0.1 0.5 0.9
LAW 2.6 1.7 13.3 3.9 4.0 1.9
MARINE SCIENCE . 0.0 . . . .
MATHEMATICS 6.5 42.2 25.9 24.1 13.5 53.0
MEDIA STUDIES 16.7 3.1 6.8 9.8 12.8 3.5
MODERN HEBREW 0.0 0.0 0.0 . 0.0 .
MUSIC 3.9 2.2 0.7 4.0 1.6 1.8
PANJABI . . 0.1 0.0 0.0 .
PERFORMANCE ARTS 2.1 0.2 0.7 0.7 0.8 0.3
PERSIAN . 0.1 0.0 0.0 0.0 .
PHILOSOPHY 2.9 0.3 1.1 1.0 2.2 1.1
PHYSICAL EDUCATION 1.8 19.5 4.5 17.4 3.0 2.3
PHYSICS 1.3 22.2 4.4 7.2 2.4 33.2
POLISH 0.1 0.0 0.4 0.1 0.2 0.1
PORTUGUESE 0.1 0.2 0.1 0.0 0.1 0.0
PSYCHOLOGY 15.5 18.3 23.4 26.5 15.2 13.0
PURE MATHEMATICS . 0.1 0.1 0.1 0.0 0.0
RELIGIOUS STUDIES 12.8 3.3 8.8 6.5 12.2 5.1
RUSSIAN 0.3 0.2 0.3 0.2 0.4 0.2
SANSKRIT . . . . . .
SCIENCE 0.1 . 0.1 0.1 0.0 .
SOCIOLOGY 8.1 5.3 31.5 11.1 14.2 5.1
SPANISH 6.7 0.9 1.4 1.5 6.4 3.3
STATISTICS 0.1 0.2 0.5 0.3 0.1 0.5
TAMIL . 0.0 . . . .
TURKISH 0.1 0.1 0.2 0.0 0.1 .
URDU 0.1 0.0 0.1 0.1 0.1 0.2
USE OF MATHEMATICS 0.1 0.2 0.1 0.2 0.1 .
WELSH FIRST LANGUAGE 0.4 0.0 0.2 0.1 0.3 0.0
WELSH SECOND LANGUAGE 0.5 0.0 0.1 0.2 0.1 0.0
WORLD DEVELOPMENT 0.1 0.1 0.2 0.2 0.3 0.0
22
3.1.2 Performance
This section of the report focuses on performance in the most popular A level subjects among university applicants overall and broken down by university mission group.
Tables 5 and 6 show the percentages of students achieving particular grades (A* and at least grades A, B and C) in each A level subject, as a percentage of those taking the A level subject. Only A level subjects with an overall uptake level of more than 1% were included in the analyses. Subjects were ordered by overall uptake (highest first).
In particular, Table 5 shows that top grades were more frequent among accepted applicants than among rejected applicants. For example, among the accepted applicants for undergraduate courses with an A level in Mathematics, 20.7% had an A* and 51.6% had at least grade A. This compares with 14.3% and 36.4% among rejected applicants.
Tables 7 to 10 show, respectively, the percentages achieving grade A*, at least grade A, at least grade B, and at least grade C in each A level subject, by university mission group. As above, only A level subjects with an overall uptake level of more than 1% were included in these tables.
As an example, Table 8 shows that there were more candidates with at least grade A in A level Mathematics in universities of the Russell Group and 1994 Group (79.8% and 65.9%, respectively) than in universities in any of the other mission groups (13.2% in universities of the University Alliance and 7.2% in universities of the Million+ Group).

23
Table 5: Percentages of students achieving grade A* and at least grade A in each A level subject
A level subject
Grade A* At least grade A Number of candidates
with the A Level
Accepted candidates
Rejected candidates
Accepted candidates
Rejected candidates
Accepted candidates
Rejected candidates
MATHEMATICS 20.7 14.3 51.6 36.4 75800 13952
BIOLOGY 10.5 7.1 34.1 25.2 53848 11267
PSYCHOLOGY 5.7 1.9 23.2 8.8 47253 8627
HISTORY 11.3 8.0 40.2 29.2 45630 9637
CHEMISTRY 8.6 5.0 32.4 17.6 46247 6862
ENGLISH LITERATURE 12.7 7.1 34.1 19.0 45225 7589
GENERAL STUDIES 5.1 2.7 15.4 8.5 37404 4456
ART & DESIGN 17.7 11.8 38.6 26.8 32264 7268
PHYSICS 13.1 9.8 39.8 25.2 31845 5906
GEOGRAPHY 8.8 4.0 36.0 18.3 28300 4121
SOCIOLOGY 6.6 1.6 25.2 9.2 24730 5007
BUSINESS STUDIES 5.2 3.0 21.9 11.3 24468 4876
ECONOMICS 10.6 9.0 42.2 27.9 21722 4218
MEDIA STUDIES 2.1 0.8 15.8 6.4 20269 4377
ENGLISH LANGUAGE 2.6 1.1 17.3 5.9 19505 3500
RELIGIOUS STUDIES 7.0 4.0 32.3 18.9 19478 3487
PHYSICAL EDUCATION 5.9 2.1 20.5 7.7 15368 3352
ENGLISH LANGUAGE & LITERATURE
7.4 3.5 23.6 11.6 14175 2919
DESIGN & TECHNOLOGY 4.9 1.8 20.1 8.2 14316 2634
GOVERNMENT & POLITICS 5.2 3.9 22.5 17.2 12819 3304
FURTHER MATHEMATICS 10.4 5.5 37.9 19.8 13646 1953
DRAMA & THEATRE STUDIES 28.8 15.1 61.1 37.1 12922 1688
FRENCH 6.3 2.8 24.1 9.6 11908 2059
LAW 8.8 6.2 44.2 28.7 12241 1692
ICT 3.1 1.5 15.9 6.9 8959 1941
MUSIC 5.0 3.3 22.0 15.7 7240 1468
SPANISH 10.4 9.0 43.2 28.9 6974 1050
FILM STUDIES 3.4 1.1 18.4 7.5 5207 1126
GERMAN 8.7 10.8 41.7 36.5 4383 622
ACCOUNTING 7.9 10.6 26.2 24.4 3526 1089
COMPUTING 5.3 1.4 21.9 8.1 3284 518
CLASSICAL CIVILISATION 6.9 3.7 32.8 17.1 3255 491
PHILOSOPHY 3.9 3.2 26.0 14.8 2864 438

24
Table 6: Percentages of students achieving at least grade B and at least grade C in each A level subject
A level subject
At least grade B At least grade C Number of candidates
with the A Level
Accepted candidates
Rejected candidates
Accepted candidates
Rejected candidates
Accepted candidates
Rejected candidates
MATHEMATICS 74.2 57.0 88.4 75.1 75800 13952
BIOLOGY 59.8 45.0 80.8 65.7 53848 11267
PSYCHOLOGY 52.4 26.7 79.4 54.4 47253 8627
HISTORY 66.5 51.1 84.2 71.6 45630 9637
CHEMISTRY 63.8 41.6 87.9 69.4 46247 6862
ENGLISH LITERATURE 62.8 40.2 86.8 67.4 45225 7589
GENERAL STUDIES 36.8 24.4 63.5 48.1 37404 4456
ART & DESIGN 67.2 51.9 88.4 77.4 32264 7268
PHYSICS 64.0 44.3 81.7 65.5 31845 5906
GEOGRAPHY 66.4 41.1 88.7 68.6 28300 4121
SOCIOLOGY 56.4 27.4 83.4 58.1 24730 5007
BUSINESS STUDIES 53.3 32.1 82.0 61.3 24468 4876
ECONOMICS 71.6 52.8 89.5 76.6 21722 4218
MEDIA STUDIES 52.9 29.7 86.6 69.6 20269 4377
ENGLISH LANGUAGE 50.2 24.2 85.1 60.3 19505 3500
RELIGIOUS STUDIES 65.2 44.3 87.5 71.3 19478 3487
PHYSICAL EDUCATION 47.1 24.1 74.4 50.7 15368 3352
ENGLISH LANGUAGE & LITERATURE
53.8 33.5 81.1 61.6 14175 2919
DESIGN & TECHNOLOGY 52.1 28.5 84.0 62.8 14316 2634
GOVERNMENT & POLITICS 57.3 45.4 86.8 75.1 12819 3304
FURTHER MATHEMATICS 68.7 44.4 88.5 70.8 13646 1953
DRAMA & THEATRE STUDIES 82.2 60.8 92.4 78.3 12922 1688
FRENCH 52.1 26.0 77.8 51.8 11908 2059
LAW 73.9 57.4 90.5 78.9 12241 1692
ICT 42.9 22.7 71.7 49.2 8959 1941
MUSIC 50.6 34.9 76.9 63.5 7240 1468
SPANISH 72.6 51.9 89.5 77.2 6974 1050
FILM STUDIES 59.3 38.9 91.8 78.3 5207 1126
GERMAN 70.2 56.8 89.7 78.3 4383 622
ACCOUNTING 50.7 41.1 74.2 63.0 3526 1089
COMPUTING 48.0 22.6 73.7 49.6 3284 518
CLASSICAL CIVILISATION 66.4 45.4 88.7 76.0 3255 491
PHILOSOPHY 58.7 38.1 82.5 64.8 2864 438

25
Table 7: Percentages achieving grade A* in each A level subject, by university mission group
A level subject
University Mission Group
Russell Group
1994 Group
University Alliance
Million+ Group
Other
MATHEMATICS 36.7 23.1 1.9 0.9 5.9
BIOLOGY 23.3 10.9 0.6 0.2 4.0
PSYCHOLOGY 18.5 14.5 1.9 1.0 2.2
HISTORY 20.2 12.2 0.9 0.3 1.4
CHEMISTRY 20.5 9.4 0.4 0.3 3.5
ENGLISH LITERATURE 29.5 21.6 2.6 1.1 3.1
GENERAL STUDIES 11.1 8.9 1.1 0.9 1.8
ART & DESIGN 38.3 31.8 12.5 8.8 16.3
PHYSICS 23.7 9.8 0.4 0.1 2.0
GEOGRAPHY 18.9 15.4 1.6 0.7 2.2
SOCIOLOGY 24.1 21.0 3.1 1.3 3.2
BUSINESS STUDIES 16.8 13.2 2.8 0.9 3.0
ECONOMICS 20.3 12.0 1.0 0.3 2.3
MEDIA STUDIES 10.5 8.4 1.6 0.6 1.6
ENGLISH LANGUAGE 10.1 7.8 0.7 0.2 0.5
RELIGIOUS STUDIES 16.8 12.4 1.4 0.4 2.2
PHYSICAL EDUCATION 20.5 19.7 2.8 1.3 3.1
ENGLISH LANGUAGE & LITERATURE 18.2 13.7 2.0 0.6 1.9
DESIGN & TECHNOLOGY 21.2 18.3 4.1 3.1 5.8
GOVERNMENT & POLITICS 21.6 13.6 1.5 0.5 1.9
FURTHER MATHEMATICS 38.7 17.5 1.1 0.3 5.5
DRAMA & THEATRE STUDIES 18.0 11.4 1.8 1.2 1.9
FRENCH 15.0 8.6 0.9 0.6 2.2
LAW 21.9 17.1 2.9 0.9 3.2
ICT 13.3 8.1 1.4 0.4 1.8
MUSIC 13.7 7.0 1.0 0.7 1.3
SPANISH 16.6 14.5 2.6 1.8 3.5
FILM STUDIES 23.6 13.4 1.6 0.6 1.6
GERMAN 13.4 11.1 2.3 2.8 3.3
ACCOUNTING 25.2 12.8 1.2 0.3 4.0
COMPUTING 18.0 8.4 0.1 0.2 1.4
CLASSICAL CIVILISATION 14.2 8.9 1.3 0.5 1.2
PHILOSOPHY 9.4 4.0 0.4 0.0 0.8

26
Table 8: Percentages achieving at least a grade A in each A level subject, by university mission group
A level subject
University Mission Group
Russell Group
1994 Group
University Alliance
Million+ Group
Other
MATHEMATICS 79.8 65.9 13.2 7.2 25.8
BIOLOGY 66.0 45.1 5.6 2.5 18.3
PSYCHOLOGY 62.8 53.3 12.2 6.1 12.6
HISTORY 65.7 51.5 7.9 3.1 9.8
CHEMISTRY 65.5 43.2 4.1 2.3 21.2
ENGLISH LITERATURE 70.4 58.8 11.6 5.0 12.9
GENERAL STUDIES 31.8 26.5 4.8 3.0 6.7
ART & DESIGN 73.7 63.2 31.4 21.7 35.4
PHYSICS 64.9 42.0 2.8 1.7 11.1
GEOGRAPHY 69.2 61.4 11.4 6.2 15.4
SOCIOLOGY 71.3 65.2 17.4 8.5 17.0
BUSINESS STUDIES 62.7 51.9 14.5 4.9 14.0
ECONOMICS 70.3 56.5 9.4 3.3 16.3
MEDIA STUDIES 55.9 48.6 14.7 7.1 12.1
ENGLISH LANGUAGE 55.0 47.1 8.1 3.4 6.9
RELIGIOUS STUDIES 65.7 57.9 12.6 6.0 16.1
PHYSICAL EDUCATION 61.8 58.4 12.5 6.6 12.6
ENGLISH LANGUAGE & LITERATURE 60.5 51.1 11.1 4.8 10.9
DESIGN & TECHNOLOGY 60.5 53.2 16.1 9.9 19.3
GOVERNMENT & POLITICS 68.6 56.5 8.9 3.3 12.6
FURTHER MATHEMATICS 74.8 53.0 6.5 2.5 22.1
DRAMA & THEATRE STUDIES 60.8 47.3 12.1 7.0 12.0
FRENCH 65.8 53.7 10.6 8.5 16.6
LAW 69.2 60.1 15.4 5.7 14.3
ICT 55.6 38.0 8.5 3.3 12.5
MUSIC 52.4 39.3 6.6 4.2 7.6
SPANISH 64.6 57.8 14.7 14.4 19.6
FILM STUDIES 66.7 57.8 14.8 7.1 14.6
GERMAN 59.9 52.0 15.0 20.4 20.0
ACCOUNTING 64.1 51.3 9.7 2.1 19.1
COMPUTING 61.8 36.0 4.9 4.1 9.1
CLASSICAL CIVILISATION 62.0 47.5 8.9 4.0 7.7
PHILOSOPHY 53.1 36.6 4.6 2.3 7.4
27
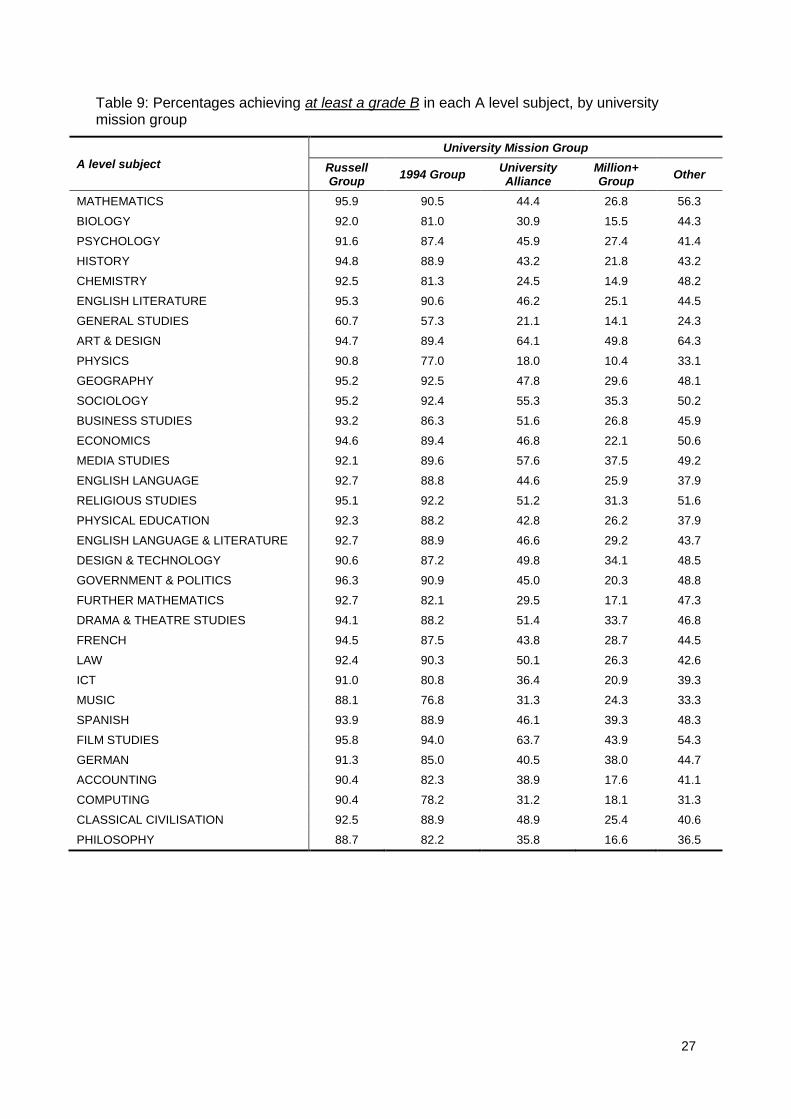
Table 9: Percentages achieving at least a grade B in each A level subject, by university mission group
A level subject
University Mission Group
Russell Group
1994 Group University Alliance
Million+ Group
Other
MATHEMATICS 95.9 90.5 44.4 26.8 56.3
BIOLOGY 92.0 81.0 30.9 15.5 44.3
PSYCHOLOGY 91.6 87.4 45.9 27.4 41.4
HISTORY 94.8 88.9 43.2 21.8 43.2
CHEMISTRY 92.5 81.3 24.5 14.9 48.2
ENGLISH LITERATURE 95.3 90.6 46.2 25.1 44.5
GENERAL STUDIES 60.7 57.3 21.1 14.1 24.3
ART & DESIGN 94.7 89.4 64.1 49.8 64.3
PHYSICS 90.8 77.0 18.0 10.4 33.1
GEOGRAPHY 95.2 92.5 47.8 29.6 48.1
SOCIOLOGY 95.2 92.4 55.3 35.3 50.2
BUSINESS STUDIES 93.2 86.3 51.6 26.8 45.9
ECONOMICS 94.6 89.4 46.8 22.1 50.6
MEDIA STUDIES 92.1 89.6 57.6 37.5 49.2
ENGLISH LANGUAGE 92.7 88.8 44.6 25.9 37.9
RELIGIOUS STUDIES 95.1 92.2 51.2 31.3 51.6
PHYSICAL EDUCATION 92.3 88.2 42.8 26.2 37.9
ENGLISH LANGUAGE & LITERATURE 92.7 88.9 46.6 29.2 43.7
DESIGN & TECHNOLOGY 90.6 87.2 49.8 34.1 48.5
GOVERNMENT & POLITICS 96.3 90.9 45.0 20.3 48.8
FURTHER MATHEMATICS 92.7 82.1 29.5 17.1 47.3
DRAMA & THEATRE STUDIES 94.1 88.2 51.4 33.7 46.8
FRENCH 94.5 87.5 43.8 28.7 44.5
LAW 92.4 90.3 50.1 26.3 42.6
ICT 91.0 80.8 36.4 20.9 39.3
MUSIC 88.1 76.8 31.3 24.3 33.3
SPANISH 93.9 88.9 46.1 39.3 48.3
FILM STUDIES 95.8 94.0 63.7 43.9 54.3
GERMAN 91.3 85.0 40.5 38.0 44.7
ACCOUNTING 90.4 82.3 38.9 17.6 41.1
COMPUTING 90.4 78.2 31.2 18.1 31.3
CLASSICAL CIVILISATION 92.5 88.9 48.9 25.4 40.6
PHILOSOPHY 88.7 82.2 35.8 16.6 36.5

28
Table 10: Percentages achieving at least a grade C in each A level subject, by university mission group
A level subject
University Mission Group
Russell Group
1994 Group
University Alliance
Million+ Group
Other
MATHEMATICS 99.0 97.7 75.9 57.5 80.2
BIOLOGY 98.3 95.2 68.4 46.5 72.5
PSYCHOLOGY 98.4 97.3 80.0 62.5 73.5
HISTORY 99.6 98.7 84.0 63.8 79.6
CHEMISTRY 98.6 95.4 63.3 44.2 75.1
ENGLISH LITERATURE 99.4 98.6 83.4 66.0 80.4
GENERAL STUDIES 83.2 81.3 52.3 40.3 53.3
ART & DESIGN 99.1 98.1 88.4 79.5 87.4
PHYSICS 97.7 93.9 53.6 35.7 65.2
GEOGRAPHY 99.4 98.8 85.0 69.6 80.2
SOCIOLOGY 99.0 98.4 85.8 71.9 80.6
BUSINESS STUDIES 98.8 96.2 84.8 65.6 78.7
ECONOMICS 99.0 98.0 82.4 59.9 81.3
MEDIA STUDIES 99.3 98.5 90.5 79.4 85.3
ENGLISH LANGUAGE 99.4 98.7 85.5 73.7 80.2
RELIGIOUS STUDIES 99.6 98.7 84.0 69.5 82.6
PHYSICAL EDUCATION 98.4 96.5 75.8 58.9 68.6
ENGLISH LANGUAGE & LITERATURE
99.1 98.3 85.4 71.4 80.5
DESIGN & TECHNOLOGY 98.7 96.5 81.9 67.7 78.3
GOVERNMENT & POLITICS 99.6 98.4 82.7 58.7 81.7
FURTHER MATHEMATICS 97.7 93.7 63.9 46.1 76.2
DRAMA & THEATRE STUDIES 99.4 98.4 87.4 74.8 83.1
FRENCH 99.1 98.0 78.6 66.4 77.8
LAW 97.4 98.1 80.3 60.6 72.4
ICT 98.3 95.1 72.9 52.3 69.7
MUSIC 98.2 94.3 69.2 56.7 67.0
SPANISH 99.2 97.9 79.2 69.9 78.1
FILM STUDIES 98.6 98.6 94.4 87.0 90.6
GERMAN 98.7 96.7 78.4 73.0 78.7
ACCOUNTING 96.8 91.5 71.3 48.3 72.2
COMPUTING 97.8 94.9 66.8 51.7 61.4
CLASSICAL CIVILISATION 99.2 98.5 85.5 66.9 77.0
PHILOSOPHY 98.3 96.3 75.6 51.3 70.8

29
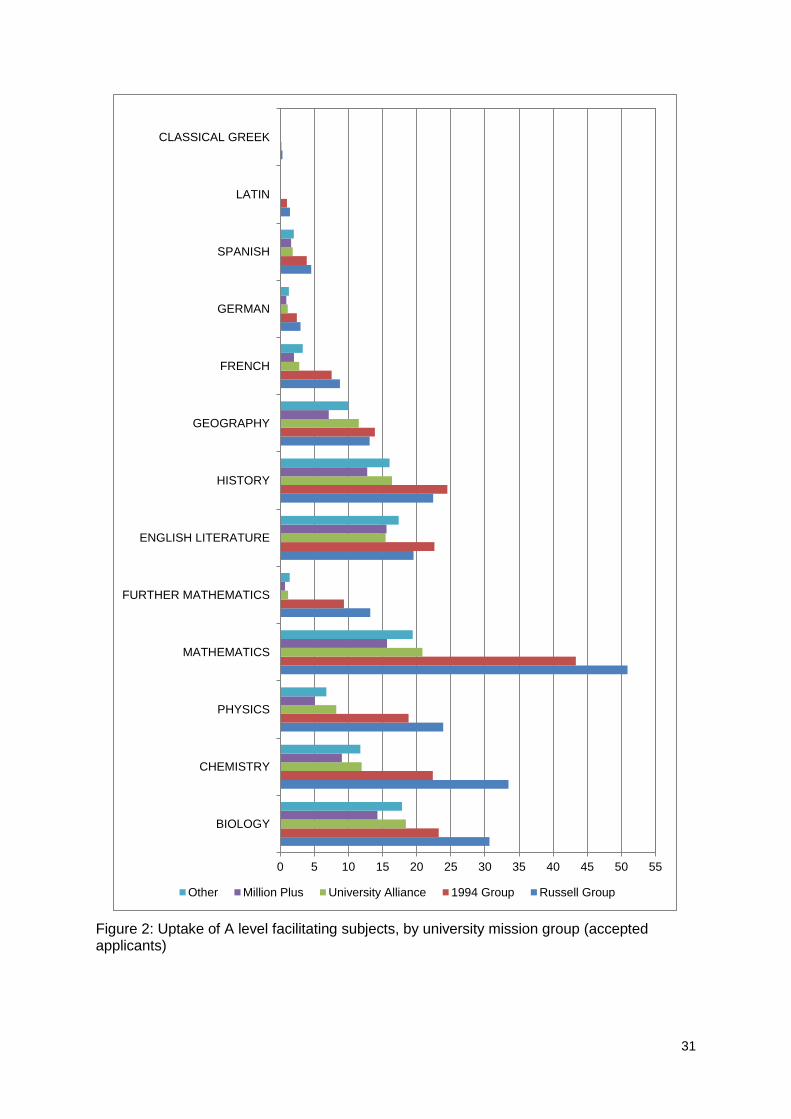
3.2 A level facilitating subjects
A level subject choices can have an important role in determining the university courses and the universities open to students. Some university courses require a specific A level subject (or combinations of A level subjects) and others do not. However, there are some A level subjects that are required more often than others. These subjects are referred to as facilitating subjects (Russell Group, 20127).
Subjects that can be viewed as facilitating subjects are:
Biology Chemistry Physics Mathematics Further Mathematics English Literature History Geography Languages (Classical and Modern)8
The Russell Group recommends that students take at least two facilitating subjects at A level in order to keep most options for subject choice open.
Schools and colleges offer students a range of A level subjects (as listed, for example, in Table 2) but, unlike the facilitating subjects, they are unlikely to be required for any particular degree course and so choosing them does not increase students’ options at university.
This section of the report focuses on facilitating subjects only, collating some results on this group of subjects from the previous tables.
7 Russell Group (2012). Informed choices: A Russell Group Guide to make decisions about post-16
education. The Russell Group, London.
8 Languages (classical and modern) included in this section of the report are French, German,
Spanish, Latin and Classical Greek.

30
Figure 1: Uptake of A level facilitating subjects
0.0 5.0 10.0 15.0 20.0 25.0 30.0 35.0
BIOLOGY
CHEMISTRY
PHYSICS
MATHEMATICS
FURTHER MATHEMATICS
ENGLISH LITERATURE
HISTORY
GEOGRAPHY
FRENCH
GERMAN
SPANISH
LATIN
CLASSICAL GREEK
A level students Accepted applicants University applicants
31
Figure 2: Uptake of A level facilitating subjects, by university mission group (accepted applicants)
0 5 10 15 20 25 30 35 40 45 50 55
BIOLOGY
CHEMISTRY
PHYSICS
MATHEMATICS
FURTHER MATHEMATICS
ENGLISH LITERATURE
HISTORY
GEOGRAPHY
FRENCH
GERMAN
SPANISH
LATIN
CLASSICAL GREEK
Other Million Plus University Alliance 1994 Group Russell Group

32
Figure 3: A level facilitating subjects ~ percentages achieving at least a grade A in each subject9
Figure 4: A level facilitating subjects ~ percentages achieving at least a grade B in each subject
9 Classical Greek and Latin were not included in the performance figures, as the overall uptake was
less than 1%.
0102030405060708090
100
BIO
LOG
Y
CH
EMIS
TRY
PH
YSIC
S
MA
THEM
ATI
CS
FUR
THER
MA
THEM
ATI
CS
ENG
LISH
LIT
ERA
TUR
E
HIS
TOR
Y
GEO
GR
AP
HY
FREN
CH
GER
MA
N
SPA
NIS
H
Accepted candidates A level students
0102030405060708090
100
BIO
LOG
Y
CH
EMIS
TRY
PH
YSIC
S
MA
THEM
ATI
CS
FUR
THER
MA
THEM
ATI
CS
ENG
LISH
LIT
ERA
TUR
E
HIS
TOR
Y
GEO
GR
AP
HY
FREN
CH
GER
MA
N
SPA
NIS
H
Accepted candidates A level students

33
Figure 5: A level facilitating subjects ~ percentages achieving at least a grade C in each subject
0102030405060708090
100
BIO
LOG
Y
CH
EMIS
TRY
PH
YSIC
S
MA
THEM
ATI
CS
FUR
THER
MA
THEM
ATI
CS
ENG
LISH
LIT
ERA
TUR
E
HIS
TOR
Y
GEO
GR
AP
HY
FREN
CH
GER
MA
N
SPA
NIS
H
Accepted candidates A level students
34
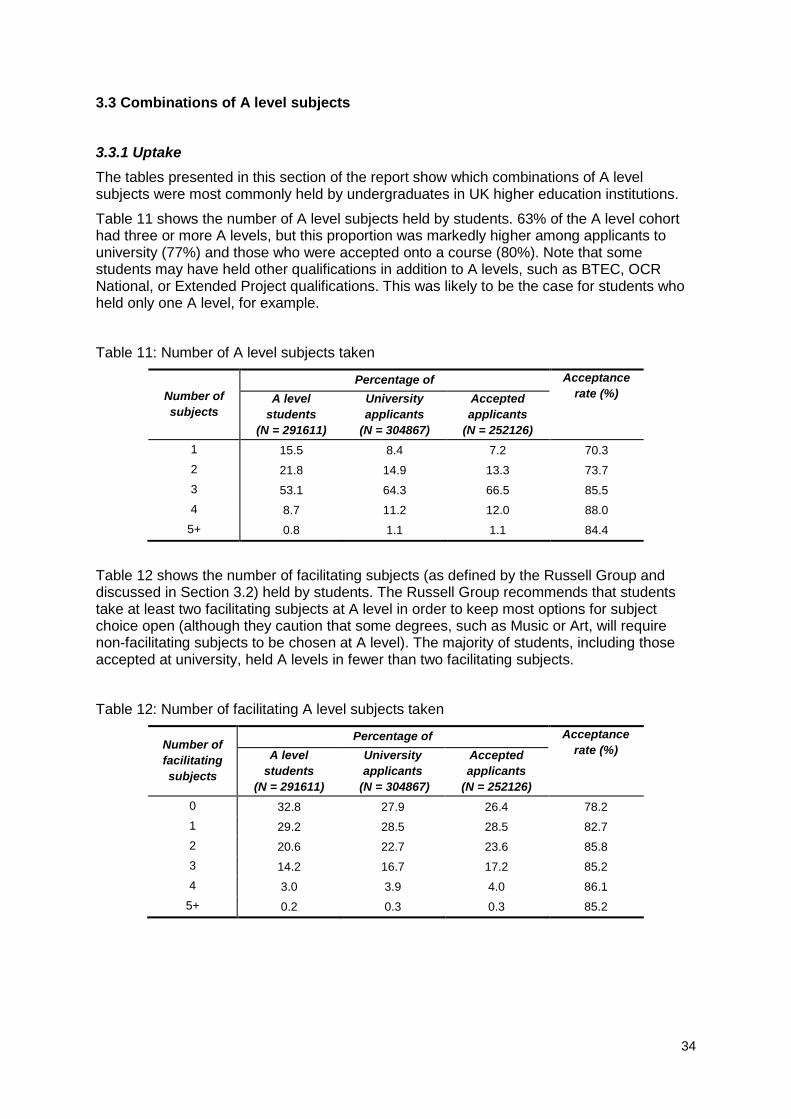
3.3 Combinations of A level subjects
3.3.1 Uptake
The tables presented in this section of the report show which combinations of A level subjects were most commonly held by undergraduates in UK higher education institutions.
Table 11 shows the number of A level subjects held by students. 63% of the A level cohort had three or more A levels, but this proportion was markedly higher among applicants to university (77%) and those who were accepted onto a course (80%). Note that some students may have held other qualifications in addition to A levels, such as BTEC, OCR National, or Extended Project qualifications. This was likely to be the case for students who held only one A level, for example.
Table 11: Number of A level subjects taken
Number of
subjects
Percentage of Acceptance
rate (%) A level
students
(N = 291611)
University
applicants
(N = 304867)
Accepted
applicants
(N = 252126)
1 15.5 8.4 7.2 70.3
2 21.8 14.9 13.3 73.7
3 53.1 64.3 66.5 85.5
4 8.7 11.2 12.0 88.0
5+ 0.8 1.1 1.1 84.4
Table 12 shows the number of facilitating subjects (as defined by the Russell Group and discussed in Section 3.2) held by students. The Russell Group recommends that students take at least two facilitating subjects at A level in order to keep most options for subject choice open (although they caution that some degrees, such as Music or Art, will require non-facilitating subjects to be chosen at A level). The majority of students, including those accepted at university, held A levels in fewer than two facilitating subjects.
Table 12: Number of facilitating A level subjects taken
Number of
facilitating
subjects
Percentage of Acceptance
rate (%) A level
students
(N = 291611)
University
applicants
(N = 304867)
Accepted
applicants
(N = 252126)
0 32.8 27.9 26.4 78.2
1 29.2 28.5 28.5 82.7
2 20.6 22.7 23.6 85.8
3 14.2 16.7 17.2 85.2
4 3.0 3.9 4.0 86.1
5+ 0.2 0.3 0.3 85.2
35
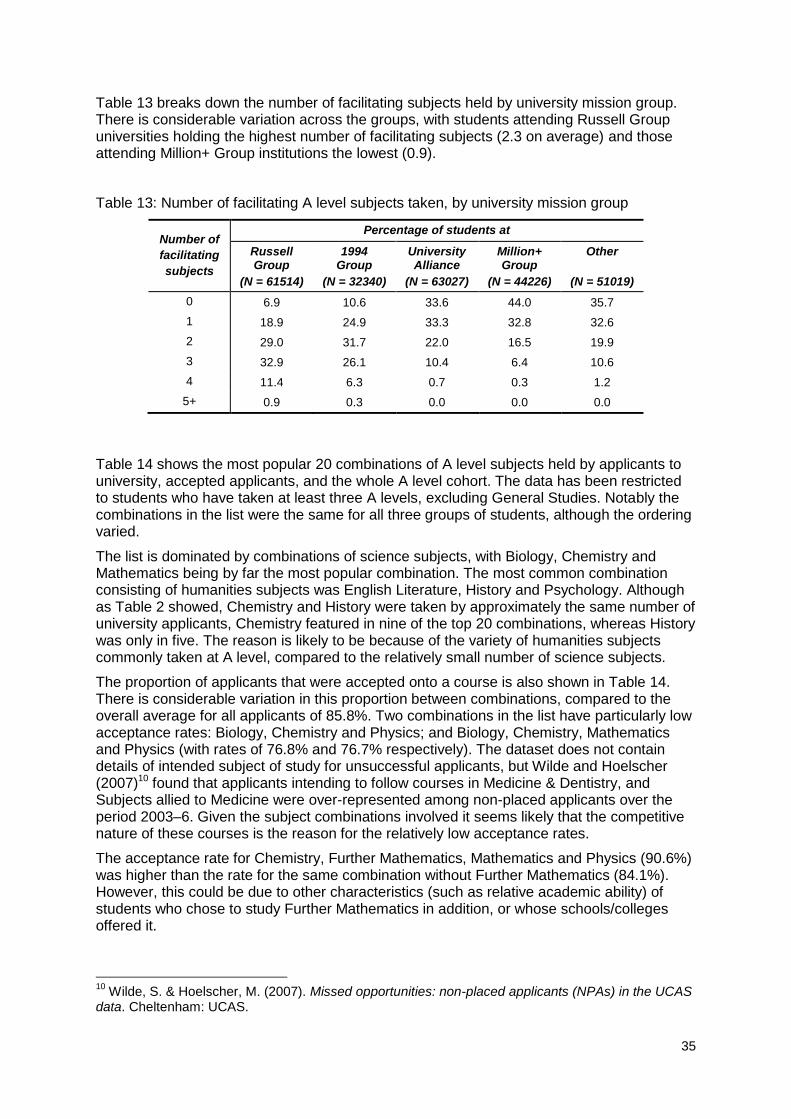
Table 13 breaks down the number of facilitating subjects held by university mission group. There is considerable variation across the groups, with students attending Russell Group universities holding the highest number of facilitating subjects (2.3 on average) and those attending Million+ Group institutions the lowest (0.9).
Table 13: Number of facilitating A level subjects taken, by university mission group
Number of
facilitating
subjects
Percentage of students at
Russell Group
(N = 61514)
1994 Group
(N = 32340)
University Alliance
(N = 63027)
Million+ Group
(N = 44226)
Other
(N = 51019)
0 6.9 10.6 33.6 44.0 35.7
1 18.9 24.9 33.3 32.8 32.6
2 29.0 31.7 22.0 16.5 19.9
3 32.9 26.1 10.4 6.4 10.6
4 11.4 6.3 0.7 0.3 1.2
5+ 0.9 0.3 0.0 0.0 0.0
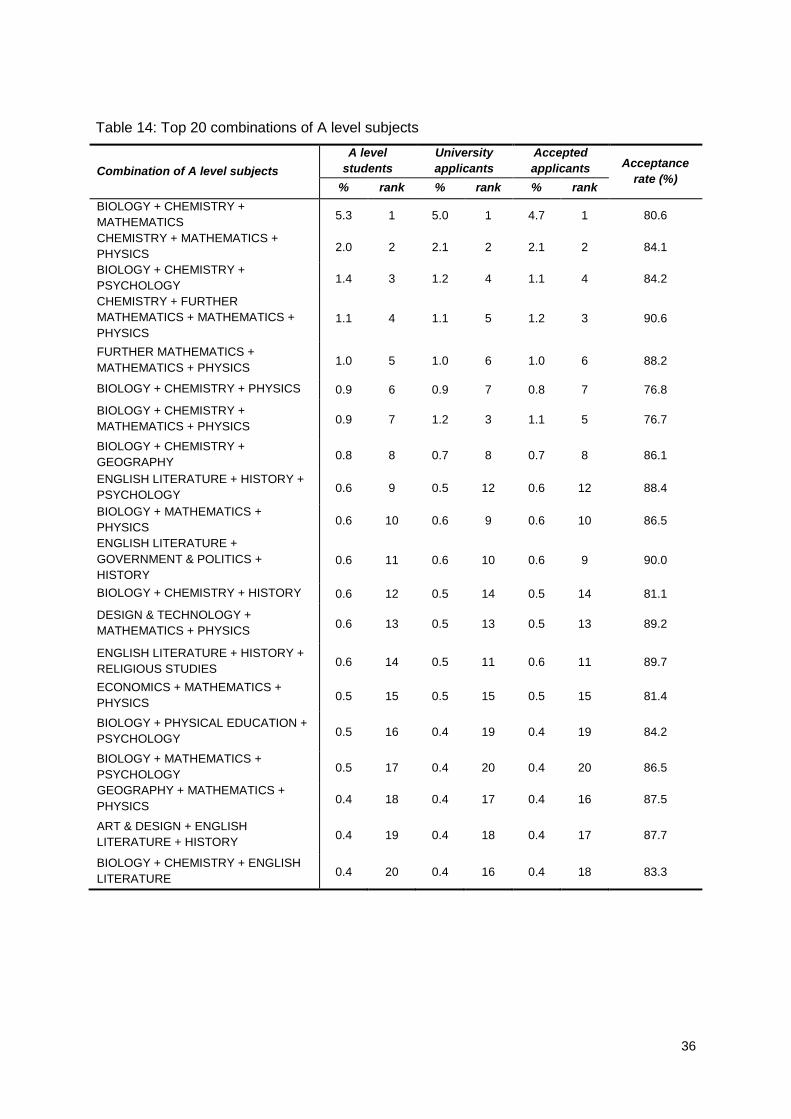
Table 14 shows the most popular 20 combinations of A level subjects held by applicants to university, accepted applicants, and the whole A level cohort. The data has been restricted to students who have taken at least three A levels, excluding General Studies. Notably the combinations in the list were the same for all three groups of students, although the ordering varied.
The list is dominated by combinations of science subjects, with Biology, Chemistry and Mathematics being by far the most popular combination. The most common combination consisting of humanities subjects was English Literature, History and Psychology. Although as Table 2 showed, Chemistry and History were taken by approximately the same number of university applicants, Chemistry featured in nine of the top 20 combinations, whereas History was only in five. The reason is likely to be because of the variety of humanities subjects commonly taken at A level, compared to the relatively small number of science subjects.
The proportion of applicants that were accepted onto a course is also shown in Table 14. There is considerable variation in this proportion between combinations, compared to the overall average for all applicants of 85.8%. Two combinations in the list have particularly low acceptance rates: Biology, Chemistry and Physics; and Biology, Chemistry, Mathematics and Physics (with rates of 76.8% and 76.7% respectively). The dataset does not contain details of intended subject of study for unsuccessful applicants, but Wilde and Hoelscher (2007)10 found that applicants intending to follow courses in Medicine & Dentistry, and Subjects allied to Medicine were over-represented among non-placed applicants over the period 2003–6. Given the subject combinations involved it seems likely that the competitive nature of these courses is the reason for the relatively low acceptance rates.
The acceptance rate for Chemistry, Further Mathematics, Mathematics and Physics (90.6%) was higher than the rate for the same combination without Further Mathematics (84.1%). However, this could be due to other characteristics (such as relative academic ability) of students who chose to study Further Mathematics in addition, or whose schools/colleges offered it.
10
Wilde, S. & Hoelscher, M. (2007). Missed opportunities: non-placed applicants (NPAs) in the UCAS data. Cheltenham: UCAS.
36
Table 14: Top 20 combinations of A level subjects
Combination of A level subjects
A level
students
University
applicants
Accepted
applicants Acceptance
rate (%) % rank % rank % rank
BIOLOGY + CHEMISTRY +
MATHEMATICS 5.3 1 5.0 1 4.7 1 80.6
CHEMISTRY + MATHEMATICS +
PHYSICS 2.0 2 2.1 2 2.1 2 84.1
BIOLOGY + CHEMISTRY +
PSYCHOLOGY 1.4 3 1.2 4 1.1 4 84.2
CHEMISTRY + FURTHER
MATHEMATICS + MATHEMATICS +
PHYSICS
1.1 4 1.1 5 1.2 3 90.6
FURTHER MATHEMATICS +
MATHEMATICS + PHYSICS 1.0 5 1.0 6 1.0 6 88.2
BIOLOGY + CHEMISTRY + PHYSICS 0.9 6 0.9 7 0.8 7 76.8
BIOLOGY + CHEMISTRY +
MATHEMATICS + PHYSICS 0.9 7 1.2 3 1.1 5 76.7
BIOLOGY + CHEMISTRY +
GEOGRAPHY 0.8 8 0.7 8 0.7 8 86.1
ENGLISH LITERATURE + HISTORY +
PSYCHOLOGY 0.6 9 0.5 12 0.6 12 88.4
BIOLOGY + MATHEMATICS +
PHYSICS 0.6 10 0.6 9 0.6 10 86.5
ENGLISH LITERATURE +
GOVERNMENT & POLITICS +
HISTORY
0.6 11 0.6 10 0.6 9 90.0
BIOLOGY + CHEMISTRY + HISTORY 0.6 12 0.5 14 0.5 14 81.1
DESIGN & TECHNOLOGY +
MATHEMATICS + PHYSICS 0.6 13 0.5 13 0.5 13 89.2
ENGLISH LITERATURE + HISTORY +
RELIGIOUS STUDIES 0.6 14 0.5 11 0.6 11 89.7
ECONOMICS + MATHEMATICS +
PHYSICS 0.5 15 0.5 15 0.5 15 81.4
BIOLOGY + PHYSICAL EDUCATION +
PSYCHOLOGY 0.5 16 0.4 19 0.4 19 84.2
BIOLOGY + MATHEMATICS +
PSYCHOLOGY 0.5 17 0.4 20 0.4 20 86.5
GEOGRAPHY + MATHEMATICS +
PHYSICS 0.4 18 0.4 17 0.4 16 87.5
ART & DESIGN + ENGLISH
LITERATURE + HISTORY 0.4 19 0.4 18 0.4 17 87.7
BIOLOGY + CHEMISTRY + ENGLISH
LITERATURE 0.4 20 0.4 16 0.4 18 83.3
37
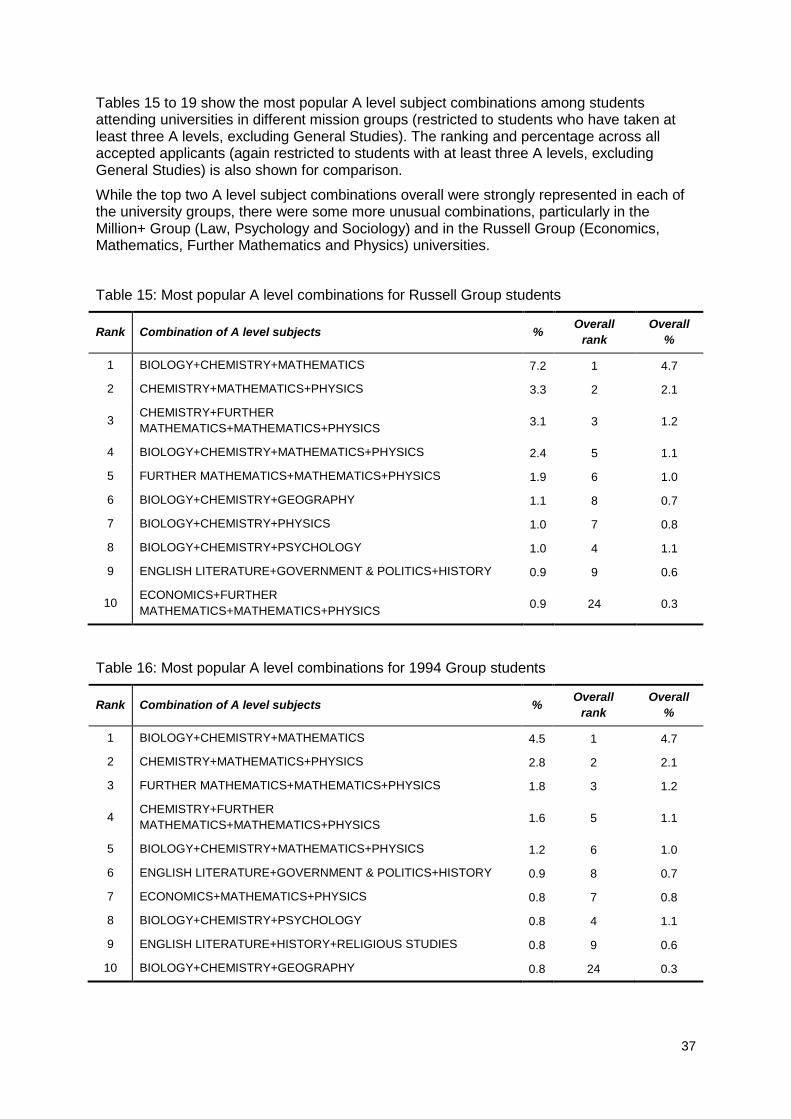
Tables 15 to 19 show the most popular A level subject combinations among students attending universities in different mission groups (restricted to students who have taken at least three A levels, excluding General Studies). The ranking and percentage across all accepted applicants (again restricted to students with at least three A levels, excluding General Studies) is also shown for comparison.
While the top two A level subject combinations overall were strongly represented in each of the university groups, there were some more unusual combinations, particularly in the Million+ Group (Law, Psychology and Sociology) and in the Russell Group (Economics, Mathematics, Further Mathematics and Physics) universities.
Table 15: Most popular A level combinations for Russell Group students
Rank Combination of A level subjects % Overall
rank
Overall
%
1 BIOLOGY+CHEMISTRY+MATHEMATICS 7.2 1 4.7
2 CHEMISTRY+MATHEMATICS+PHYSICS 3.3 2 2.1
3 CHEMISTRY+FURTHER
MATHEMATICS+MATHEMATICS+PHYSICS 3.1 3 1.2
4 BIOLOGY+CHEMISTRY+MATHEMATICS+PHYSICS 2.4 5 1.1
5 FURTHER MATHEMATICS+MATHEMATICS+PHYSICS 1.9 6 1.0
6 BIOLOGY+CHEMISTRY+GEOGRAPHY 1.1 8 0.7
7 BIOLOGY+CHEMISTRY+PHYSICS 1.0 7 0.8
8 BIOLOGY+CHEMISTRY+PSYCHOLOGY 1.0 4 1.1
9 ENGLISH LITERATURE+GOVERNMENT & POLITICS+HISTORY 0.9 9 0.6
10 ECONOMICS+FURTHER
MATHEMATICS+MATHEMATICS+PHYSICS 0.9 24 0.3
Table 16: Most popular A level combinations for 1994 Group students
Rank Combination of A level subjects % Overall
rank
Overall
%
1 BIOLOGY+CHEMISTRY+MATHEMATICS 4.5 1 4.7
2 CHEMISTRY+MATHEMATICS+PHYSICS 2.8 2 2.1
3 FURTHER MATHEMATICS+MATHEMATICS+PHYSICS 1.8 3 1.2
4 CHEMISTRY+FURTHER
MATHEMATICS+MATHEMATICS+PHYSICS 1.6 5 1.1
5 BIOLOGY+CHEMISTRY+MATHEMATICS+PHYSICS 1.2 6 1.0
6 ENGLISH LITERATURE+GOVERNMENT & POLITICS+HISTORY 0.9 8 0.7
7 ECONOMICS+MATHEMATICS+PHYSICS 0.8 7 0.8
8 BIOLOGY+CHEMISTRY+PSYCHOLOGY 0.8 4 1.1
9 ENGLISH LITERATURE+HISTORY+RELIGIOUS STUDIES 0.8 9 0.6
10 BIOLOGY+CHEMISTRY+GEOGRAPHY 0.8 24 0.3

38
Table 17: Most popular A level combinations for University Alliance students
Rank Combination of A level subjects % Overall
rank
Overall
%
1 BIOLOGY+CHEMISTRY+MATHEMATICS 3.3 1 4.7
2 CHEMISTRY+MATHEMATICS+PHYSICS 1.4 2 2.1
3 BIOLOGY+CHEMISTRY+PSYCHOLOGY 1.4 4 1.1
4 BIOLOGY+CHEMISTRY+PHYSICS 0.8 7 0.8
5 BIOLOGY+CHEMISTRY+GEOGRAPHY 0.7 8 0.7
6 DESIGN & TECHNOLOGY+MATHEMATICS+PHYSICS 0.6 13 0.5
7 ENGLISH LITERATURE+HISTORY+PSYCHOLOGY 0.6 12 0.5
8 BIOLOGY+PHYSICAL EDUCATION+PSYCHOLOGY 0.5 19 0.4
9 BIOLOGY+MATHEMATICS+PHYSICS 0.5 10 0.6
10 FURTHER MATHEMATICS+MATHEMATICS+PHYSICS 0.5 6 1.0
Table 18: Most popular A level combinations for Million+ Group students
Rank Combination of A level subjects % Overall
rank
Overall
%
1 BIOLOGY+CHEMISTRY+MATHEMATICS 3.0 1 4.7
2 BIOLOGY+CHEMISTRY+PSYCHOLOGY 1.4 4 1.1
3 CHEMISTRY+MATHEMATICS+PHYSICS 1.1 2 2.1
4 ENGLISH LITERATURE+PSYCHOLOGY+SOCIOLOGY 0.8 21 0.3
5 ENGLISH LITERATURE+HISTORY+PSYCHOLOGY 0.6 12 0.5
6 LAW+PSYCHOLOGY+SOCIOLOGY 0.6 35 0.3
7 BIOLOGY+PHYSICAL EDUCATION+PSYCHOLOGY 0.5 19 0.4
8 BIOLOGY+CHEMISTRY+PHYSICS 0.5 7 0.8
9 ENGLISH LANGUAGE+PSYCHOLOGY+SOCIOLOGY 0.5 30 0.3
10 BIOLOGY+MATHEMATICS+PSYCHOLOGY 0.5 20 0.4

39
Table 19: Most popular A level combinations for students at other universities
Rank Combination of A level subjects % Overall
rank
Overall
%
1 BIOLOGY+CHEMISTRY+MATHEMATICS 4.0 1 4.7
2 CHEMISTRY+MATHEMATICS+PHYSICS 1.3 2 2.1
3 BIOLOGY+CHEMISTRY+PSYCHOLOGY 1.0 4 1.1
4 BIOLOGY+CHEMISTRY+PHYSICS 0.8 7 0.8
5 BIOLOGY+CHEMISTRY+GEOGRAPHY 0.7 8 0.7
6 BIOLOGY+CHEMISTRY+MATHEMATICS+PHYSICS 0.6 5 1.1
7 ENGLISH LITERATURE+HISTORY+PSYCHOLOGY 0.6 12 0.5
8 BIOLOGY+MATHEMATICS+PHYSICS 0.5 10 0.6
9 ART & DESIGN+ENGLISH LITERATURE+HISTORY 0.5 17 0.4
10 ENGLISH LITERATURE+GOVERNMENT & POLITICS+HISTORY 0.5 9 0.6
Table 20 shows the most popular A level combinations among applicants (with at least three A levels excluding General Studies) who were not accepted onto a course at university, with the ranking and percentage across accepted applicants shown for comparison. As also seen in Table 14, students with Biology, Chemistry and Physics were particularly over-represented which may be due to the competitive nature of admissions onto courses in Medicine & Dentistry, and Subjects allied to Medicine.
Table 20: Most popular A level combinations among non-accepted applicants
Rank Combination of A level subjects %
Overall
rank
(accepted
applicants)
Overall
%
(accepted
applicants)
1 BIOLOGY+CHEMISTRY+MATHEMATICS 6.8 1 4.7
2 CHEMISTRY+MATHEMATICS+PHYSICS 2.4 2 2.1
3 BIOLOGY+CHEMISTRY+MATHEMATICS+PHYSICS 2.0 6 1.0
4 BIOLOGY+CHEMISTRY+PHYSICS 1.5 7 0.8
5 BIOLOGY+CHEMISTRY+PSYCHOLOGY 1.3 4 1.1
6 FURTHER MATHEMATICS+MATHEMATICS+PHYSICS 0.8 6 1.0
7 CHEMISTRY+FURTHER MATHEMATICS+MATHEMATICS+PHYSICS 0.7 5 1.1
8 BIOLOGY+CHEMISTRY+GEOGRAPHY 0.7 8 0.7
9 BIOLOGY+CHEMISTRY+HISTORY 0.7 14 0.5
10 ECONOMICS+MATHEMATICS+PHYSICS 0.7 15 0.5
Appendix D shows tables of popular combinations by university subject area.

40
3.3.2 Performance
Table 21 shows the cumulative distribution of A level grades held by applicants to university, accepted applicants, and the whole A level cohort. This analysis is restricted to students holding more than three A levels (excluding General Studies). For clarity and brevity, A* grades are represented as ‘*’ in this table. The grades have been compared on an individual basis, so higher grades in one A level do not compensate for lower grades in another; for example, **C is not classed as ABB or above. Only the best three grades held by each student have been used for comparison.
The distributions were similar between the three groups, but the highest grade combinations (for example *AA and above) were more frequent among accepted applicants than all applicants, and also more frequent among university applicants than among the whole A level cohort.
Table 21: Cumulative distribution of A level grades
Grade
combination
(at least)
A level
students (%)
University
applicants (%)
Accepted
applicants (%)
*** 3.0 3.3 3.4
**A 7.0 7.5 7.8
*AA 13.1 13.8 14.5
AAA 18.2 19.2 20.2
AAB 29.2 30.5 32.3
ABB 38.4 39.8 42.2
BBB 43.1 44.7 47.2
BBC 58.3 60.1 63.0
BCC 66.8 68.7 71.6
CCC 69.8 71.7 74.6
CCD 83.9 85.5 87.9
CDD 88.9 90.2 92.0
DDD 90.0 91.1 92.8
DDE 98.1 98.5 99.0
DEE 99.8 99.8 99.9
EEE 100.0 100.0 100.0
Table 22 shows the percentage of candidates with A level grades equal to or exceeding two thresholds (ABB and AAB) broken down by university mission group. Approximately a third of applicants gained ABB or above, and a quarter gained AAB or above. However, there is wide variation in these measures across university groups, with around two thirds of Russell Group students holding AAB or above, but only 3% of Million+ Group students.

41
Table 22: Percentage of applicants gaining ABB, AAB or above, by university mission group
University mission group % ABB+ % AAB+
Russell Group 84.3 70.7
1994 Group 69.8 52.3
University Alliance 12.2 5.6
Million+ Group 5.9 2.9
Other 18.9 11.9
All accepted applicants 42.2 32.3
Non-placed applicants 25.8 19.7
All applicants 39.8 30.5
All A level students 38.4 29.2
Figure 6 shows the distribution of the average A level grade11 by university mission group among accepted students. There is a clear gulf between the grade distributions of students attending universities in the Russell and 1994 Groups and the other university groups.
11
The average A level grade for a student has been calculated under the assumption that the grade scale is linear, such that the average of ABC is B. This assumption also underlies the UCAS tariff system.

42
Figure 6: Average A level grade, by university mission group

43
Appendix A: University subjects and degree subject areas
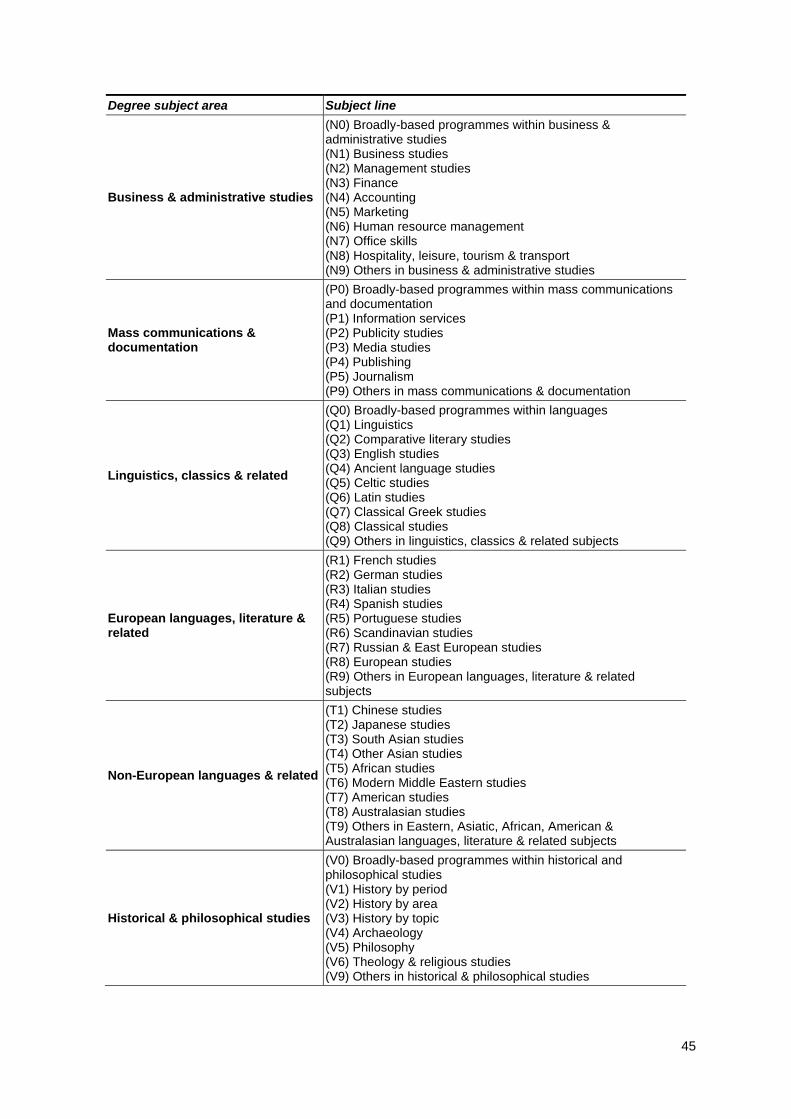
As mentioned in the report, the subject of study at university was provided as a full list of 180 subject lines (using the JACS system). These relate to the principal subject of the student’s qualification aim. The subject of study can be aggregated into 25 broad subject areas. The table below presents the subject lines and the degree subject areas used in this research.
Degree subject area Subject line
Medicine & dentistry
(A0) Broadly-based programmes within medicine & dentistry (A1) Pre-clinical medicine (A2) Pre-clinical dentistry (A3) Clinical medicine (A4) Clinical dentistry (A9) Others in medicine & dentistry
Subjects allied to medicine
(B0) Broadly-based programmes within subjects allied to medicine (B1) Anatomy, physiology & pathology (B2) Pharmacology, toxicology & pharmacy (B3) Complementary medicine (B4) Nutrition (B5) Ophthalmics (B6) Aural & oral sciences (B7) Nursing (B8) Medical technology (B9) Others in subjects allied to medicine
Biological sciences
(C0) Broadly-based programmes within biological sciences (C1) Biology (C2) Botany (C3) Zoology (C4) Genetics (C5) Microbiology (C6) Sports science (C7) Molecular biology, biophysics & biochemistry (C8) Psychology (C9) Others in biological sciences
Veterinary science, agriculture & related subjects
(D0) Broadly-based programmes within agriculture & related subjects (D1) Pre-clinical veterinary medicine (D2) Clinical veterinary medicine & dentistry (D3) Animal science (D4) Agriculture (D5) Forestry (D6) Food & beverage studies (D7) Agricultural sciences (D9) Others in veterinary sciences, agriculture & related subjects
Physical sciences
(F0) Broadly-based programmes within physical sciences (F1) Chemistry (F2) Materials science (F3) Physics (F4) Forensic & archaeological science (F5) Astronomy (F6) Geology (F7) Science of aquatic and terrestrial environments (F8) Physical geographical sciences (F9) Others in physical sciences

44
Degree subject area Subject line
Mathematical & computer sciences
(G01) Broadly-based programmes within mathematical sciences (G02) Broadly-based programmes within computer science (G1) Mathematics (G2) Operational research (G3) Statistics (G4) Computer science (G5) Information systems (G6) Software engineering (G7) Artificial intelligence (G91) Others in mathematical sciences (G92) Others in computing science
Engineering
(H0) Broadly-based programmes within engineering & technology (H1) General engineering (H2) Civil engineering (H3) Mechanical engineering (H4) Aerospace engineering (H5) Naval architecture (H6) Electronic & electrical engineering (H7) Production & manufacturing engineering (H8) Chemical, process & energy engineering (H9) Others in engineering
Technologies
(J1) Minerals technology (J2) Metallurgy (J3) Ceramics & glasses (J4) Polymers & textiles (J5) Materials technology not otherwise specified (J6) Maritime technology (J7) Biotechnology (J9) Others in technology (includes Music Technology)
Architecture, building & planning
(K0) Broadly-based programmes within architecture, building & planning (K1) Architecture (K2) Building (K3) Landscape design (K4) Planning (urban, rural & regional) (K9) Others in architecture, building & planning
Social studies
(L0) Broadly-based programmes within social studies (L1) Economics (L2) Politics (L3) Sociology (L4) Social policy (L5) Social work (L6) Anthropology (L7) Human & social geography (L9) Others in social studies
Law
(M0) Broadly-based programmes within law (M1) Law by area (M2) Law by topic (M9) Others in law
45
Degree subject area Subject line
Business & administrative studies
(N0) Broadly-based programmes within business & administrative studies (N1) Business studies (N2) Management studies (N3) Finance (N4) Accounting (N5) Marketing (N6) Human resource management (N7) Office skills (N8) Hospitality, leisure, tourism & transport (N9) Others in business & administrative studies
Mass communications & documentation
(P0) Broadly-based programmes within mass communications and documentation (P1) Information services (P2) Publicity studies (P3) Media studies (P4) Publishing (P5) Journalism (P9) Others in mass communications & documentation
Linguistics, classics & related
(Q0) Broadly-based programmes within languages (Q1) Linguistics (Q2) Comparative literary studies (Q3) English studies (Q4) Ancient language studies (Q5) Celtic studies (Q6) Latin studies (Q7) Classical Greek studies (Q8) Classical studies (Q9) Others in linguistics, classics & related subjects
European languages, literature & related
(R1) French studies (R2) German studies (R3) Italian studies (R4) Spanish studies (R5) Portuguese studies (R6) Scandinavian studies (R7) Russian & East European studies (R8) European studies (R9) Others in European languages, literature & related subjects
Non-European languages & related
(T1) Chinese studies (T2) Japanese studies (T3) South Asian studies (T4) Other Asian studies (T5) African studies (T6) Modern Middle Eastern studies (T7) American studies (T8) Australasian studies (T9) Others in Eastern, Asiatic, African, American & Australasian languages, literature & related subjects
Historical & philosophical studies
(V0) Broadly-based programmes within historical and philosophical studies (V1) History by period (V2) History by area (V3) History by topic (V4) Archaeology (V5) Philosophy (V6) Theology & religious studies (V9) Others in historical & philosophical studies

46
Degree subject area Subject line
Creative arts & design
(W0) Broadly-based programmes within creative arts & design (W1) Fine art (W2) Design studies (W3) Music (W4) Drama (W5) Dance (W6) Cinematics & photography (W7) Crafts (W8) Imaginative writing (W9) Others in creative arts & design
Education
(X0) Broadly-based programmes within education (X1) Training teachers (X2) Research & study skills in education (X3) Academic studies in education (X9) Others in education
Combined arts Combs of arts/humanities Combs of languages Combs of languages with arts/humanities
Combined sciences
Y Combs of engineering/tech/building studies Y Combs of engineering/technology Y Combs of med/bio/agric sciences Y Combs of med/bio/agric sciences with physics/math sciences Y Combs of physics/math sciences Y Combs of sciences with engineering/technology
Combined social sciences Y Combs of social studies/law Y Combs of social studies/law with business
Sciences combined with social sciences or arts
Y Combs of physics/math science with arts/humanities/languages Y Combs of physics/math science with social studies/bus/law Y Combs of science/engineering with arts/humanities/languages Y Combs of science/engineering with social studies/bus/law
Social sciences combined with arts Y Combs of social studies/bus/law with arts/humanities Y Combs of social studies/bus/law with languages
General, other combined & unknown
Combs of three subjects, or other general courses Other courses not elsewhere classified

47
Appendix B: University mission groups
Some universities formed groups through which they share ideas and resources regarding issues and procedures in the higher education sector. For this research, UCAS provided the following university groups: Russell Group, 1994 Group, University Alliance and Million+ Group. Universities that have not joined any of these groups were included in a separate group, labelled as Other.
In this Appendix, a description taken from statements provided on their websites and a list of members of each group is provided12.
The Russell Group (http://www.russellgroup.ac.uk)
"The Russell Group is an association of leading UK research-intensive universities committed to maintaining the highest standards of research, education and knowledge transfer. The members of The Russell Group have the quality and strengths to compete successfully in the global market place for research, skills, expertise and training."
"The aims and objectives of The Russell Group are to promote the interests of universities in which teaching and learning are undertaken within a culture of research excellence, and to identify and disseminate new thinking and ideas about the organisation and management of such institutions."
List of member institutions of the Russell Group
Cardiff University
Imperial College of Science, Technology and Medicine
King's College London
London School of Economics and Political Science
The Queen's University of Belfast
The University of Manchester
The University of Birmingham
The University of Bristol
The University of Cambridge
The University of Edinburgh
The University of Glasgow
The University of Leeds
The University of Liverpool
The University of Newcastle-upon-Tyne
The University of Nottingham
The University of Oxford
The University of Sheffield
The University of Southampton
The University of Warwick
University College London
12
Membership of these groups has changed since the UCAS data used in this research was provided to us (April 2012). For example, the University of Durham, the University of Exeter, Queen Mary and Westfield College and the University of York joined the Russell Group in August 2012. However, analyses were carried out using the groups as in April 2012.

48
1994 Group (http://www.1994group.ac.uk)
"The 1994 Group represents nineteen of the UK's most research-intensive and internationally renowned universities. The 1994 Group's mission is to promote excellence in research and teaching. Seeking to promote excellence in the student experience is therefore at the very heart of what we do. Each member institution delivers an extremely high standard of education to its students, demonstrating excellence in teaching and academic support, and providing learning in a research-rich community."
List of member institutions of the 1994 Group
Birkbeck College
Goldsmiths College
Loughborough University
Queen Mary and Westfield College
Royal Holloway and Bedford New College
The University of Bath
The University of East Anglia
The University of Essex
The University of Exeter
The University of Lancaster
The University of Leicester
The University of Reading
The University of St Andrews
The University of Surrey
The University of Sussex
The University of York
University of Durham

49
University Alliance (http://www.university-alliance.ac.uk)
"The University Alliance, previously convened informally as the Alliance of Non-Aligned Universities, was formed in 2006 comprising a mixture of pre and post 1992 universities. The member institutions have a balanced portfolio of research, teaching, enterprise and innovation integral to their missions and represent a strong voice from the middle sector making a vital contribution to the prosperity of the country."
List of member institutions of the University Alliance Group
Aberystwyth University
Bournemouth University
De Montfort University
Glasgow Caledonian University
Liverpool John Moores University
Oxford Brookes University
Sheffield Hallam University
The Manchester Metropolitan University
The Nottingham Trent University
The University of Bradford
The University of Huddersfield
The University of Lincoln
The University of Northumbria at Newcastle
The University of Plymouth
The University of Portsmouth
The University of Salford
The University of Teesside
The University of Wales, Newport
University of Glamorgan
University of Hertfordshire
University of Wales Institute, Cardiff
University of the West of England, Bristol
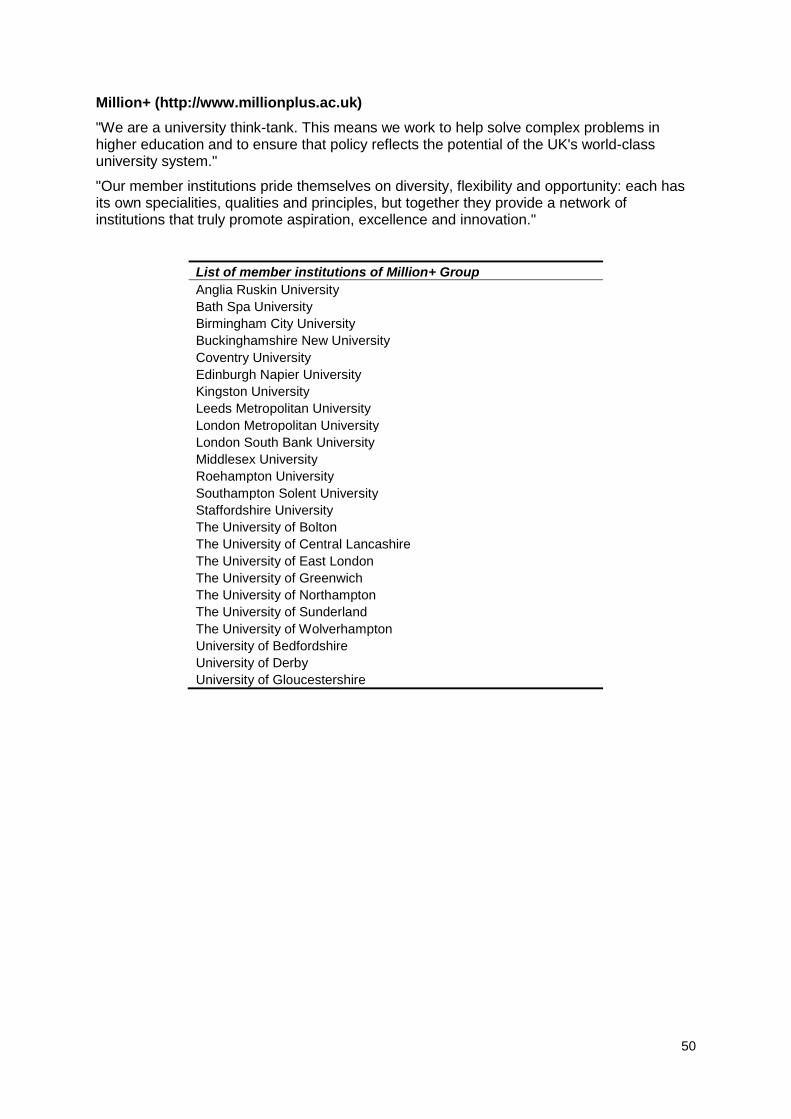
50
Million+ (http://www.millionplus.ac.uk)
"We are a university think-tank. This means we work to help solve complex problems in higher education and to ensure that policy reflects the potential of the UK's world-class university system."
"Our member institutions pride themselves on diversity, flexibility and opportunity: each has its own specialities, qualities and principles, but together they provide a network of institutions that truly promote aspiration, excellence and innovation."
List of member institutions of Million+ Group
Anglia Ruskin University
Bath Spa University
Birmingham City University
Buckinghamshire New University
Coventry University
Edinburgh Napier University
Kingston University
Leeds Metropolitan University
London Metropolitan University
London South Bank University
Middlesex University
Roehampton University
Southampton Solent University
Staffordshire University
The University of Bolton
The University of Central Lancashire
The University of East London
The University of Greenwich
The University of Northampton
The University of Sunderland
The University of Wolverhampton
University of Bedfordshire
University of Derby
University of Gloucestershire

51
Appendix C: University acceptances by degree subject area and university mission group (2010/11 application cycle)
Table C1: University acceptances by degree subject area
Degree subject area Number of candidates
Percent
Architecture, Building and Planning 8956 1.8
Biological Sciences 40227 8.2
Business & Administrative Studies 61484 12.5
Combined Arts 12778 2.6
Combined Sciences 8361 1.7
Combined Social Sciences 5639 1.1
Creative Arts & Design 53258 10.8
Education 17136 3.5
Engineering 26022 5.3
European Languages, Literature & related 4576 0.9
General, other combined & unknown 3972 0.8
History & Philosophical studies 15092 3.1
Law 22768 4.6
Linguistics, Classics & related 12660 2.6
Mass Communications & Documentation 11834 2.4
Mathematics & Computer Science 29265 5.9
Medicine & Dentistry 9067 1.8
Non-European Languages & related 1434 0.3
Physical Sciences 18464 3.8
Sciences combined with social sciences or arts 19797 4.0
Social Studies 40225 8.2
Social sciences combined with arts 11962 2.4
Subjects allied to Medicine 48023 9.8
Technologies 2817 0.6
Veterinary Science, Agriculture & related 6213 1.3
All areas 49203013
Table C2: University acceptances by university mission group
University group Number of candidates
Percent
Russell Group 89921 18.4
1994 Group 50123 10.2
University Alliance 110329 22.5
Million + 113538 23.2
Other 128119 25.6
13
This figure includes candidates from Scotland and overseas.

52
Appendix D: Most popular A level subject combinations for degree subject areas
These tables present the ten most popular A level combinations among students enrolled on courses in given subject areas (restricted to students who have taken at least three A levels, excluding General Studies). The ranking and percentage across accepted applicants in all subjects (again restricted to students with at least three A levels, excluding General Studies) is also shown for comparison.
Table D1: Architecture, Building and Planning
Rank Combination of A level subjects % Overall
rank Overall
%
1 ART & DESIGN+MATHEMATICS+PHYSICS 6.0 34 0.3
2 ART & DESIGN+DESIGN & TECHNOLOGY+MATHEMATICS 2.4 113 0.1
3 DESIGN & TECHNOLOGY+MATHEMATICS+PHYSICS 2.4 13 0.5
4 ART & DESIGN+GEOGRAPHY+MATHEMATICS 1.9 170 0.1
5 CHEMISTRY+MATHEMATICS+PHYSICS 1.1 2 2.1
6 ART & DESIGN+CHEMISTRY+MATHEMATICS 1.1 293 0.1
7 ART & DESIGN+HISTORY+MATHEMATICS 1.0 357 0.1
8 FURTHER MATHEMATICS+MATHEMATICS+PHYSICS 1.0 6 1.0
9 ART & DESIGN+ECONOMICS+MATHEMATICS 1.0 243 0.1
10 ART & DESIGN+FURTHER MATHEMATICS+MATHEMATICS+PHYSICS
0.9 396 0.0
Table D2: Biological Sciences
Rank Combination of A level subjects % Overall
rank Overall
%
1 BIOLOGY+CHEMISTRY+MATHEMATICS 9.2 1 4.7
2 BIOLOGY+CHEMISTRY+PSYCHOLOGY 3.5 4 1.1
3 BIOLOGY+CHEMISTRY+PHYSICS 2.1 7 0.8
4 BIOLOGY+CHEMISTRY+GEOGRAPHY 1.9 8 0.7
5 BIOLOGY+PHYSICAL EDUCATION+PSYCHOLOGY 1.9 19 0.4
6 BIOLOGY+MATHEMATICS+PSYCHOLOGY 1.7 20 0.4
7 BIOLOGY+CHEMISTRY+HISTORY 1.3 14 0.5
8 BIOLOGY+ENGLISH LITERATURE+PSYCHOLOGY 1.2 31 0.3
9 ENGLISH LITERATURE+HISTORY+PSYCHOLOGY 1.2 12 0.5
10 BIOLOGY+CHEMISTRY+MATHEMATICS+PHYSICS 1.0 5 1.1
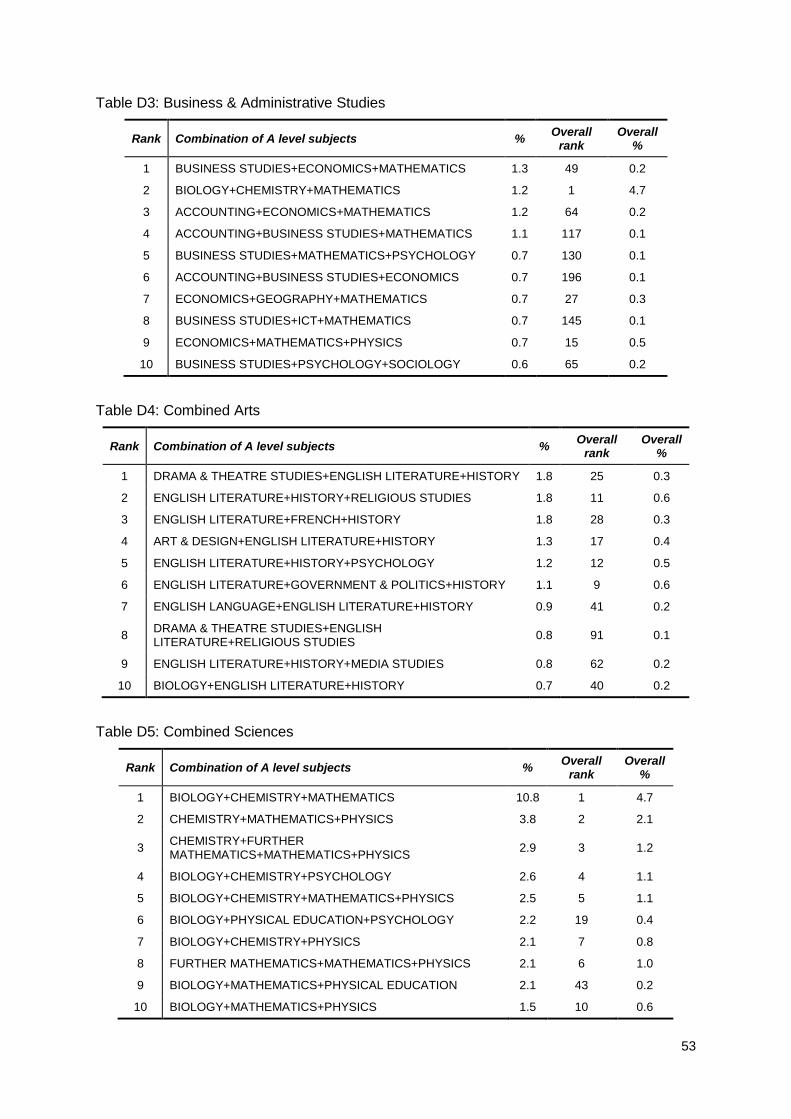
53
Table D3: Business & Administrative Studies
Rank Combination of A level subjects % Overall
rank Overall
%
1 BUSINESS STUDIES+ECONOMICS+MATHEMATICS 1.3 49 0.2
2 BIOLOGY+CHEMISTRY+MATHEMATICS 1.2 1 4.7
3 ACCOUNTING+ECONOMICS+MATHEMATICS 1.2 64 0.2
4 ACCOUNTING+BUSINESS STUDIES+MATHEMATICS 1.1 117 0.1
5 BUSINESS STUDIES+MATHEMATICS+PSYCHOLOGY 0.7 130 0.1
6 ACCOUNTING+BUSINESS STUDIES+ECONOMICS 0.7 196 0.1
7 ECONOMICS+GEOGRAPHY+MATHEMATICS 0.7 27 0.3
8 BUSINESS STUDIES+ICT+MATHEMATICS 0.7 145 0.1
9 ECONOMICS+MATHEMATICS+PHYSICS 0.7 15 0.5
10 BUSINESS STUDIES+PSYCHOLOGY+SOCIOLOGY 0.6 65 0.2
Table D4: Combined Arts
Rank Combination of A level subjects % Overall
rank Overall
%
1 DRAMA & THEATRE STUDIES+ENGLISH LITERATURE+HISTORY 1.8 25 0.3
2 ENGLISH LITERATURE+HISTORY+RELIGIOUS STUDIES 1.8 11 0.6
3 ENGLISH LITERATURE+FRENCH+HISTORY 1.8 28 0.3
4 ART & DESIGN+ENGLISH LITERATURE+HISTORY 1.3 17 0.4
5 ENGLISH LITERATURE+HISTORY+PSYCHOLOGY 1.2 12 0.5
6 ENGLISH LITERATURE+GOVERNMENT & POLITICS+HISTORY 1.1 9 0.6
7 ENGLISH LANGUAGE+ENGLISH LITERATURE+HISTORY 0.9 41 0.2
8 DRAMA & THEATRE STUDIES+ENGLISH LITERATURE+RELIGIOUS STUDIES
0.8 91 0.1
9 ENGLISH LITERATURE+HISTORY+MEDIA STUDIES 0.8 62 0.2
10 BIOLOGY+ENGLISH LITERATURE+HISTORY 0.7 40 0.2
Table D5: Combined Sciences
Rank Combination of A level subjects % Overall
rank Overall
%
1 BIOLOGY+CHEMISTRY+MATHEMATICS 10.8 1 4.7
2 CHEMISTRY+MATHEMATICS+PHYSICS 3.8 2 2.1
3 CHEMISTRY+FURTHER MATHEMATICS+MATHEMATICS+PHYSICS
2.9 3 1.2
4 BIOLOGY+CHEMISTRY+PSYCHOLOGY 2.6 4 1.1
5 BIOLOGY+CHEMISTRY+MATHEMATICS+PHYSICS 2.5 5 1.1
6 BIOLOGY+PHYSICAL EDUCATION+PSYCHOLOGY 2.2 19 0.4
7 BIOLOGY+CHEMISTRY+PHYSICS 2.1 7 0.8
8 FURTHER MATHEMATICS+MATHEMATICS+PHYSICS 2.1 6 1.0
9 BIOLOGY+MATHEMATICS+PHYSICAL EDUCATION 2.1 43 0.2
10 BIOLOGY+MATHEMATICS+PHYSICS 1.5 10 0.6

54
Table D6: Combined Social Sciences
Rank Combination of A level subjects % Overall
rank Overall
%
1 ECONOMICS+GEOGRAPHY+MATHEMATICS 1.5 27 0.3
2 ECONOMICS+HISTORY+MATHEMATICS 1.5 23 0.3
3 LAW+PSYCHOLOGY+SOCIOLOGY 1.4 35 0.3
4 ECONOMICS+MATHEMATICS+PHYSICS 1.2 15 0.5
5 BUSINESS STUDIES+ECONOMICS+MATHEMATICS 1.2 49 0.2
6 ACCOUNTING+ECONOMICS+MATHEMATICS 1.1 64 0.2
7 ENGLISH LITERATURE+PSYCHOLOGY+SOCIOLOGY 1.1 21 0.3
8 BIOLOGY+ECONOMICS+MATHEMATICS 1.0 54 0.2
9 ENGLISH LANGUAGE+PSYCHOLOGY+SOCIOLOGY 0.9 30 0.3
10 ECONOMICS+MATHEMATICS+PSYCHOLOGY 0.9 63 0.2
Table D7: Creative Arts & Design
Rank Combination of A level subjects % Overall
rank Overall
%
1 ART & DESIGN+ART & DESIGN+MEDIA STUDIES 1.7 56 0.2
2 ART & DESIGN+ENGLISH LITERATURE+HISTORY 1.2 17 0.4
3 ART & DESIGN+DESIGN & TECHNOLOGY+ENGLISH LITERATURE 1.2 114 0.1
4 ART & DESIGN+DESIGN & TECHNOLOGY+MEDIA STUDIES 1.1 105 0.1
5 ART & DESIGN+ART & DESIGN+DESIGN & TECHNOLOGY 1.1 137 0.1
6 ART & DESIGN+ART & DESIGN+ENGLISH LITERATURE 1.0 116 0.1
7 ART & DESIGN+ENGLISH LITERATURE+MEDIA STUDIES 1.0 60 0.2
8 ART & DESIGN+DRAMA & THEATRE STUDIES+ENGLISH LITERATURE
1.0 89 0.1
9 ART & DESIGN+ENGLISH LITERATURE+PSYCHOLOGY 1.0 33 0.3
10 DRAMA & THEATRE STUDIES+ENGLISH LITERATURE+HISTORY 0.9 25 0.3
Table D8: Education
Rank Combination of A level subjects % Overall
rank Overall
%
1 ENGLISH LANGUAGE+PSYCHOLOGY+SOCIOLOGY 1.8 30 0.3
2 ENGLISH LITERATURE+PSYCHOLOGY+SOCIOLOGY 1.1 21 0.3
3 ENGLISH LITERATURE+HISTORY+PSYCHOLOGY 1.1 12 0.5
4 ENGLISH LANGUAGE & LITERATURE+PSYCHOLOGY+SOCIOLOGY
1.1 51 0.2
5 ENGLISH LITERATURE+HISTORY+RELIGIOUS STUDIES 0.9 11 0.6
6 ART & DESIGN+ENGLISH LITERATURE+PSYCHOLOGY 0.8 33 0.3
7 ENGLISH LITERATURE+HISTORY+SOCIOLOGY 0.7 32 0.3
8 ENGLISH LANGUAGE+ENGLISH LITERATURE+PSYCHOLOGY 0.7 69 0.2
9 BIOLOGY+PHYSICAL EDUCATION+PSYCHOLOGY 0.6 19 0.4
10 DRAMA & THEATRE STUDIES+ENGLISH LITERATURE+HISTORY 0.5 25 0.3

55
Table D9: Engineering
Rank Combination of A level subjects % Overall
rank Overall
%
1 CHEMISTRY+MATHEMATICS+PHYSICS 16.9 2 2.1
2 CHEMISTRY+FURTHER MATHEMATICS+MATHEMATICS+PHYSICS
7.0 3 1.2
3 DESIGN & TECHNOLOGY+MATHEMATICS+PHYSICS 6.9 13 0.5
4 FURTHER MATHEMATICS+MATHEMATICS+PHYSICS 5.9 6 1.0
5 BIOLOGY+CHEMISTRY+MATHEMATICS 3.9 1 4.7
6 BIOLOGY+MATHEMATICS+PHYSICS 3.6 10 0.6
7 GEOGRAPHY+MATHEMATICS+PHYSICS 2.8 16 0.4
8 ECONOMICS+MATHEMATICS+PHYSICS 2.6 15 0.5
9 BIOLOGY+CHEMISTRY+MATHEMATICS+PHYSICS 2.2 5 1.1
10 ELECTRONICS+MATHEMATICS+PHYSICS 1.7 133 0.1
Table D10: European Languages, Literature & related
Rank Combination of A level subjects % Overall
rank Overall
%
1 ENGLISH LITERATURE+FRENCH+SPANISH 4.8 107 0.1
2 ENGLISH LITERATURE+FRENCH+HISTORY 2.3 28 0.3
3 FRENCH+MATHEMATICS+SPANISH 2.1 296 0.1
4 FRENCH+HISTORY+SPANISH 1.9 274 0.1
5 ENGLISH LITERATURE+FRENCH+GERMAN 1.8 326 0.1
6 FRENCH+GEOGRAPHY+SPANISH 1.3 447 0.0
7 ECONOMICS+FRENCH+SPANISH 1.2 459 0.0
8 FRENCH+GERMAN+MATHEMATICS 1.2 581 0.0
9 FRENCH+PSYCHOLOGY+SPANISH 1.0 564 0.0
10 FRENCH+GERMAN+HISTORY 0.9 572 0.0
Table D11: General, other combined & unknown
Rank Combination of A level subjects % Overall
rank Overall
%
1 CHEMISTRY+FURTHER MATHEMATICS+MATHEMATICS+PHYSICS 9.7 3 1.2
2 BIOLOGY+CHEMISTRY+MATHEMATICS 8.0 1 4.7
3 BIOLOGY+CHEMISTRY+MATHEMATICS+PHYSICS 6.7 5 1.1
4 CHEMISTRY+MATHEMATICS+PHYSICS 4.4 2 2.1
5 BIOLOGY+CHEMISTRY+FURTHER MATHEMATICS+MATHEMATICS 3.5 26 0.3
6 BIOLOGY+CHEMISTRY+FURTHER MATHEMATICS+MATHEMATICS+PHYSICS
2.6 103 0.1
7 BIOLOGY+CHEMISTRY+PHYSICS 1.5 7 0.8
8 BIOLOGY+CHEMISTRY+PSYCHOLOGY 1.4 4 1.1
9 BIOLOGY+MATHEMATICS+PHYSICS 1.2 10 0.6
10 ECONOMICS+FURTHER MATHEMATICS+MATHEMATICS+PHYSICS 1.0 24 0.3

56
Table D12: History & Philosophical studies
Rank Combination of A level subjects % Overall
rank Overall
%
1 ENGLISH LITERATURE+HISTORY+RELIGIOUS STUDIES 4.0 11 0.6
2 ENGLISH LITERATURE+GOVERNMENT & POLITICS+HISTORY 2.7 9 0.6
3 ENGLISH LITERATURE+HISTORY+PSYCHOLOGY 1.9 12 0.5
4 ENGLISH LITERATURE+GEOGRAPHY+HISTORY 1.7 22 0.3
5 ART & DESIGN+ENGLISH LITERATURE+HISTORY 1.5 17 0.4
6 ENGLISH LITERATURE+HISTORY+MATHEMATICS 1.3 37 0.3
7 BIOLOGY+ENGLISH LITERATURE+HISTORY 1.1 40 0.2
8 ENGLISH LITERATURE+FRENCH+HISTORY 1.1 28 0.3
9 GOVERNMENT & POLITICS+HISTORY+RELIGIOUS STUDIES 1.0 58 0.2
10 CLASSICAL CIVILISATION+ENGLISH LITERATURE+HISTORY 1.0 95 0.1
Table D13: Law
Rank Combination of A level subjects % Overall
rank Overall
%
1 LAW+PSYCHOLOGY+SOCIOLOGY 2.1 35 0.3
2 ENGLISH LITERATURE+HISTORY+LAW 1.3 94 0.1
3 ENGLISH LITERATURE+GOVERNMENT & POLITICS+HISTORY 1.2 9 0.6
4 HISTORY+LAW+PSYCHOLOGY 1.2 110 0.1
5 ENGLISH LANGUAGE+LAW+PSYCHOLOGY 1.1 104 0.1
6 ENGLISH LITERATURE+HISTORY+RELIGIOUS STUDIES 1.0 11 0.6
7 ENGLISH LITERATURE+LAW+PSYCHOLOGY 1.0 121 0.1
8 ENGLISH LITERATURE+HISTORY+PSYCHOLOGY 0.9 12 0.5
9 ENGLISH LANGUAGE & LITERATURE+LAW+PSYCHOLOGY 0.9 141 0.1
10 BUSINESS STUDIES+LAW+PSYCHOLOGY 0.7 136 0.1
Table D14: Linguistics, Classics & related
Rank Combination of A level subjects % Overall
rank Overall
%
1 ENGLISH LANGUAGE+ENGLISH LITERATURE+HISTORY 2.2 41 0.2
2 ENGLISH LITERATURE+HISTORY+PSYCHOLOGY 2.1 12 0.5
3 ENGLISH LITERATURE+HISTORY+RELIGIOUS STUDIES 2.0 11 0.6
4 ENGLISH LITERATURE+GOVERNMENT & POLITICS+HISTORY 2.0 9 0.6
5 ART & DESIGN+ENGLISH LITERATURE+HISTORY 1.6 17 0.4
6 ENGLISH LANGUAGE+ENGLISH LITERATURE+PSYCHOLOGY 1.3 69 0.2
7 DRAMA & THEATRE STUDIES+ENGLISH LITERATURE+HISTORY 1.1 25 0.3
8 ENGLISH LITERATURE+FRENCH+HISTORY 1.1 28 0.3
9 ENGLISH LITERATURE+HISTORY+MATHEMATICS 1.1 37 0.3
10 BIOLOGY+ENGLISH LITERATURE+HISTORY 1.1 40 0.2

57
Table D15: Mass Communications & Documentation
Rank Combination of A level subjects % Overall
rank Overall
%
1 ART & DESIGN+ENGLISH LANGUAGE+MEDIA STUDIES 1.6 83 0.2
2 ENGLISH LITERATURE+HISTORY+MEDIA STUDIES 1.5 62 0.2
3 ENGLISH LANGUAGE+MEDIA STUDIES+SOCIOLOGY 1.5 108 0.1
4 ART & DESIGN+ENGLISH LITERATURE+MEDIA STUDIES 1.5 60 0.2
5 DRAMA & THEATRE STUDIES+ENGLISH LITERATURE+MEDIA STUDIES
1.4 80 0.2
6 ENGLISH LITERATURE+MEDIA STUDIES+PSYCHOLOGY 1.3 79 0.2
7 ENGLISH LANGUAGE+MEDIA STUDIES+PSYCHOLOGY 1.3 97 0.1
8 ENGLISH LANGUAGE+FILM STUDIES+MEDIA STUDIES 1.3 207 0.1
9 ENGLISH LITERATURE+FILM STUDIES+MEDIA STUDIES 1.3 229 0.1
10 ENGLISH LITERATURE+MEDIA STUDIES+SOCIOLOGY 1.2 119 0.1
Table D16: Mathematics & Computer Science
Rank Combination of A level subjects % Overall
rank Overall
%
1 FURTHER MATHEMATICS+MATHEMATICS+PHYSICS 7.8 6 1.0
2 CHEMISTRY+FURTHER MATHEMATICS+MATHEMATICS+PHYSICS
5.5 3 1.2
3 CHEMISTRY+MATHEMATICS+PHYSICS 3.2 2 2.1
4 BIOLOGY+CHEMISTRY+MATHEMATICS 3.1 1 4.7
5 COMPUTING+MATHEMATICS+PHYSICS 2.6 39 0.2
6 ECONOMICS+FURTHER MATHEMATICS+MATHEMATICS+PHYSICS
1.9 24 0.3
7 CHEMISTRY+FURTHER MATHEMATICS+MATHEMATICS 1.8 77 0.2
8 ECONOMICS+FURTHER MATHEMATICS+MATHEMATICS 1.7 45 0.2
9 COMPUTING+FURTHER MATHEMATICS+MATHEMATICS+PHYSICS
1.4 152 0.1
10 ICT+MATHEMATICS+PHYSICS 1.1 76 0.2

58
Table D17: Medicine & Dentistry
Rank Combination of A level subjects % Overall
rank Overall
%
1 BIOLOGY+CHEMISTRY+MATHEMATICS 31.8 1 4.7
2 BIOLOGY+CHEMISTRY+MATHEMATICS+PHYSICS 11.9 5 1.1
3 BIOLOGY+CHEMISTRY+PHYSICS 3.9 7 0.8
4 BIOLOGY+CHEMISTRY+GEOGRAPHY 3.5 8 0.7
5 BIOLOGY+CHEMISTRY+PSYCHOLOGY 3.4 4 1.1
6 BIOLOGY+CHEMISTRY+FURTHER MATHEMATICS+MATHEMATICS
2.8 26 0.3
7 BIOLOGY+CHEMISTRY+FRENCH+MATHEMATICS 2.4 100 0.1
8 BIOLOGY+CHEMISTRY+HISTORY 2.4 14 0.5
9 BIOLOGY+CHEMISTRY+ENGLISH LITERATURE 2.1 18 0.4
10 BIOLOGY+CHEMISTRY+GEOGRAPHY+MATHEMATICS 1.8 84 0.2
Table D18: Non European Languages & related
Rank Combination of A level subjects % Overall
rank Overall
%
1 ENGLISH LITERATURE+GOVERNMENT & POLITICS+HISTORY 2.8 9 0.6
2 FRENCH+MATHEMATICS+SPANISH 1.8 296 0.1
3 ENGLISH LITERATURE+FRENCH+SPANISH 1.7 107 0.1
4 ENGLISH LITERATURE+HISTORY+RELIGIOUS STUDIES 1.7 11 0.6
5 DRAMA & THEATRE STUDIES+ENGLISH LITERATURE+HISTORY 1.5 25 0.3
6 ART & DESIGN+ENGLISH LITERATURE+HISTORY 1.4 17 0.4
7 ENGLISH LITERATURE+GEOGRAPHY+HISTORY 1.4 22 0.3
8 FRENCH+HISTORY+SPANISH 1.2 274 0.1
9 ENGLISH LITERATURE+HISTORY+PSYCHOLOGY 1.1 12 0.5
10 ENGLISH LITERATURE+FRENCH+HISTORY 0.9 28 0.3
Table D19: Physical Sciences
Rank Combination of A level subjects % Overall
rank Overall
%
1 CHEMISTRY+MATHEMATICS+PHYSICS 10.3 2 2.1
2 BIOLOGY+CHEMISTRY+MATHEMATICS 7.5 1 4.7
3 CHEMISTRY+FURTHER MATHEMATICS+MATHEMATICS+PHYSICS
4.7 3 1.2
4 BIOLOGY+CHEMISTRY+GEOGRAPHY 2.8 8 0.7
5 FURTHER MATHEMATICS+MATHEMATICS+PHYSICS 2.6 6 1.0
6 BIOLOGY+CHEMISTRY+MATHEMATICS+PHYSICS 2.3 5 1.1
7 GEOGRAPHY+MATHEMATICS+PHYSICS 2.0 16 0.4
8 BIOLOGY+MATHEMATICS+PHYSICS 1.9 10 0.6
9 BIOLOGY+CHEMISTRY+PHYSICS 1.9 7 0.8
10 BIOLOGY+CHEMISTRY+PSYCHOLOGY 1.6 4 1.1

59
Table D20: Sciences combined with social sciences or arts
Rank Combination of A level subjects % Overall
rank Overall
%
1 BIOLOGY+CHEMISTRY+MATHEMATICS 1.1 1 4.7
2 ECONOMICS+FURTHER MATHEMATICS+MATHEMATICS 1.0 45 0.2
3 BIOLOGY+PHYSICAL EDUCATION+PSYCHOLOGY 0.9 19 0.4
4 ENGLISH LITERATURE+PSYCHOLOGY+SOCIOLOGY 0.8 21 0.3
5 BIOLOGY+CHEMISTRY+PSYCHOLOGY 0.6 4 1.1
6 CHEMISTRY+MATHEMATICS+PHYSICS 0.6 2 2.1
7 FURTHER MATHEMATICS+MATHEMATICS+PHYSICS 0.6 6 1.0
8 BUSINESS STUDIES+PHYSICAL EDUCATION+PSYCHOLOGY 0.5 109 0.1
9 ECONOMICS+FURTHER MATHEMATICS+MATHEMATICS+PHYSICS
0.5 24 0.3
10 ART & DESIGN+ENGLISH LITERATURE+PSYCHOLOGY 0.5 33 0.3
Table D21: Social Studies
Rank Combination of A level subjects % Overall
rank Overall %
1 ECONOMICS+GEOGRAPHY+MATHEMATICS 2.0 27 0.3
2 ECONOMICS+HISTORY+MATHEMATICS 1.9 23 0.3
3 ECONOMICS+MATHEMATICS+PHYSICS 1.7 15 0.5
4 ENGLISH LITERATURE+GOVERNMENT & POLITICS+HISTORY 1.6 9 0.6
5 ECONOMICS+GOVERNMENT & POLITICS+HISTORY 1.2 44 0.2
6 ECONOMICS+GOVERNMENT & POLITICS+MATHEMATICS 1.1 86 0.1
7 BIOLOGY+ECONOMICS+MATHEMATICS 1.1 54 0.2
8 ECONOMICS+FURTHER MATHEMATICS+MATHEMATICS+PHYSICS 1.0 24 0.3
9 CHEMISTRY+ECONOMICS+MATHEMATICS 1.0 36 0.3
10 GEOGRAPHY+GOVERNMENT & POLITICS+HISTORY 0.8 70 0.2
Table D22: Social sciences combined with arts
Rank Combination of A level subjects % Overall
rank Overall
%
1 ENGLISH LITERATURE+GOVERNMENT & POLITICS+HISTORY 2.8 9 0.6
2 ECONOMICS+GOVERNMENT & POLITICS+HISTORY 1.2 44 0.2
3 GOVERNMENT & POLITICS+HISTORY+RELIGIOUS STUDIES 1.1 58 0.2
4 ENGLISH LITERATURE+HISTORY+RELIGIOUS STUDIES 1.1 11 0.6
5 GEOGRAPHY+GOVERNMENT & POLITICS+HISTORY 0.9 70 0.2
6 GOVERNMENT & POLITICS+HISTORY+SOCIOLOGY 0.9 90 0.1
7 ENGLISH LITERATURE+HISTORY+SOCIOLOGY 0.8 32 0.3
8 ECONOMICS+HISTORY+MATHEMATICS 0.8 23 0.3
9 ENGLISH LANGUAGE+GOVERNMENT & POLITICS+HISTORY 0.7 168 0.1
10 ENGLISH LITERATURE+HISTORY+PSYCHOLOGY 0.7 12 0.5

60
Table D23: Subjects allied to Medicine
Rank Combination of A level subjects % Overall
rank Overall
%
1 BIOLOGY+CHEMISTRY+MATHEMATICS 21.5 1 4.7
2 BIOLOGY+CHEMISTRY+PSYCHOLOGY 6.7 4 1.1
3 BIOLOGY+CHEMISTRY+PHYSICS 3.0 7 0.8
4 BIOLOGY+CHEMISTRY+MATHEMATICS+PHYSICS 2.5 5 1.1
5 BIOLOGY+CHEMISTRY+GEOGRAPHY 2.5 8 0.7
6 BIOLOGY+CHEMISTRY+HISTORY 1.9 14 0.5
7 BIOLOGY+CHEMISTRY+ENGLISH LITERATURE 1.6 18 0.4
8 BIOLOGY+CHEMISTRY+RELIGIOUS STUDIES 1.2 55 0.2
9 BIOLOGY+CHEMISTRY+PHYSICAL EDUCATION 1.1 42 0.2
10 BIOLOGY+PHYSICAL EDUCATION+PSYCHOLOGY 1.1 19 0.4
Table D24: Technologies
Rank Combination of A level subjects % Overall
rank Overall
%
1 BIOLOGY+CHEMISTRY+MATHEMATICS 5.5 1 4.7
2 CHEMISTRY+MATHEMATICS+PHYSICS 4.4 2 2.1
3 MATHEMATICS+MUSIC+PHYSICS 4.4 88 0.1
4 BIOLOGY+CHEMISTRY+MATHEMATICS+PHYSICS 2.0 5 1.1
5 BIOLOGY+CHEMISTRY+PHYSICS 1.5 7 0.8
6 BIOLOGY+MATHEMATICS+PHYSICS 1.5 10 0.6
7 DESIGN & TECHNOLOGY+MATHEMATICS+PHYSICS 1.5 13 0.5
8 FURTHER MATHEMATICS+MATHEMATICS+PHYSICS 1.3 6 1.0
9 CHEMISTRY+FURTHER MATHEMATICS+MATHEMATICS+PHYSICS
1.1 3 1.2
10 MATHEMATICS+MUSIC+MUSIC+PHYSICS 1.1 1443 0.0
Table D25: Veterinary Science, Agriculture & related
Rank Combination of A level subjects % Overall
rank Overall %
1 BIOLOGY+CHEMISTRY+MATHEMATICS 17.2 1 4.7
2 BIOLOGY+CHEMISTRY+PHYSICS 5.7 7 0.8
3 BIOLOGY+CHEMISTRY+GEOGRAPHY 4.0 8 0.7
4 BIOLOGY+CHEMISTRY+MATHEMATICS+PHYSICS 3.8 5 1.1
5 BIOLOGY+CHEMISTRY+PSYCHOLOGY 2.7 4 1.1
6 BIOLOGY+CHEMISTRY+ENGLISH LITERATURE 1.9 18 0.4
7 BIOLOGY+CHEMISTRY+HISTORY 1.3 14 0.5
8 BIOLOGY+GEOGRAPHY+PSYCHOLOGY 1.2 38 0.2
9 BIOLOGY+CHEMISTRY+FURTHER MATHEMATICS+MATHEMATICS 1.2 26 0.3
10 BIOLOGY+CHEMISTRY+PHYSICAL EDUCATION 0.9 42 0.2

61