Embed Size (px)
Citation preview
NAME: ________________________ DATE:________________________ MATHS: Higher Level Statistics
Higher Level Maths Statistics
It is not necessary to carry out all the activities contained in this unit. Please see Teachers’ Notes for explanations, additional activities, and tips and suggestions. Theme Higher Level Statistics
Levels A1 – B1
Language focus Key vocabulary, word identification, sentence structure, extracting information from text, writing text, grammar.
Learning focus Using Maths textbooks and accessing curriculum content and learning activities.
Activity types Matching, word identification, structuring sentences and text, cloze, multiple choice, reading comprehension, categorising vocabulary, recording learning, developing a learning resource.
Acknowledgement Extracts from Shortcuts to Success. Maths. Junior Certificate Higher Level. Mark Halpin. Gill & Macmillan.
We gratefully acknowledge Gill & Macmillan for the right to reproduce text in some of these activities.
Learning Record A copy of the Learning Record should be distributed to each student. Students should:
1. Write the subject and topic on the record. 2. Tick off/date the different statements as they complete
activities. 3. Keep the record in their files along with the work produced
for this unit. 4. Use this material to support mainstream subject learning.
© English Language Support Project for Post-Primary schools - www.elsp.ie Trinity Immigration Initiative 2007-2009
1
NAME: ________________________ DATE:________________________ MATHS: Higher Level Statistics
Making the best use of these units • At the beginning of the class, make sure that students understand what
they are doing and why. ‘We are doing the exercise on page (12) to help you to remember key words / to help your writing skills / to help with grammar’ etc.
• You can create your personal teaching resource by printing these units in
full and filing them by subject in a large ring binder. • Encourage students to:
o Bring the relevant subject textbooks to language support class. It does not matter if they have different textbooks as the activities in these units refer to vocabulary and other items that will be found in all subject textbooks. These units are based on curriculum materials.
o Take some responsibility for their own learning programmes by:
Developing a personal dictionary for different subjects, topics, and other categories of language, on an on-going basis. This prompt is a reminder.
Recording what they have learnt on the Learning Record, which should be distributed at the start of each unit.
Keeping their own files with good examples of the work produced in language support for different subjects and topics. This file will be an invaluable learning resource in supporting mainstream learning.
• Don’t forget that many of the activities in these units are suitable as homework tasks, for self-study, or for use in the subject classroom with the agreement of the subject teacher.
Indicates that answers may be found at the end
of the unit.
© English Language Support Project for Post-Primary schools - www.elsp.ie Trinity Immigration Initiative 2007-2009
2
NAME: ________________________ DATE:________________________ MATHS: Higher Level Statistics
Keywords
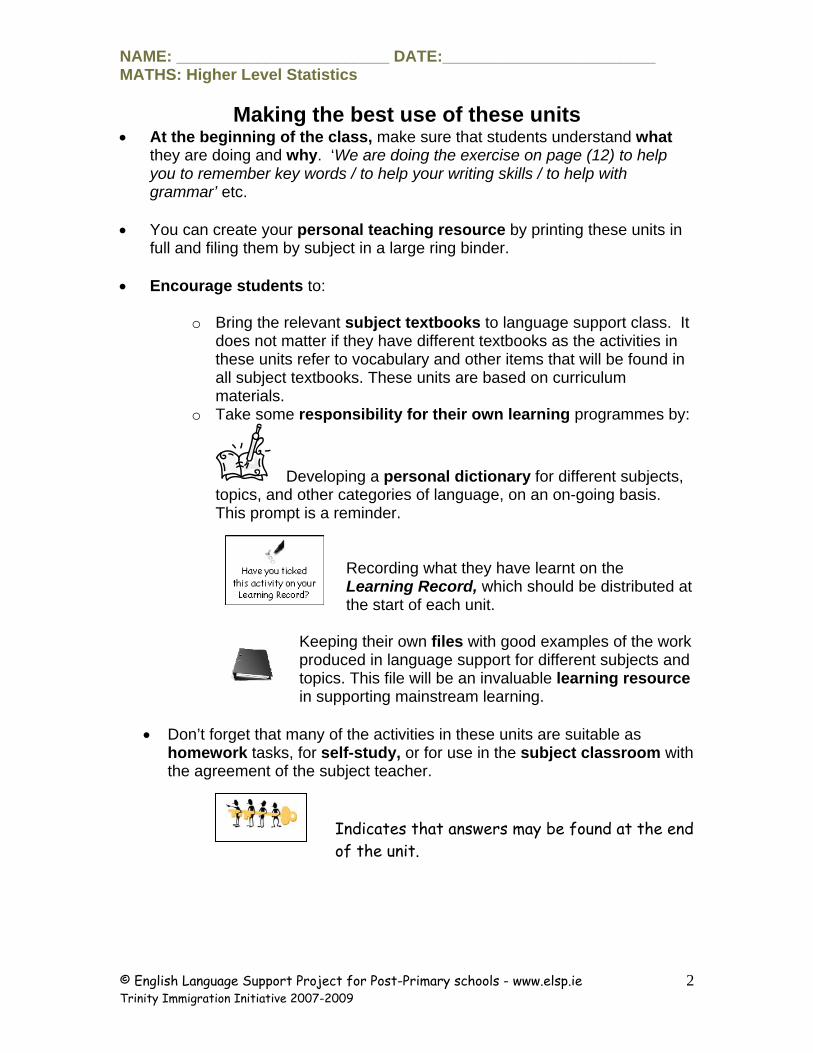
The list of keywords for this unit is as follows
Nouns amount angle area axis bar chart chart class curve data distribution exam/examination fraction frequency frequency distribution table frequency table graph group height histogram information interval mark mean median methods mode number ogive percentage pie chart pupils quartile rectangle result table trend width
Verbs to calculate to group to illustrate to prefer to receive to record to represent to simplify to solve Adjectives above below cumulative curved favourite important interquartile mean modal smallest total Adverb always when Other above definitely hence = so = therefore by means of in terms of in the following example
© English Language Support Project for Post-Primary schools - www.elsp.ie Trinity Immigration Initiative 2007-2009
3
NAME: ________________________ DATE:________________________ MATHS: Higher Level Statistics
Vocabulary file 1 This activity may be done in language support class or in the mainstream subject classroom.
Word
Meaning
Word in my language
total
received
calculate
frequency
illustrate
number
angle
© English Language Support Project for Post-Primary schools - www.elsp.ie Trinity Immigration Initiative 2007-2009
4
NAME: ________________________ DATE:________________________ MATHS: Higher Level Statistics
Vocabulary file 2 This activity may be done in language support class or in the mainstream subject classroom.
Word Meaning Word in my language
amount
mean
method
trend
to represent
percentage
result
Get your teacher to check this and then file it in your folder so you can use it in the future.
© English Language Support Project for Post-Primary schools - www.elsp.ie Trinity Immigration Initiative 2007-2009
5
NAME: ________________________ DATE:________________________ MATHS: Higher Level Statistics
© English Language Support Project for Post-Primary schools - www.elsp.ie Trinity Immigration Initiative 2007-2009
6
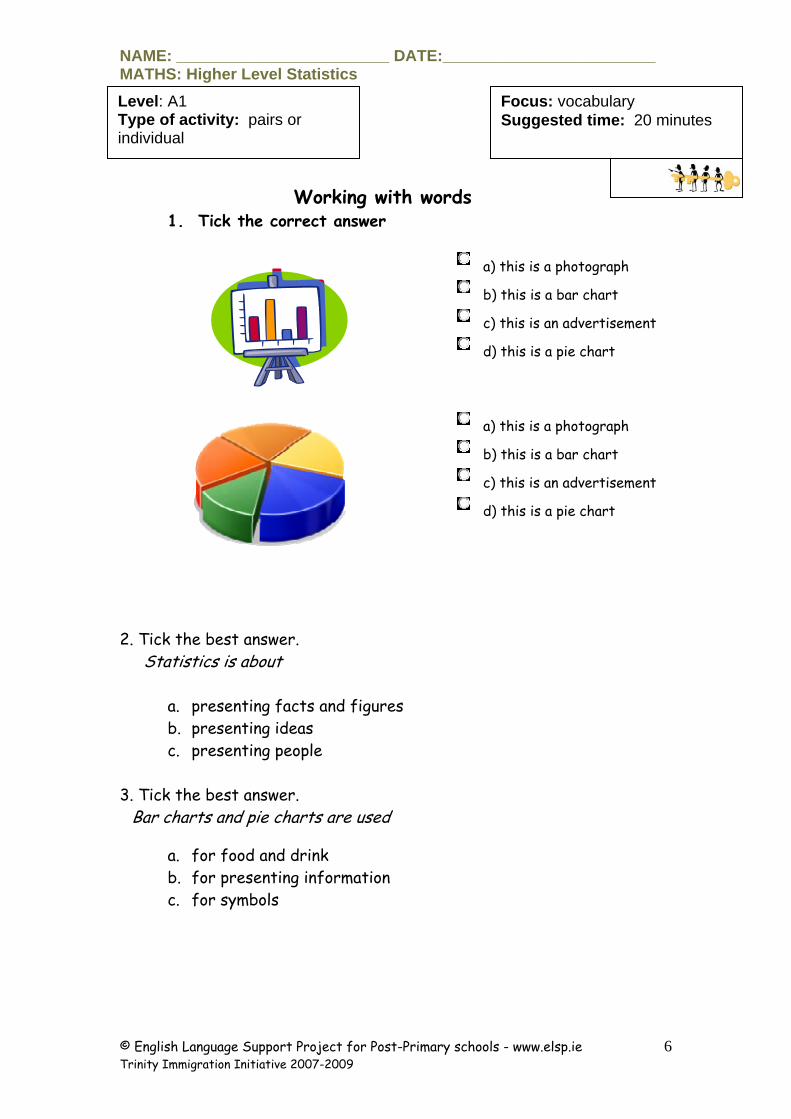
Level: A1 Type of activity: pairs or individual
Focus: vocabulary Suggested time: 20 minutes
Working with words 1. Tick the correct answer
a) this is a photograph
b) this is a bar chart
c) this is an advertisement
d) this is a pie chart
a) this is a photograph
b) this is a bar chart
c) this is an advertisement
d) this is a pie chart
2. Tick the best answer. Statistics is about
a. presenting facts and figures b. presenting ideas c. presenting people
3. Tick the best answer. Bar charts and pie charts are used
a. for food and drink b. for presenting information c. for symbols
NAME: ________________________ DATE:________________________ MATHS: Higher Level Statistics
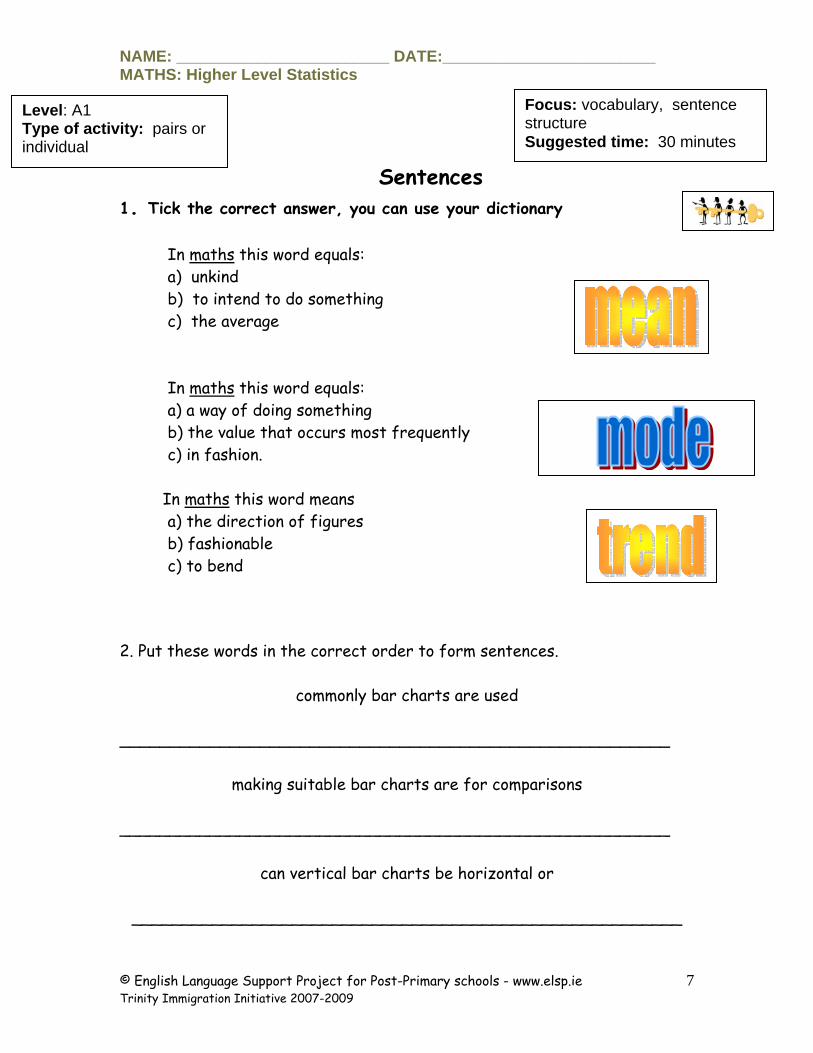
Focus: vocabulary, sentence structure Suggested time: 30 minutes
Level: A1 Type of activity: pairs or individual
Sentences 1. Tick the correct answer, you can use your dictionary In maths this word equals:
a) unkind
b) to intend to do something c) the average In maths this word equals:
a) a way of doing something
b) the value that occurs most frequently c) in fashion. In maths this word means
a) the direction of figures b) fashionable c) to bend
2. Put these words in the correct order to form sentences.
commonly bar charts are used
_______________________________________________________
making suitable bar charts are for comparisons
_______________________________________________________
can vertical bar charts be horizontal or
_______________________________________________________
© English Language Support Project for Post-Primary schools - www.elsp.ie Trinity Immigration Initiative 2007-2009
7
NAME: ________________________ DATE:________________________ MATHS: Higher Level Statistics
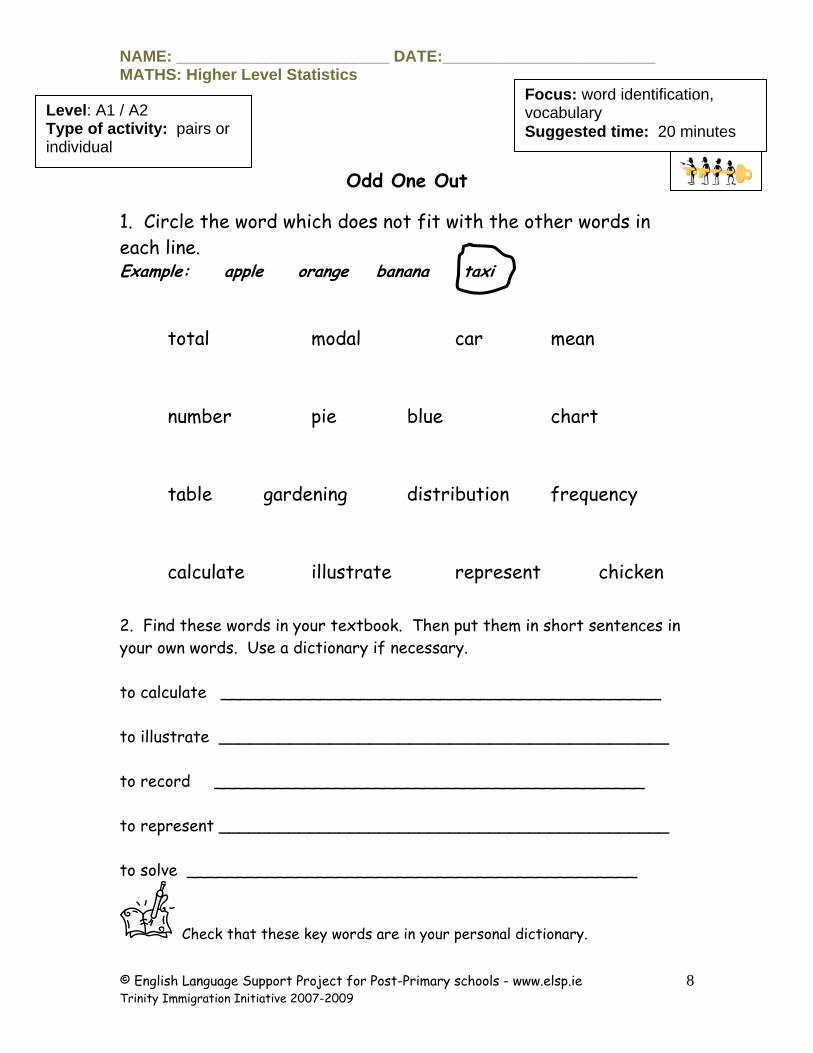
Odd One Out
1. Circle the word which does not fit with the other words in each line. Example: apple orange banana taxi
Focus: word identification, vocabulary Suggested time: 20 minutes
Level: A1 / A2 Type of activity: pairs or individual
total modal car mean number pie blue chart
table gardening distribution frequency
calculate illustrate represent chicken 2. Find these words in your textbook. Then put them in short sentences in your own words. Use a dictionary if necessary. to calculate ____________________________________________
to illustrate _____________________________________________
to record ___________________________________________
to represent _____________________________________________
to solve _____________________________________________
Check that these key words are in your personal dictionary.
© English Language Support Project for Post-Primary schools - www.elsp.ie Trinity Immigration Initiative 2007-2009
8
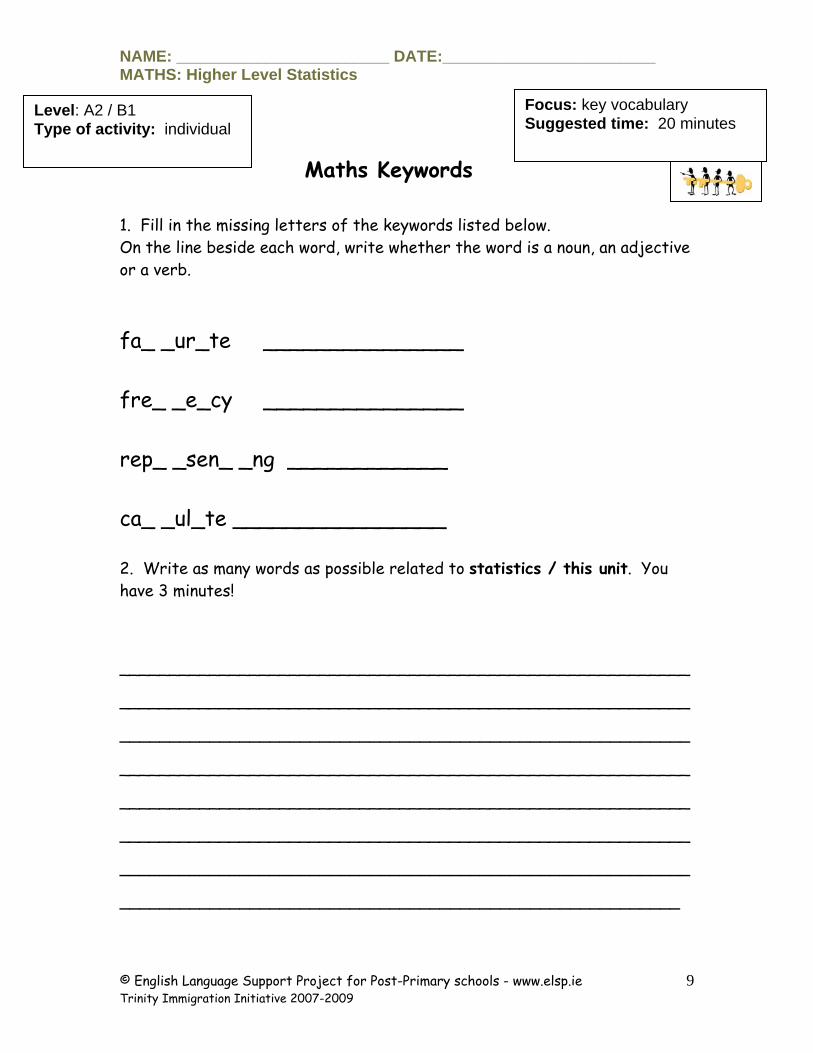
NAME: ________________________ DATE:________________________ MATHS: Higher Level Statistics
Focus: key vocabulary Suggested time: 20 minutes Level: A2 / B1
Type of activity: individual Maths Keywords
1. Fill in the missing letters of the keywords listed below. On the line beside each word, write whether the word is a noun, an adjective or a verb. fa_ _ur_te _______________ fre_ _e_cy _______________
rep_ _sen_ _ng ____________
ca_ _ul_te ________________
2. Write as many words as possible related to statistics / this unit. You have 3 minutes!
_________________________________________________________
_________________________________________________________
_________________________________________________________
_________________________________________________________
_________________________________________________________
_________________________________________________________
_________________________________________________________
________________________________________________________
© English Language Support Project for Post-Primary schools - www.elsp.ie Trinity Immigration Initiative 2007-2009
9
NAME: ________________________ DATE:________________________ MATHS: Higher Level Statistics
Unscramble the letters 1. A part of a number CANTRIFO
Answer __________________
2. The way something is spread out or shared BUTRONITIIDS Answer __________________
3. Explain something using a picture STRILTELUA Answer __________________
4. Something you like best of all VOFAITURE
Answer __________________
Solve the secret code
English= A C E F H I N P R S T U Code= B X Y V G Q K O L D M W
Focus: key vocabulary, spelling Suggested time: 20 minutes
Level: A1 / A2 Type of activity: pairs or individual
example: (code) OLQKXY = PRINCE (English)
OQY XGBLMD BLY VWK! =
_______________________________________
© English Language Support Project for Post-Primary schools - www.elsp.ie Trinity Immigration Initiative 2007-2009
10
NAME: ________________________ DATE:________________________ MATHS: Higher Level Statistics
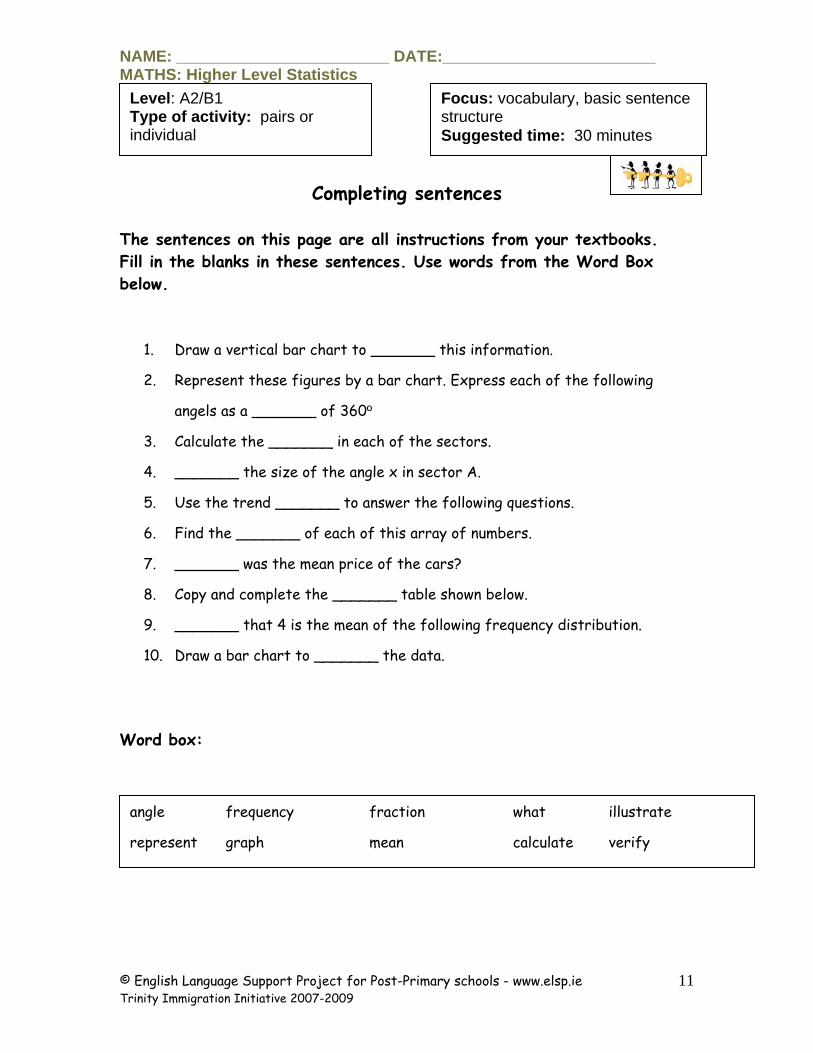
Level: A2/B1 Type of activity: pairs or individual
Completing sentences
Focus: vocabulary, basic sentence structure Suggested time: 30 minutes
The sentences on this page are all instructions from your textbooks. Fill in the blanks in these sentences. Use words from the Word Box below.
1. Draw a vertical bar chart to _______ this information.
2. Represent these figures by a bar chart. Express each of the following
angels as a _______ of 360º
3. Calculate the _______ in each of the sectors.
4. _______ the size of the angle x in sector A.
5. Use the trend _______ to answer the following questions.
6. Find the _______ of each of this array of numbers.
7. _______ was the mean price of the cars?
8. Copy and complete the _______ table shown below.
9. _______ that 4 is the mean of the following frequency distribution.
10. Draw a bar chart to _______ the data.
Word box:
angle frequency fraction what illustrate
represent graph mean calculate verify
© English Language Support Project for Post-Primary schools - www.elsp.ie Trinity Immigration Initiative 2007-2009
11
NAME: ________________________ DATE:________________________ MATHS: Higher Level Statistics
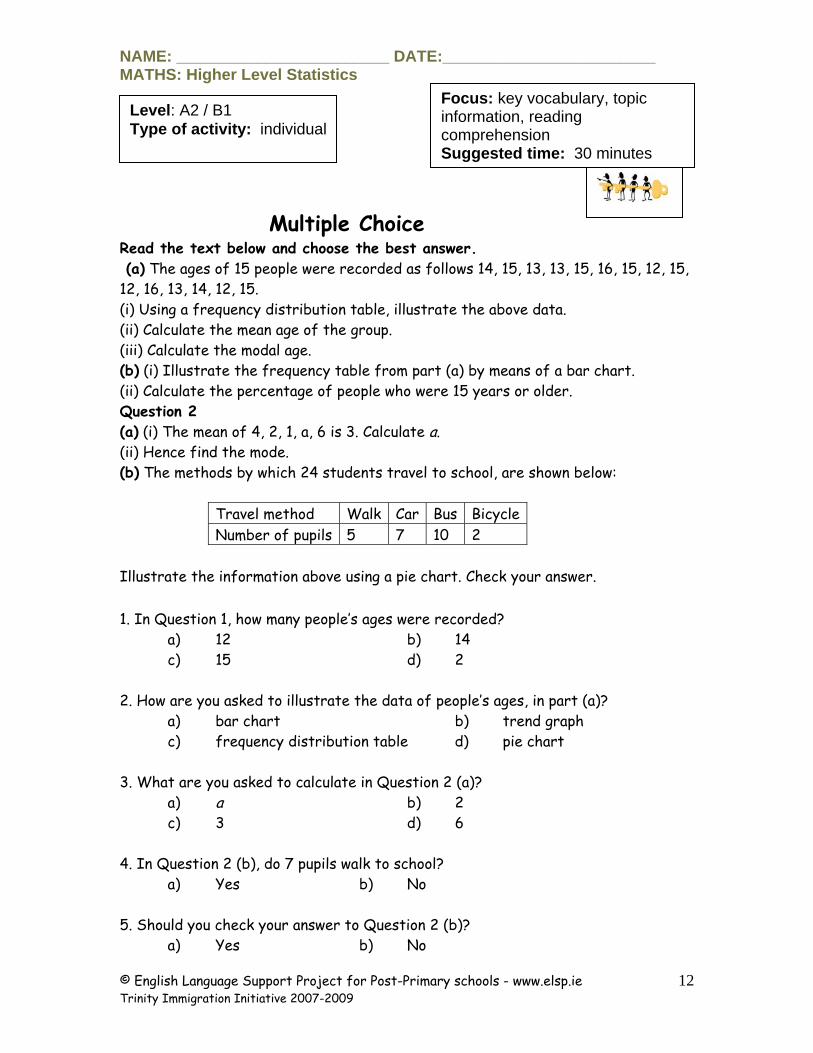
Multiple Choice
Focus: key vocabulary, topic information, reading comprehension Suggested time: 30 minutes
Level: A2 / B1 Type of activity: individual
Read the text below and choose the best answer. (a) The ages of 15 people were recorded as follows 14, 15, 13, 13, 15, 16, 15, 12, 15, 12, 16, 13, 14, 12, 15. (i) Using a frequency distribution table, illustrate the above data. (ii) Calculate the mean age of the group. (iii) Calculate the modal age. (b) (i) Illustrate the frequency table from part (a) by means of a bar chart. (ii) Calculate the percentage of people who were 15 years or older. Question 2 (a) (i) The mean of 4, 2, 1, a, 6 is 3. Calculate a. (ii) Hence find the mode. (b) The methods by which 24 students travel to school, are shown below:
Travel method Walk Car Bus Bicycle Number of pupils 5 7 10 2
Illustrate the information above using a pie chart. Check your answer. 1. In Question 1, how many people’s ages were recorded?
a) 12 b) 14 c) 15 d) 2
2. How are you asked to illustrate the data of people’s ages, in part (a)? a) bar chart b) trend graph c) frequency distribution table d) pie chart
3. What are you asked to calculate in Question 2 (a)? a) a b) 2 c) 3 d) 6
4. In Question 2 (b), do 7 pupils walk to school?
a) Yes b) No
5. Should you check your answer to Question 2 (b)? a) Yes b) No
© English Language Support Project for Post-Primary schools - www.elsp.ie Trinity Immigration Initiative 2007-2009
12
NAME: ________________________ DATE:________________________ MATHS: Higher Level Statistics
Level: A2/B1 Type of activity: individual and pairs
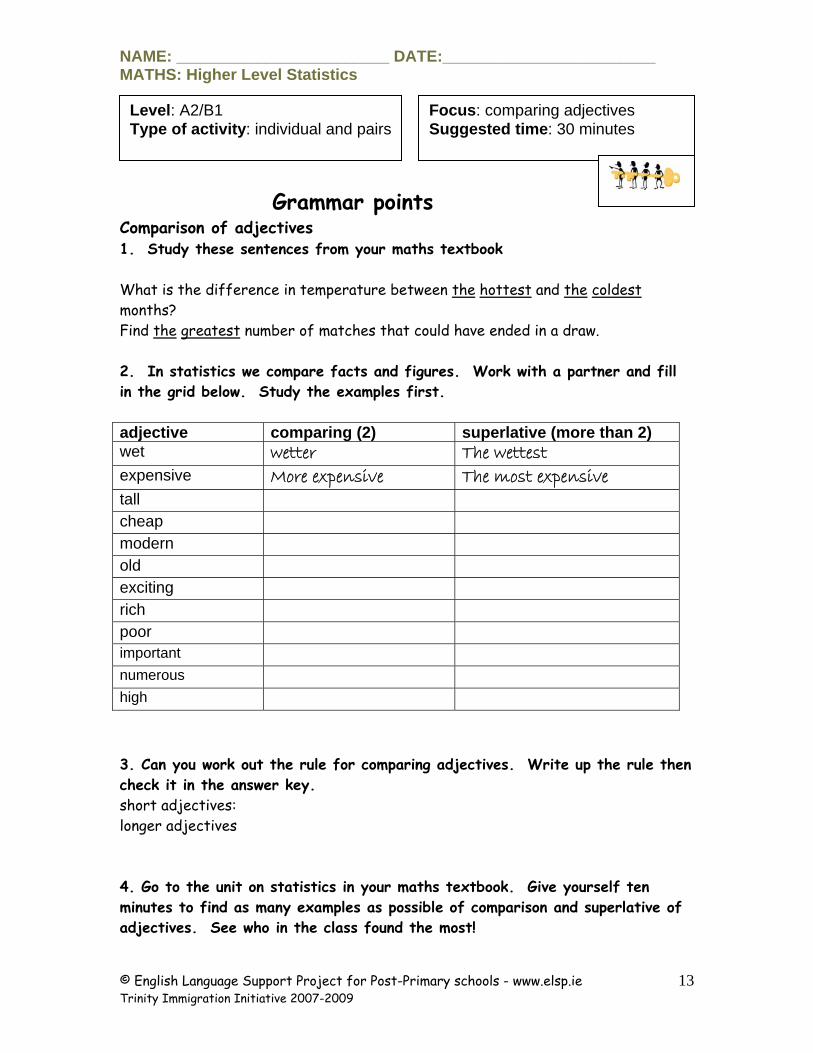
Grammar points
Focus: comparing adjectives Suggested time: 30 minutes
Comparison of adjectives 1. Study these sentences from your maths textbook What is the difference in temperature between the hottest and the coldest months? Find the greatest number of matches that could have ended in a draw. 2. In statistics we compare facts and figures. Work with a partner and fill in the grid below. Study the examples first. adjective comparing (2) superlative (more than 2) wet wetter The wettest expensive More expensive The most expensive tall cheap modern old exciting rich poor important numerous high 3. Can you work out the rule for comparing adjectives. Write up the rule then check it in the answer key. short adjectives: longer adjectives 4. Go to the unit on statistics in your maths textbook. Give yourself ten minutes to find as many examples as possible of comparison and superlative of adjectives. See who in the class found the most!
© English Language Support Project for Post-Primary schools - www.elsp.ie Trinity Immigration Initiative 2007-2009
13
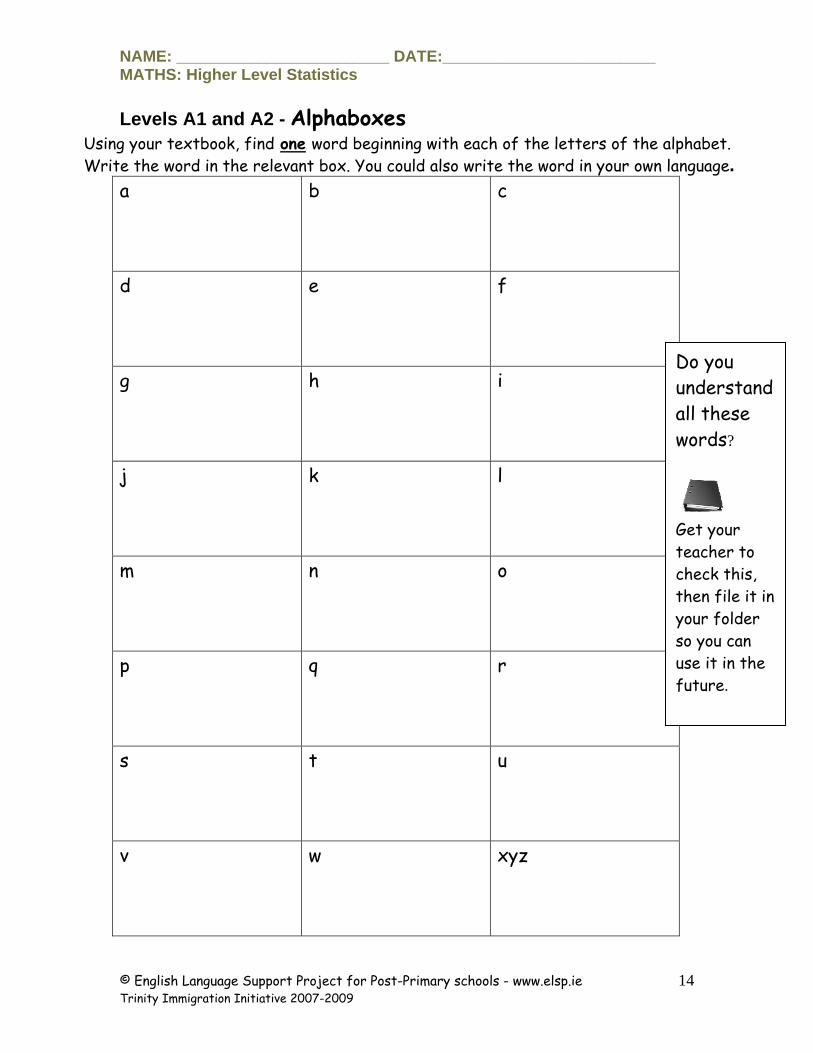
NAME: ________________________ DATE:________________________ MATHS: Higher Level Statistics
Levels A1 and A2 - Alphaboxes Using your textbook, find UoneU word beginning with each of the letters of the alphabet. Write the word in the relevant box. You could also write the word in your own language.
a b c
d e f
g h i
j k l
m n o
p q r
s t u
v w xyz
Do you understand all these words?
Get your teacher to check this, then file it in your folder so you can use it in the future.
© English Language Support Project for Post-Primary schools - www.elsp.ie Trinity Immigration Initiative 2007-2009
14
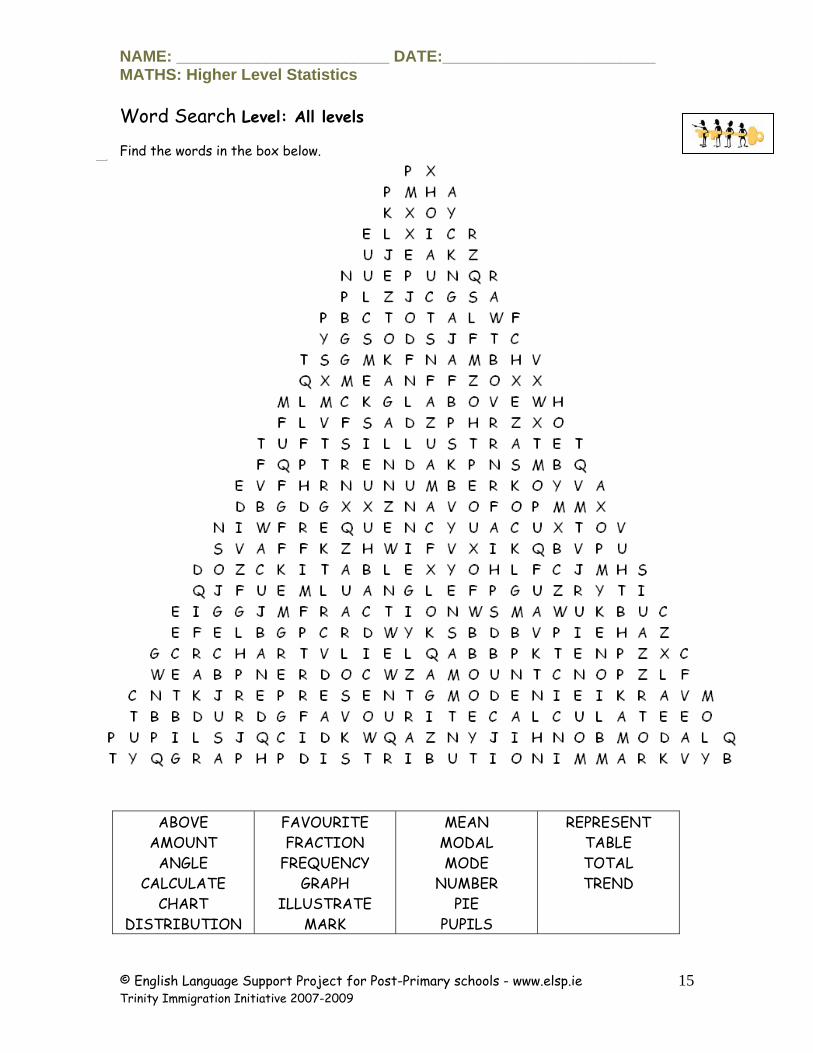
NAME: ________________________ DATE:________________________ MATHS: Higher Level Statistics Word Search Level: All levels
Find the words in the box below.
ABOVE AMOUNT
ANGLE CALCULATE
CHART DISTRIBUTION
FAVOURITE FRACTION
FREQUENCY GRAPH
ILLUSTRATE MARK
MEAN MODAL MODE
NUMBER PIE
PUPILS
REPRESENT TABLE TOTAL TREND
© English Language Support Project for Post-Primary schools - www.elsp.ie Trinity Immigration Initiative 2007-2009
15
NAME: ________________________ DATE:________________________ MATHS: Higher Level Statistics
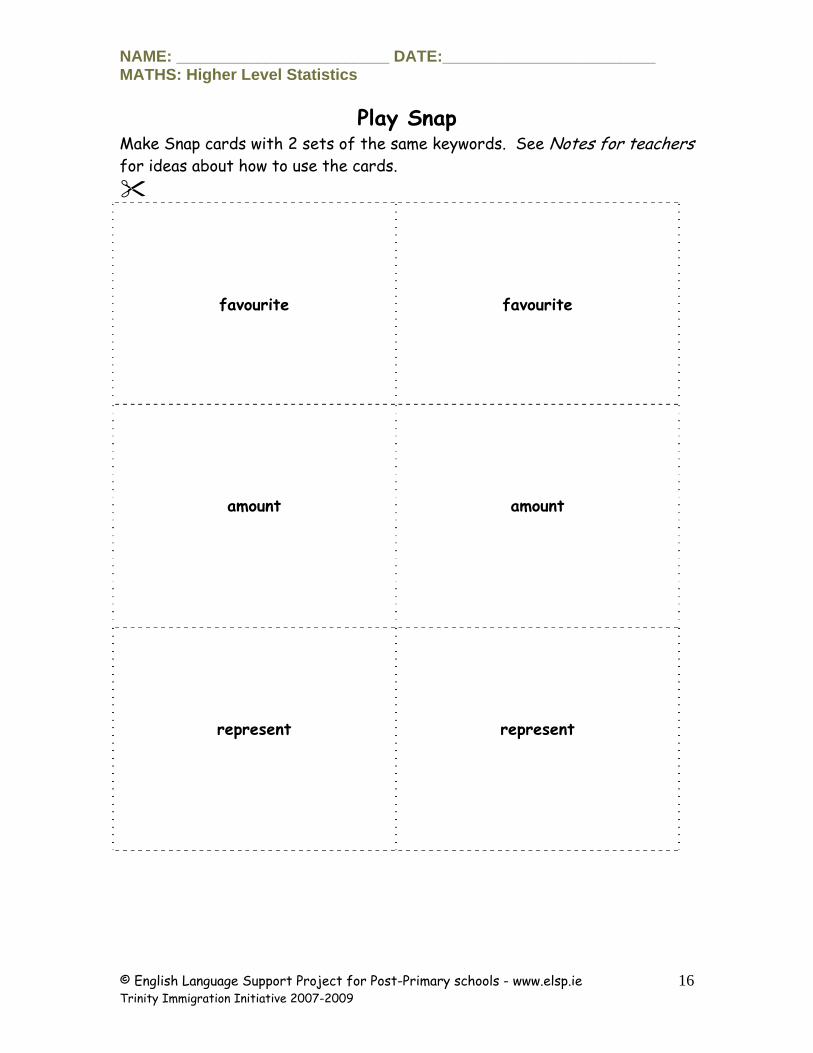
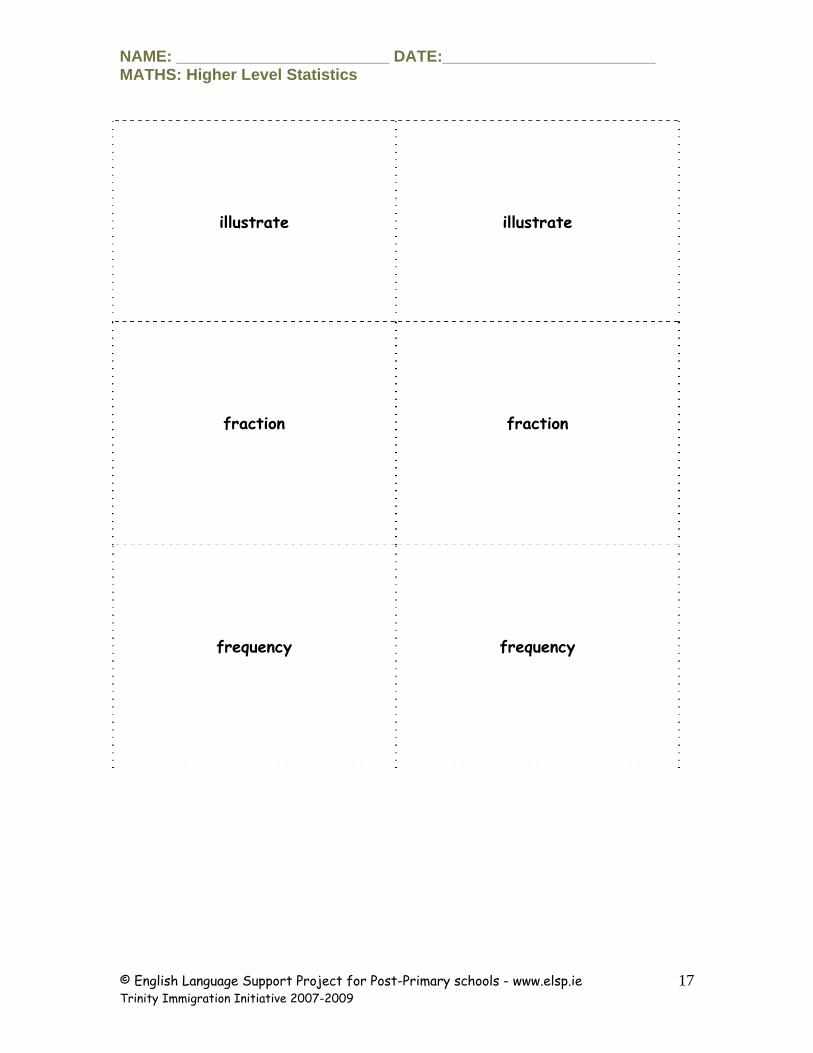
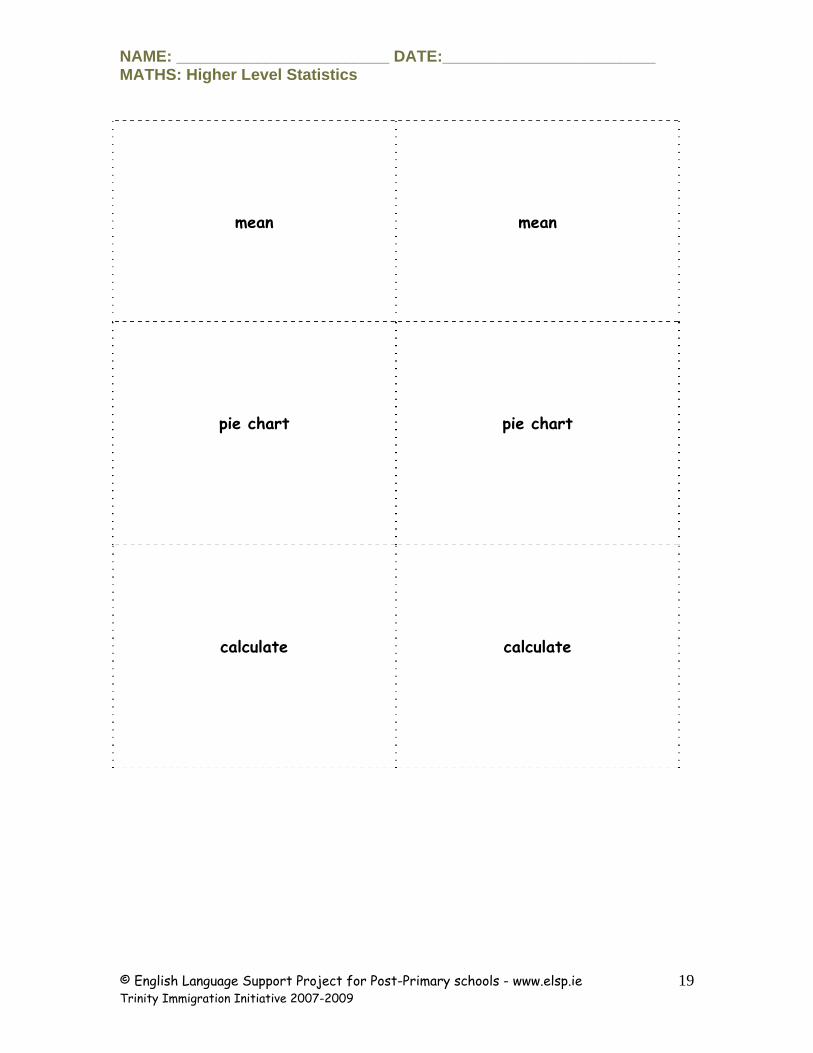
Play Snap Make Snap cards with 2 sets of the same keywords. See Notes for teachers for ideas about how to use the cards.
favourite
favourite
amount
amount
represent
represent
© English Language Support Project for Post-Primary schools - www.elsp.ie Trinity Immigration Initiative 2007-2009
16
NAME: ________________________ DATE:________________________ MATHS: Higher Level Statistics
illustrate
illustrate
fraction
fraction
frequency
frequency
© English Language Support Project for Post-Primary schools - www.elsp.ie Trinity Immigration Initiative 2007-2009
17

NAME: ________________________ DATE:________________________ MATHS: Higher Level Statistics
graph
graph
number
number
total
total
© English Language Support Project for Post-Primary schools - www.elsp.ie Trinity Immigration Initiative 2007-2009
18
NAME: ________________________ DATE:________________________ MATHS: Higher Level Statistics
mean
mean
pie chart
pie chart
calculate
calculate
© English Language Support Project for Post-Primary schools - www.elsp.ie Trinity Immigration Initiative 2007-2009
19
NAME: ________________________ DATE:________________________ MATHS: Higher Level Statistics
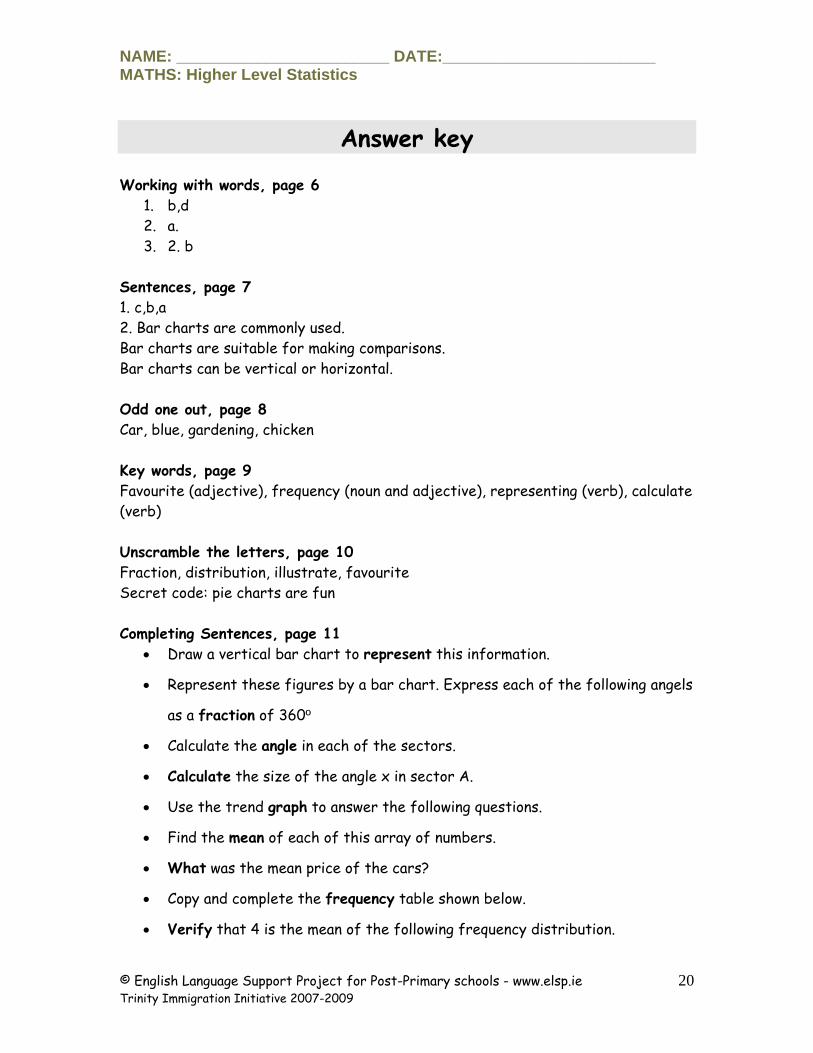
Answer key Working with words, page 6
1. b,d 2. a. 3. 2. b
Sentences, page 7 1. c,b,a 2. Bar charts are commonly used. Bar charts are suitable for making comparisons. Bar charts can be vertical or horizontal. Odd one out, page 8 Car, blue, gardening, chicken Key words, page 9 Favourite (adjective), frequency (noun and adjective), representing (verb), calculate (verb) Unscramble the letters, page 10 Fraction, distribution, illustrate, favourite Secret code: pie charts are fun Completing Sentences, page 11
• Draw a vertical bar chart to represent this information.
• Represent these figures by a bar chart. Express each of the following angels
as a fraction of 360º
• Calculate the angle in each of the sectors.
• Calculate the size of the angle x in sector A.
• Use the trend graph to answer the following questions.
• Find the mean of each of this array of numbers.
• What was the mean price of the cars?
• Copy and complete the frequency table shown below.
• Verify that 4 is the mean of the following frequency distribution.
© English Language Support Project for Post-Primary schools - www.elsp.ie Trinity Immigration Initiative 2007-2009
20
NAME: ________________________ DATE:________________________ MATHS: Higher Level Statistics
• Draw a bar chart to illustrate the data.
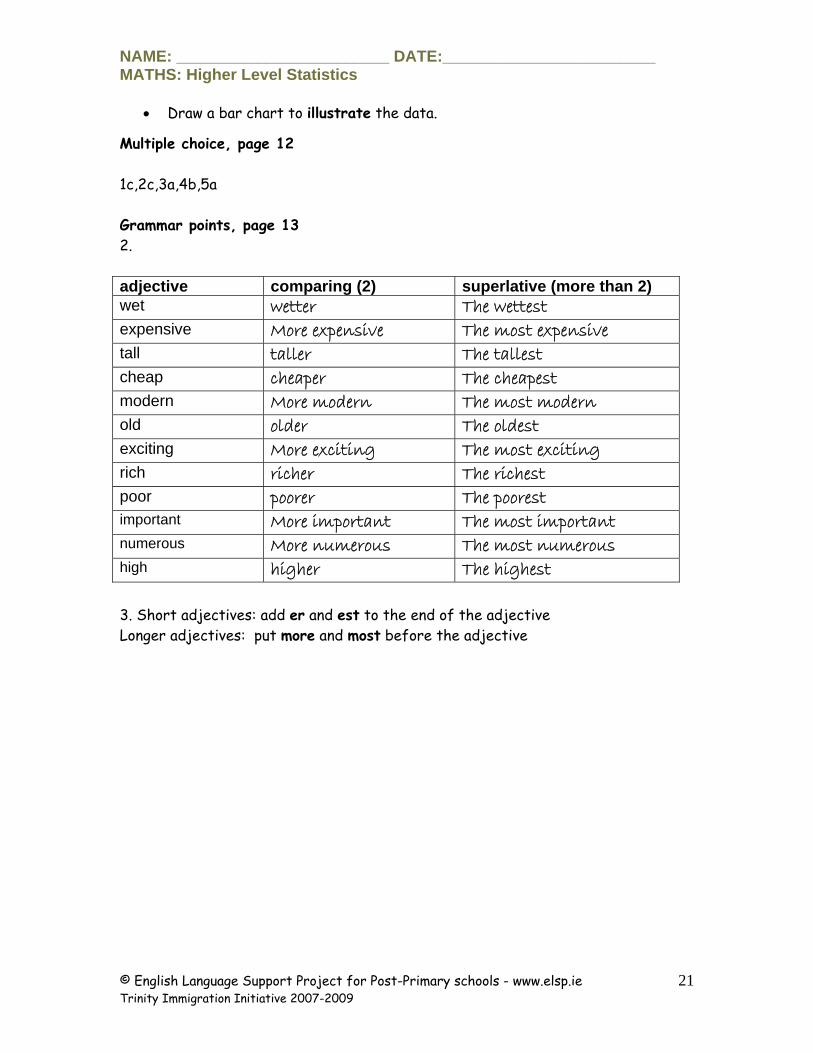
Multiple choice, page 12 1c,2c,3a,4b,5a Grammar points, page 13 2. adjective comparing (2) superlative (more than 2) wet wetter The wettest expensive More expensive The most expensive tall taller The tallest cheap cheaper The cheapest modern More modern The most modern old older The oldest exciting More exciting The most exciting rich richer The richest poor poorer The poorest important More important The most important numerous More numerous The most numerous high higher The highest
3. Short adjectives: add er and est to the end of the adjective Longer adjectives: put more and most before the adjective
© English Language Support Project for Post-Primary schools - www.elsp.ie Trinity Immigration Initiative 2007-2009
21
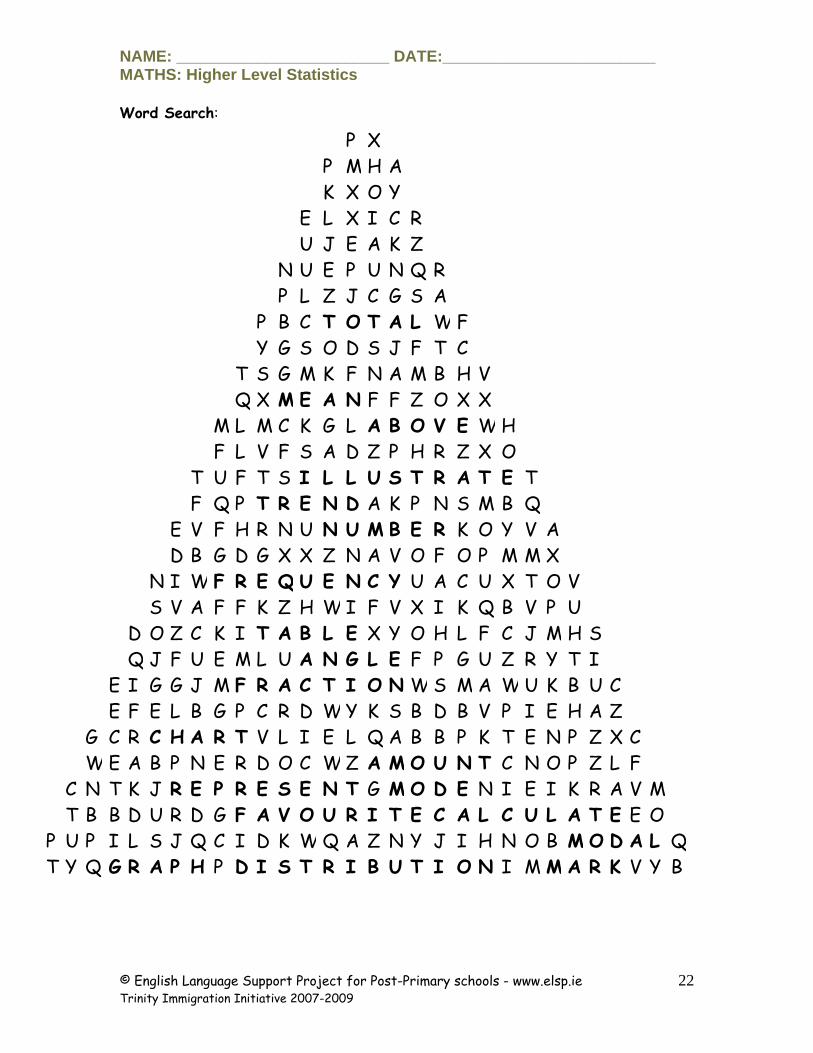
NAME: ________________________ DATE:________________________ MATHS: Higher Level Statistics Word Search:
P X P M H A K X O Y E L X I C R U J E A K Z N U E P U N Q R P L Z J C G S A P B C T O T A L W F Y G S O D S J F T C T S G M K F N A M B H V Q X M E A N F F Z O X X M L M C K G L A B O V E W H F L V F S A D Z P H R Z X O T U F T S I L L U S T R A T E T F Q P T R E N D A K P N S M B Q E V F H R N U N U M B E R K O Y V A D B G D G X X Z N A V O F O P M M X N I W F R E Q U E N C Y U A C U X T O V S V A F F K Z H W I F V X I K Q B V P U D O Z C K I T A B L E X Y O H L F C J M H S Q J F U E M L U A N G L E F P G U Z R Y T I E I G G J M F R A C T I O N W S M A W U K B U C E F E L B G P C R D W Y K S B D B V P I E H A Z G C R C H A R T V L I E L Q A B B P K T E N P Z X C W E A B P N E R D O C W Z A M O U N T C N O P Z L F C N T K J R E P R E S E N T G M O D E N I E I K R A V M T B B D U R D G F A V O U R I T E C A L C U L A T E E O P U P I L S J Q C I D K W Q A Z N Y J I H N O B M O D A L QT Y Q G R A P H P D I S T R I B U T I O N I M M A R K V Y B
© English Language Support Project for Post-Primary schools - www.elsp.ie Trinity Immigration Initiative 2007-2009
22