Embed Size (px)
Citation preview

This is an Open Access Creative Commons version of an article that appears in:
PHYSICS IN MEDICINE & BIOLOGY
The internet address for this paper is: https://publications.icr.ac.uk/14797/
Please direct all emails to: [email protected] Institute of Cancer Research Repository https://publications.icr.ac.uk
Published text:
E Kousi, M Borri, et al (2016), Quality assurance in MRI breast screening: comparing signal-to-noise ratio in dynamic contrast-enhanced imaging protocols, Physics in Medicine & Biology, Vol. 61(1), 37-49

This content has been downloaded from IOPscience. Please scroll down to see the full text.
Download details:
IP Address: 193.62.218.79
This content was downloaded on 23/02/2016 at 09:55
Please note that terms and conditions apply.
Quality assurance in MRI breast screening: comparing signal-to-noise ratio in dynamic
contrast-enhanced imaging protocols
View the table of contents for this issue, or go to the journal homepage for more
2016 Phys. Med. Biol. 61 37
(http://iopscience.iop.org/0031-9155/61/1/37)
Home Search Collections Journals About Contact us My IOPscience

37
Physics in Medicine & Biology
Quality assurance in MRI breast screening: comparing signal-to-noise ratio in dynamic contrast-enhanced imaging protocols
Evanthia Kousi, Marco Borri, Jamie Dean, Rafal Panek, Erica Scurr, Martin O Leach and Maria A Schmidt
CR-UK and EPSRC Imaging Centre, Royal Marsden NHS Foundation Trust and Institute of Cancer Research, Sutton, Surrey, SM2 5PT, UK
E-mail: [email protected], [email protected], [email protected], [email protected], [email protected], [email protected] and [email protected]
Received 15 June 2015, revised 14 September 2015Accepted for publication 26 October 2015Published 25 November 2015
AbstractMRI has been extensively used in breast cancer staging, management and high risk screening. Detection sensitivity is paramount in breast screening, but variations of signal-to-noise ratio (SNR) as a function of position are often overlooked. We propose and demonstrate practical methods to assess spatial SNR variations in dynamic contrast-enhanced (DCE) breast examinations and apply those methods to different protocols and systems.
Four different protocols in three different MRI systems (1.5 and 3.0 T) with receiver coils of different design were employed on oil-filled test objects with and without uniformity filters. Twenty 3D datasets were acquired with each protocol; each dataset was acquired in under 60 s, thus complying with current breast DCE guidelines. In addition to the standard SNR calculated on a pixel-by-pixel basis, we propose other regional indices considering the mean and standard deviation of the signal over a small sub-region centred on each pixel. These regional indices include effects of the spatial variation of coil sensitivity and other structured artefacts.
The proposed regional SNR indices demonstrate spatial variations in SNR as well as the presence of artefacts and sensitivity variations, which are otherwise difficult to quantify and might be overlooked in a clinical setting. Spatial variations in SNR depend on protocol choice and hardware characteristics. The use of uniformity filters was shown to lead to a rise of
E Kousi et al
Printed in the UK
37
PHMBA7
© 2016 Institute of Physics and Engineering in Medicine
2016
61
Phys. Med. Biol.
PMB
0031-9155
10.1088/0031-9155/61/1/37
Papers
1
37
49
Physics in Medicine & Biology
Institute of Physics and Engineering in Medicine
IOP
Content from this work may be used under the terms of the Creative Commons Attribution 3.0 licence. Any further distribution of this work must maintain attribution to the author(s) and the title of the work, journal citation and DOI.
0031-9155/16/010037+13$33.00 © 2016 Institute of Physics and Engineering in Medicine Printed in the UK
Phys. Med. Biol. 61 (2016) 37–49 doi:10.1088/0031-9155/61/1/37

38
SNR values, altering the noise distribution. Correlation between noise in adjacent pixels was associated with data truncation along the phase encoding direction.
Methods to characterise spatial SNR variations using regional information were demonstrated, with implications for quality assurance in breast screening and multi-centre trials.
Keywords: MRI, quality assurance, breast, DCE-MRI, SNR
(Some figures may appear in colour only in the online journal)
Introduction
Magnetic resonance imaging (MRI) has been extensively used in breast cancer staging, management and high risk screening (DeMartini et al 2008, Morrow et al 2011). Current American and European radiology guidelines recommended MRI for screening women at high risk of developing breast cancer due to its high sensitivity compared to x-ray mammog-raphy (National Institute for Health and Clinical Excellence 2006, Saslow et al 2007, Calonge et al 2009, Lee et al 2010). Breast MRI protocols include anatomical T1 and T2 weighted imaging and dynamic contrast enhanced (DCE) MRI (American College of Radiology 2003, Clayton 2012) with analysis and classification of the time-signal intensity curve to character-ise the pattern of uptake and washout of paramagnetic contrast agents (Eyal and Degani 2009). There is a clear need for quality assurance (QA) in screening programmes for surveillance of women at high risk of developing breast cancer. In the UK the National Health Service Breast Screening Programme (NHSBSP) recommend weekly testing of signal-to-noise ratio (SNR) and water/fat suppression effectiveness, using techniques that are sensitive to individual coil element failures (Clayton et al 2012).
Traditional SNR measurements do not provide information on spatial variations of SNR (Price et al 1990, Gudbjartsson and Patz 1995, Lerski et al 1998, Ihalainen et al 2011), and presume the noise distribution is approximately Gaussian or Ricean (Gudbjartsson and Patz 1995) to calculate a figure that relates to a region of interest. Current MRI techniques, in contrast, make use of phased-array coils, parallel imaging techniques and uniformity filters (Pruessmann et al 1999, Griswold et al 2002, Lin et al 2004). Correlation between the noise measured with different phased array elements has been demonstrated (Constantinides et al 1997) and, in addition, parallel imaging techniques were shown to affect noise distribution (Dietrich et al 2007). SNR is thus expected to be position dependent, and dependent on pulse sequence parameters. It is therefore desirable to characterise SNR over the entire volume occu-pied by the breasts within the coil, for the pulse sequences employed in DCE examinations.
Mapping SNR as a function of position is most common in neurology applications, as the fast imaging sequences enable the acquisition of a large number of images within a short period. Several authors propose processing the ratio of mean and standard deviation of image intensity for each voxel to provide SNR maps (Price et al 1990, Chen et al 2004, Friedman and Glover 2006). SNR is thus characterised using specific sequences employed clinically, and the results have direct relevance to those applications. This approach is most informative if a large enough number of images is used to characterise the noise distribution. However, high resolution 3D datasets are acquired in approximately 1 min for breast DCE (Clayton et al 2012), and it is not practical to acquire more than 20–30 datasets for QA purposes. Other alternative approaches require access to raw data and reconstruction algorithms, and therefore their use is not widespread (Robson et al 2008).
E Kousi et alPhys. Med. Biol. 61 (2016) 37

39
There is considerable discussion within the literature on the merits of different approaches to developing breast DCE protocols to comply with breast screening guidelines while ensuring cor-rect assessment of contrast agent uptake curves (Fan et al 2007, Schabel and Parker 2008, Jansen et al 2009, De Naeyer et al 2011, Freed 2012, Ledger et al 2014); in this discussion, the SNR dependency on position is often overlooked. This article proposes practical methods to charac-terise the spatial variation of SNR in breast DCE protocols, considering the hardware (breast coil and receiver chain) in conjunction with the chosen pulse sequence. These methods were applied to different systems and protocols used within our institution, with breast coils of dif-ferent designs, and employed to investigate patterns of SNR variation as a function of position.
Methods
Data acquisition
Over the past three years, our institution has performed breast MRI examinations both at 1.5 T (Siemens MAGNETOM Avanto, Siemens MAGNETOM Aera) and 3.0 T (Siemens MAGNETOM Skyra), employing dedicated breast coils of different design (4 to 18 element arrays). In this article we employ data from these systems to propose and demonstrate QA methods for general use; the hardware is not described in detail because methodological devel-opments are our main concern. All DCE protocols employ 3D, fat-suppressed, spoiled gradient-echo pulse sequences, with readout gradient in the anterior/posterior direction in a transaxial volume. Fat-suppression is attained using the SPAIR (SPectral Attenuated Inversion-Recovery) technique. All protocols use parallel imaging techniques with at least an acceleration factor of two (left/right direction). All protocols employ truncation of the data matrix, and/or partial Fourier acquisitions to acquire a complete high-resolution 3D dataset within 1 min, thus com-plying with current breast DCE guidelines (Clayton et al 2012). Basic protocol characteristics are shown in table 1. No view sharing techniques were employed in any protocol.
In order to compare breast DCE examinations, all protocols were employed to scan two uniform oil-filled cylindrical test objects. Quantitative SNR measurements were undertaken on iso-paraffinic oil (Bayol 35 Oil, 11 cm diameter test object) of T1 165 ms and 220 ms at 1.5 T and 3.0 T, respectively. Those T1 values are comparable to an enhancing lesion, following an injection of a single dose of contrast agent (Cron et al 2004). Bottles were strapped to the coil and patient couch to minimise mechanical vibration and left in place for at least 30 min prior to measure-ments. For each DCE examination 20 separate 3D datasets were acquired within 20 min. Fat sup-pression was disabled by setting the SPAIR RF power to zero for all test object scans. Disabling fat suppression did not affect the timing of the DCE sequences used. Images were acquired with and without the uniformity filter provided by the manufacturer, which is employed in all clinical examinations to reduce image intensity variations associated with coil sensitivity. The resulting set of images was processed off-line using in-house software (IDL 8.2, Boulder, USA).
In addition, a single volunteer was scanned in each system and a single dataset was acquired using the DCE sequence, without administration of contrast agent, with written consent and approval from the Local Ethics Committee. Automated shimming and measurement prepara-tion was employed in all systems for this evaluation to reduce any potential operator depend-ency when images were compared.
Data analysis
In this study each combination of coil and DCE protocol is characterised by a 4D dataset A(i, j, k, t), where t corresponds to the different time points ranging from 0 to T-1, and A is the image
E Kousi et alPhys. Med. Biol. 61 (2016) 37

40
intensity for each position (i, j, k) in a 3D dataset. T corresponds to the total number of the datasets obtained. A calculation of the ratio of the mean signal to the mean standard deviation for each pixel produces a basic 3D map of SNR as a function of position (Price et al 1990, Lerski et al 1998), here referred to as SNR0:
x y zA x y z
x y zSNR , ,
, ,
, ,,
A0( ) ( )
( )σ= (1a)
where
A x y zT
A x y z t, ,1
, , ,t
T
0
1
( ) ( )∑==
−
(1b)
and
x y zT
A x y z t A x y z, ,1
1, , , , , .A
t
T
0
12
2( )( )
( ( ) ( )) ∑σ =−
−=
−
(1c)
We have limited the QA procedure to a 20 min data acquisition (i.e. T = 20). In this arti-cle we propose practical methods to produce position dependent SNR maps using regional information, considering that 20 time points may not fully characterise the noise distribution for each voxel. For each voxel at given co-ordinates (x, y, z) we propose to make use of the statistical properties of the data contained within a 3D sub-region of dimensions X, Y, Z, in all T datasets.
Table 1. Acquisition parameters of the different breast protocols.
Scanner
System I System II System III System III
Protocol I Protocol II Protocol IIIa Protocol IIIb
Field strength (T) 1.5 1.5 3 3TR (ms) 4.5 4.99 5.07 5.07TE (ms) 2 2.25 1.68 1.69Acquisition Time (s) 56 60 58 53Flip angle (°) 18 18 18 18Number of slices 160 160 160 160Pixel size (mm2) 1.31 × 1.31 1.31 × 1.31 0.88 × 0.88 0.94 × 0.94Slice thickness (mm) 1 1 1 1Reconstruction matrix (A/P × L/R)
320 × 290 320 × 290 384 × 326 384 × 326
Acquistion matrix (A/P × L/R) 320 × 218 320 × 218 384 × 280 384 × 329Bandwidth (Hz/px) 390 319 385 385Phase and slice partial Fourier 6/8 and 6/8 6/8 and 6/8 7/8 and 6/8 7/8 and 6/8Parallel imaging factor 2 2 3 3Parallel imaging direction L/R GRAPPA L/R GRAPPA L/R GRAPPA L/R CAIPICoil description Biopsy-
Compatible coil with adjustable coil geometry
1st generation dedicated breast coil
Breast coil with rigid coil geometry
Breast coil with rigid coil geometry
Number of coil elements 8 4 18 18
E Kousi et alPhys. Med. Biol. 61 (2016) 37

41
For this purpose we define the set of images B(x, y, z, t) by subtracting the mean image intensity at each location:
B x y z t A x y z t A x y z, , , , , , , ,( ) ( ) ( )= − (2)
and define two additional SNR maps, SNRR and SNRA:
x y zA x y z
x y zSNR , ,
, ,
, ,r
RBr
( )( )( )σ
= (3)
and
( ) ( )( )σ
=x y zA x y z
x y zSNR , ,
, ,
, ,,r
AAr
(4)
where
A x y zXYZT
A i j k t, ,1
, , , ,r
t
T
i x
x X
j y
y Y
k z
z Z
0
1 1 1 1
( ) ( )∑ ∑ ∑ ∑==
−
=
+ −
=
+ −
=
+ −
(5a)
x y zXYZT
A i j k t A x y z, ,1
1, , , , , ,
t
T
i x
x X
j y
y Y
k z
z Z
rAr
0
1 1 1 12
2( )( )
( ( ) ( )) ∑ ∑ ∑ ∑σ =−
−=
−
=
+ −
=
+ −
=
+ −
(5b)
x y zXYZT
B i j k t B x y z, ,1
1, , , , , ,
t
T
i x
x X
j y
y Y
k z
z Z
rBr
0
1 1 1 1
22( )
( )( ( ) ( )) ∑ ∑ ∑ ∑σ =
−−
=
−
=
+ −
=
+ −
=
+ −
(5c)and
B x y zXYZT
B i j k t, ,1
, , , 0.r
t
T
i x
x X
j y
y Y
k z
z Z
0
1 1 1 1
( ) ( )∑ ∑ ∑ ∑= ==
−
=
+ −
=
+ −
=
+ −
(5d )
Ar and Br are the mean values of the functions A and B within the local sub-region, and Arσ , Brσ are the standard deviation values for the non-subtracted (A) and the subtracted (B) data-
sets, respectively. We propose that SNRR will provide a better description of the variation of SNR as a function of position than SNR0, for relatively small 3D sub-regions (low values of X, Y, Z ), as the local noise distribution will be characterised by a larger number of pixels. In effect, a box function of dimensions X, Y and Z is employed as a kernel—thus allowing a trade-off between higher spatial resolution in SNR maps and adequate noise characterisation. We employ sub-regions containing at least 6 voxels (2 × 3 × 1) to ensure that at least 120 points are used to characterise the noise distribution at each location (for T = 20). In contrast with SNRR, SNRA includes—in the standard deviation Arσ —signal variations associated not only with noise but also with spatial variations of coil sensitivity and any other artefacts. We thus hypothesize that the index SNRA will allow for a comprehensive assessment of both protocol and coil performance. This approach presumes there is no drift in image intensity over time throughout the acquisition of the T = 20 images, and this hypothesis was checked for each dataset prior to further processing by measuring the image intensity over a central region of interest over time.
DCE data are acquired with parallel imaging, employing a combination of signals from different coil elements, and some data truncation. Therefore it would be incorrect to presume
E Kousi et alPhys. Med. Biol. 61 (2016) 37

42
spatially uncorrelated noise within a given local region (Dietrich et al 2007). The spatial auto-correlation function was therefore calculated in order to determine the best approach to choos-ing regions of interest to calculate regional SNR indices (SNRR and SNRA), i.e. the average Pearson correlation coefficient was calculated to assess the correlation between the time evo-lution of the image intensity of each voxel and its neighbours.
A standard SNR measurement to characterise the different coils and protocols was used as a reference; employing a small central region (comprising 300 voxels) placed in the posi-tion corresponding to the centre of the breast in the most central transaxial slice. SNR within the central region was also normalised to voxel size, total acquisition time and acquisition bandwidth to facilitate comparison between systems. For the purposes of normalisation, a bandwidth of 30 kHz was arbitrarily chosen as a reference (Dietrich et al 2007).
Results
Figure 1 shows transaxial slices at the centre of the test object images acquired in each system, covering the right half of the breast coil. Images with and without uniformity filters (top and bottom row, respectively) demonstrate good overall image quality and different patterns of image intensity variation as a function of position.
Figure 1. Transaxial slice (T1-W, 3D GRE) at the centre of the test object images acquired with (top row) and without (bottom row) uniformity filters for each system. Coil volume occupied by the breasts is different for different coil designs (dashed right-breast contours). The right side of the breast coil is shown for each system, with the axilla region to the left of the images (patient right). Good overall image quality is demonstrated. Different patterns of variation of signal intensity as a function of position are visible, particularly at the most anterior region (bottom of images). Window levels are kept the same for images with/without filters.
E Kousi et alPhys. Med. Biol. 61 (2016) 37

43
Figure 2(a) shows transversal and sagittal sections through the centre of the 3D volume corresponding to the right side of the breast coil for system I. Figure 2(b) shows the spa-tial autocorrelation for a 21 × 21 pixel central region, demonstrating correlation between the noise in adjacent pixels, with higher correlation between adjacent pixels along the phase encoding directions (R/L and H/F), compared to the readout direction (A/P).
This pattern is reproduced for each of the system/protocol combination shown in table 1, as all employ readout gradient along A/P direction, irrespective of the use of uniformity filters. The image intensity was measured over the same 21 × 21 central ROI for each data set and the variations were found to be smaller than 0.3% for all protocols.
Figure 3 shows the maps SNR0, SNRA and SNRR for each system, calculated from images acquired with and without the uniformity filters used in the clinical protocols, employing a 3 × 2 × 1 pixels sub-region (in directions A/P, L/R, H/F, respectively) for SNRA and SNRR maps.
SNRR maps show spatial variations that depend on the system and protocol employed; protocols IIIa and IIIb on the same system (and same receiver coil) produce different results. In addition SNRA demonstrates the presence of many structured artefacts and coil dependent
Figure 2. (a) Transaxial (left) and sagittal (right) images at the centre of the test object, acquired with system I. (b) Spatial autocorrelation maps for the central ROI indicated, in the transaxial and sagittal planes. Readout direction is vertical in all pictures. Higher correlations between noise in adjacent pixels along the PE directions is observed.
E Kousi et alPhys. Med. Biol. 61 (2016) 37

44
variations of signal intensity in each system. Regions close to coil elements are highlighted in all systems, and faint vertical bands become visible. The uniformity filters introduced struc-tured artefacts in the anterior–posterior direction to images acquired in systems I and II.
Values of SNR for the central region are presented in table 2, for data acquired with and without uniformity filters.
The difference between values of SNR0 and SNRR for the central region is under 5%, and SNRA is lower than SNRR and SNR0 as expected. The difference between SNRR and SNRA at the central region is particularly large for system II (25%). Values of SNRR normalised for voxel size and receiver bandwidth are also shown for comparison.
Table 2 also indicates that the use of uniformity filters have a large impact on calculated SNR values; the introduction of filters increased SNR values by 15% on average in systems I, II and III. Figure 4 shows a histogram of values of the function B within small regions at different locations for two sets of images acquired with and without filters, using the same system and protocol, demonstrating a change to the distribution of values.
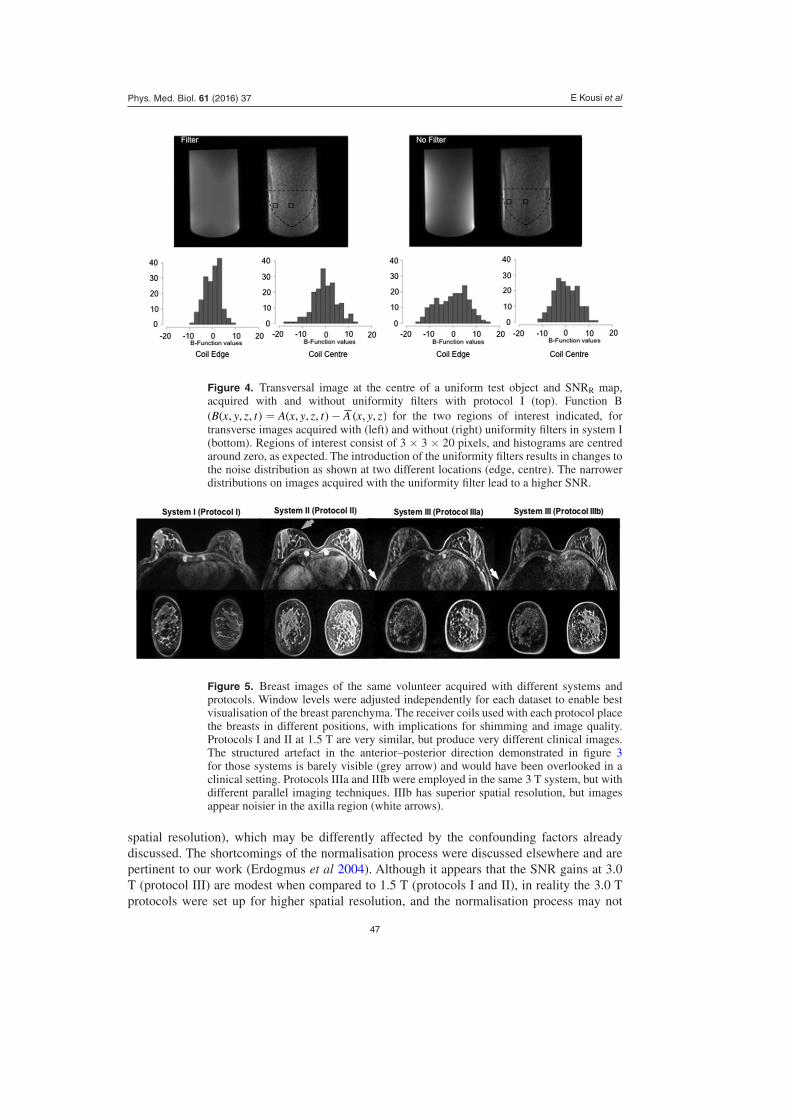
Figure 5 shows breast images of the same volunteer acquired with different protocols/ systems. Fat suppression efficiency is variable with automated shimming over the whole imaging volume. Breasts are deformed differently to fit different coils, a confounding factor in image quality. Protocols I and II are very similar (1.5 T, same voxel size), but produce very different results—protocol II produced sharper images, showing smaller details. Protocols IIIa and IIIb were applied to the same 3.0 T system and breast coil, and again the images differ in quality. Protocol IIIb demonstrates smaller details within the breast paranchyma and there are fewer truncation artefacts, but images appear considerably noisier at the axilla.
Figure 3. SNR0, SNRA and SNRR maps calculated for each system/protocol with (left) and without (right) the uniformity filters for the same test object (transaxial view at the centre of the coils). The window levels are kept the same for each system, showing that images acquired with the uniformity filter have higher SNR values. The calculation of SNRA makes many artefacts more readily visible. The uniformity filter appears to have introduced a structured noise to images in the anterior–posterior direction acquired in systems I and II, visible in the SNRA maps.
E Kousi et alPhys. Med. Biol. 61 (2016) 37

45
Tab
le 2
. SN
R m
easu
rem
ents
(m
ean
± s
tand
ard
devi
atio
n) w
ithin
reg
ion
of i
nter
est
(300
pix
els)
at
the
cent
re o
f br
east
pos
ition
in
the
tran
saxi
al
plan
e us
ing
all
thre
e SN
R c
alcu
latio
n ap
proa
ches
(SN
R0,
SN
RA
, SN
RR)
for
each
pro
toco
l an
d br
east
coi
l de
sign
. N
orm
aliz
ed S
NR
R (
NSN
RR)
valu
es a
re a
lso
show
n.
Syst
emI
III
IIII
IaII
IaII
IbII
Ib
Uni
form
ity fi
lter
YE
SN
OY
ES
NO
YE
SN
OY
ES
NO
SNR
019
0 ±
32
160
± 2
749
0 ±
95
430
± 6
425
0 ±
51
220
± 3
324
0 ±
41
210
± 4
1SN
RA
180
± 1
914
0 ±
18
370
± 8
012
0 ±
28
240
± 2
814
0 ±
17
230
± 2
613
0 ±
15
SNR
R19
0 ±
21
160
± 1
649
0 ±
53
420
± 3
825
0 ±
30
210
± 2
224
0 ±
27
210
± 2
3N
SNR
R (
1000
cm−
3 s−
1/2 )
3025
6859
9279
8072
E Kousi et alPhys. Med. Biol. 61 (2016) 37

46
Discussion
In this article we proposed and demonstrated methods to characterise the SNR spatial depen-dency for breast DCE protocols with a simple and relatively fast procedure. Drifts in image intensity over time were not expected and were not found, therefore it is not necessary to post-process images to remove long-term variations in image intensity as proposed by Friedman (Friedman and Glover 2006). Three types of SNR maps were calculated for all systems: SNR0, SNRR and SNRA. SNR0 and SNRR have similar characteristics as expected, but the ability to trade spatial resolution for a better noise characterisation is advantageous when working with small datasets. SNRA, in comparison, has provided additional information, highlight-ing a number of structured artefacts, not necessarily noticeable when one single dataset is scrutinised. Both data truncation and parallel imaging can give rise to structured artefacts (Dietrich et al 2007) which are not randomly distributed—their distribution is a function of the test object characteristics, and often replicates and distorts high contrast structures. These artefacts have an impact on image quality, but in a clinical setting the structured artefacts may be less conspicuous. For instance, the structured artefact associated with the use of unifor-mity filters, detected in the anterior–posterior direction by the calculation of SNRA in sys-tem II, is barely visible (figure 5). Nevertheless, in DCE-MRI, signal and noise instabilities over the whole acquisition period—captured in SNRA—could significantly affect the shape of the enhancement curves and hence their diagnostic performance. Furthermore many arte-facts detected with the calculation of SNRA could be mistakenly attributed to subject motion, which is clearly undesirable. It is interesting to notice that the difference between values of SNRR and SNRA in the central region is largest on our oldest system (system II). Assessment of artefacts is an important part of the characterisation of breast protocols, and the calculation of SNRA is a sensitive method.
This article demonstrates many confounding factors relating to SNR measurements: spa-tially correlated noise (figure 2) and position dependent noise distribution (figure 4), affected by the uniformity filters. Considering our results for all systems, it is advantageous to extend the sub-region in the readout direction to calculate SNRR and SNRA, as the correlation between noise in adjacent voxels is smaller.
Optimisation of DCE breast protocols involves finding a suitable compromise between spatial and temporal resolution while ensuring that the image intensity remains proportional to contrast agent concentration. In our institution different approaches were used and, although all protocols comply with the current guidelines, they have different resolution and achieve different image quality, as a result of differences in the field strength and coil geometry.
It is possible that the SNR measurements performed are sensitive to vibration, and great care was taken to minimize it. This is not necessarily a drawback for this type of testing, as patient breasts are not rigid. We have repeated SNR measurements with a gel test object in one of our systems, and obtained similar results.
The SNR measurements performed on a central region suggest that the 4-element coil of rigid geometry (system II) provides a better performance than the modern biopsy-compatible coil (system I). Although this is likely, it is also possible that system II simply performs better on the test object. In practice breast patients are of different shapes and sizes, and we have not addressed fully the impact of coil design on image quality considering the high variability in filling factors within the patient population. The receiver coils deform the breast in different ways, and this in turn has an impact on shimming—as clearly demonstrated by the imperfect automated fat suppression on volunteer images.
The normalised SNR values presented in table 2 must be treated with caution: we acknowl-edge we are comparing images acquired with different parallel imaging factors (and different
E Kousi et alPhys. Med. Biol. 61 (2016) 37
47
spatial resolution), which may be differently affected by the confounding factors already discussed. The shortcomings of the normalisation process were discussed elsewhere and are pertinent to our work (Erdogmus et al 2004). Although it appears that the SNR gains at 3.0 T (protocol III) are modest when compared to 1.5 T (protocols I and II), in reality the 3.0 T protocols were set up for higher spatial resolution, and the normalisation process may not
Figure 4. Transversal image at the centre of a uniform test object and SNRR map, acquired with and without uniformity filters with protocol I (top). Function B ( ( ) ( ) ( )= −B x y z t A x y z t A x y z, , , , , , , , for the two regions of interest indicated, for transverse images acquired with (left) and without (right) uniformity filters in system I (bottom). Regions of interest consist of 3 × 3 × 20 pixels, and histograms are centred around zero, as expected. The introduction of the uniformity filters results in changes to the noise distribution as shown at two different locations (edge, centre). The narrower distributions on images acquired with the uniformity filter lead to a higher SNR.
Figure 5. Breast images of the same volunteer acquired with different systems and protocols. Window levels were adjusted independently for each dataset to enable best visualisation of the breast parenchyma. The receiver coils used with each protocol place the breasts in different positions, with implications for shimming and image quality. Protocols I and II at 1.5 T are very similar, but produce very different clinical images. The structured artefact in the anterior–posterior direction demonstrated in figure 3 for those systems is barely visible (grey arrow) and would have been overlooked in a clinical setting. Protocols IIIa and IIIb were employed in the same 3 T system, but with different parallel imaging techniques. IIIb has superior spatial resolution, but images appear noisier in the axilla region (white arrows).
E Kousi et alPhys. Med. Biol. 61 (2016) 37

48
necessarily account fully for that. For a direct comparison of hardware performance, it may be more productive to use the same basic protocol in all systems, without parallel imaging and filters. The approach we propose goes beyond hardware performance and characterises the protocol as a whole, including hardware, pulse sequence design and the prevalent use of uni-formity filters. These measurements can be used for system performance assessment on a long term basis. In particular, the proposed index SNRA has drawn attention to artefacts that could have remained undetected, and is therefore a useful tool in QA. The methods we propose are therefore invaluable in longitudinal studies and clinical trials; they can be used to detect deterioration of a system performance over time or to stipulate a minimum SNR value over a given volume for trials which employ different hardware, or even different DCE protocols in different systems. For instance, regions with low SNR values could be identified and carefully monitored over time. Quality assurance should require stable values of SNRA and a minimum value of SNR over the coil volume to be occupied by the breasts.
In conclusion, we proposed and demonstrated a method to acquire and process data to map SNR in breast DCE protocols, making use of regional information to characterise each voxel. This work has demonstrated artefacts and highlighted a number of confounding factors in the SNR measurements, with implications for quality assurance in multi-centre trials and breast cancer screening services, which benefit from standardisation.
Acknowledgments
This article presents independent research partially funded by the CR-UK Cancer Imaging Centre (C1060/A10334) and carried out at the National Institute for Health Research (NIHR) Royal Marsden Clinical Research Facility in association with the NIHR Biomedical Research Centre. The views expressed are those of the author(s) and not necessarily those of the NHS, the NIHR or the Department of Health. MOL is a NIHR senior investigator.
References
American College of Radiology 2003 ACR Breast Imaging Reporting and Data System: Breast Imaging Atlas 4th edn (Reston, VA: American College of Radiology)
Calonge N et al 2009 Screening for breast cancer: US Preventive Services Task Force recommendation statement Ann. Intern. Med. 151 716–26
Chen C C, Wan Y L, Wai Y Y and Liu H L 2004 Quality assurance of clinical MRI scanners using ACR MRI phantom: preliminary results J. Digit. Imag. 17 279–84
Clayton D et al 2012 Technical guidelines for magnetic resonance imaging (MRI) for the surveillance of women at higher risk of developing breast cancer. NHS Breast Screening Programmes (NHSBSP Publication No. 68)
Constantinides C D, Atalar E and McVeigh E R 1997 Signal-to-noise measurements in magnitude images from NMR phased arrays Magn. Reson. Med. 38 852–7
Cron G, Kelcz F and Santyr G 2004 Improvement in breast lesion characterization with dynamic contrast-enhanced MRI using pharmacokinetic modeling and bookend T1 measurements Magn. Reson. Med. 51 1066–70
De Naeyer D, Verhulst J, Ceelen W, Segers P, De Deene Y and Verdonck P 2011 Flip angle optimization for dynamic contrast-enhanced MRI-studies with spoiled gradient echo pulse sequences Phys. Med. Biol. 56 5373–95
DeMartini W, Lehman C and Partridge S 2008 Breast MRI for cancer detection and characterization: a review of evidence-based clinical applications Acad. Radiol. 15 408–16
Dietrich O, Raya J G, Reeder S B, Reiser M F and Schoenberg S O 2007 Measurement of signal-to-noise ratios in MR images: influence of multichannel coils, parallel imaging, and reconstruction filters J. Magn. Reson. Imag. 26 375–85
E Kousi et alPhys. Med. Biol. 61 (2016) 37

49
Erdogmus D, Larsson E, Yan R, Principe J and Fitzsimmons J 2004 Measuring the signal-to-noise ratio in magnetic resonance imaging: a caveat Signal Process. 84 1035–40
Eyal E and Degani H 2009 Model-based and model-free parametric analysis of breast dynamic-contrast-enhanced MRI NMR Biomed. 22 40–53
Fan X, Medved M, Karczmar G S, Yang C, Foxley S, Arkani S, Recant W, Zamora M A, Abe H and Newstead G M 2007 Diagnosis of suspicious breast lesions using an empirical mathematical model for dynamic contrast-enhanced MRI Magn. Reson. Imag. 25 593–603
Freed M 2012 Effect of protocol parameters on contrast agent washout curve separability in breast dynamic contrast enhanced MRI: a simulation study Magn. Reson. Med. 6 516–22
Friedman L and Glover G H 2006 Report on a multicenter fMRI quality assurance protocol J. Magn. Reson. Imag. 23 827–39
Griswold M A, Jakob P M, Heidemann R M, Nittka M, Jellus V, Wang J, Kiefer B and Haase A 2002 Generalized autocalibrating partially parallel acquisitions (GRAPPA) Magn. Reson. Med. 47 1202–10
Gudbjartsson H and Patz S 1995 The Rician distribution of noisy MRI data Magn. Reson. Med. 34 910–4Ihalainen T M, Lonnroth N T, Peltonen J I, Uusi-Simola J K, Timonen M H, Kuusela L J, Savolainen S E
and Sipila O E 2011 MRI quality assurance using the ACR phantom in a multi-unit imaging center Acta Oncol. 50 966–72
Jansen S A, Shimauchi A, Zak L, Fan X, Wood A M, Karczmar G S and Newstead G M 2009 Kinetic curves of malignant lesions are not consistent across MRI systems: need for improved standardization of breast dynamic contrast-enhanced MRI acquisition Am. J. Roentgenol. 193 832–9
Ledger A et al 2014 Investigating the influence of flip angle and k-sampling on dynamic contrast-enhance MRI breast examinations Acad. Radiol. 21 1394–401
Lee C H et al 2010 Breast cancer screening with imaging: recommendations from the Society of Breast Imaging and the ACR on the use of mammography, breast MRI, breast ultrasound, and other technologies for the detection of clinically occult breast cancer J. Am. Coll. Radiol. 7 18–27
Lerski R A, de Wilde J, Boyce D and Ridgway J 1998 Quality control in magnetic resonance imaging IPEM Report 80 (York: IPEM) p16
Lin F-H, Kwong K K, Belliveau J W and Wald L L 2004 Parallel imaging reconstruction using automatic regularization Magn. Reson. Med. 51 559–67
Morrow M, Watters J and Morris E 2011 MRI for breast cancer screening, diagnosis, and treatment Lancet 378 1804–11
National Institute for Health and Clinical Excellence 2006 Familial Breast Cancer. The Classification and Care of Women at Risk of Familial Breast Cancer in Primary, Secondary and Tertiary Care (Partial Update of NICE Clinical Guideline 14) (NICE Clinical Guideline 41). (www.nice.org.uk/nicemedia/live/10994/30244/30244.pdf)
Price R R, Axel L, Morgan T, Newman R, Perman W, Schneiders N, Selikson M, Wood M and Thomas S 1990 Quality assurance methods and phantoms for magnetic resonance imaging: report of AAPM nuclear magnetic resonance task group no. 1 Med. Phys. 17 287–95
Pruessmann K P, Weiger M, Scheidegger M B and Boesiger P 1999 SENSE: sensitivity encoding for fast MRI Magn. Reson. Med. 42 952–62
Robson P M, Grant A K, Madhuranthakam A J, Lattanzi R, Sodickson D K and McKenzie C A 2008 Comprehensive quantification of signal-to-noise ratio and g-factor for image-based and k-space parallel image reconstructions Magn. Reson. Med. 60 895–907
Saslow D et al 2007 American Cancer Society guidelines for breast screening with MRI as an adjunct to mammography CA Cancer J. Clin. 57 75–89
Schabel M C and Parker D L 2008 Uncertainty and bias in contrast concentration measurements using spoiled gradient-echo pulse sequences Phys. Med. Biol. 53 2345–73
E Kousi et alPhys. Med. Biol. 61 (2016) 37