Embed Size (px)
Citation preview

Spektrale CT-Bildgebung
1
Spektrale CT-Bildgebung19. APT Seminar – 3. Theo Schmidt –Symposium – Nürnberg
Ewald RößlPhilips Research Hamburg
13. Juni 2015

Übersicht
• Spektral Detektor CT
• Röntgentomographie mit Photon-zählenden Detektoren
2
Übersicht
• Spektral Detektor CT
• Röntgentomographie mit Photon-zählenden Detektoren
3

IQon – Spectral CT
Weltweiter erster Spektral Detektor CT
- Gleichzeitigkeit
- Retrospektiv
- Niedrigdosis
Z Eff
4
- Niedrigdosis
- Routine

Der IQon – Detektor• 16 x 16 x 2 Tile; pitch wie bei iCT
• Oberer Szintillator: niederenergetische Photonen
• Unterer Szintillator: hochenergetische Photonen
• Kein Filter zwischen den Schichten
• Seitwärtsgerichtete Photodioden für verbesserte
5
• Seitwärtsgerichtete Photodioden für verbesserte
Lichtausbeute
• Wolfram Schirmung gegen direkte Bestrahlung der
Photodioden, X-Talk Unterdrückung und
mechanische Robustheit
• 2mm dickes GOS im unteren Szintillator
(iCT: 1.4mm); Detektoreffizienz: >99%

Photo
Img.
Scatter
Img.
Photo Proj. Data
Scatter Proj. Data
Combined Proj.
Data
Conventional
Combined
Img.
Philips’
Spectral
Reconstruction
Spectral-Base Images
for all spectral results
and applications
-Mono Chromatic Images
-Virtual Non-Contrast Images
-Material Specific Images
-Material Removal Images
-Iodine Maps
-Effective Atomic Number
Philips‘ Spektrale Rekonstruktion
6
Modell für anti-
korreliertes Rauschen
Regularisierte
Log-Likelihood
funktion
Synchronisation mit
dem herkömmlichen
Bild
-Effective Atomic Number
-Electron Density
-Proton-Stopping Power Maps
…
Courtesy to A. Altman, GRAD CT, Haifa, Israel

Spektrale Materialtrennung
Ca
CaCa
Ca
II
I
Gammex Phantom Conventional CT image
7
Ca
Ca
Ca
IIICa
Courtesy to A. Altman, GRAD CT, Haifa, Israel

600
800
1000
1200
Conventional image - Gammex phantom
Ph
oto
ele
ctri
c
Scatter-plot diagram
Iodine
FBP Reconstruction
Ca
CaCa
Ca
II
I
Spektrale Materialtrennung
8
0 200 400 600 800
0
200
400
600
Ph
oto
ele
ctri
c
Compton Scatter
CalciumCa
Ca
Ca
IIICa
Courtesy to A. Altman, GRAD CT, Haifa, Israel

600
800
1000
1200
Ph
oto
ele
ctri
c
FBP Reconstruction
Iodine
Philips’ Spectral Recon
Ca
CaCa
Ca
II
I
Conventional image - Gammex phantomScatter-plot diagram
Spektrale Materialtrennung
9
0 200 400 600 800
0
200
400
600
Compton Scatter
Ph
oto
ele
ctri
c
CalciumCa
Ca
Ca
IIICa
Courtesy to A. Altman, GRAD CT, Haifa, Israel
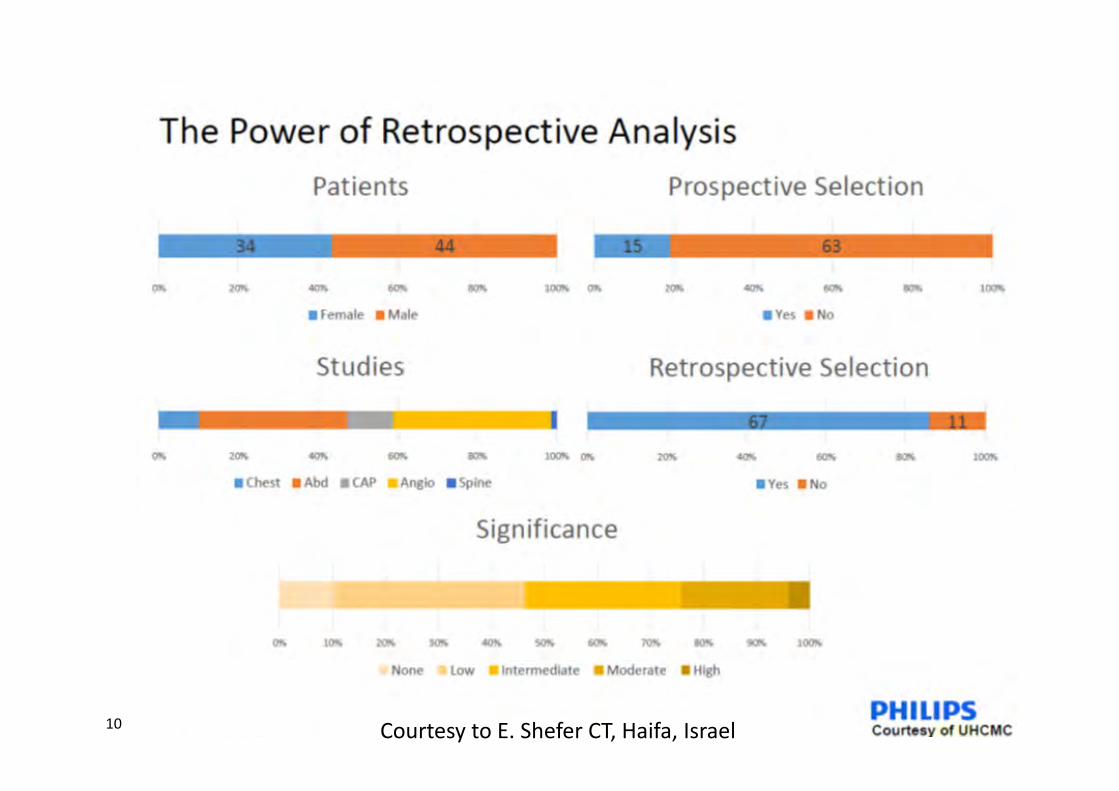
10 Courtesy to E. Shefer CT, Haifa, Israel

Lesion CharacterizationPower of retrospective analysis
Lesion vs. Debris
Iodine no H2O [mg/ml]Conventional 120kVp
Images courtesy of Hadassah Medical Center, Jerusalem, Israel

Slide 3 – Clinical 10Increased Diagnostic Confidence

Slide 4 – Clinical 7
120kVp 200keV
Coronary Stenosis AssessmentReduced Calcium Blooming
200keV120kVp
Courtesy of UH Hospitals, Cleveland, OH, USA
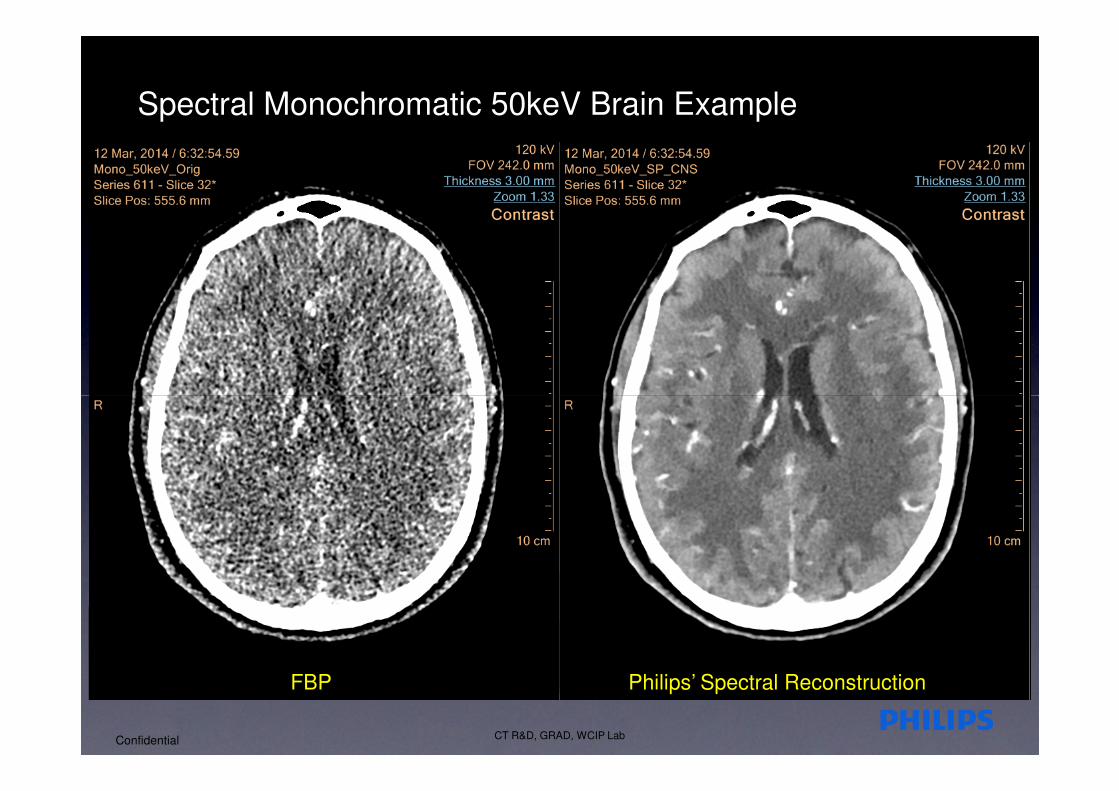
Spectral Monochromatic 50keV Brain Example
CT R&D, GRAD, WCIP LabConfidential
FBP Philips’ Spectral Reconstruction

Übersicht
• Spektral Detektor CT
• Röntgentomographie mit Photon-zählenden Detektoren
15

Von Schwarz-Weiss-, zu Farbbildgebung in der Röntgencomputertomographie Schwarz-Weiss
Bildgebung
16
Farbbildgebung
Innovative Detektortechnologie
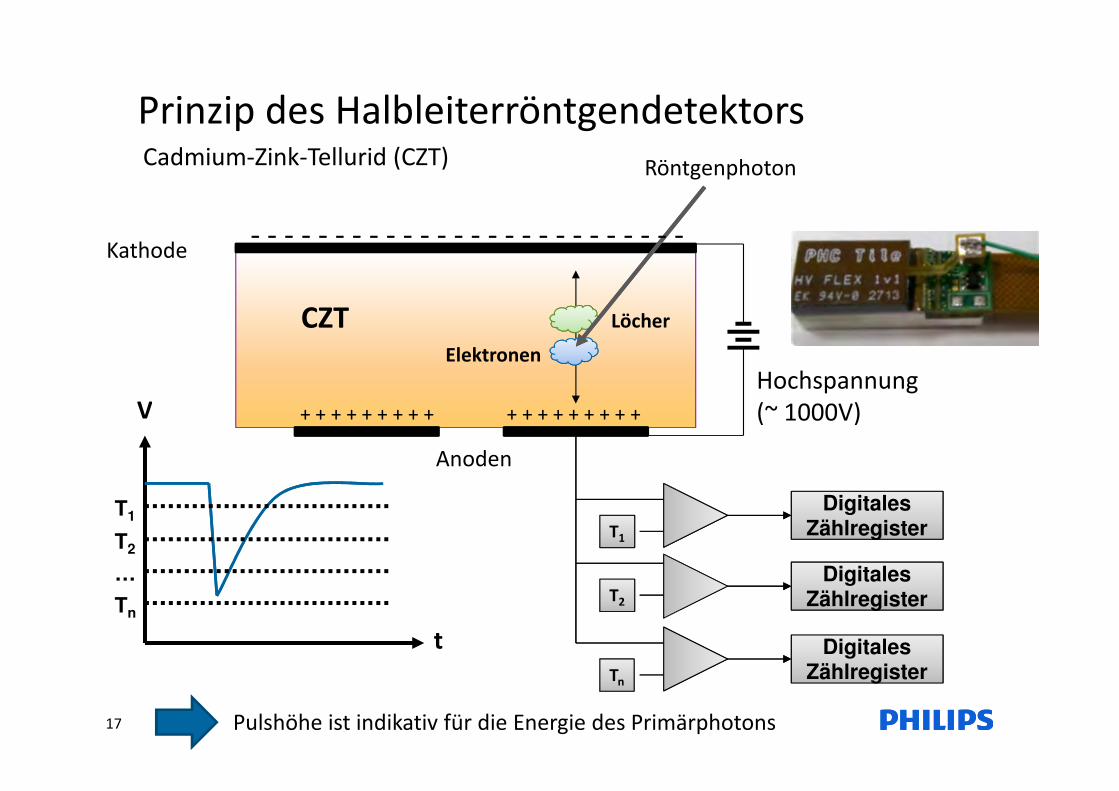
Prinzip des HalbleiterröntgendetektorsCadmium-Zink-Tellurid (CZT)
Elektronen
Löcher
Hochspannung
(~ 1000V)V
Röntgenphoton
CZT
- - - - - - - - - - - - - - - - - - - - - - - - - -Kathode
17
Hochspannung
(~ 1000V)V
t
T1
DigitalesZählregister
DigitalesZählregister
T1
T2
…
TnT2
DigitalesZählregister
DigitalesZählregister
Tn
DigitalesZählregister
DigitalesZählregister
Pulshöhe ist indikativ für die Energie des Primärphotons
+ + + + + + + + + + + + + + + + + +
Anoden

Anwendungsgebiete in der Computertomographie
• Quantitative Bildgebung
• Reduktion der Strahlendosis
• Verbesserte räumliche Auflösung
• Verbesserung der Bildqualität
• Verbesserung der Differenzierung
18
• Verbesserung der Differenzierung
von Weichteilgeweben
• Reduktion von Beam-hardening
• Neuartige bildgebende Methoden:
– e.g. K-Kantenbildgebung zur
selektiven Detektion von
spezifisch bindenden Kontrast-
mittelnVerbesserte Darstellung von Läsionen in Karotidenarterien durch K-Kantenbildgebung(Simulation)

Photon-zählender CT Prototyp
Parameter Spezifikation
Platform Philips iCT
Röhrenspannung [kVp] 80, 100, 120
Röhrenstrom [mA] 10-120
Fokusgröße [mmxmm] 0.6 x 0.7
Gantry Rotation [s] 0.75
Ortsauflösung [lp/cm] > 20
19
Ortsauflösung [lp/cm] > 20
Coverage im Iso-
zentrum [mm]
2.5
FOV [mm] 168
Sensor Material CZT
Installiert an Universität Lyon, Prof. Douek, Prof. Boussel 2015
Philips Research und Philips CT

Verbesserte räumliche Auflösung
20
Auflösungsphantom
Scan eines Beinphantoms
120kVp, 100mA, T=1s, SW=0.27mm

HU BildqualitätDelrin Phantom (Polyoxymethylene, POM), Dichte=1.41 g/cm3
Scan Parameter:• 120 kVp
• 100 mA
• Niedrigste E-schwelle : 30 keV
• 1s axialer scan , 360 deg.
• 2400 Projektionen
Phantom Größe
Gd
21
Phantom Größe• 13 cm Durchmesser
Gd and Ca in hoherKonzentration
HU Bild aus allen Energiebins
erzeugt
L: 0 HU, W: 1200 HU
Ca

HU Bildqualität – Delrin-Iod PhantomDelrin (Polyoxymethylene, POM), Dichte=1.41 g/cm3
Scan Parameter:• 120 kVp
• 100 mA
• 1s Scanzeit über 360 deg.
• 2400 Projektionen
22
Phantom Größe:• 13 cm Durchmesser
Iod Konzentration:
7.0, 3.5, 2.0, 1.0, 0.5, 0.25 mg/cm3

HU Bildqualität – Delrin-Iod
Linearität des Iodkontrast im HU Bild
y = 33,817x + 2,4355200
250
300
CT
Imag
e V
alu
e [
HU
]
HU Werte - ROI IodIodine
23
L 50HU / W 250 HU
y = 33,817x + 2,4355
R² = 0,9995
-50
0
50
100
150
200
0 2 4 6 8
CT
Imag
e V
alu
e [
HU
]
Iodkonzentration [mg/cm3]

Spektrale MaterialtrennungGadolinium-Kalzium Trennung
Gd1 Ca
Gd1 : 36mg/cm3
Gd2 : 15mg/cm3
Gd3 : 7mg/cm3
24
Scan Parameter:• 120 kVp, 100 mA
• Niedrigste E-schwelle : 30 keV
• 1s axialer Scan , 360 deg.
• 2400 Projektionen
Phantomgröße• 13 cm DurchmesserL: 200 HU, W: 1500 HU
Gd3Gd2
Bild aus allenEnergiebins erzeugt

Messung der Spektralen Detektorantwortfunktion
Europäische Synchrotronquelle ID 17
25 In Zusammenarbeit mit Prof. P. Douek and Prof. L. Boussel, M. Sigovan, F. Peyrin
ESRF, Grenoble, France

Spektrale MaterialselektionMaximum-Likelihood Methode zur Materialtrennung
in Photo/Compton/Gd
• 120 kVp, 100 mA
• Niedrigste Energieschwelle: 30 keV
• 1s axialer scan , 360 deg.
• 2400 Projektionen
Photo-elektrischer Effekt Compton Effekt Gadolinium
26
L: 200 HU, W: 1500 HU
Imagegenerated from all energy bins !
• Sehr gute spektrale Materialtrennung
• Hohe Anforderung an spektrale Kalibration (Bildartefakte)
Gd1
Gd2 Gd3
Ca

Spektrale BildgebungMonochromatische Schwächungsbildgebung
50 keV
Gd1
Ca
51 keV
Gd1
Ca
K-Kante von Gd: 50.3 keV
CT# 50keV 51keV
Gd1 685 ± 135 1940 ± 135
Gd2 275± 120 775 ± 125
Gd3 185± 115 520 ± 100
Ca 935 ± 150 1000 ± 110
27
Gd1
L : 0 HU
W: 2000 HU
Gd1
185 HU
L : 0 HU
W: 2000 HU
Gd2 Gd2
Gd3 Gd3
520 HU

Spektrale Trennung von Gadolinium und KalziumQuantitative mono-chromatische Bildgebung
0,2
0,25
0,3
0,35
µ(E
) [m
m-1
]
Ca ROI
Ca
0,2
0,25
0,3
0,35
1]
Gd1 ROI
Gd
Gemessene Schwächung in Gd und Ca ROIs
28
0
0,05
0,1
0,15
0,2
10 30 50 70 90 110 130µ
(E)
[mm
E[keV]
0
0,05
0,1
0,15
0,2
10 30 50 70 90 110 130
µ(E
) [m
m-1
E[keV]
Präzise Quantifizierung der Schwächung aus mono-chromatisch Bilder

Spektrale BildgebungCT Bildgebung aus einzelnen Energiebins
120keV, 100mA 1s axial scan
30keV - 50keV - 80keV -
L: 0 HU, W: 1200 HU
Gd
Ca
29
L: 0.023 mm-1
W: 0.046 mm-1Starke Reduktion von “Beam-Hardening”

Demonstration der spekralen Materialtrennung
3D Druck desselbigen 3D ModellsVirtuelles 3D Modell eines Herz CT Scans
Cavities filled with iodine orgadoliniumsolution
Gadolinium or iodine rod
30
Calciumrods

Spektrale MaterialtrennungGadolinium und Kalzium Trennung
HU image Compton Effekt
Compton
HU
31
Gadolinium Photoeffekt Photo
Gd

K-Kantenbildgebung von GadoliniumPhantomstudie: Stenosephantom
HU Bild MonoE 48 keV MonoE 52keV
Gd Basisbild(Volume rendering)
32
Scan Details120kVp, 100mA
48000 spiral CT
FOV (z) = 2,2 cm
Gd 7.8 g/cm3 = 50 mM
In Zusammenarbeit mit Prof. P. Douek and Prof. L. Boussel

33
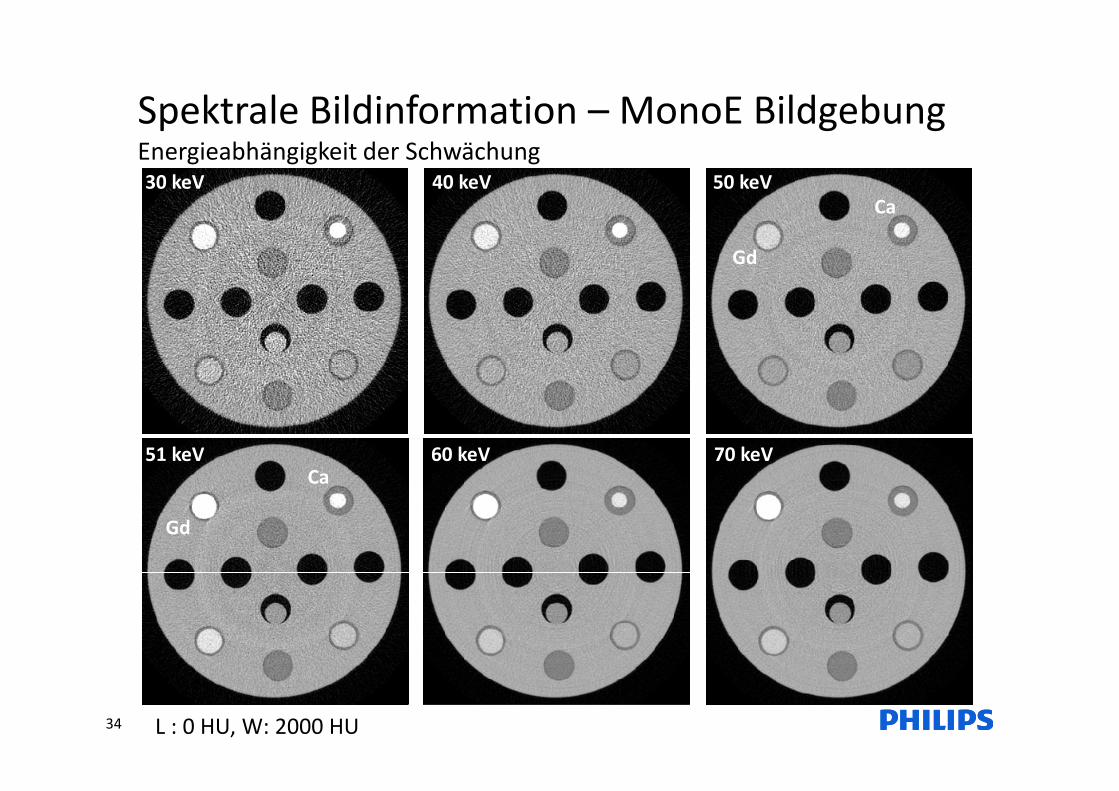
Spektrale Bildinformation – MonoE BildgebungEnergieabhängigkeit der Schwächung30 keV 40 keV 50 keV
Gd
Ca
34
51 keV 70 keV51 keV 60 keV
L : 0 HU, W: 2000 HU
Gd
Ca

HU – BildqualitätLinearität des Gadoliniumkontrast im HU Bild
y = 40,921x + 3,8957
R² = 0,9999
250
300
350
400
[HU
]
HU Werte – ROI GdGadolinium
35
-50
0
50
100
150
200
250
0 2 4 6 8
CT
Imag
e V
alu
e [
HU
]
Gd Konzentration [mg/cm3]L 50HU / W 250 HU