Embed Size (px)
Citation preview

Vol.3 No.1 January 2015 ISSN: 2320-4168
Shanlax International Journal of Commerce 92
PERFORMANCE APPRAISAL OF AUTOMOBILE INDUSTRY – A COMPARATIVE CASESTUDY OF ASHOK LEYLAND LTD AND TATA MOTORS LTD
Dr. S. Meena KumariAssistant Professor, Dept. of Commerce, Thiagarajar College, Madurai
Dr. I. NagarajanHead, Associate Professor, Dept. of Commerce, Thiagarajar College, Madurai
AbstractDemographically and economically, India’s automotive industry is well-positioned for
growth, servicing both domestic demand and, increasingly, export opportunities. Automobilesproduction increased at a Compound Annual Growth Rate (CAGR) of 12.2 percent over FY05-13, whilethe export volumes increased at a CAGR of 19.1 per cent. Strong demand growth due to risingincomes, growing middle class, and the young population is likely to propel India among the world'stop five automobile producers by 2015. India has significant cost advantages, automobile firms save10-25 percent on operations in India as compared to Europe and Latin America. A large pool ofskilled manpower and a growing technology base are some of the leading factors. The governmentaims to develop India as a global manufacturing as well as research and development (R&D) hub.There has been a wide array of policy support in the form of concessions, taxes and FDIencouragement. Under the Union Budget 2013-14, the government has also proposed to allocate US$2.7 billion for Jawaharlal Nehru National Urban Renewal Mission (JNNURM) to boost sales volumes ofMedium and Heavy Commercial Vehicles (MHCV). The world's cheapest car (Tata Nano) has directedfocus towards the low-income market. Bajaj Auto, Hero Honda and Mahindra & Mahindra (M&M)jointly plan to develop a technology for two-wheelers to run on natural gas. Electric cars are likelyto be a sizeable market segment in the coming decade. Ashok Leyland, the flagship company of theHinduja Group which is originally British-based and Indian originated transnational conglomerate is acommercial vehicle manufacturing company based in Chennai. Founded in 1948, the company is oneof the India’s leading manufacturers of commercial vehicles, emergency vehicles and militaryvehicles. Operating seven plants, Ashok Leyland also makes spare parts and engines for industrialand marine applications. Tata Motors Limited (formerly TELCO, short for Tata Engineering andLocomotive Company) is an Indian multinational automotive manufacturing company headquarteredin Mumbai, Maharashtra, India and a subsidiary of the Tata Group, Founded in 1945. Its productsinclude passenger cars, trucks, vans, coaches, buses, construction equipment and military vehicles. Itis the world's sixteenth-largest motor vehicle manufacturing company, fourth-largest truckmanufacturer and second-largest bus manufacturer by volume. This paper is purely based onsecondary data, i.e. Annual Reports of Ashok Leyland Ltd and Tata Motors Ltd from 2008-09 to 2012-13 and Journals, and Articles. The collected data were analyzed by using the Ratio Analysis. Further,statistical tools like Mean, Standard Deviation, Coefficient of Variation and Growth Rate were alsoused for the purpose of the study.

Vol.3 No.1 January 2015 ISSN: 2320-4168
Shanlax International Journal of Commerce 93
IntroductionAutomobiles production increased at a Compound Annual Growth Rate (CAGR) of
12.2 percent over FY05-13, while the export volumes increased at a CAGR of 19.1 per cent.Strong demand growth due to rising incomes, growing middle class, and the youngpopulation is likely to propel India among the world's top five automobile producers by2015.
India has significant cost advantages, automobile firms save 10-25 percent onoperations in India as compared to Europe and Latin America. A large pool of skilledmanpower and a growing technology base are some of the leading factors. The governmentaims to develop India as a global manufacturing as well as research and development (R&D)hub. Weaker segments lower GDP growth dragged down MHCV sales in 2012-13. Afterrecording a compounded annual growth rate (CAGR) of 35.7 per cent in 2008-09 and 2009-10, growth in MHCV sales had moderated to 8.8 per cent in 2011-12 following the slowdownin GDP growth. After dipping to 3.9 per cent in 2011-12, industrial GDP continued to slowdown in 2012-13 precipitating a 25.9 per cent fall in MHCV sales in 2012-13. Bus salesdeclined by 4 percent in 2012-13 owing to slowdown in demand from State TransportUndertakings (STUs), cautious approach undertaken by private operators towards newinvestments.
There has been a wide array of policy support in the form of concessions, taxes andFDI encouragement. Under the Union Budget 2013-14, the government has also proposed toallocate US$ 2.7 billion for Jawaharlal Nehru National Urban Renewal Mission (JNNURM) toboost sales volumes of Medium and Heavy Commercial Vehicles (MHCV). The world'scheapest car (Tata Nano) has directed focus towards the low-income market. Bajaj Auto,Hero Honda and Mahindra & Mahindra (M&M) jointly plan to develop a technology for two-wheelers to run on natural gas. Electric cars are likely to be a sizeable market segment inthe coming decade.
Ratio Analysis was used to examine Liquidity, Profitability, Solvency and Efficiencyof the both the Companies. The ability of both the companies to meet its obligations on thetime depends on its liquidity and solvency position and its ability to meet all expendituresdepends on its earning capacity. Both Liquidity and Profitability of both the companies willenhance the Credit Worthiness of the Firm. The high degree of liquidity affects adverselyprofitability and high degree of profitability affects adversely the liquidity of the firm.Therefore, it is necessary to strike a balance between Liquidity and Profitability of theFirm. The financial statements of last five years of Ashok Leyland Ltd shows negativeresults in Gross Loss and in Tata Motors Ltd shows negative in Gross Loss and Net Loss. Andalso imbalance in the assets and liabilities structure of the companies. This is because ofthe Economic Crisis in Automobile Industry and also there was something went wrong in theManagement of Ashok Leyland Ltd and Tata Motors Ltd because of the crisis. Against thisbackground, the paper is a modest attempt to analyze the Performance of the Firm.

Vol.3 No.1 January 2015 ISSN: 2320-4168
Shanlax International Journal of Commerce 94
Statement of the ProblemThe performance appraisal is an integral part of overall corporate management.
There had been variation in profits of both the firms from period to period. The success orfailure is determined by applying various tools such as Ratio analysis, Mean, Standarddeviation, Coefficient of variation and Growth rate. The company’s performance has beenevaluated by analysing its financial capability. A study on the performance of Ashok LeylandLtd and Tata Motors Ltd has been found to be apt in this context which will throw light onthe causes of fluctuation in performance.
Hence the researcher has made an attempt to analyse the following problems: How the companies are managing its finance over the period of 5 years from 2008-
09 to 2012-13? How the firms have succeeded in its growth?
Objectives of the StudyThe present paper highlights the following objectives:
To examine the trends in assets and liabilities, net worth and capital employed,sales, cost of goods sold, gross profit and net profit of the firm.
To analysis the financial performance of both the companies in terms of Solvency,Liquidity, Profitability and Efficiency ratios.
To measure the overall performance of both the companies. To offer suggestions based on the major findings of the study.
Scope of the StudyFinancial performance of an organization is a very important factor for the long
term survival profitability of any organization. The purpose of financial analysis is todiagnose the information contained in financial statement so as to grudge the profitabilityand financial soundness of the firm.
Review of Earlier LiteratureRoy T.S. (2006)
The Researcher made an attempt to evaluate the financial and operationalefficiency of the company by using secondary data collected from the Annual Reports of thecompany and the Ministry of Petroleum . The Study used ratio analysis tools like ProprietaryRatio, Solvency Ratio, Leverage Ratio and EPS Ratio to examine the performance of Oil andNatural Gas Corporation. The Study concludes that the performance of the company wassound in majority of areas.M.A.Lokande (2007)
Lokande made an attempt to analyze the performance of Cooperative Spinning millof Jalna of Maharashtra State. He also made an attempt to examine the problems of

Vol.3 No.1 January 2015 ISSN: 2320-4168
Shanlax International Journal of Commerce 95
spinning mills. The Researcher adopted ratio analysis tools to evaluate the performance ofcooperative spinning mill. The Study revealed that profitability and liquidity of the firmwere very poor since the inception of the firm and concluded that the ailing firm wasmoving towards sickness.
A.S. Shiralashetti (2011)The Researcher made an attempt to evaluate the financial and operational
efficiency of the company by using secondary data collected from the Annual Reports of theGadag Co-Operative Cotton Textiles Mill Ltd. The Study used ratio analysis tools likeProfitability Ratio, Solvency Ratio, Liquidity Ratio and Efficiency Ratio to examine theperformance of Gadag Co-Operative Cotton Textiles Mill Ltd. The Study concludes that theperformance of the company was unsound in majority of areas.
P. Suresh and Dr. M. Akbar Mohideen (2013)A study on Performance Appraisal of Automobile Industries, at Chennai, Tamil Nadu
using primary data with sample size of 100 and secondary data. The Researcher usedstatistical tools like Percentage analysis and CHI – square test.
Vipul B Patel (2013)A Comparative study of Profitability Analysis of Tata Motors Ltd and Ashok Leyland
Ltd was done using T- test on Profitability Ratios like Operating Profit Margin Ratio, NetProfit Margin Ratio, Return on Capital Employed and Return on Networth. The Researcherused Secondary data as source i.e. the Annual Report of Ashok Leyland Ltd and Tata MotorsLtd.
Need and Importance of the StudyFinance is the scarcest resource in India and hence it needs to be utilized
optimally. The sound performance of a firm depends on the well planning of capitalstructure, investment and distribution. Any firm that fails to apply the sound principles ofcapital structure like cost, control and flexibility and the firm that fails to adopt scientifictools of investment and distribution in managing funds will not survive in the long run.Further, the firm should apply the wealth maximization as criteria in taking financialdecisions like financing, investment and distribution. Since finance is the lifeblood andnervous system of an enterprise, the importance of the timely appraisal of the performanceof the firm cannot be overemphasized. Even though the earlier researchers have comparedthe performance appraisal of Tata Motors Ltd and Ashok Leyland Ltd, there has been no in-depth study is done on the Performance Appraisal on Automobile Industry with comparingAshok Leyland Ltd and Tata Motors Ltd.

Vol.3 No.1 January 2015 ISSN: 2320-4168
Shanlax International Journal of Commerce 96
Limitations of the StudyThe study covers a period of 5 years from 2008-09 to 2012-13. It does not consider
changes that have been taken place before and after the period. The calculations havebeen made on the basis of the figures provided in the published financial statements.Hence, the study is subject to inherent limitations of accounting practices. The study isconfined to the two companies alone and it does not compare with other similar type ofcompanies.
Research MethodologyThe present study is purely based on secondary data, i.e. Annual Reports of the
Ashok Leyland Ltd and Tata Motors Ltd. The data was for the period of 2008-09 to 2012-13.The collected data were analyzed by using the Ratio Analysis and some Statistical tools likeMean, Standard Deviation, Coefficient of Variation and Growth Rate were also used for thepurpose of the study.
Analysis and interpretation of Performance of FirmsTable - 1 revealed that out of the total composition of capital and liabilities, Share
capital, Reserves and Surplus together constitute more than 30 percent in Ashok LeylandLtd and for Tata Motors Ltd they constitute more than 25 percent. Long term loans, Currentliabilities and provisions together constitute more than 60 percent in Ashok Leyland Ltd andfor Tata Motors Ltd they constitute more than 70 Percent. Thus it shows that theShareholder’s fund is less than Outsider’s fund in both the companies. The Overall growthrate in Share capital, Reserves & surplus, Long term loans, Current liabilities and provisionsof Ashok Leyland Ltd is 100.01, 25.24, 50.98 and 147.17 percent respectively. In TataMotors Ltd is 24.13, 57.88, (-) 15.85 and 94.77 percent respectively. It is observed thatTata Motors Ltd has taken steps to reduce the Long term loans and liabilities whencompared to the year 2008-09 with 2012-13 and it shows a negative overall growth rate[15.85 percent].
Table - 2 shows that fixed assets of Ashok Leyland Ltd have been reduced to 45.59percent in 2012-13 from 56.12 percent in 2008-09 in the total composition of assets and inTata Motors Ltd there was in a fluctuating Trend. Current assets of Ashok Leyland Ltd weredeclined from 39.14 percent in 2008-09 to 32.81 percent in 2012-13 except in 2009-10 itwas 42.45 percent and in Tata Motors Ltd there was a mixed trend. Deposits, Loans &Advances of both the companies has increased from 4.75 percent in 2008-09 to 21.60percent in 2012-13 in Ashok Leyland Ltd and in Tata Motors Ltd 12.79 percent in 2008-09 to41.85 percent in 2012-13 and It has been observed that both the companies’ funds areconcentrated in Deposits, Loans & Advances than investing in Current and Fixed assets. TheOverall growth rate of Fixed assets, Deposits, Loans and Advances and Current assets inAshok Leyland Ltd was 35.78, 660.60 & 40.10 percent respectively and in Tata Motors Ltd

Vol.3 No.1 January 2015 ISSN: 2320-4168
Shanlax International Journal of Commerce 97
were 38.42, 358.39 & (-) 43.37 percent respectively. This shows that Tata Motors Ltd has toconsider their working capital position because the current assets was declined during2008-09 to 2012-13 by (-) 43.37 percent.
Table - 3 shows that the Capital Employed and Net worth of Ashok Leyland Ltd hasshowed a fluctuating trend. In Tata Motors Ltd it was increased till 2010-11 and thereafterit has been decreased. The overall growth rate in Capital Employed and Net worth were37.01 and 28.10 percent respectively in Ashok Leyland Ltd and in Tata Motors Ltd it was17.61 & 56.46 percent. Capital Employed is the value of the assets that contribute to acompany’s ability to generate revenues i.e. their liquidity. Both the company’s CapitalEmployed has been increased for the period of 5 years, which shows that they contributedmore on assets which generate revenues. Net worth in this formulation is not an expressionof the market value of the firm. The firm may be worth more (or less) if sold as a goingconcern. The overall growth rate of Net worth of both the companies indicates that thevalue of the company has been increased.
It is observed from the Table - 4 that sales of both the companies have increasedover the years except in the year 2012-13. Cost of goods sold of both the companiesincreased in a mixed trend except for Tata Motors Ltd in the year 2012-13 i.e. (-) 15.68percent decreased than that of the previous year. Gross profit and Net profit of AshokLeyland Ltd has increased till 2010-11 and thereafter it has been decreased in an increasingrate. In Tata Motors Ltd there was an increase till 2009-10 and thereafter decreased in anincreasing rate. The overall growth rate of Sales, Cost of goods sold, Gross profit and Netprofit in Ashok Leyland Ltd was 108.68, 113.57, (-) 18.38 and 128.27 percent and in TataMotors Ltd was 74.45, 92.17, (-) 77.57 and (-) 69.86 percent respectively. From the overallgrowth rate of both the companies it has been noted that there was no relationshipbetween the growth rate of Sales and Gross profit.
Table - 5 shows that the profitability ratios of both the companies. Thus the Grossprofit, Net profit, Return on Capital employed, Return on Share holders Networth andReturn on Total assets of Ashok Leyland Ltd was increased till 2010-11 and thereafterdeclined more in the year 2012-13. In Tata Motors Ltd the increases was only till 2009-10and thereafter decreased. So both the companies have to take action to reduce theexpenses and increase the income which will ultimately increases the profit. Mean of aparticular set of values results that Average of that value for a period of time. In AshokLeyland Ltd and Tata Motors Ltd the mean value of Gross profit, net profit, Return onCapital employed, Return on Shareholders Networth and Return on Total Assets are reducedmainly due to the decrease in 2012-13 as compared to other years. Co-efficient of Variationis used to measure the variances. Thus for both the companies of profitability ratios showslow variance because Co-efficient of Variance is less than one.
Table - 6 shows that liquidity and solvency ratios of the companies. Current ratios(2:1) and Quick ratio (1:1) of Ashok Leyland Ltd is below the ideal norms. Lower solvency

Vol.3 No.1 January 2015 ISSN: 2320-4168
Shanlax International Journal of Commerce 98
ratio shows that there is better solvency position in long term. Debt – Equity ratio of AshokLeyland Ltd shows that the debts are more than equity thus it is not a favourable situationfor creditors to claims their debts and also for the company to pay off the debts. AshokLeyland Ltd has to increases their Liquidity and Solvency position even more. Current ratioof Tata Motors Ltd was below the ideal norms (2:1). Quick ratio of Tata Motors Ltd wasabove the norms (1:1) till 2010-11 and there was a sudden decrease in 2011-12 and 2012-13. Lower Solvency ratio shows that there is better long term solvency position. Debt –Equity ratio shows that the debts are more than equity and it is not favourable to creditorsand company to pay off the debts. Mean of Current ratio for both the companies arebelow ideal norms and for Quick ratio of Ashok Leyland Ltd it is below the ideal norms andabove for Tata Motors Ltd. Mean of Solvency ratio for both the companies shows a betterSolvency position. Mean of Debt – Equity ratio of both the companies revealed that the debtis more than equity. Co-efficient of Variation of all the ratios of both the companies isfavourable and shows a stable position especially in the solvency ratio as variance is verylow.
Table - 7 shows that the turnover ratios of both the companies, Finished GoodsTurnover Ratio of Ashok Leyland Ltd shows a mixed trend and in Tata Motors Ltd there is anincreasing trend till 2011-12 (25.97 %) and thereafter decreased to 19.63 percent in theyear 2012-13. Raw Material Turnover Ratio of Ashok Leyland Ltd shows an increasing trendtill 2010-11 (10.51%) and thereafter decreased to 9.85 percent in 2011-12 (22.98 %) anddeclined to 19.84 percent in 2012-13. Fixed Assets Turnover Ratio of both the companiesincreased till 2011-12 and thereafter declined. Current Assets Turnover Ratio of AshokLeyland Ltd shows an increasing trend till 2011-12 (2.99 %) and thereafter decreased to2.90 percent in 2012-13. In Tata Motors Ltd shows an increasing trend except in 2009-10(1.20 %). Debtors Turnover Ratio of Ashok Leyland Ltd shows an increasing trend till 2011-12(10.49 %) and thereafter declined to 8.79 percent in 2012-13. In Tata Motors Ltd was inincreased trend except in 2009-10 (14.88 %). Mean of FGTR & RMTR for both the companiesshows a higher sales compare with the inventory it has with them. Mean of FATR & CATR ofboth the companies high ratio shows that less money was invested in Fixed Assets andCurrent Assets from the sales revenue. Mean of DTR of both the companies’ shows thatcredit collection system was good in both the companies. Co-efficient of Variation of all theEfficiency ratios of both the companies shows that there is not much variation and it isrevealed that both the companies are in stable position, especially in RMTR there was verylow variation.
Findings of the StudyThe major findings of the Study are;
The overall growth rate in long term loans liabilities of Tata Motors Ltd were (-)15.85 percent.
Vol.3 No.1 January 2015 ISSN: 2320-4168
Shanlax International Journal of Commerce 99
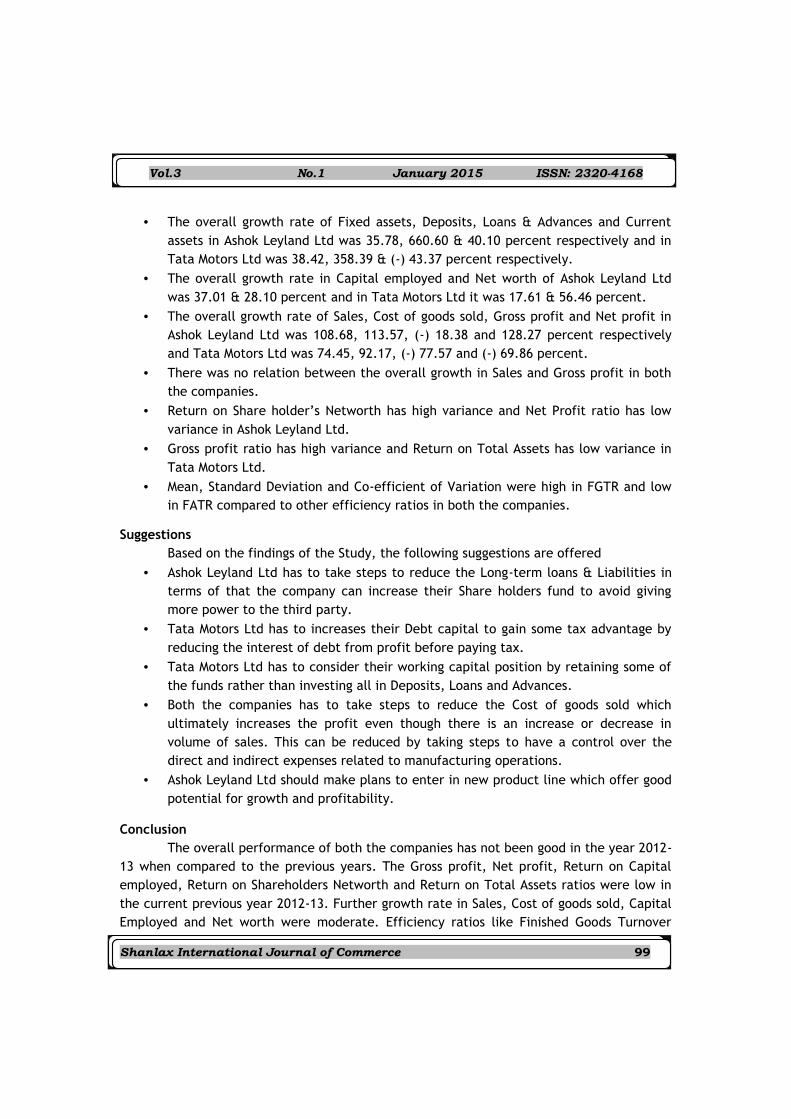
The overall growth rate of Fixed assets, Deposits, Loans & Advances and Currentassets in Ashok Leyland Ltd was 35.78, 660.60 & 40.10 percent respectively and inTata Motors Ltd was 38.42, 358.39 & (-) 43.37 percent respectively.
The overall growth rate in Capital employed and Net worth of Ashok Leyland Ltdwas 37.01 & 28.10 percent and in Tata Motors Ltd it was 17.61 & 56.46 percent.
The overall growth rate of Sales, Cost of goods sold, Gross profit and Net profit inAshok Leyland Ltd was 108.68, 113.57, (-) 18.38 and 128.27 percent respectivelyand Tata Motors Ltd was 74.45, 92.17, (-) 77.57 and (-) 69.86 percent.
There was no relation between the overall growth in Sales and Gross profit in boththe companies.
Return on Share holder’s Networth has high variance and Net Profit ratio has lowvariance in Ashok Leyland Ltd.
Gross profit ratio has high variance and Return on Total Assets has low variance inTata Motors Ltd.
Mean, Standard Deviation and Co-efficient of Variation were high in FGTR and lowin FATR compared to other efficiency ratios in both the companies.
SuggestionsBased on the findings of the Study, the following suggestions are offered
Ashok Leyland Ltd has to take steps to reduce the Long-term loans & Liabilities interms of that the company can increase their Share holders fund to avoid givingmore power to the third party.
Tata Motors Ltd has to increases their Debt capital to gain some tax advantage byreducing the interest of debt from profit before paying tax.
Tata Motors Ltd has to consider their working capital position by retaining some ofthe funds rather than investing all in Deposits, Loans and Advances.
Both the companies has to take steps to reduce the Cost of goods sold whichultimately increases the profit even though there is an increase or decrease involume of sales. This can be reduced by taking steps to have a control over thedirect and indirect expenses related to manufacturing operations.
Ashok Leyland Ltd should make plans to enter in new product line which offer goodpotential for growth and profitability.
ConclusionThe overall performance of both the companies has not been good in the year 2012-
13 when compared to the previous years. The Gross profit, Net profit, Return on Capitalemployed, Return on Shareholders Networth and Return on Total Assets ratios were low inthe current previous year 2012-13. Further growth rate in Sales, Cost of goods sold, CapitalEmployed and Net worth were moderate. Efficiency ratios like Finished Goods Turnover

Vol.3 No.1 January 2015 ISSN: 2320-4168
Shanlax International Journal of Commerce 100
Ratio, Raw Material Turnover Ratio, Debtor Turnover Ratio, Fixed and Current AssetsTurnover Ratio were up to the standards. Therefore, both the firm must try to improve theperformance by introducing various forms of internal reconstruction like alteration of sharecapital, reduction of share capital and writing off losing assets. In addition both the firmshould improve the management of working capital areas like Credit management,Inventory management to minimize the manufacturing and operating cost. The firm shouldalso adopt strategies of human resources management like right sizing to improve theproductivity and overall performance. In addition, the firm should look at the possibility ofmore External reconstruction to take advantages of large scale economies and to increasesthe competitiveness of the firm. Since the global market and economy is going throughdownturn all the company faces the economic crisis in the Automobile Industry butindividually Automobile Industry will shine in near future.
References Annual Reports of Ashok Leyland Ltd. Annual Reports of Tata Motors Ltd. Roy, T.S. 2006. Performance Appraisal of Oil and Natural Gas Corporation Limited,
The Journal of Business Studies, 3(6). Shiralashetti A.S. 2011. Performance Appraisal of the Gadag Co-operative Cotton
Textile Mill Ltd, Hulkoti – A Case Study, SMART Journal of Business ManagementStudies.
Suresh P. 2013. A Study on Performance Appraisal of Automobile Industries, AtChennai, Tamil nadu, International Journal of Marketing, Financial Services &Management Research,
2(5). Vipul B Patel 2013. A Comparative Study of Profitability Analysis of Tata Motors Ltd.
& Ashok Leyland Ltd, Indian Streams Research Journal, 3(4). Khan M.Y., Jain P.K., “Financial Management”, Tata McGraw Hill publishing
company Limited, New Delhi, 1987. Maheswari S.N., “Management Accounting and Fianancial Control”, Sultan Chand,
New Delhi, 1991. Shashi K. Gupta., R. K. Sharma., Anuj Gupta., “Management Accounting”, Kalyani
Publishers, New Delhi, 2010. R. S. N. Pillai., Bagavathi., “Statistics Theory and Practice”, S. Chand & Company
Ltd, New Delhi, 2007.

Vol.3 No.1 January 2015 ISSN: 2320-4168
Shanlax International Journal of Commerce 101

Vol.3 No.1 January 2015 ISSN: 2320-4168
Shanlax International Journal of Commerce 102

Vol.3 No.1 January 2015 ISSN: 2320-4168
Shanlax International Journal of Commerce 103

Vol.3 No.1 January 2015 ISSN: 2320-4168
Shanlax International Journal of Commerce 104