Embed Size (px)
Citation preview

Pearland Demographic Overview

U.S. Census population estimates pushed Pearland over the 100,000 mark
in 2013 with a population of 101,900 residents, with forecasted growth of
more than over 46,000 additional residents by 2040. From 2000 to 2010,
according to U.S. Census population �gures, Pearland’s population grew by
142% to 91,252. This ranked Pearland as the 15th fastest growing city in the
U.S. from 2000 to 2010 compared to other cities with a population of 10,000
or greater in 2000. Pearland has been the third largest and fastest growing
city in the Houston MSA since 2000.
Population
$20,000 $40,000 $60,000 $80,000 $100,000
0 5 10 15 20 25 30 35 40
35.234.2
32.531.0
35.333.9
33.532.0
33.932.4
37.435.3
$85,393
$65,024
$86,256
$51,289
$55,910
$50,740
$51,371
0
500
1,000
1,500
2,000
2,500
10 08 06 04 02
0
$50
$100
$150
$200
$250
2006-Present
2000-2005
Prior 2000
0
2
4
6
8
10
Historic Population
Average Sales Price Thousands
2% 4% 6%
Historical Unemployment
Multi-Family Development Construction Projects
08 06 04 02 10 08 06 04 02
0
1
2
3
4
5
6
0
$4
$8
$12
$16
$20
$24
Pearland Sales Tax TrendPearland Retail Space Trend
Single Family Permits
Median HH Income 2012
Median age 2000 and 2012
20,000 30,000 40,000 50,000
45,638
44,993
44,100
41,391
36,404
31,302
2.5% 5.0% 7.5% 10%
9.2%
7.8%
7.7%
6.7%
6.5%
6.0%
Retail Markets -
$25,000 $50,000 $75,000 $100,000
$89,113
$64,156
$42,565
Growth in Payroll Jobs
0
20,000
40,000
60,000
80,000
100,000091,252
10
96,665
12
101,900
13
82,903
08
71,320
06
59,594
04
51,540
02
37,640
00
18,927
90
13,248
80
6,444
70
02
1,430
04
2,102
06
2,072
$7.6
$10.2
$14.5
$18.7
$19.5
12
$22.4
2.462.65
3.57
5.68
10
09 08 07 10
5.73
12
5.73
08
1,207
10
722
12
951
98
502
00
818
$171.8$172.0
$194.9$201.9
$194.0
12
$193.0
7
8
6
Under Const.
2
Pearland
Houston
Brazoria County
Houston MSA
State of Texas
United States
0
Pearland
Brazoria County
Fort Bend County
Harris County
Houston MSA
State of Texas
United States
0
2010
2000
1990
0
2009 5.8%
2010 6.7%
2006 4.0%
2005 4.6%
2008 3.8%
2007 3.4%
0
2010
2009
2008
2007
2006
2005
Pearland
Sherman
McKinney
Midland
Frisco
Odessa
0
20,000
30,000
40,000
50,00045,638
49,54750,550
44,993
11 12
41,39144,100
0
2%
4%
6%
8%
His
toric
al U
nem
ploy
men
t
0
5.8%
3.8%
3.4%
09 08 07 10
6.5%6.5%
11
5.3%
12
25% 50% 75% 100% 125% 150%
142.4%
29.5%
65.1%
26.2%
20.6%
9.7%
Population Growth 2000-2010
0
Pearland
Brazoria County
Fort Bend County
Harris County
Houston MSA
State of Texas
United States
20.3%
Pearland Historical Population: 1970-2013Source: U.S. Census
MSA City Population Comparison: 2000-2013
2000 Population
2010 Population
2013 PopulationEstimate
Population Growth
2000 - 2013
Houston 1,953,631 2,099,451 2,208,653 13.1%
Pasadena 141,674 149,043 154,769 9.2%
Pearland 37,640 91,252 101,900 170.7%
The Woodlands 63,135 93,847 100,308 58.9%
League City 45,444 83,560 89,158 96.2%
Sugar Land 63,328 78,817 82,825 30.8%
Missouri City 52,913 67,358 70,401 33.1%
Source: U.S. Census/Nielsen/Claritas Demographic Data
$20,000 $40,000 $60,000 $80,000 $100,000
0 5 10 15 20 25 30 35 40
35.234.2
32.531.0
35.333.9
33.532.0
33.932.4
37.435.3
$85,393
$65,024
$86,256
$51,289
$55,910
$50,740
$51,371
0
500
1,000
1,500
2,000
2,500
10 08 06 04 02
0
$50
$100
$150
$200
$250
2006-Present
2000-2005
Prior 2000
0
2
4
6
8
10
Historic Population
Average Sales Price Thousands
2% 4% 6%
Historical Unemployment
Multi-Family Development Construction Projects
08 06 04 02 10 08 06 04 02
0
1
2
3
4
5
6
0
$4
$8
$12
$16
$20
$24
Pearland Sales Tax TrendPearland Retail Space Trend
Single Family Permits
Median HH Income 2012
Median age 2000 and 2012
20,000 30,000 40,000 50,000
45,638
44,993
44,100
41,391
36,404
31,302
2.5% 5.0% 7.5% 10%
9.2%
7.8%
7.7%
6.7%
6.5%
6.0%
Retail Markets -
$25,000 $50,000 $75,000 $100,000
$89,113
$64,156
$42,565
Growth in Payroll Jobs
0
20,000
40,000
60,000
80,000
100,000091,252
10
96,665
12
101,900
13
82,903
08
71,320
06
59,594
04
51,540
02
37,640
00
18,927
90
13,248
80
6,444
70
02
1,430
04
2,102
06
2,072
$7.6
$10.2
$14.5
$18.7
$19.5
12
$22.4
2.462.65
3.57
5.68
10
09 08 07 10
5.73
12
5.73
08
1,207
10
722
12
951
98
502
00
818
$171.8$172.0
$194.9$201.9
$194.0
12
$193.0
7
8
6
Under Const.
2
Pearland
Houston
Brazoria County
Houston MSA
State of Texas
United States
0
Pearland
Brazoria County
Fort Bend County
Harris County
Houston MSA
State of Texas
United States
0
2010
2000
1990
0
2009 5.8%
2010 6.7%
2006 4.0%
2005 4.6%
2008 3.8%
2007 3.4%
0
2010
2009
2008
2007
2006
2005
Pearland
Sherman
McKinney
Midland
Frisco
Odessa
0
20,000
30,000
40,000
50,00045,638
49,54750,550
44,993
11 12
41,39144,100
0
2%
4%
6%
8%
His
toric
al U
nem
ploy
men
t
0
5.8%
3.8%
3.4%
09 08 07 10
6.5%6.5%
11
5.3%
12
25% 50% 75% 100% 125% 150%
142.4%
29.5%
65.1%
26.2%
20.6%
9.7%
Population Growth 2000-2010
0
Pearland
Brazoria County
Fort Bend County
Harris County
Houston MSA
State of Texas
United States
20.3%
Population Growth: 2000-2010Source: H-GAC
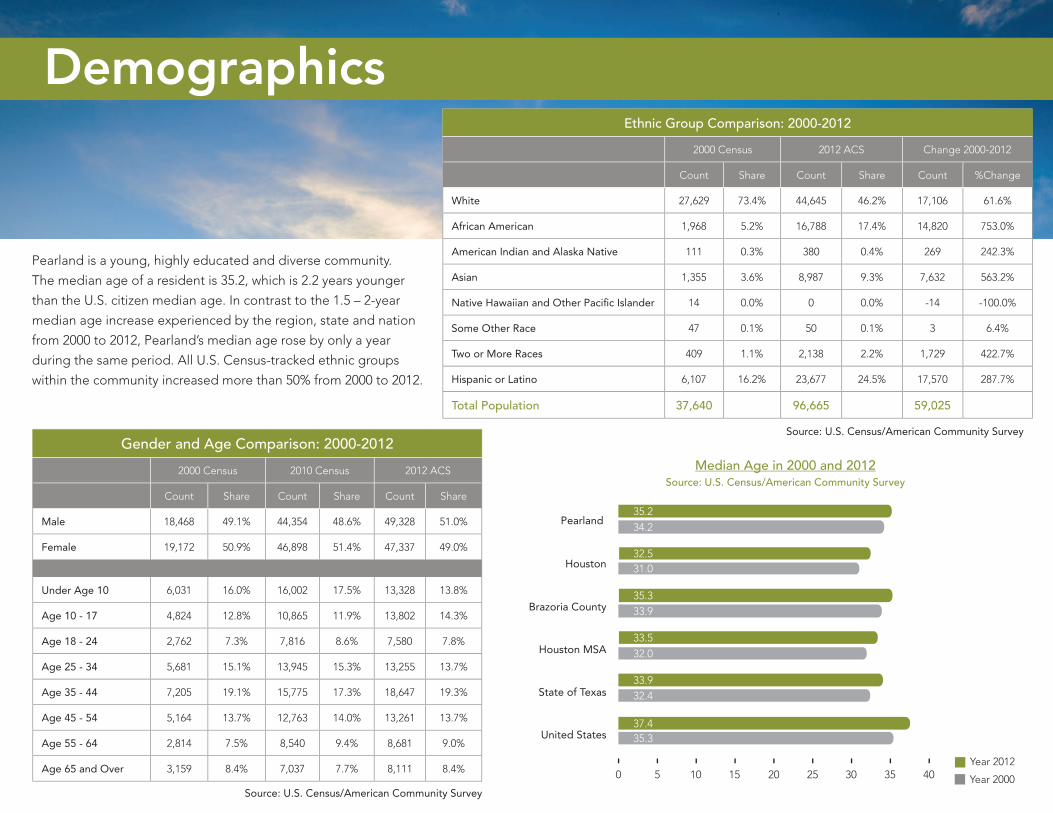
Ethnic Group Comparison: 2000-2012
2000 Census 2012 ACS Change 2000-2012
Count Share Count Share Count %Change
White 27,629 73.4% 44,645 46.2% 17,106 61.6%
African American 1,968 5.2% 16,788 17.4% 14,820 753.0%
American Indian and Alaska Native 111 0.3% 380 0.4% 269 242.3%
Asian 1,355 3.6% 8,987 9.3% 7,632 563.2%
Native Hawaiian and Other Paci�c Islander 14 0.0% 0 0.0% -14 -100.0%
Some Other Race 47 0.1% 50 0.1% 3 6.4%
Two or More Races 409 1.1% 2,138 2.2% 1,729 422.7%
Hispanic or Latino 6,107 16.2% 23,677 24.5% 17,570 287.7%
Total Population 37,640 96,665 59,025
Source: U.S. Census/American Community Survey Gender and Age Comparison: 2000-2012
2000 Census 2010 Census 2012 ACS
Count Share Count Share Count Share
Male 18,468 49.1% 44,354 48.6% 49,328 51.0%
Female 19,172 50.9% 46,898 51.4% 47,337 49.0%
Under Age 10 6,031 16.0% 16,002 17.5% 13,328 13.8%
Age 10 - 17 4,824 12.8% 10,865 11.9% 13,802 14.3%
Age 18 - 24 2,762 7.3% 7,816 8.6% 7,580 7.8%
Age 25 - 34 5,681 15.1% 13,945 15.3% 13,255 13.7%
Age 35 - 44 7,205 19.1% 15,775 17.3% 18,647 19.3%
Age 45 - 54 5,164 13.7% 12,763 14.0% 13,261 13.7%
Age 55 - 64 2,814 7.5% 8,540 9.4% 8,681 9.0%
Age 65 and Over 3,159 8.4% 7,037 7.7% 8,111 8.4%
Source: U.S. Census/American Community Survey
Pearland is a young, highly educated and diverse community.
The median age of a resident is 35.2, which is 2.2 years younger
than the U.S. citizen median age. In contrast to the 1.5 – 2-year
median age increase experienced by the region, state and nation
from 2000 to 2012, Pearland’s median age rose by only a year
during the same period. All U.S. Census-tracked ethnic groups
within the community increased more than 50% from 2000 to 2012.
Demographics
$20,000 $40,000 $60,000 $80,000 $100,000
0 5 10 15 20 25 30 35 40
35.234.2
32.531.0
35.333.9
33.532.0
33.932.4
37.435.3
$85,393
$65,024
$86,256
$51,289
$55,910
$50,740
$51,371
0
500
1,000
1,500
2,000
2,500
10 08 06 04 02
0
$50
$100
$150
$200
$250
2006-Present
2000-2005
Prior 2000
0
2
4
6
8
10
Historic Population
Average Sales Price Thousands
2% 4% 6%
Historical Unemployment
Multi-Family Development Construction Projects
08 06 04 02 10 08 06 04 02
0
1
2
3
4
5
6
0
$4
$8
$12
$16
$20
$24
Pearland Sales Tax TrendPearland Retail Space Trend
Single Family Permits
Median HH Income 2012
Median age 2000 and 2012
20,000 30,000 40,000 50,000
45,638
44,993
44,100
41,391
36,404
31,302
2.5% 5.0% 7.5% 10%
9.2%
7.8%
7.7%
6.7%
6.5%
6.0%
Retail Markets -
$25,000 $50,000 $75,000 $100,000
$89,113
$64,156
$42,565
Growth in Payroll Jobs
0
20,000
40,000
60,000
80,000
100,000091,252
10
96,665
12
101,900
13
82,903
08
71,320
06
59,594
04
51,540
02
37,640
00
18,927
90
13,248
80
6,444
70
02
1,430
04
2,102
06
2,072
$7.6
$10.2
$14.5
$18.7
$19.5
12
$22.4
2.462.65
3.57
5.68
10
09 08 07 10
5.73
12
5.73
08
1,207
10
722
12
951
98
502
00
818
$171.8$172.0
$194.9$201.9
$194.0
12
$193.0
7
8
6
Under Const.
2
Pearland
Houston
Brazoria County
Houston MSA
State of Texas
United States
0
Pearland
Brazoria County
Fort Bend County
Harris County
Houston MSA
State of Texas
United States
0
2010
2000
1990
0
2009 5.8%
2010 6.7%
2006 4.0%
2005 4.6%
2008 3.8%
2007 3.4%
0
2010
2009
2008
2007
2006
2005
Pearland
Sherman
McKinney
Midland
Frisco
Odessa
0
20,000
30,000
40,000
50,00045,638
49,54750,550
44,993
11 12
41,39144,100
0
2%
4%
6%
8%
His
toric
al U
nem
ploy
men
t
0
5.8%
3.8%
3.4%
09 08 07 10
6.5%6.5%
11
5.3%
12
25% 50% 75% 100% 125% 150%
142.4%
29.5%
65.1%
26.2%
20.6%
9.7%
Population Growth 2000-2010
0
Pearland
Brazoria County
Fort Bend County
Harris County
Houston MSA
State of Texas
United States
20.3%
Median Age in 2000 and 2012Source: U.S. Census/American Community Survey
Year 2012
Year 2000

Educational Attainment Compared to U.S. in 2012
Residents Over 25 Years Old Pearland U.S. Average
Less than 9th Grade 4.5% 5.8%
Some High School, No Diploma 7.4% 7.9%
High School Graduate (or GED) 7.4% 28.0%
Some College, No Degree 24.7% 21.3%
Associate Degree 6.7% 8.0%
Bachelor’s Degree 21.0% 18.2%
Graduate or Professional Degree 18.5% 10.9%
High School Graduate or Higher 88.1% 86.4%
Bachelor’s Degree or Higher 39.6% 29.1%
Source: American Community Survey
Pearland values academics, and high-quality education is a major reason
new residents move to Pearland. Most of the community’s public schools
earned the state’s “Exemplary” status. Residents have a wealth of choices
for higher education with more than 60 degree-granting institutions in the
region, including the University of Houston – Clear Lake Pearland campus.
Median household income doubled since 1990 and is 66% higher than
the national average. Even when adjusting for in�ation, Pearland median
household income has kept pace. Forty-one percent of households earn
more than $100,000 annually.
Education Income
39.6% Earned College Degrees (Bachelor’s Degree or Higher)
18.5% Hold Graduate or Professional Degrees
Median Household Income - Current Year DollarsSource: U.S. Census/American Community Survey
Median Household Income Comparison in 2012Source: U.S. Census/American Community Survey
$20,000 $40,000 $60,000 $80,000 $100,000
0 5 10 15 20 25 30 35 40
35.234.2
32.531.0
35.333.9
33.532.0
33.932.4
37.435.3
$85,393
$65,024
$86,256
$51,289
$55,910
$50,740
$51,371
0
500
1,000
1,500
2,000
2,500
10 08 06 04 02
0
$50
$100
$150
$200
$250
2006-Present
2000-2005
Prior 2000
0
2
4
6
8
10
Historic Population
Average Sales Price Thousands
2% 4% 6%
Historical Unemployment
Multi-Family Development Construction Projects
08 06 04 02 10 08 06 04 02
0
1
2
3
4
5
6
0
$4
$8
$12
$16
$20
$24
Pearland Sales Tax TrendPearland Retail Space Trend
Single Family Permits
Median HH Income 2012
Median age 2000 and 2012
20,000 30,000 40,000 50,000
45,638
44,993
44,100
41,391
36,404
31,302
2.5% 5.0% 7.5% 10%
9.2%
7.8%
7.7%
6.7%
6.5%
6.0%
Retail Markets -
$25,000 $50,000 $75,000 $100,000
$89,113
$64,156
$42,565
Growth in Payroll Jobs
0
20,000
40,000
60,000
80,000
100,000091,252
10
96,665
12
101,900
13
82,903
08
71,320
06
59,594
04
51,540
02
37,640
00
18,927
90
13,248
80
6,444
70
02
1,430
04
2,102
06
2,072
$7.6
$10.2
$14.5
$18.7
$19.5
12
$22.4
2.462.65
3.57
5.68
10
09 08 07 10
5.73
12
5.73
08
1,207
10
722
12
951
98
502
00
818
$171.8$172.0
$194.9$201.9
$194.0
12
$193.0
7
8
6
Under Const.
2
Pearland
Houston
Brazoria County
Houston MSA
State of Texas
United States
0
Pearland
Brazoria County
Fort Bend County
Harris County
Houston MSA
State of Texas
United States
0
2010
2000
1990
0
2009 5.8%
2010 6.7%
2006 4.0%
2005 4.6%
2008 3.8%
2007 3.4%
0
2010
2009
2008
2007
2006
2005
Pearland
Sherman
McKinney
Midland
Frisco
Odessa
0
20,000
30,000
40,000
50,00045,638
49,54750,550
44,993
11 12
41,39144,100
0
2%
4%
6%
8%
His
toric
al U
nem
ploy
men
t
0
5.8%
3.8%
3.4%
09 08 07 10
6.5%6.5%
11
5.3%
12
25% 50% 75% 100% 125% 150%
142.4%
29.5%
65.1%
26.2%
20.6%
9.7%
Population Growth 2000-2010
0
Pearland
Brazoria County
Fort Bend County
Harris County
Houston MSA
State of Texas
United States
20.3%

Estimated Job Base By Sector*
Sector 2000 2010 Change
Forestry, Fishing, Hunting, Mining, Utilities and Agriculture Support
257 187 -70
Construction 989 1,175 186
Manufacturing 847 1,410 563
Wholesale Trade 727 500 -227
Retail Trade 1,926 5,320 3,394
Transportation & Warehousing 273 300 27
Information 35 160 125
Finance & Insurance 276 580 304
Real Estate, Rental & Leasing 186 315 129
Professional, Scienti�c & Technical Services 330 840 510
Management of Companies & Enterprises 82 90 8
Admin, Support, Waste Mgt., Remediation Services 296 500 204
Educational Services 59 325 266
Health Care and Social Assistance 618 2,250 1,632
Arts, Entertainment & Recreation 233 460 227
Accommodation & Food Services 1,039 4,150 3,111
Other Services (Except Public Administration) 676 1,080 404
Unclassi�ed Establishments 24 6 -18
Source: U.S. Census Community Business Patterns
*Data for 77581 and 77584 Zip Codes
Pearland’s labor force and job base grew substantially with its population growth. The
number of jobs in the community more than doubled from 9,169 in 2000 to 20,584 in
2011. The total labor force that resides in the community increased from approximately
20,000 in 2000 to 50,550 in 2012. A majority of the community’s labor force commutes
daily into the Texas Medical Center and other employment centers in the region.
Pearland’s 77584 zip code is home to more Texas Medical Center employees than any
other zip code in the region.
Workforce
$20,000 $40,000 $60,000 $80,000 $100,000
0 5 10 15 20 25 30 35 40
35.234.2
32.531.0
35.333.9
33.532.0
33.932.4
37.435.3
$85,393
$65,024
$86,256
$51,289
$55,910
$50,740
$51,371
0
500
1,000
1,500
2,000
2,500
10 08 06 04 02
0
$50
$100
$150
$200
$250
2006-Present
2000-2005
Prior 2000
0
2
4
6
8
10
Historic Population
Average Sales Price Thousands
2% 4% 6%
Historical Unemployment
Multi-Family Development Construction Projects
08 06 04 02 10 08 06 04 02
0
1
2
3
4
5
6
0
$4
$8
$12
$16
$20
$24
Pearland Sales Tax TrendPearland Retail Space Trend
Single Family Permits
Median HH Income 2012
Median age 2000 and 2012
20,000 30,000 40,000 50,000
45,638
44,993
44,100
41,391
36,404
31,302
2.5% 5.0% 7.5% 10%
9.2%
7.8%
7.7%
6.7%
6.5%
6.0%
Retail Markets -
$25,000 $50,000 $75,000 $100,000
$89,113
$64,156
$42,565
Growth in Payroll Jobs
0
20,000
40,000
60,000
80,000
100,000091,252
10
96,665
12
101,900
13
82,903
08
71,320
06
59,594
04
51,540
02
37,640
00
18,927
90
13,248
80
6,444
70
02
1,430
04
2,102
06
2,072
$7.6
$10.2
$14.5
$18.7
$19.5
12
$22.4
2.462.65
3.57
5.68
10
09 08 07 10
5.73
12
5.73
08
1,207
10
722
12
951
98
502
00
818
$171.8$172.0
$194.9$201.9
$194.0
12
$193.0
7
8
6
Under Const.
2
Pearland
Houston
Brazoria County
Houston MSA
State of Texas
United States
0
Pearland
Brazoria County
Fort Bend County
Harris County
Houston MSA
State of Texas
United States
0
2010
2000
1990
0
2009 5.8%
2010 6.7%
2006 4.0%
2005 4.6%
2008 3.8%
2007 3.4%
0
2010
2009
2008
2007
2006
2005
Pearland
Sherman
McKinney
Midland
Frisco
Odessa
0
20,000
30,000
40,000
50,00045,638
49,54750,550
44,993
11 12
41,39144,100
0
2%
4%
6%
8%
His
toric
al U
nem
ploy
men
t
0
5.8%
3.8%
3.4%
09 08 07 10
6.5%6.5%
11
5.3%
12
25% 50% 75% 100% 125% 150%
142.4%
29.5%
65.1%
26.2%
20.6%
9.7%
Population Growth 2000-2010
0
Pearland
Brazoria County
Fort Bend County
Harris County
Houston MSA
State of Texas
United States
20.3%
Labor Force: 2007-2012Source: U.S. Bureau of Labor Statistics
$20,000 $40,000 $60,000 $80,000 $100,000
0 5 10 15 20 25 30 35 40
35.234.2
32.531.0
35.333.9
33.532.0
33.932.4
37.435.3
$85,393
$65,024
$86,256
$51,289
$55,910
$50,740
$51,371
0
500
1,000
1,500
2,000
2,500
10 08 06 04 02
0
$50
$100
$150
$200
$250
2006-Present
2000-2005
Prior 2000
0
2
4
6
8
10
Historic Population
Average Sales Price Thousands
2% 4% 6%
Historical Unemployment
Multi-Family Development Construction Projects
08 06 04 02 10 08 06 04 02
0
1
2
3
4
5
6
0
$4
$8
$12
$16
$20
$24
Pearland Sales Tax TrendPearland Retail Space Trend
Single Family Permits
Median HH Income 2012
Median age 2000 and 2012
20,000 30,000 40,000 50,000
45,638
44,993
44,100
41,391
36,404
31,302
2.5% 5.0% 7.5% 10%
9.2%
7.8%
7.7%
6.7%
6.5%
6.0%
Retail Markets -
$25,000 $50,000 $75,000 $100,000
$89,113
$64,156
$42,565
Growth in Payroll Jobs
0
20,000
40,000
60,000
80,000
100,000091,252
10
96,665
12
101,900
13
82,903
08
71,320
06
59,594
04
51,540
02
37,640
00
18,927
90
13,248
80
6,444
70
02
1,430
04
2,102
06
2,072
$7.6
$10.2
$14.5
$18.7
$19.5
12
$22.4
2.462.65
3.57
5.68
10
09 08 07 10
5.73
12
5.73
08
1,207
10
722
12
951
98
502
00
818
$171.8$172.0
$194.9$201.9
$194.0
12
$193.0
7
8
6
Under Const.
2
Pearland
Houston
Brazoria County
Houston MSA
State of Texas
United States
0
Pearland
Brazoria County
Fort Bend County
Harris County
Houston MSA
State of Texas
United States
0
2010
2000
1990
0
2009 5.8%
2010 6.7%
2006 4.0%
2005 4.6%
2008 3.8%
2007 3.4%
0
2010
2009
2008
2007
2006
2005
Pearland
Sherman
McKinney
Midland
Frisco
Odessa
0
20,000
30,000
40,000
50,00045,638
49,54750,550
44,993
11 12
41,39144,100
0
2%
4%
6%
8%
His
toric
al U
nem
ploy
men
t
0
5.8%
3.8%
3.4%
09 08 07 10
6.5%6.5%
11
5.3%
12
25% 50% 75% 100% 125% 150%
142.4%
29.5%
65.1%
26.2%
20.6%
9.7%
Population Growth 2000-2010
0
Pearland
Brazoria County
Fort Bend County
Harris County
Houston MSA
State of Texas
United States
20.3%
Historical Unemployment Rate: 2007-2012
Source: Texas Workforce Commission

Pearland features a variety of housing options. Since 2000, close to 18,000 new single-family homes and more than 5,000 multi-family units have been constructed in the community. Median home values rose 55% between 2000 and 2011, and the average sale price has remained steady around $200,000 since 2005.
Pearland Single-Family Home Permits: 1998-2012
Source: City of Pearland
$20,000 $40,000 $60,000 $80,000 $100,000
0 5 10 15 20 25 30 35 40
35.234.2
32.531.0
35.333.9
33.532.0
33.932.4
37.435.3
$85,393
$65,024
$86,256
$51,289
$55,910
$50,740
$51,371
0
500
1,000
1,500
2,000
2,500
10 08 06 04 02
0
$50
$100
$150
$200
$250
2006-Present
2000-2005
Prior 2000
0
2
4
6
8
10
Historic Population
Average Sales Price Thousands
2% 4% 6%
Historical Unemployment
Multi-Family Development Construction Projects
08 06 04 02 10 08 06 04 02
0
1
2
3
4
5
6
0
$4
$8
$12
$16
$20
$24
Pearland Sales Tax TrendPearland Retail Space Trend
Single Family Permits
Median HH Income 2012
Median age 2000 and 2012
20,000 30,000 40,000 50,000
45,638
44,993
44,100
41,391
36,404
31,302
2.5% 5.0% 7.5% 10%
9.2%
7.8%
7.7%
6.7%
6.5%
6.0%
Retail Markets -
$25,000 $50,000 $75,000 $100,000
$89,113
$64,156
$42,565
Growth in Payroll Jobs
0
20,000
40,000
60,000
80,000
100,000091,252
10
96,665
12
101,900
13
82,903
08
71,320
06
59,594
04
51,540
02
37,640
00
18,927
90
13,248
80
6,444
70
02
1,430
04
2,102
06
2,072
$7.6
$10.2
$14.5
$18.7
$19.5
12
$22.4
2.462.65
3.57
5.68
10
09 08 07 10
5.73
12
5.73
08
1,207
10
722
12
951
98
502
00
818
$171.8$172.0
$194.9$201.9
$194.0
12
$193.0
7
8
6
Under Const.
2
Pearland
Houston
Brazoria County
Houston MSA
State of Texas
United States
0
Pearland
Brazoria County
Fort Bend County
Harris County
Houston MSA
State of Texas
United States
0
2010
2000
1990
0
2009 5.8%
2010 6.7%
2006 4.0%
2005 4.6%
2008 3.8%
2007 3.4%
0
2010
2009
2008
2007
2006
2005
Pearland
Sherman
McKinney
Midland
Frisco
Odessa
0
20,000
30,000
40,000
50,00045,638
49,54750,550
44,993
11 12
41,39144,100
0
2%
4%
6%
8%
His
toric
al U
nem
ploy
men
t
0
5.8%
3.8%
3.4%
09 08 07 10
6.5%6.5%
11
5.3%
12
25% 50% 75% 100% 125% 150%
142.4%
29.5%
65.1%
26.2%
20.6%
9.7%
Population Growth 2000-2010
0
Pearland
Brazoria County
Fort Bend County
Harris County
Houston MSA
State of Texas
United States
20.3%
Pearland Average Home Sale Price: 2002-2012 (in thousands)
Source: HAR/MLS
Houston MSA Large City Comparison: 2000-2012
2000 Housing Units
2012Housing Units
Average AnnualHousing Unit
Growth
Pearland 13,895 35,359 12.87%
Houston 782,378 911,259 1.37%
The Woodlands 21,008 40,698 7.81%
Pasadena 50,229 54,585 0.72%
Sugar Land 21,159 27,712 2.58%
Missouri City 17,439 24,953 3.59%
League City 17,244 34,972 8.57%
Source: U.S. Census/American Community Survey
Housing

#1 in Texas among the top 50 retail markets for three consecutive years.
Recognized as Texas’ top-rated retail market for three years in a row, Pearland’s retail sector offers residents �rst-class shopping and dining experiences just minutes from home. From 2006 to 2011, Pearland was the only city to average more than 9% growth in retail sales. Prominent mixed-use lifestyle and shopping complexes – including Pearland Town Center, Shadow Creek Ranch Town Center, Silverlake Shopping Center and The Crossing at 288 – service residents with national retailers and dining establishments.
$20,000 $40,000 $60,000 $80,000 $100,000
0 5 10 15 20 25 30 35 40
35.234.2
32.531.0
35.333.9
33.532.0
33.932.4
37.435.3
$85,393
$65,024
$86,256
$51,289
$55,910
$50,740
$51,371
0
500
1,000
1,500
2,000
2,500
10 08 06 04 02
0
$50
$100
$150
$200
$250
2006-Present
2000-2005
Prior 2000
0
2
4
6
8
10
Historic Population
Average Sales Price Thousands
2% 4% 6%
Historical Unemployment
Multi-Family Development Construction Projects
08 06 04 02 10 08 06 04 02
0
1
2
3
4
5
6
0
$4
$8
$12
$16
$20
$24
Pearland Sales Tax TrendPearland Retail Space Trend
Single Family Permits
Median HH Income 2012
Median age 2000 and 2012
20,000 30,000 40,000 50,000
45,638
44,993
44,100
41,391
36,404
31,302
2.5% 5.0% 7.5% 10%
9.2%
7.8%
7.7%
6.7%
6.5%
6.0%
Retail Markets -
$25,000 $50,000 $75,000 $100,000
$89,113
$64,156
$42,565
Growth in Payroll Jobs
0
20,000
40,000
60,000
80,000
100,000091,252
10
96,665
12
101,900
13
82,903
08
71,320
06
59,594
04
51,540
02
37,640
00
18,927
90
13,248
80
6,444
70
02
1,430
04
2,102
06
2,072
$7.6
$10.2
$14.5
$18.7
$19.5
12
$22.4
2.462.65
3.57
5.68
10
09 08 07 10
5.73
12
5.73
08
1,207
10
722
12
951
98
502
00
818
$171.8$172.0
$194.9$201.9
$194.0
12
$193.0
7
8
6
Under Const.
2
Pearland
Houston
Brazoria County
Houston MSA
State of Texas
United States
0
Pearland
Brazoria County
Fort Bend County
Harris County
Houston MSA
State of Texas
United States
0
2010
2000
1990
0
2009 5.8%
2010 6.7%
2006 4.0%
2005 4.6%
2008 3.8%
2007 3.4%
0
2010
2009
2008
2007
2006
2005
Pearland
Sherman
McKinney
Midland
Frisco
Odessa
0
20,000
30,000
40,000
50,00045,638
49,54750,550
44,993
11 12
41,39144,100
0
2%
4%
6%
8%
His
toric
al U
nem
ploy
men
t
0
5.8%
3.8%
3.4%
09 08 07 10
6.5%6.5%
11
5.3%
12
25% 50% 75% 100% 125% 150%
142.4%
29.5%
65.1%
26.2%
20.6%
9.7%
Population Growth 2000-2010
0
Pearland
Brazoria County
Fort Bend County
Harris County
Houston MSA
State of Texas
United States
20.3%
Texas 50 Largest City Retail Markets Ranked by Annual Retail Sales Growth Rate: 2006-2011
Source: Texas Retail Survey, 2012
$20,000 $40,000 $60,000 $80,000 $100,000
0 5 10 15 20 25 30 35 40
35.234.2
32.531.0
35.333.9
33.532.0
33.932.4
37.435.3
$85,393
$65,024
$86,256
$51,289
$55,910
$50,740
$51,371
0
500
1,000
1,500
2,000
2,500
10 08 06 04 02
0
$50
$100
$150
$200
$250
2006-Present
2000-2005
Prior 2000
0
2
4
6
8
10
Historic Population
Average Sales Price Thousands
2% 4% 6%
Historical Unemployment
Multi-Family Development Construction Projects
08 06 04 02 10 08 06 04 02
0
1
2
3
4
5
6
0
$4
$8
$12
$16
$20
$24
Pearland Sales Tax TrendPearland Retail Space Trend
Single Family Permits
Median HH Income 2012
Median age 2000 and 2012
20,000 30,000 40,000 50,000
45,638
44,993
44,100
41,391
36,404
31,302
2.5% 5.0% 7.5% 10%
9.2%
7.8%
7.7%
6.7%
6.5%
6.0%
Retail Markets -
$25,000 $50,000 $75,000 $100,000
$89,113
$64,156
$42,565
Growth in Payroll Jobs
0
20,000
40,000
60,000
80,000
100,000091,252
10
96,665
12
101,900
13
82,903
08
71,320
06
59,594
04
51,540
02
37,640
00
18,927
90
13,248
80
6,444
70
02
1,430
04
2,102
06
2,072
$7.6
$10.2
$14.5
$18.7
$19.5
12
$22.4
2.462.65
3.57
5.68
10
09 08 07 10
5.73
12
5.73
08
1,207
10
722
12
951
98
502
00
818
$171.8$172.0
$194.9$201.9
$194.0
12
$193.0
7
8
6
Under Const.
2
Pearland
Houston
Brazoria County
Houston MSA
State of Texas
United States
0
Pearland
Brazoria County
Fort Bend County
Harris County
Houston MSA
State of Texas
United States
0
2010
2000
1990
0
2009 5.8%
2010 6.7%
2006 4.0%
2005 4.6%
2008 3.8%
2007 3.4%
0
2010
2009
2008
2007
2006
2005
Pearland
Sherman
McKinney
Midland
Frisco
Odessa
0
20,000
30,000
40,000
50,00045,638
49,54750,550
44,993
11 12
41,39144,100
0
2%
4%
6%
8%
His
toric
al U
nem
ploy
men
t
0
5.8%
3.8%
3.4%
09 08 07 10
6.5%6.5%
11
5.3%
12
25% 50% 75% 100% 125% 150%
142.4%
29.5%
65.1%
26.2%
20.6%
9.7%
Population Growth 2000-2010
0
Pearland
Brazoria County
Fort Bend County
Harris County
Houston MSA
State of Texas
United States
20.3%
Pearland Sales Tax Trend: 2002-2012(in millions)
Source: Texas Comptroller
$20,000 $40,000 $60,000 $80,000 $100,000
0 5 10 15 20 25 30 35 40
35.234.2
32.531.0
35.333.9
33.532.0
33.932.4
37.435.3
$85,393
$65,024
$86,256
$51,289
$55,910
$50,740
$51,371
0
500
1,000
1,500
2,000
2,500
10 08 06 04 02
0
$50
$100
$150
$200
$250
2006-Present
2000-2005
Prior 2000
0
2
4
6
8
10
Historic Population
Average Sales Price Thousands
2% 4% 6%
Historical Unemployment
Multi-Family Development Construction Projects
08 06 04 02 10 08 06 04 02
0
1
2
3
4
5
6
0
$4
$8
$12
$16
$20
$24
Pearland Sales Tax TrendPearland Retail Space Trend
Single Family Permits
Median HH Income 2012
Median age 2000 and 2012
20,000 30,000 40,000 50,000
45,638
44,993
44,100
41,391
36,404
31,302
2.5% 5.0% 7.5% 10%
9.2%
7.8%
7.7%
6.7%
6.5%
6.0%
Retail Markets -
$25,000 $50,000 $75,000 $100,000
$89,113
$64,156
$42,565
Growth in Payroll Jobs
0
20,000
40,000
60,000
80,000
100,000091,252
10
96,665
12
101,900
13
82,903
08
71,320
06
59,594
04
51,540
02
37,640
00
18,927
90
13,248
80
6,444
70
02
1,430
04
2,102
06
2,072
$7.6
$10.2
$14.5
$18.7
$19.5
12
$22.4
2.462.65
3.57
5.68
10
09 08 07 10
5.73
12
5.73
08
1,207
10
722
12
951
98
502
00
818
$171.8$172.0
$194.9$201.9
$194.0
12
$193.0
7
8
6
Under Const.
2
Pearland
Houston
Brazoria County
Houston MSA
State of Texas
United States
0
Pearland
Brazoria County
Fort Bend County
Harris County
Houston MSA
State of Texas
United States
0
2010
2000
1990
0
2009 5.8%
2010 6.7%
2006 4.0%
2005 4.6%
2008 3.8%
2007 3.4%
0
2010
2009
2008
2007
2006
2005
Pearland
Sherman
McKinney
Midland
Frisco
Odessa
0
20,000
30,000
40,000
50,00045,638
49,54750,550
44,993
11 12
41,39144,100
0
2%
4%
6%
8%
His
toric
al U
nem
ploy
men
t
0
5.8%
3.8%
3.4%
09 08 07 10
6.5%6.5%
11
5.3%
12
25% 50% 75% 100% 125% 150%
142.4%
29.5%
65.1%
26.2%
20.6%
9.7%
Population Growth 2000-2010
0
Pearland
Brazoria County
Fort Bend County
Harris County
Houston MSA
State of Texas
United States
20.3%
Pearland Retail Space Trend: 2002-2012 (square feet in millions)
Source: O’Connor & Associates
Retail

WWW.PEARLANDEDC.COMTHE BEST BUSINESS OPPORTUNITY IS DUE SOUTH.
1200 PEARLAND PARKWAY, SUITE 200; PEARLAND, TEXAS 77581 281.997.3000
PEARLAND
William P. Hobby Airport
George BushIntercontinental Airport
Port of Houston
Downtown HoustonMedical
Center
Data compiled by CDS Marketing Research - July 2013