Embed Size (px)
Citation preview

The Florida LegislatureOffice of Economic and
Demographic Research850.487.1402http://edr.state.fl.us
Presented by:
Florida Demographic Overview
Enterprise FloridaJune 14, 2007

June 14, 2007Page 1
EconomyFlorida remains one of the nation’s faster growing states.
The latest forecast shows the economy expanding at a more modest pace, much slower than the 2004-05 banner year.
Population growth continues to be the state’s primary engine of economic growth, fueling both employment and income growth.

June 14, 2007Page 2
PopulationPopulation growth has hovered between 2.0% and 2.6%, since the mid 1990’s. Over the forecast horizon, population growth will slow – averaging just 1.1% between 2025 and 2030.
Florida is on track to break the 20 million mark and become the third most populous state – surpassing New York – shortly after 2010.
In the next decade, almost one-half (46%) of U.S. population growth will come form three states: California, Texas and Florida.

June 14, 2007Page 3
Florida’s April 1 Population
Florida’s population:was 15,982,824 in 2000was 18,349,132 in 2006is forecast to grow to 26,513,331 by 2030
200618,349,132
200015,982,824
203026,513,331
4,800,000
9,800,000
14,800,000
19,800,000
24,800,000
29,800,000
1970 1975 1980 1985 1990 1995 2000 2005 2010 2015 2020 2025 2030

June 14, 2007Page 4
Florida’s Population Growth
Population increased by:402,580 between 1999 and 2000430,905 between 2005 and 2006
Population is forecast to increase on average by:344,125 between 2015 and 2020285,472 between 2025 and 2030
1999-2000402,580
2005-2006430,905
annual av eragegrow th 2025-2030
285,472
0
100,000
200,000
300,000
400,000
500,000
600,000
1970 1975 1980 1985 1990 1995 2000 2005 2010 2015 2020 2025 2030
June 14, 2007Page 5
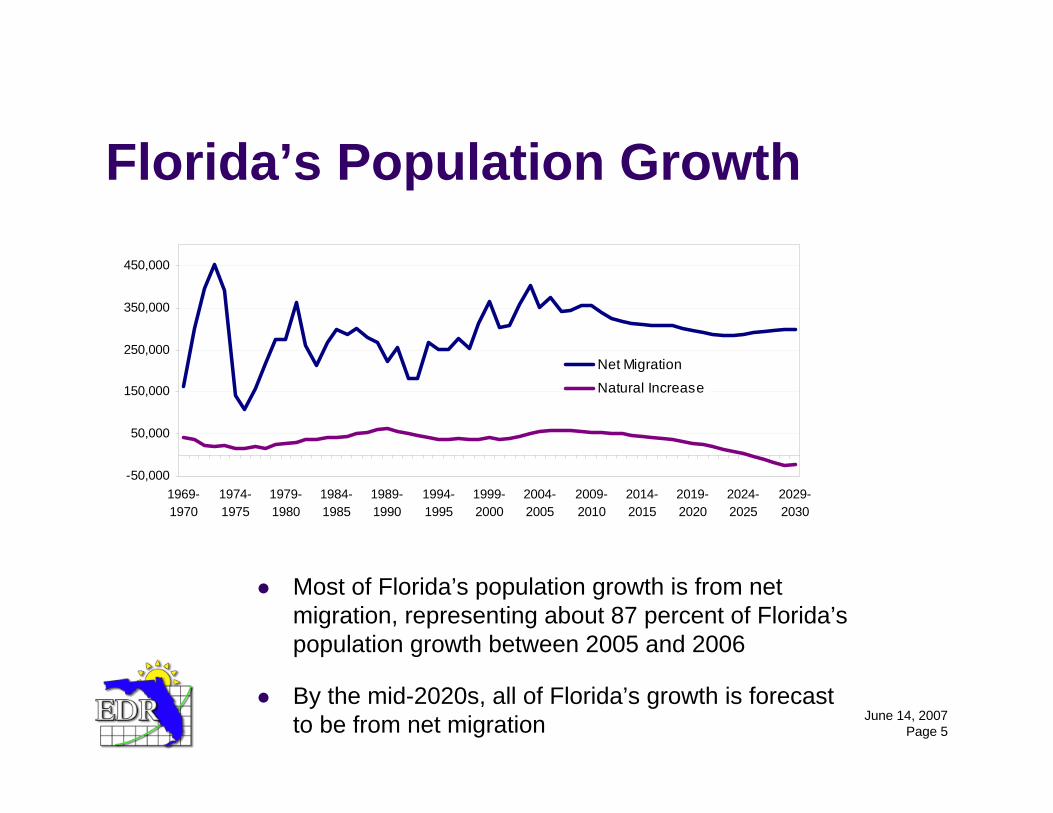
Florida’s Population Growth
Most of Florida’s population growth is from net migration, representing about 87 percent of Florida’s population growth between 2005 and 2006
By the mid-2020s, all of Florida’s growth is forecast to be from net migration
-50,000
50,000
150,000
250,000
350,000
450,000
1969-1970
1974-1975
1979-1980
1984-1985
1989-1990
1994-1995
1999-2000
2004-2005
2009-2010
2014-2015
2019-2020
2024-2025
2029-2030
Net Migration
Natural Increase

June 14, 2007Page 6
Net Migration by County(April 1, 2000 to April 1, 2006)
Statewide, net migration accounted for 88.7% of the population growth between April 1, 2000 and April 1, 2006.
There were 22 counties in the state, where all the growth between April 1, 2000 and April 1, 2006 has been due to net migration.

June 14, 2007Page 7
2030
In 2000, females slightly outnumbered males in the state
This relationship is forecast to remain relatively constant through 2030
Florida’s Population by Gender
Male48.8%
Female51.2%

June 14, 2007Page 8
Median Age of Floridians(April 1, 2005)
The median age of Florida residents was estimated at 39.7years as of April 1, 2005.
There were 3 counties with a median age below 30: Alachua (29.2), Leon (29.5), and Hendry (29.5).
There were 4 counties with a median age of 50 and older: Charlotte (54.3), Citrus (53.5), Sarasota (51.7), and Highlands (50.5).

June 14, 2007Page 9
0
500,000
1,000,000
1,500,000
2,000,000
2,500,000
3,000,000
3,500,000
4,000,000
4,500,000
0-17 18-29 30-39 40-49 50-59 60-69 70-79 80+
age group
Population by Age Group
April 1, 2006
As of April 1, 2006, it was estimated that there were:4.1 million Floridians under the age of 182.7 million Floridians between 18 and 292.7 million Floridians in their 40s2.4 million Floridians in their 50s2.3 million Floridians in their 30s1.7 million Floridians in their 60s1.4 million Floridians in their 70sjust under 1 million Floridians 80 or older

June 14, 2007Page 10
0.0%
5.0%
10.0%
15.0%
20.0%
25.0%
0-17 18-29 30-39 40-49 50-59 60-69 70-79 80+
age group
Percent of Population Growth by Age Group
April 1, 2006 to April 1, 2030
Between 2006 and 2030, Florida’s population is forecast to grow by over 8 million
Florida’s older population (age 60 and older) will account for most of Florida’s population growth, representing 55.3 percent of the gains
Florida’s younger population (age 0-17) will account for 14 percent of the gains

June 14, 2007Page 11
In 2000, Florida’s prime working age population (ages 25-54) accounted for 41.5 percent of total population. With the aging baby boom generation, this percentage is estimated to have fallen to 40.2 percent in 2006 and by 2030 is projected to represent 34.1 percent
Population aged 65 and over is forecast to represent 26.1 percent in 2030, compared to 17.6 percent in 2000 and 16.9 percent in 2006
8 7 6 5 4 3 2 1 0 1 2 3 4 5 6 7 8
0 - 4 5 - 9
10 - 14
15 - 1920 - 24
25 - 2930 - 34
35 - 39
40 - 4445 - 49
50 - 54
55 - 5960 - 64
65 - 6970 - 74
75 - 79
80 - 84 85+
8 7 6 5 4 3 2 1 0 1 2 3 4 5 6 7 8
0 - 4 5 - 9
10 - 14
15 - 1920 - 24
25 - 2930 - 34
35 - 39
40 - 4445 - 49
50 - 54
55 - 5960 - 64
65 - 6970 - 74
75 - 79
80 - 84 85+
2000 2006 2006 2030
Percent of Total Population by Age Group
percent percent

June 14, 2007Page 12
School-Age Population and Public School Enrollment
-2.0%
-1.0%
0.0%
1.0%
2.0%
3.0%
4.0%
5.0%
6.0%
7.0%
1960 1970 1980 1990 2000 2010 2020 2030
Perc
ent C
hang
e
Population Age 5 to 17
Public School Enrollment
Florida’s school-age population (ages 5-17) currently represents about 16.5% of the total population. This age group is forecast to represent 14.7% of total population by 2030.
School-age population has been slowing in growth, but is not expected to decline over the forecast horizon.
Growth in public school enrollment has slowed from a recent peak of 2.8% in 2001 to a decline of 0.4% in 2006.

June 14, 2007Page 13
Florida’s Population by Race
White20,647,648
78.2%
Other988,726
3.7%Black or African
American4,782,792
18.1%
White14,785,711
80.7%
Black or African American3,030,506
16.5%
Other505,451
2.8%
White13,132,438
82.2%
Black or African American2,468,576
15.4%
Other381,810
2.4%
In 2006, Florida’s population was estimated to be 80.7 percent White and 16.5 percent Black or African American
Florida is forecast to be 78.2 percent White and 18.1 percent Black or African American in 2030
20062000
2030

June 14, 2007Page 14
Florida’s Hispanic Population
16.8%19.1% 19.6%
20.9%22.3%
23.5% 24.4% 25.1%
0.0%
5.0%
10.0%
15.0%
20.0%
25.0%
30.0%
2000 2005 2006 2010 2015 2020 2025 2030
Currently Hispanics represent about 19.6 percent of Florida’s population
Florida will become increasingly more Hispanic; as Hispanics are forecast to represent just over 25 percent of Florida’s population in 2030

June 14, 2007Page 15
Language and Foreign Born
In 2005, over 4.1 million Floridians (age 5 or older) did not speak only English at home; 1 million of which spoke English “not well” or “not at all”. If this relationship continues, by 2030, over 6.4 million Floridians (age 5 or older) will speak another language possibly in addition to English at home, of which almost 1.6 million will speak English “not well” or “not at all”.
In 2005, 18.7% of Florida’s household population was foreign born.
Floridians in households(age 5 or older)
2005Total 16,270,161
Speak only English 12,141,842Speak another Language 4,128,319
Speak English “very well” 2,271,250Speak English “well” 820,066Speak English “not well” 664,748Speak English “not at all” 372,255
Language Spoken at Home

June 14, 2007Page 16
Florida’s County Population34 of Florida’s 67 counties have a population of less than 100,000
The top 7 counties make up 52% of Florida’s total population 25Under 50,000
950,000 to 99,99911100,000 to 249,999
11250,000 to 499,9996500,000 to 999,9995One million or more
Number of Florida Counties
April 1, 2006Population

June 14, 2007Page 17
Population GrowthApril 1, 2000 - April 1, 2006
Counties Gaining the Most PopulationMiami-Dade 183,243Orange 183,180Hillsborough 165,477Palm Beach 156,796Lee 144,720

June 14, 2007Page 18
Population Growth RateApril 1, 2000 - April 1, 2006
Counties Growing the FastestFlagler 78.8%Sumter 54.8%Osceola 48.4%Walton 37.4%St. Lucie 34.6%

June 14, 2007Page 19
Personal Income
Personal IncomeFlorida(000s)
Per Capita Income Florida
2000 $457,539,355 2000 28,507
2001 $478,637,023 2001 29,266
Change 2000-01 4.6% Change 2000-01 2.7%
2002 $495,489,345 2002 29,702
Change 2001-02 3.5% Change 2001-02 1.5%
2003 $514,377,645 2003 30,290
Change 2002-03 3.8% Change 2002-03 2.0%
2004 $564,997,468 2004 32,534
Change 2003-04 9.8% Change 2003-04 7.4%
2005 $604,131,000 2005 34,001
Change 2004-05 6.9% Change 2004-05 4.5%
2006p $647,582,667 2006p 35,798
Change 2005-06p 7.2% Change 2005-06p 5.3%
p=preliminary

June 14, 2007Page 20
Employment Breakdown
Average Annual Employment,% by Category, 2005 Florida Average Annual Wage, 2005 Florida
All Industries $36,804
Natural Resources and Mining 1.3% Natural Resources and Mining $22,841
Construction 7.5% Construction $38,284
Manufacturing 5.2% Manufacturing $43,409
Trade, Transportation, and Utilities 20.1% Trade, Transportation, and Utilities $33,950
Information 2.2% Information $52,849
Financial Activities 6.8% Financial Activities $52,659
Professional and Business Services 17.1% Professional and Business Services $39,390
Education and Health Services 11.7% Education and Health Services $38,322
Leisure and Hospitality 11.4% Leisure and Hospitality $19,303
Other Services 3.1% Other Services $25,768
Government 13.6% Government $41,272

June 14, 2007Page 21
Baby Boom Cohort
Birth Cycle: 1946 – 1964Entry into the Workforce: 1967 – 1985Entry into Retirement: 2011 – 2029
2050

June 14, 2007Page 22
Global TrendsBy 2025, the world will be:
Much Older (the US will largely look like FL today)Far Less CaucasianFar More Concentrated in Urban Areas
The aging population is a function of:The Baby Boom CohortFalling Fertility RatesRising Longevity (life expectancy)

June 14, 2007Page 23
National TrendsThe ratio of taxpaying workers to retirees will fall:
Today, 4:150 Years from Now, 3:1 (Florida, 2:1)
Labor force contraction could depress economic output and boost inflation (GNP...1.5% Growth)Attracting migration from countries which have greater youth populations will become an important relief valve for worker shortagesIncentive programs to keep workers in the workforce longer will also be important

June 14, 2007Page 24
Florida Challenges
Aging StateAging State – more intense in Florida than elsewhere because population share (26.1% in 2030)Growing StateGrowing State – all of the same problems as we’ve had in the past, only more so
Greater Need for ServicesAllocation of Increasingly Scarce Natural Resources (especially water)Provision of Needed Infrastructure (new and replaced)