Embed Size (px)
Citation preview
Waushara Waushara COUNTYCOUNTY
DEMOGRAPHIC OVERVIEW
2008
Waushara County

Geography, Human Activity 18 Towns, 6 Villages,
& 1¼ Cities “1/3, 1/3, 1/3”
Central Wisconsin 626 square miles

Population, Race, and Ethnicity Trends
Official 2007 Population Estimate: 25,215 Wisconsin Department of Administration
Estimated 2007 Seasonal Population: 44,371 Estimates calculated by Patrick Nehring, UW-Extension Waushara County using
U.S. Census, Wisconsin Department of Administration, and local data
2007 Migrant Worker Population, includes workers and family members: 561 Bureau of Migrant, Refugee, and Labor Services
Estimated 2020 Population: 27,726 Wisconsin Department of Administration
Population, Race, and Ethnicity Trends
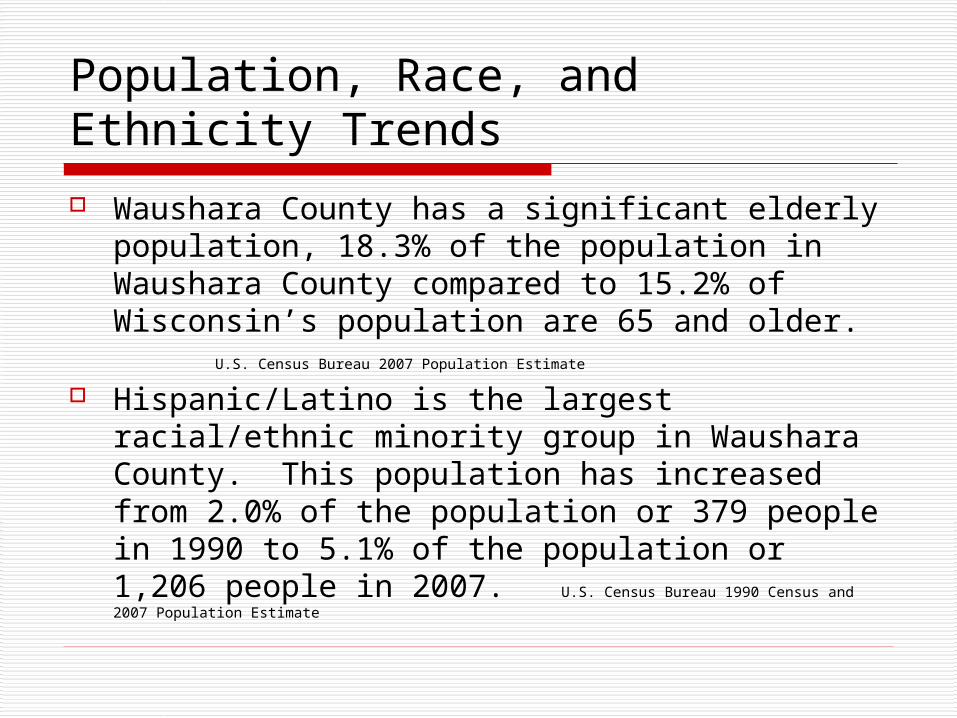
Waushara County has a significant elderly population, 18.3% of the population in Waushara County compared to 15.2% of Wisconsin’s population are 65 and older. U.S. Census Bureau 2007 Population Estimate
Hispanic/Latino is the largest racial/ethnic minority group in Waushara County. This population has increased from 2.0% of the population or 379 people in 1990 to 5.1% of the population or 1,206 people in 2007. U.S. Census Bureau 1990 Census and 2007 Population Estimate


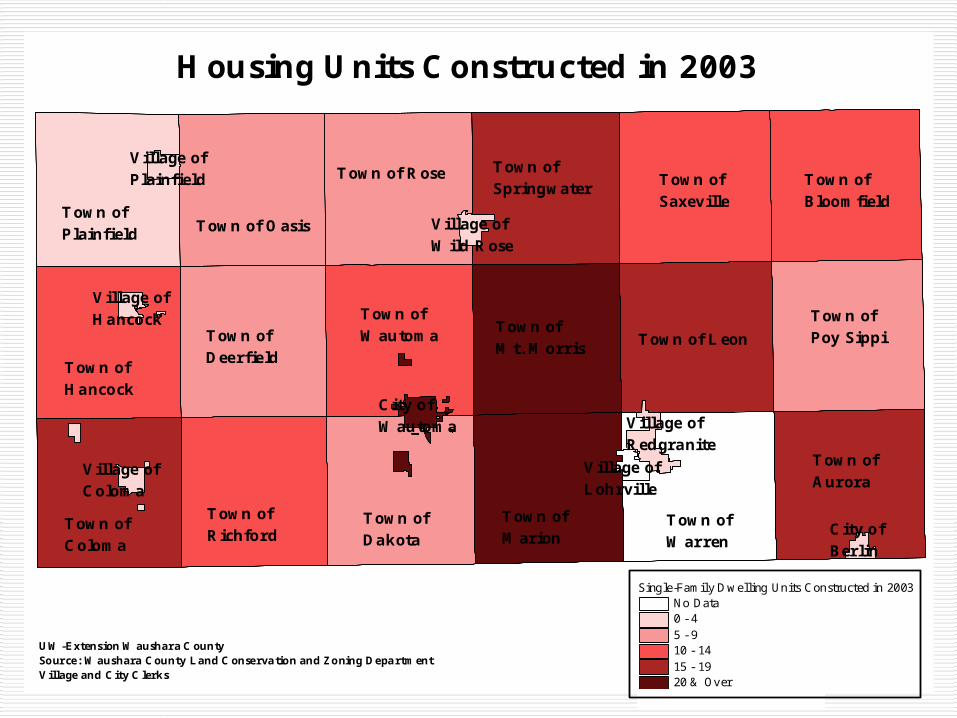
UW-Extension Waushara CountySource: Waushara County Land Conservation and Zoning DepartmentVillage and City Clerks
Labels
Single-Family Dwelling Units Constructed in 2003 No Data0 - 45 - 910 - 1415 - 1920 & Over
Housing Units Constructed in 2003
Town of Leon
Town of Rose
Town of Oasis
Town ofMarion
Town of Aurora
Town ofDakota
Town ofColoma
Town ofHancock
Town ofSaxeville
Town ofRichford
Town ofWarren
Town ofDeerfield
Town ofWautoma
Town ofSpringwater
Town ofMt. Morris
City ofWautoma Village of
Redgranite
Village ofWild Rose
Village of Plainfield
City ofBerlin
Village ofColoma
Village ofHancock Town of
Poy Sippi
Town ofBloomfield
Town of Plainfield
Village ofLohrville

UW-Extension Waushara CountySource: Wisconsin Department of Administration
Labels
2010 Population Projection1 - 500501 - 10001001 - 15001501 - 20002001 - 4000
Waushara County 2010 Population
Town of Leon
Town of Rose
Town of Oasis
Town ofMarion
Town of Aurora
Town ofDakota
Town ofColoma
Town ofHancock
Town ofSaxeville
Town ofRichford
Town ofWarren
Town ofDeerfield
Town ofWautoma
Town ofSpringwater
Town ofMt. Morris
City ofWautoma Village of
Redgranite
Village ofWild Rose
Village of Plainfield
City ofBerlin
Village ofColoma
Village ofHancock Town of
Poy Sippi
Town ofBloomfield
Town of Plainfield
Village ofLohrville


Number of Migrant Workers, Their Spouses, and Their Children
96
9
10
64
10
96
80
5
94
0
87
5
85
5
99
6
75
2
58
4
56
1
47
39
45
18
45
87
44
05
47
83
46
66
40
32
43
43
42
50
40
14
40
02
0
1000
2000
3000
4000
5000
1996 1998 2000 2002 2004 2006
All OtherWisconsinCounties
WausharaCounty
Source: Bureau of Migrant, Refugee, and Labor Services

Population by Race
American Indian (121)
Asian (108)
Black (181)
Pacific I slander (7)
White (24,151)
2 or More Races (198)
Source: U.S. Census Bureau 2007 Estimates

Population by Ethnicity
5%
95%
Hispanic (1,260)
Non-Hispanic(23,506)
Source: U.S. Census Bureau 2007 Estimates

Town of Leon2 B lack0 Asian0 Native American6 Multi-Racial1261 White6 Hispanic/Latino
Town of Rose0 B lack0 Asian2 Native American0 Multi-Racial550 White36 Hispanic/Latino
Town of Oasis0 B lack0 Asian0 Native American0 Multi-Racial400 White10 Hispanic/Latino
Town of Marion0 B lack2 Asian19 Native American14 Multi-Racial1978 White34 Hispanic/Latino
Town of Dakota3 B lack5 Asian5 Native American3 Multi-Racial1169 White59 Hispanic/Latino
Town of Aurora8 B lack0 Asian5 Native American2 Multi-Racial951 White18 Hispanic/Latino
Town of Coloma0 B lack0 Asian0 Native American2 Multi-Racial685 White6 Hispanic/Latino
Town of Saxeville0 B lack0 Asian1 Native American11 Multi-Racial954 White6 Hispanic/Latino
Town of Hancock0 B lack2 Asian0 Native American20 Multi-Racial517 White3 Hispanic/Latino
Town of Richford0 B lack0 Asian0 Native American0 Multi-Racial551 White19 Hispanic/Latino
Town of Warren0 B lack0 Asian0 Native American8 Multi-Racial637 White8 Hispanic/Latino
Town of Wautoma4 B lack18 Asian4 Native American18 Multi-Racial1305 White3 Hispanic/Latino
Town of Deerfield0 B lack4 Asian0 Native American0 Multi-Racial639 White2 Hispanic/Latino
Town of Plainfield0 B lack0 Asian0 Native American0 Multi-Racial489 White80 Hispanic/Latino
Town of Springwater0 B lack0 Asian3 Native American8 Multi-Racial954 White10 Hispanic/Latino
Town of Mt Morris0 B lack0 Asian0 Native American6 Multi-Racial1102 White11 Hispanic/Latino
City of Wautoma6 B lack10 Asian18 Native American3 Multi-Racial1745 White176 Hispanic/Latino
Village of Redgranite0 B lack0 Asian13 Native American38 Multi-Racial960 White60 Hispanic/Latino
Village of Wild Rose0 B lack0 Asian0 Native American9 Multi-Racial769 White12 Hispanic/Latino
Village of Plainfield0 B lack0 Asian2 Native American0 Multi-Racial693 White163 Hispanic/Latino
City of B erlin0 B lack0 Asian0 Native American0 Multi-Racial68 White0 Hispanic/Latino
Village of Coloma0 B lack0 Asian3 Native American0 Multi-Racial475 White9 Hispanic/Latino
Village of Hancock0 B lack0 Asian8 Native American8 Multi-Racial453 White32 Hispanic/Latino
Town of Poy Sippi0 B lack2 Asian3 Native American13 Multi-Racial950 White11 Hispanic/Latino
Town of Bloomfield0 B lack0 Asian2 Native American10 Multi-Racial1003 White2 Hispanic/Latino
Village of Lohrville0 B lack0 Asian0 Native American2 Multi-Racial412 White7 Hispanic/Latino
Waushara County 2000 Population by Race or Hispanic/Latino Ethnicity
# of Hispanic / Latino People0 - 1011 - 2526 - 5051 - 100Over 100
UW-Extension Waushara CountyData Source: U.S. Census 2000Note: The number of people by race does NOT include Hispanics or Latinos.

UW-Extension Waushara CountySource: U.S. Census
Labels
# of People Over Age 5 Who Speak Spanish at Home0 - 1011 - 2526 - 5051 - 100Over 100
Waushara County Residents Over the Age of 5 in 2000Who Speak Spanish at Home
Town of Leon
Town of Rose
Town of Oasis
Town ofMarion
Town of Aurora
Town ofDakota
Town ofColoma
Town ofHancock
Town ofSaxeville
Town ofRichford
Town ofWarren
Town ofDeerfield
Town ofWautoma
Town ofSpringwater
Town ofMt. Morris
City ofWautoma Village of
Redgranite
Village ofWild Rose
Village of Plainfield
City ofBerlin
Village ofColoma
Village ofHancock Town of
Poy Sippi
Town ofBloomfield
Town of Plainfield
Village ofLohrville

UW-Extension Waushara CountySource: Wisconsin Department of Administration
Labels
# of Hispanics/Latinos that do not speak English "Well"0 - 1011 - 2526 - 5051 - 100Over 100
Hispanic/Latino PeopleWho Did Not Speak English "Well" in 2000
Town of Leon
Town of Rose
Town of Oasis
Town ofMarion
Town of Aurora
Town ofDakota
Town ofColoma
Town ofHancock
Town ofSaxeville
Town ofRichford
Town ofWarren
Town ofDeerfield
Town ofWautoma
Town ofSpringwater
Town ofMt. Morris
City ofWautoma Village of
Redgranite
Village ofWild Rose
Village of Plainfield
City ofBerlin
Village ofColoma
Village ofHancock Town of
Poy Sippi
Town ofBloomfield
Town of Plainfield
Village ofLohrville

50%
21%29% English
Only
English &Spanish
SpanishOnly
Percent of Waushara County Hispanic/Latino Population that speak English and/or Spanish
Source: U.S. Census 2000
Note: Spanish Only, includes Hispanic/Latinos that speak English “not at all” or “ not well”
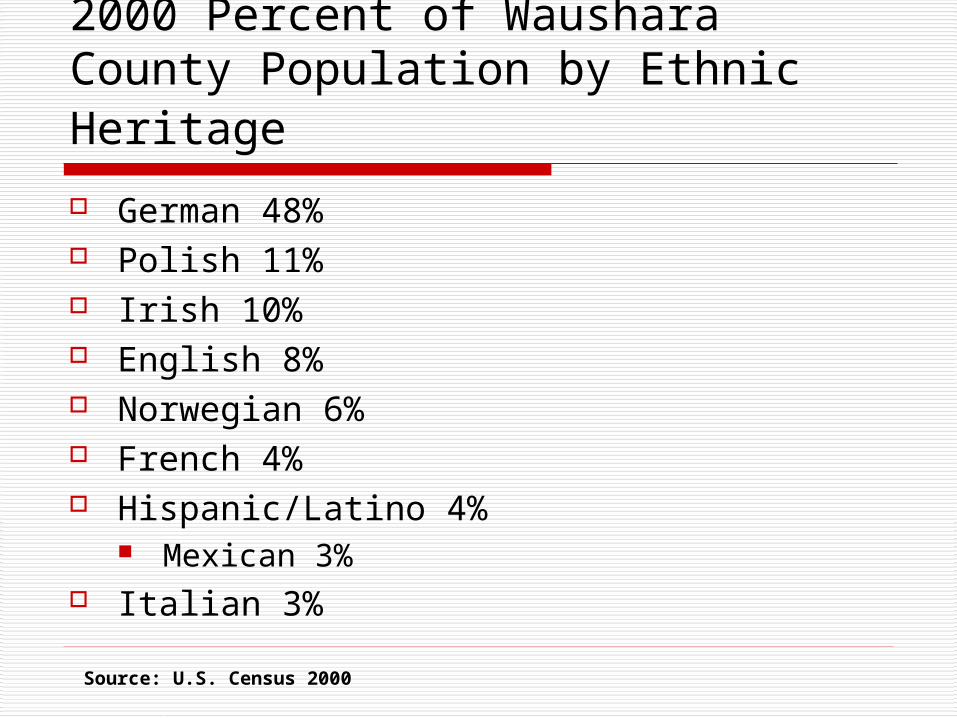
2000 Percent of Waushara County Population by Ethnic Heritage German 48% Polish 11% Irish 10% English 8% Norwegian 6% French 4% Hispanic/Latino 4%
Mexican 3% Italian 3%
Source: U.S. Census 2000

UW-Extension Waushara CountySource: Wisconsin Department of Administration
Labels
# of People Who Speak German at Home0 - 1011 - 2526 - 5051 - 100Over 100
Waushara County Residents Over the Age of 5 in 2000Who Speak a Germanic Language at Home
Town of Leon
Town of Rose
Town of Oasis
Town ofMarion
Town of Aurora
Town ofDakota
Town ofColoma
Town ofHancock
Town ofSaxeville
Town ofRichford
Town ofWarren
Town ofDeerfield
Town ofWautoma
Town ofSpringwater
Town ofMt. Morris
City ofWautoma Village of
Redgranite
Village ofWild Rose
Village of Plainfield
City ofBerlin
Village ofColoma
Village ofHancock Town of
Poy Sippi
Town ofBloomfield
Town of Plainfield
Village ofLohrville
The Amish speak a Germanic language at home. Only inthe Towns of Richford, Coloma, Dakota, and Aurora doyouth (age 5 - 17) speak a Germanic Language at home.
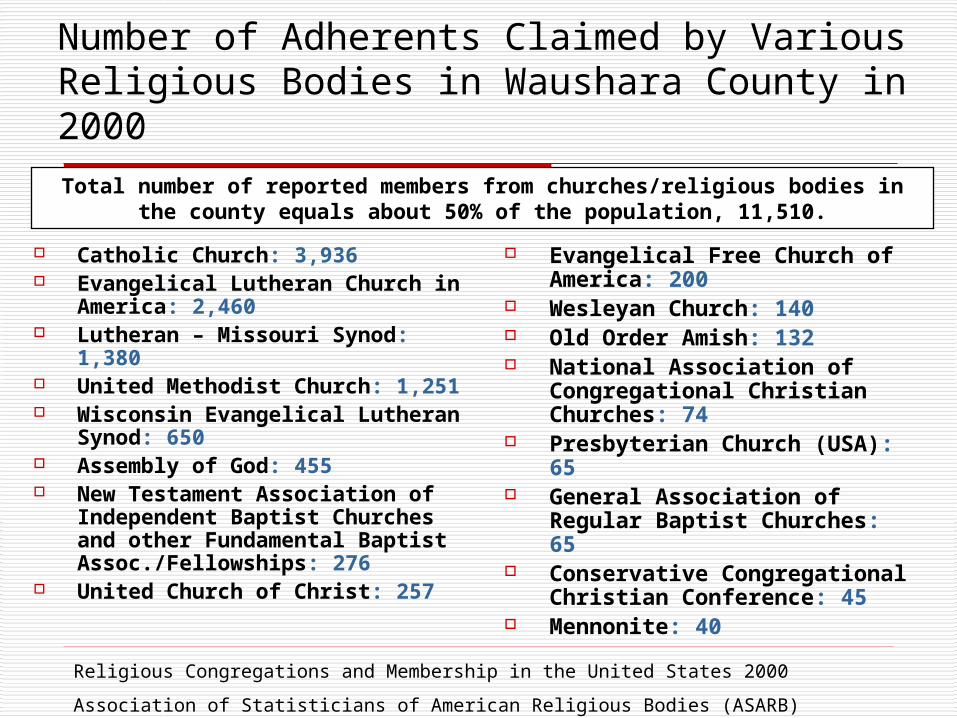
Number of Adherents Claimed by Various Religious Bodies in Waushara County in 2000
Catholic Church: 3,936 Evangelical Lutheran Church in
America: 2,460 Lutheran – Missouri Synod: 1,380 United Methodist Church: 1,251 Wisconsin Evangelical Lutheran
Synod: 650 Assembly of God: 455 New Testament Association of
Independent Baptist Churches and other Fundamental Baptist Assoc./Fellowships: 276
United Church of Christ: 257
Evangelical Free Church of America: 200
Wesleyan Church: 140 Old Order Amish: 132 National Association of
Congregational Christian Churches: 74
Presbyterian Church (USA): 65 General Association of Regular
Baptist Churches: 65 Conservative Congregational
Christian Conference: 45 Mennonite: 40
Religious Congregations and Membership in the United States 2000
Association of Statisticians of American Religious Bodies (ASARB)
Total number of reported members from churches/religious bodies in the county equals about 50% of the population, 11,510.
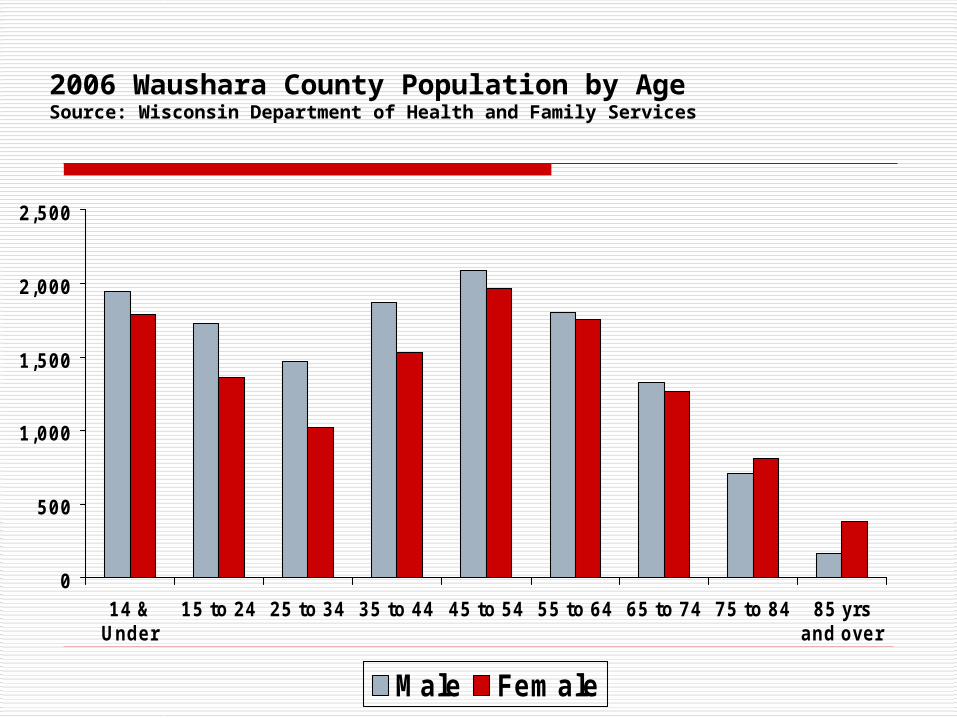
2006 Waushara County Population by AgeSource: Wisconsin Department of Health and Family Services
0
500
1,000
1,500
2,000
2,500
14 &Under
15 to 24 25 to 34 35 to 44 45 to 54 55 to 64 65 to 74 75 to 84 85 yrsand over
Male Female

Town of Leon
Town of Rose
Town of Oasis
Town ofMarion
Town of Aurora
Town ofDakota
Town ofColoma
Town ofHancock
Town ofSaxeville
Town ofRichford
Town ofWarren
Town ofDeerfield
Town ofWautoma
Town ofSpringwater
Town ofMt. Morris
City ofWautoma Village of
Redgranite
Village ofWild Rose
Village of Plainfield
City ofBerlin
Village ofColoma
Village ofHancock Town of
Poy Sippi
Town ofBloomfield
Town of Plainfield
Village ofLohrville
Percent of Waushara County2000 Population Age 65 and Over
Labels
% of 2000 Population 65 and Over8% - 12%Wisconsin 13%14% - 18%19% - 24%25% - 29%
UW-Extension Waushara CountySource: U.S. Census

Education In Waushara County in 2000, 21% of the
population over age 25 is without a high school diploma, and 12% of the population has bachelors or graduate degrees. In the same year the reverse was true for the whole state of Wisconsin, 15% of the population over age 25 did not have a high school diploma, and 22% of the population had bachelors or graduate degrees Source: 2000 US Census

2000 Waushara County Population,Age 25 and Over by Education Attainment
0%
10%
20%
30%
40%
50%
60%
70%
80%
90%
100%
25 - 34 35 - 44 44-64 65+
Graduate orProfessional Degree
Bachelor's Degree
Associate Degree
Some College, NoDegree
High SchoolDiploma orEquivalentNo High SchoolDiploma
Source: U.S. Census 2000

2004 Self-sufficiency Wage
Adams County $11.05
Green Lake County $13.14
Waushara County $13.21
Waupaca County $13.21
Marquette County $13.78Source: UW-Extension Wisconsin Food Security Project Website
2004 Average Hourly Wage $11.43Source: Wisconsin Department of Workforce Development
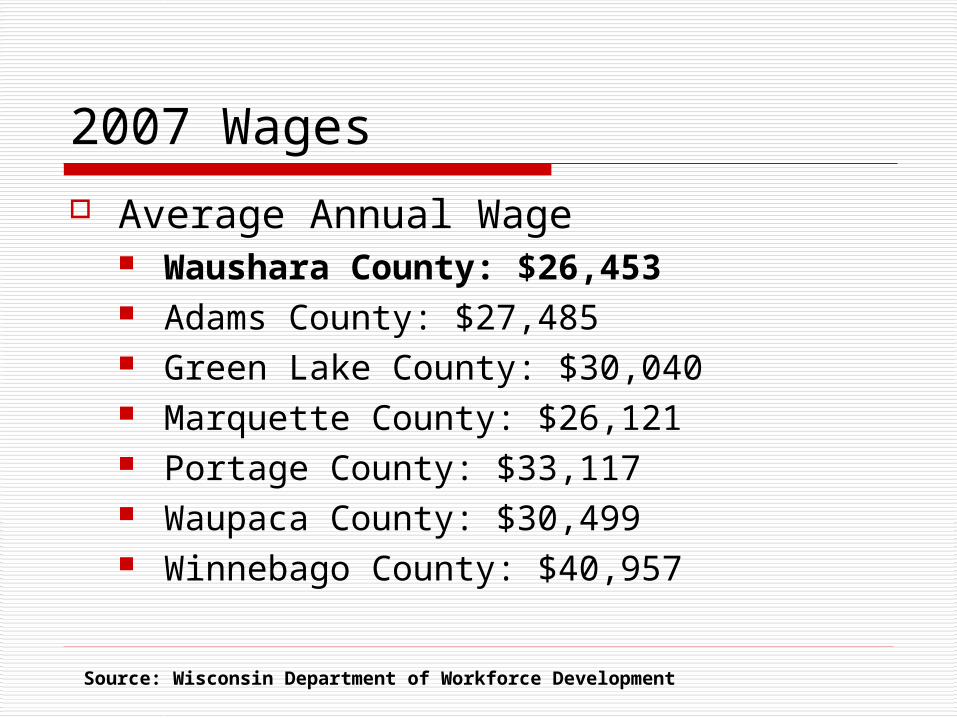
2007 Wages
Average Annual Wage Waushara County: $26,453 Adams County: $27,485 Green Lake County: $30,040 Marquette County: $26,121 Portage County: $33,117 Waupaca County: $30,499 Winnebago County: $40,957
Source: Wisconsin Department of Workforce Development

Benefits
Benefits offered by Employers in Waushara County Paid vacations
(84.1%) Health insurance to
employee (63.5%) Health insurance to
family (53.2%) Retirement Plan
(48.4%)
Benefits received by workers residing in Waushara County Health insurance to
employee (57.0%) Health insurance to
family (54.7%) Paid vacations
(54.0%) Pension Plans (44.3%)
70% of Waushara County workers said health insurance was most important to them
Source: Labor Market Conditions in Waushara County 2001
UW-Extension and Waushara County Economic Development Corporation

Workforce
2007 Average Unemployment Rate was 5.4%. The Wisconsin unemployment rate was 4.9%. Source: Wisconsin Department of Workforce Development
48% of employed Waushara County residents, over age 16, work outside of the county. Source: 2000 US Census

Employees Working in Waushara County –County of Residence
Waushara County Employed Residents –County of Employment

Live in: Work in: Count: Travel to: From: Count:Waushara Co. WI Waushara 5,398 Waushara Co. WI Waushara 5,398
Winnebago 1,162 Portage 334Green Lake 926 Green Lake 224Waupaca 654 Marquette 217Portage 505 Winnebago 163Outagamie 321 Waupaca 131Marquette 317 Adams 106Fond du Lac 277 Wood 53Adams 105 Milwaukee 35Wood 91 Outagamie 30Milwaukee 86 Elsewhere 204Dodge 57 Grand Total
6,895Dane 45Waukesha 45Washington 37Brown 35Cook Co. IL 31Elsewhere 196Grand Total 10,288
Source: U.S. Census 2000
2000 Worker Flow

Waushara County Businesses Total of approximately 2,036 non-farm
business establishments in 2006 503 Establishments have 1 or more employees,
totaling 4,692 jobs (In 2000: 522 Establishments with 4,413 jobs) U.S. Census - County Business Patterns 89% have 1-19 employees
1,533 Non-employer Establishments (1,187 Establishments in 2000, a 29% increase) U.S. Census – Nonemployer Establishments
717 Farms in 2002 (634 Farms in 1997) National Agriculture Statistics Service – Census of Agriculture 156 Farms employ 2,752 hired workers (In
2000: 194 Farms with 2,659 hired workers)

Taken from the 2005 Waushara County Health Profile at: http://dhs.wisconsin.gov/localdata/pdf/05pubhlth/waushara05.pdf
• 5,542 children under the age of 18• 241 births, 30% to single mothers• 29 births are to teenage mothers• 25% of births are to mothers w/o high
school diploma• About 648 children, birth-4 receive
WIC• 45% of children on F&R Lunch
program
2005 Data for
Children Living in Waushara County

Median Family Income - Waushara County versus State of Wisconsin
$51,000
62,200
$42,416
$26,042
$15,496
$52,911
$35,082
$20,915
$0
$10,000
$20,000
$30,000
$40,000
$50,000
$60,000
$70,000
1979 1989 1999 2006
WausharaCounty
State ofWisconsin
Sources: U.S. Census Data 1980, 1990, 2000 and 2008 Wisconsin Council on Children and Families Web Site

13%
24%
23%
26%
14%
Very Low IncomeLow IncomeModerate IncomeMedium IncomeHigh Income
Family Income in 1999
US Housing and Urban Development and US Census 2000

Poverty Percent of 2005 population that live below poverty
Waushara County = 10.3% Wisconsin = 10.2%.
Percent of the 2005 population under age 18 in poverty Waushara County = 16.4% Wisconsin = 14.0% US Census Bureau Small Area Income & Poverty Estimates
Percent of the 2000 population over age 65 in poverty Waushara County = 10.8% Wisconsin = 7.4% US Census Bureau Small Area Income & Poverty Estimates

Poverty Distribution
UW-Extension Waushara CountySource: U.S. Census
Labels
# of People in Poverty0 - 1011 - 2526 - 5051 - 100Over 100
Number of Waushara County Residents in Poverty in 2000
Town of Leon
Town of Rose
Town of Oasis
Town ofMarion
Town of Aurora
Town ofDakota
Town ofColoma
Town ofHancock
Town ofSaxeville
Town ofRichford
Town ofWarren
Town ofDeerfield
Town ofWautoma
Town ofSpringwater
Town ofMt. Morris
City ofWautoma Village of
Redgranite
Village ofWild Rose
Village of Plainfield
City ofBerlin
Village ofColoma
Village ofHancock Town of
Poy Sippi
Town ofBloomfield
Town of Plainfield
Village ofLohrville

2006 Area County Comparison Percent of population receiving Food Stamps
7.08 7.41
12.43
15.59
10.87
0
2
4
6
8
10
12
14
16
18
% of Populationreceiving FS
Waupaca
Green Lake
Marquette
Adams
Waushara
Source: UW Extension Food Security Project Web site

Food Stamp Participation Estimatesfor Permanent Residents
0
200
400
600
800
1000
1200
1400
1600
2003 2008
Jan.
Feb.
March
April
May
Source: Wisconsin Department of Health and Family Services, 2008

Food Share Case Load Recipients by Calendar year & Season:
0
1000
2000
3000
4000
5000
6000
2003 2007
Winter (Dec. J an. Feb)
Spring (Mar. Apr.May)
Summer (J un. J ul. Aug)
Fall (Sep. Oct. Nov)
Source: Wisconsin Department of Health and Family Services, 2008
http://dhs.wisconsin.gov/em/rsdata/fs-caseload-recip-by-cy.htm

Tri-County School District
Westfield School District
Wautoma Area School District
Almond-Bancroft School District
Wild Rose School District
WaupacaSchool District
Weyauwega-FremontSchool District
Berlin AreaSchool District
WinneconneCommunitySchool District
OmroSchoolDistrict
Waushara County School Districts

Percent Receiving Free & Reduced Lunches by School
0
10
20
30
40
50
60
70
80
2002-2003 2007-2008
Tri-County HS
Tri-County Mid
Tri County Ele
Wautoma Pkside
Redgranit Ele
Riverview Ele
Wautoma HS
Pleasant View Ele
Wild Rose Ele
Wild Rose HS
Poy Sippi Ele
Coloma Ele
Source: UW Extension Food Security Project Web site & DPI

K-12 Population by Racial Characteristics Public School Districts in Waushara County
0
200
400
600
800
1000
1200
1400
White Hispanic Black Asian Amer Ind
Tri County
Wautoma
Wild Rose
P oy Sippi
Coloma
Source: Wisconsin Department of Public Instruction
0
200
400
600
800
1000
1200
1400 Tri County
Wautoma
Wild Rose
Poy Sippi
Coloma
2002-2003 2007-2008

Additional Sources for Statistics about Waushara County and Beyond
Internet Sources Of Demographic and Economic Data For Communities in Wisconsin by Patrick Nehring, UW-Extension Waushara Cnty www.uwex.edu/ces/cty/waushara/cnred/stats.html
Applied Population Laboratory www.ssc.wisc.edu/poplab/index.html WisStat
www.wisstat.wisc.edu/

For More Information Contact:
Waushara CountyP.O. Box 487209 S. Ste Marie StreetWautoma, WI 54982(920) 787-0416

Groups who received this PowerPoint:• County Board of Supervisors• Redgranite Economic
Development Committee• God’s People In Action (a
faith-based not-for-profit group)
• Department of Workforce Development Staff
• W2 Steering Committee• Agriculture Day Participants• Job Center Employee
Relations Team• Employees of Coldwell
Banker Realty
• Department of Human Services
• Area School District Representative
• Extension Education Committee
• Luther Olson & Louis Molepske: Representatives to the Assembly
• Bob Welch & Julie Lassa: State Senators
• Safe & Stable Families Committee
• Waushara County Representative forAlzheimer’s Association