Embed Size (px)
Citation preview
Parallel Shared-Memory SimulatorPerformance for Large ATM Networks
BRIAN UNGER and ZHONGE XIAOUniversity of CalgaryJOHN CLEARY and JYA-JANG TSAIUniversity of WaikatoandCAREY WILLIAMSONUniversity of Saskatchewan
A performance comparison between an optimistic and a conservative parallel simulationkernel is presented. Performance of the parallel kernels is also compared to a central-event-list sequential kernel. A spectrum of ATM network and traffic scenarios representative ofthose used by ATM networking researchers are used for the comparison. Experiments areconducted with a cell-level ATM network simulator and an 18-processor SGI PowerChallengeshared-memory multiprocessor.
The results show the performance advantages of parallel simulation over sequential simula-tion for ATM networks. Speedups of 4-5 relative to a fast sequential kernel are achieved on 16processors for several large irregular ATM benchmark scenarios and the optimistic kernelachieves 2 to 5 times speedup on all 7 benchmarks. However, the relative performance of thetwo parallel simulation kernels is dependent on the size of the ATM network, the number oftraffic sources, and the traffic source types used in the simulation. For some benchmarks thebest single point performance is provided by the conservative kernel even on a singleprocessor. Unfortunately, the conservative kernel performance is susceptible to small changesin the modeling code and is outperformed by the optimistic kernel on 5 of the 7 benchmarks.The optimistic parallel simulation kernel thus provides more robust performance, but itsspeedup is limited by the overheads of its implementation, which make it approximately halfthe speed of the sequential kernel on one processor.
These performance results represent the first comparative analysis of parallel simulation for aspectrum of realistic, irregular, low-granularity, communication network models.
Financial support for this research was provided by an NSERC Collaborative Research andDevelopment grant (CRD 183839), and by our many industrial sponsors: Netera Alliance,Newbridge Networks, New Zealand Telecom, Nortel, Siemens, Silicon Graphics, Stentor, andTelus. This support, and the ongoing interactions with our industrial sponsors, are greatlyappreciated.Authors’ addresses: B. Unger and Z. Xiao, Department of Computer Science, University ofCalgary, Calgary, T2N 1N4, Canada; J. Cleary and J.-J. Tsai, University of Waikato, Waikato,New Zealand; C. Williamson, University of Saskatchewan, Saskatchewan, Canada.Permission to make digital / hard copy of part or all of this work for personal or classroom useis granted without fee provided that the copies are not made or distributed for profit orcommercial advantage, the copyright notice, the title of the publication, and its date appear,and notice is given that copying is by permission of the ACM, Inc. To copy otherwise, torepublish, to post on servers, or to redistribute to lists, requires prior specific permissionand / or a fee.© 2001 ACM 1049-3301/00/1000–0358 $5.00
ACM Transactions on Modeling and Computer Simulation, Vol. 10, No. 4, October 2000, Pages 358–391.

Categories and Subject Descriptors: C.1.2 [Processor Architectures]: Multiple Data StreamArchitectures (Multiprocessors)—Single-instruction-stream, multiple-data-stream processors(SIMD); C.2.1 [Computer-Communication Networks]: Network Architecture and Design—Asynchronous Transfer Mode (ATM); I.6.8 [Simulation and Modeling]: Types of Simula-tion—Parallel
General Terms: Experimentation, Performance
Additional Key Words and Phrases: ATM network modeling, conservative synchronization,optimistic synchronization, parallel discrete event simulation, time warp
1. INTRODUCTIONThere is a long history of attempts to speed up simulations through parallelexecution. Two main families of synchronization algorithms have beenproposed. The first “conservative” algorithm is described in Chandy andMisra [1979]. The optimistic TimeWarp algorithm [Jefferson 1985] wasdeveloped in the early 1980s. Since then there have been many publishedvariations and implementations [Avril and Tropper 1995; Bagrodia andLiao 1994; Blanchard et al. 1994; Cai et al. 1997; Fujimoto 1989; Martine1995; Nicol and Heidelberger 1995; Steinman 1992; Su and Seitz 1989].This work has clearly demonstrated that both algorithms are able toachieve significant speedups for small artificial problems. The question ofwhether they can be routinely used as a mechanism for speeding up realapplications remains open. We are aware of only one application, an airtraffic control simulation, where an optimistic parallel simulation system isin regular production use [Wieland 1995].
A number of researchers have reported significant speedups for a rangeof applications. However, most, if not all, of these applications are eithersmall models, models that have very regular structure, or models createdspecifically for use in parallel simulation performance studies. Examplesinclude TimeWarp-based simulators used for mobile personal communica-tions systems (PCS) networks [Carothers et al. 1995]; conservative parallelsimulators for wireless networks [Meyer and Bagrodia 1998; Zeng et al.1998]; and ATM networks [Nicol 1996; Nicol and Heidelberger 1995]; andVLSI circuit simulation [Chen and Bagrodia 1998]. Further, there aremany examples where conservative and optimistic approaches failed toachieve any significant speedup.
There has been previous work on conservative parallel simulation oflarge ATM networks [Pham et al. 1998], but primarily at the call-level (e.g.,routing), as opposed to the fine-grain cell-level models.
To the best of our knowledge, this article is the first to compare aconservative to an optimistic simulator for a set of detailed models of largebroadband ATM (asynchronous transfer mode) networks [Minzer 1989],developed and used to support experimental research in ATM networkprotocols. These detailed benchmark models characterize cell-level behav-ior, including all of the major ATM standard communication protocols fortwo ATM networks: the 11 switch Western Canadian regional network
Parallel Shared-Memory Simulator Performance • 359
ACM Transactions on Modeling and Computer Simulation, Vol. 10, No. 4, October 2000.

(Wnet), and the 54 switch Canadian National Test Network (NTN). 3 Wnetand 4 NTN traffic load scenarios are used to define 7 large, irregular,benchmark models. The 7 benchmarks were used by researchers to studycall-admission control and congestion-control algorithms [Wang et al. 1999;Zoranovic and Williamson 1999] and estimates of the effective bandwidth ofaggregate Ethernet, video, and Web ATM traffic [Gurski and Williamson1996; Patel and Williamson 1997].
Simulation is a vital tool in the design and analysis of high-speed ATMnetworks. Due to the high costs of installing and operating an ATMnetwork, and the rapid pace of changes in ATM technology and standards,networking researchers and telecommunications engineers rely on simula-tion to evaluate, for example, ATM switch design, the effectiveness of ATMtraffic-control policies, and the scalability of traffic-management ap-proaches to large heterogeneous ATM networks.
Simulations in the ATM context typically have two key requirements: theneed for detailed cell-level simulation, so that fine-grain performancedifferences between traffic control policies or ATM switch architectures canbe understood; and the need for a large number of simulation events (e.g.,billions to trillions of ATM cells) in order to assess quality of service at anappropriate level (e.g., cell loss ratios in the range from 1026 to 1029).These two requirements combine to challenge current uniprocessor comput-ing platforms, typically producing multiday rather than same-day turn-around time for most commercial ATM network simulators on medium tolarge ATM network scenarios. Parallel simulation is one approach foraddressing this problem. A parallel simulator, if properly designed, canexploit the inherent parallelism in a large ATM network scenario, offeringsignificant speedup.
ATM simulations pose a significant set of challenges for parallel simula-tors. On the one hand, they are large problems with significant amounts ofparallelism, which makes the task easier. On the other hand, the workloadis irregular, varying over both time and the objects in the simulation. Thismakes the problem of load-balancing the simulation across multiple proces-sors difficult. The granularity (the time to execute one event in thesimulation) is very low as well. On the SGI platform, the granularityaverages about 10 microseconds [Arlitt et al. 1995]. The average per-eventoverheads of any simulator (including complex parallel ones) cannot bemuch larger than this if good performance is to be achieved, i.e., if, given nprocessors, the speedup achieved is a significant fraction of n.
In this article, we evaluate and compare the performance of two differentshared-memory parallel simulation kernels for ATM network simulation,one optimistic and one conservative. The optimistic parallel simulationkernel, WarpKit [Xiao and Unger 1995b], is a shared-memory TimeWarpSystem [Fujimoto 1989; 1990] with its associated mechanisms for state-saving, rollback, and fossil collection. The conservative parallel simulator[Cleary and Tsai 1996] uses lookahead techniques to ensure that events areexecuted locally (at a single logical process) in strict time order. Thus, it
360 • B. Unger et al.
ACM Transactions on Modeling and Computer Simulation, Vol. 10, No. 4, October 2000.

avoids the overheads and complexities of rollback, albeit at the cost ofreduced parallelism.
Both simulation kernels are evaluated using the cell-level ATM trafficand network (ATM-TN) simulator [Unger et al. 1995], for two ATM net-work topologies (Wnet and the NTN) with a range of network traffic loads.The experiments were conducted on a commercially available shared-memory multiprocessor, namely an 18-processor SGI Power Challenge.
The results of our study demonstrate the performance benefits achiev-able with parallel simulation for ATM network simulation. For example,speedups of 2-3 over sequential simulation are possible for all networkscenarios studied, and speedups of 4-6 are possible on some scenarios. Theperformance results for the two parallel simulators are found to be sensi-tive to the size and structure (i.e., number and type of traffic sources) of theATM networks simulated. In general, the optimistic parallel simulatorprovides more robust performance across the range of ATM networkscenarios studied, while the conservative simulator gives the best perfor-mance on selected scenarios.
The remainder of this article is organized as follows. Section 2 providessome background on the sequential and parallel simulation kernels evalu-ated in this study. Section 3 describes the ATM-TN simulator used in thestudy, and Section 4 the ATM benchmark scenarios. Section 5 presents theresults of our study, including the sequential and parallel performanceresults for each of the ATM benchmark scenarios considered. Finally,Section 6 summarizes our conclusions.
2. SIMULATION KERNELS
SimKit is the application programmer’s interface (API) that we use forwriting simulation applications [Gomes et al. 1995]. SimKit is an object-oriented library for discrete-event simulation implemented in C11. A modelis described in terms of objects called logical processes (LPs). Each LP cancommunicate with other LPs via messages only (that is, they can share nowritable state). Communication is via time-stamped messages that executean event at the receive time of the message. The code for a model uses anevent-based rather than a process-based view; that is, it is impossible toreceive events at inner points in the model code, but only at the pointwhere the execution of an event is initiated.
SimKit defines three base classes: sk_simulation, from which all thecontrolling information for a simulation is instantiated (e.g., initializationprocess, warm-up period, simulation end time); sk_lp, from which thelogical processes that carry out simulation activities are derived; andsk_event, from which all simulation events (i.e., messages) are derived.Each logical process (LP) executes its received events in time-stamp order,updating local state information, and possibly generating more events.
As noted earlier, due to the small amount of user computation in theATM-TN application, it is important to keep kernel overheads low. SimKititself includes a number of optimizations designed to keep these overheads
Parallel Shared-Memory Simulator Performance • 361
ACM Transactions on Modeling and Computer Simulation, Vol. 10, No. 4, October 2000.

low. The main ones are fixed-size buffers for events, and extensive use(where possible) of pointer-passing, rather than data-copying, when for-warding messages between LPs.
SimKit applications, such as the ATM-TN, can be executed on a varietyof simulation kernels (see Figure 1). To date, we have run ATM-TN on fourkernels: CelKit, a central-event-list-based sequential simulator; WarpKit,an optimistic parallel simulation kernel; WaiKit, a conservative parallelsimulation kernel; and TasKit, a new optimized conservative kernel. Thisarticle compares the performance of WarpKit with WaiKit and the sequen-tial kernel. The next three sections provide further background on each ofthese three kernels. A subsequent article will present comparative perfor-mance results for the TasKit kernel, which is still under development.
2.1 Central-Event-List-Based Sequential Simulator (CelKit)
CelKit is a sequential event-list-based simulator. As each event is gener-ated it is placed into a time-ordered event list. CelKit has an optimizedevent list that uses a splay tree [McCormack and Sargent 1981], which isable to efficiently handle both a large number of events and irregular andvarying time distributions within the event list. Insertion into, and sequen-tial extraction from, the event list are the dominant overheads in CelKit.There are event-list algorithms, e.g., the Calendar Queue [Brown 1988],which can be more efficient than a splay tree even for large event lists. Ourexperience, however, is that the Calendar Queue is not robust, as it can
Switch Model
Traffic Model
Workstation, Server, PC
TasKitWaiKit
data analysis& management
User Interface
SimKit
ATM-MF
WarpKit
Input Data
Output Data
Switch Model
Traffic Model
CelKit
Fig. 1. The structural relationships between the simulation application (the ATM-TN and itscomponents: the ATM-MF, i.e., the modeling framework, and the traffic and switch models),the simulation API (SimKit), the simulation kernels (CelKit, WarpKit, WaiKit and TasKit),and the simulation platforms (e.g., SUN SPARC, SGI PowerChallenge).
362 • B. Unger et al.
ACM Transactions on Modeling and Computer Simulation, Vol. 10, No. 4, October 2000.
give poor performance for some distributions of time-stamps. As a conse-quence, we do not use it in the current system.
2.2 Parallel Execution
Any parallel execution of a simulation has a number of problems withwhich to contend. The main one is that parallel algorithms tend to be morecomplex, which implies higher overheads. The sections below, on individualparallel kernels, outline techniques for minimizing these extra overheads.
Another crucial problem is partitioning or load-balancing, referring tohow the LPs are mapped to the physical processing elements (PEs) of theshared-memory multiprocessor. Clearly, the goals are to balance the com-putation load among the PEs, and to minimize the communication require-ments between PEs (i.e., messages between LPs that are in differentpartitions). However, automatic partitioning and dynamic load-balancingare still open research topics. We currently rely on a static (i.e., manual)partitioning of the parallel simulation across PEs, based on application-level knowledge (see Section 4.3). In the performance results reported inthis article, both WaiKit and WarpKit use the same static partitions.
2.3 WarpKit
WarpKit is a parallel simulation kernel developed at the University ofCalgary [Xiao and Unger 1995b], derived from the 1993 version of GTW, aTimeWarp system developed for shared-memory multiprocessors at Geor-gia Tech [Das and Fujimoto 1993; Das et al. 1994]. The initial version ofWarpKit has been extensively revised and extended to achieve robustperformance for low-granularity applications [Xiao and Unger 1995b].Several of these optimizations are outlined in this section.
TimeWarp provides an environment for optimistic parallel execution[Jefferson 1985; Jefferson et al. 1987]. That is, each LP is allowed toprogress forward in time at its own pace, based on the messages it receives,without requiring explicit synchronization with other LPs. However, if anLP receives a message with a time-stamp t from the past (compared to theLP’s local time), then the LP must perform a rollback, undoing the possiblyincorrect steps that it has taken since time t, canceling the possiblyincorrect messages that it has sent to other LPs since time t, and resumingforward progress from time t. Clearly, being able to do rollback implies theneed for state-saving on the forward execution path. This state must bemaintained until the global virtual time (GVT) of the simulation, deter-mined by the minimum time of all LPs and events, advances far enough forevents to be committed, at which time old state information can bediscarded and its memory space reclaimed, a process called fossil collection.
State-saving is thus one of the attendant overheads in optimistic parallelsimulation; minimizing its overhead is essential for good performance. Anincremental state-saving (ISS) mechanism, which saves state variablesonly when they are modified, is built into SimKit on top of WarpKit [Gomes
Parallel Shared-Memory Simulator Performance • 363
ACM Transactions on Modeling and Computer Simulation, Vol. 10, No. 4, October 2000.

1996]. This keeps the state-savings cost low, since the percentage of statechanges for most of the events in ATM-TN is low.
Another source of kernel overhead is the global control mechanisms,including GVT computation, fossil collection, and buffer management.WarpKit employs a two-tiered distributed buffer management scheme anda fast asynchronous GVT algorithm [Xiao et al. 1995]. Each processor usesits local buffer pool for events. A central pool is used to adjust the local pooldynamically, in such a way that the number of buffers (both in the localpool and those occupied by events) is kept roughly constant. The GVTalgorithm allows any PE to initiate GVT calculation and fossil collectionwithout direct collaboration with other PEs. As a result of this asynchro-nous approach, the PE executing on the critical path will be able toprogress with less interference, and the fast-running PEs will be engagedin more frequent GVT calculations. This also tends to restrict optimism.Furthermore, the GVT calculated by the fast PEs can be utilized by slowPEs, effectively reducing the overhead on the critical path. The globalcontrol overhead of WarpKit is now the lowest of all overheads. This is incontrast to the original version of WarpKit, in which global control is theperformance bottleneck [Xiao and Unger 1995b].
Furthermore, minimizing the number and size of rollbacks on the criticalcomputation path is also crucial. An effective way of reducing excessiverollback is using a small number of buffers for each PE, as mentionedabove. There are also other mechanisms to constrain rollbacks, which aremore specific to the ATM-TN simulator.
Event flow control is one such mechanism [Xiao and Unger 1995a]. Itplaces a constraint on how far ahead in time one LP can be compared toGVT. Event flow control is particularly important for two classes of LPs: (1)those that produce but never consume simulation events (e.g., the videotraffic sources described in Section 3.1), since they may “flood” the systemwith many future events, exhausting the local buffer pool and causingmany GVT computations; and (2) those LPs that consume but neverproduce events, since they may “dry out” the system, increasing the chanceof rollback. This problem can be solved most efficiently at the ATM-TNlevel, not in the underlying kernel. The solution is to strike a balancebetween the number of events generated by the source and the number ofevents consumed by the sink. In principle, this is like sliding window flowcontrol in network communication protocols, but at the level of simulationevents. The benefits of this mechanism are most evident on small networkscenarios with highly asymmetric traffic flows. The need for the mechanismon large network models with well-balanced loads is less obvious.
Rollbacks are also a problem for LPs that have self-initiated eventswidely spaced in time (e.g., reporting end-of-simulation statistics, reportingperiodic statistics, communication protocol time-outs, and retransmis-sions). These events tend to be selected repeatedly and executed prema-turely, causing a large number of unnecessary rollbacks. The native Time-Warp mechanism is incapable of dealing with such situations. In ourimplementation, we solve this problem by using wait queues: a separate
364 • B. Unger et al.
ACM Transactions on Modeling and Computer Simulation, Vol. 10, No. 4, October 2000.

“waiting area” at each processor for “far off” future events that precludesthese events from early processing by LPs. These waiting messages aremoved to the PE’s event queue for processing only when the simulationtime draws close enough.
There are many other implementation optimizations in WarpKit to keepkernel overhead low. In summary, WarpKit provides a fast and reliableparallel simulation executive, with several optimizations specifically de-signed to support fast parallel simulation of ATM networks.
2.4 WaiKit
The WaiKit parallel simulation kernel was developed at the University ofWaikato in New Zealand [Cleary and Tsai 1996]. Since WaiKit is aconservative kernel, it differs significantly from WarpKit. In particular,LPs always execute events in nondecreasing time-stamp order; no rollbacksare possible.
Clearly, conservative parallel simulation requires stronger coordinationand synchronization among the LPs. This coordination usually results inreduced parallelism. In the most extreme case, all LPs must proceed in lockstep at the pace of the slowest LP, producing a performance that can beslower than sequential execution. However, such extreme synchronizationrequirements are rarely needed in practice; more generous forwardprogress is possible, particularly if application-level knowledge is available.Furthermore, WaiKit does not have the complexity and overheads requiredin WarpKit for state-saving and rollback.
WaiKit exploits the use of safe-times to determine bounds on the forwardexecution permitted by each LP in the simulation [Cleary and Tsai 1996].The safe-time for an LP is a lower bound on the earliest possible time in thefuture at which a new message could arrive. In order to compute suchsafe-times effectively, WaiKit needs to know about (logical) communicationchannels between LPs. All messages must be sent via channels, and, foreach possible communication path between LPs, a channel must be con-structed before the simulation begins. For ATM-TN, this is effective be-cause the set of used channels is sparse, compared with all possiblecommunication paths between LPs. To remove the burden of explicitlyconstructing channels from the modeler, a presimulation pass is done byWaiKit in order to construct the set of channels allowed. This constructiondepends on knowledge of the ATM-TN application, and has to be rewrittenif ATM-TN is modified or if a new application is written. This approach hasa small runtime overhead because the source code references a destinationLP only, not an actual channel. Thus, to find the channel, given the currentLP and the destination LP, a dynamic lookup is necessary. If the existenceof channels could be seen by the application programmer, then this over-head would be removed and construction of the presimulation channelwould not be necessary. To preserve compatibility with existing code andthe other kernels, this was not done.
The safe-time for an LP is computed by taking the minimum of thesafe-times for all channels that arrive at the LP. The safe-time for a
Parallel Shared-Memory Simulator Performance • 365
ACM Transactions on Modeling and Computer Simulation, Vol. 10, No. 4, October 2000.

channel is the safe-time of its source LP plus a lookahead time. This is theminimum time-stamp increment that any message sent down the channelcan have. In ATM-TN, it is computed statically before the simulationbegins, from the propagation delay specified for a signal to traverse a(simulated) physical link.
For WaiKit, the basic execution cycle is to first select an LP and thenexecute all messages for that LP with receive times less than the LP’scurrent safe-time. This causes the safe times for all the LP’s outgoingchannels to be updated. This is different from both CelKit and WarpKit,where activity is scheduled on the basis of individual events, rather thanLPs. Provided the average number of events to be executed each time an LPis selected can be kept high, then this mechanism has potentially very lowoverhead. The average number of events depends upon the connectivity ofthe ATM network and traffic flows. More specifically, it is determined bythe shortest potential loop in the channel graph. The expected number ofmessages around such a loop limits the number of messages to be executed.Thus, if the lookaheads are small or there are few messages, then LPs maybe scheduled more than once for each event processed, causing poorperformance. This aspect of conservative algorithms can make them sensi-tive to small changes in network structure, either as the result of themodeling strategy or due to physical topology in a particular ATM network.All that is needed for overall poor performance is one loop with a totallookahead close to zero, and execution time will be dominated by executingthe LPs in that loop. In some networks, there were no loops at all, so theaverage was potentially infinite. WaiKit performed very well in these cases(see Section 5).
WaiKit uses another simple scheduling strategy to keep overheads lowfor LPs. There is a single static list of all the LPs partitioned onto aparticular PE. This list is repeatedly scanned and each LP in turn isscheduled. This gives very low overheads (little more than dereferencing apointer for each LP) and performs well, as long as each LP has somethingto do on each cycle. However, if there are some LPs with poor lookaheads,then they will make repeated small advances in time and the entire list willbe rescanned each time.
Other strategies for keeping overheads low include carefully tuned codefor merging the incoming channels for each LP; a lock-free method fortransferring messages on channels between PEs; and the use of fixedarrays for the buffers in a channel to avoid the overheads due to allocatingand deallocating buffer space.
In summary, WaiKit provides a simple conservative parallel simulatordesigned to have low overhead, and tuned to the characteristics of ATMcell-level simulations.
3. ATM-TN SIMULATOR
The asynchronous transfer mode traffic and network (ATM-TN) simulatoris a cell-level ATM network simulator developed collaboratively as part of
366 • B. Unger et al.
ACM Transactions on Modeling and Computer Simulation, Vol. 10, No. 4, October 2000.
the TeleSim project [Unger et al. 1995; Williamson et al. 1998]. WithATM-TN a user can define an arbitrary network topology, various ATMswitch types and links for instantiation within that topology, and a set oftraffic flows on that topology. The ATM-TN is intended to support networkdesign, configuration, and performance analysis.
There are three main components in ATM-TN: traffic models, switch andnetwork models, and a modeling framework. The traffic models define thebehaviors of the traffic sources, which generate patterns of simulated ATMcells according to the specified traffic types and parameters, and trafficsinks, which consume incoming ATM cells. The switch and network modelsspecify the behaviors (e.g., processing delays, traffic-control policies, cell-scheduling disciplines, buffer sizes, transmission speeds, and propagationdelays) of the switches, ports, and links in the simulated ATM network,which take ATM cells as inputs and produce ATM cells as outputs. Themodeling framework defines the interfaces to the switch and traffic models,as well as to the input, output, and statistics-reporting routines that arecommon to many of the switch and traffic models.
The following sections provide further details on the design and opera-tion of the traffic and switch models.
3.1 Traffic Models
There are six different source traffic models in the ATM-TN simulator: adeterministic traffic model, a Bernoulli traffic model, an Ethernet LANdata traffic model [Chen et al. 1995], an MPEG/JPEG compressed videotraffic model [Arlitt et al. 1995], a World Wide Web client traffic model[Arlitt and Williamson 1995], and a TCP/ATM traffic model [Gurski andWilliamson 1996].
The first two traffic models, deterministic and Bernoulli, are simpletraffic models used primarily for validating simulations. The deterministictraffic model generates a stream of ATM cells with constant (i.e., determin-istic) spacing between cells. This model is useful for generating constant bitrate (CBR) traffic flows. The Bernoulli model is the discrete-time analog ofa Poisson traffic source. That is, the Bernoulli traffic model generates astream of ATM cells in which the interarrival times between cells aregeometrically distributed and independent. This model is useful for gener-ating a variable bit rate (VBR) background traffic load in an ATM network.In both of these traffic source models, the simulation user specifies themean bit rate for the traffic source, as well as the number of cells to begenerated. These parameters are specified separately for the two directionsof traffic flow, which operate independently.
The Ethernet traffic model generates variable-size data bursts typical oflocal area network (LAN) traffic. In particular, the burst sizes are highlycorrelated in time, to reflect both the short-range and long-range depen-dence observed in real Ethernet LAN traffic [Leland et al. 1994]. Simula-tion users specify a utilization parameter U that controls the mean bit rateof the traffic source, as well as a Hurst parameter H that controls the
Parallel Shared-Memory Simulator Performance • 367
ACM Transactions on Modeling and Computer Simulation, Vol. 10, No. 4, October 2000.

degree of correlation in the traffic bursts. The Ethernet traffic model isopen loop; that is, it produces an infinite duration unidirectional trafficflow. The source produces a sequence of closely spaced ATM cells for eachdata burst, and the sink simply consumes incoming cells.
The video traffic model produces a VBR traffic stream representative ofthe JPEG and MPEG video compression standards [LeGall 1991; Wallace1991]. Video traffic has a periodic structure, determined by its frame rate(e.g., 30 frames per second). Furthermore, the size (in bytes) of each frameis highly correlated with recent frames of the same type [Garrett andWillinger 1994], as determined by the encoding algorithm used (e.g., anintraframe coding algorithm, such as JPEG, or an interframe codingalgorithm, such as MPEG). These aspects are all captured in the videotraffic model [Melamed 1992]. Simulation users specify the frame rate andthe encoding pattern to be used for the video stream, as well as a scalingparameter to control the mean bit rate of the flow. Again, the video trafficmodel is open-loop: it produces an infinite duration unidirectional flow ofATM cells from source to sink.
The World Wide Web traffic model represents the behavior of Web users.Each such user generates sporadic small requests to Web servers, whichthen return a simulated Web document, with the size of the documentdrawn randomly from an arbitrary distribution function (in the bench-marks the Erlang distribution is used) [Arlitt and Williamson 1997; Crov-ella and Bestavros 1996; Paxson and Floyd 1994]. A random hyperexponen-tial think time occurs before the next request, which might go to the sameserver or to a different one. Simulation users specify the mean andstandard deviations of the distributions used for request sizes, responsesizes, and think times. Note that the Web traffic model is closed-loop. Thatis, the time of the next outgoing request depends on the time at which theprevious response is received (as well as the randomized think time, ofcourse). The data flow is bidirectional, though highly asymmetric. Thusthis traffic model has a very different behavior than the Ethernet and videotraffic models do, particularly in terms of parallel execution.
The final traffic model in ATM-TN is a detailed model of the transmissioncontrol protocol (TCP) over ATM. TCP is the cornerstone protocol of theInternet, providing reliable data transfer for many network applications,including file transfer, electronic mail, and the World Wide Web [Tanen-baum 1996]. Our TCP model captures all behaviors of TCP, includingsequence numbers, acknowledgments, sliding window flow control, slowstart and congestion avoidance, time-outs, and retransmission [Stevens1993]. Simulation users specify TCP configuration parameters, such assend and receive socket buffer sizes, maximum segment size, maximumflow-control window size, protocol timeout values, and the number of databytes to transmit in each direction. The model can be used for eitherunidirectional or bidirectional data transfers. In either case, the trafficsource transmits the simulated user data according to the TCP protocol,with the traffic sink generating acknowledgments for received data (piggy-backing the acknowledgments on outgoing data packets, if any). The TCP
368 • B. Unger et al.
ACM Transactions on Modeling and Computer Simulation, Vol. 10, No. 4, October 2000.

model is thus a closed-loop bidirectional traffic model. There is alsodetailed modeling of AAL-5, an ATM adaptation layer protocol used fortranslating between higher-layer protocol data units, such as TCP/IPpackets, and the ATM cells used for transmission across an ATM network.
Each of the foregoing traffic models is implemented in SimKit using twoLPs: one for the source and one for the sink. Multiple instances of a trafficmodel are permitted in an ATM network simulation. Though each trafficmodel represents very different application-level behaviors, each sourcemodel produces as output simulated ATM cells for transmission across thelinks and switches in the simulated ATM network.
One other characteristic to note is that the four main traffic models (i.e.,Ethernet, MPEG, Web, and TCP) conceptually generate higher-layer dataunits (e.g., bursts, frames, files, and packets) that become “bunches” ofATM cells (tens or hundreds) at the lowest layer simulated. This fact hassome implications for how well different parallel simulation performanceoptimizations may work.
3.2 Switch Models
The switch models in ATM-TN are responsible for receiving ATM cells oninput ports, performing necessary traffic control functions (e.g., cell sched-uling, usage parameter control, selective cell discard [ATM Forum 1996])and forwarding cells to their prespecified destination path via output ports.The switches use a simulated ATM signaling protocol for establishing andreleasing state information for end-to-end user-level connections, which arecalled virtual channels (VCs).
There are four different switch types currently defined in ATM-TN: ageneric output buffered switch, a shared-memory switch, a crossbar switch,and a multistage switch using a multistage interconnection network. Onlythe generic output buffered switch model is used in the experiments in thisarticle.
Each switch model is vendor-independent, with configuration optionsavailable to “customize” the switch. The main configuration parameters arethe number of ports on the switch, the port speeds (in bits per second), thesize (in ATM cells) of the buffers at each output port, and the cell-scheduling mechanism. The latter is used to arbitrate access to the outputport among the five ATM service class queues per output port, namelyconstant bit rate (CBR), real-time variable bit rate (VBR-RT), nonreal-timevariable bit rate (VBR-NRT), available bit rate (ABR), and unspecified bitrate (UBR) [ATM Forum 1996]. Each service class queue operates in aFirst-In-First-Out (FIFO) fashion, and is shared by all user-level ATMconnections in that service class; per-VC queuing is also supported in thelatest version of ATM-TN. Exhaustive priority or round-robin scheduling isused among the service classes, with priorities in the order given above.
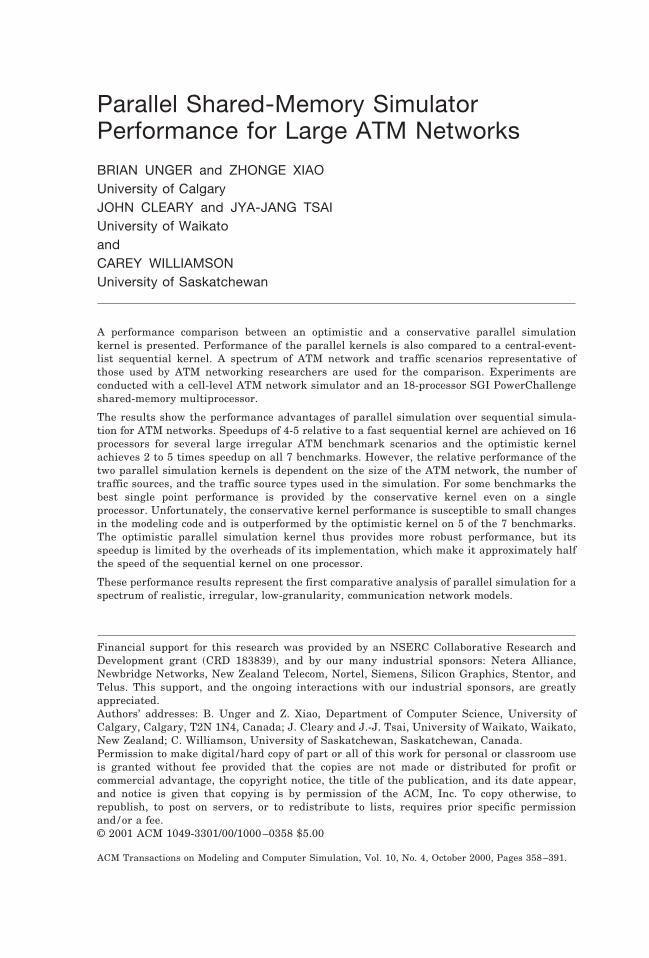
The switch models are implemented in SimKit, and use one LP for eachinput port, one LP for each output port, and two LPs (one for the signalingprotocol and the other for the segmentation and reassembly (SAR) function)
Parallel Shared-Memory Simulator Performance • 369
ACM Transactions on Modeling and Computer Simulation, Vol. 10, No. 4, October 2000.

to represent the control processor, which handles all call signaling andtraffic management functions. The model structure for a 4-port outputbuffered switch is illustrated in Figure 2. Also shown in the figure are allthe possible message flows between various LPs in this switch model.
4. BENCHMARK SCENARIOS
This article presents and compares the performance of the WarpKit andWaiKit parallel simulation kernels against a sequential kernel CelKit,using a number of ATM network scenarios. The simulation results, interms of simulated ATM network and traffic performance, are not the focusof this article. Rather, we are interested in which parallel simulationmechanisms can speed up the execution of simulations and to what extent.To accomplish this, we use a spectrum of irregular low-granularity ATMnetwork benchmark scenarios.
We use two ATM network topologies as the basis for seven benchmarkscenarios. The first of these, called Wnet, models the physical topology of aregional ATM testbed network in western Canada. The second, called theNTN, models the physical topology of a Canada-wide experimental Na-tional Test Network. For each network topology, we use a range of traffic
LP1
input port
output port
output portinput port
input port
output port
output port input portLP1
LP0
LP0
LP3LP3
LP2
LP2
LPnet_layer
LPSARlayer
Fig. 2. Logical processes in a 4-port output-buffered switch model..
370 • B. Unger et al.
ACM Transactions on Modeling and Computer Simulation, Vol. 10, No. 4, October 2000.

mixes to produce network traffic loads that range from light to medium toheavy.
While the traffic models have been validated against empirical trafficdata so that each traffic model instance can be considered realistic, theactual deployment of traffic sources and sinks in the benchmarks are notnecessarily realistic. In fact, the scenarios intentionally include congestion“hot spots” to explore how the parallel kernels perform under theseconditions. For example, all the TCP sources are exhaustive, in the sensethat each source tries to send (at the full link rate) as many packets asallowed based on TCP flow control rules. Also, zero host-level protocolprocessing time is assumed in TCP sources and sinks. While this is notrealistic, it does stress the simulation kernel (as well as the network beingmodeled). The Ethernet sources generate background IP (over ATM) traffic.TCP sources/sinks, which implement the full TCP algorithms, introducetraffic loops that model the interactions between hosts and network.
4.1 Wnet Scenarios
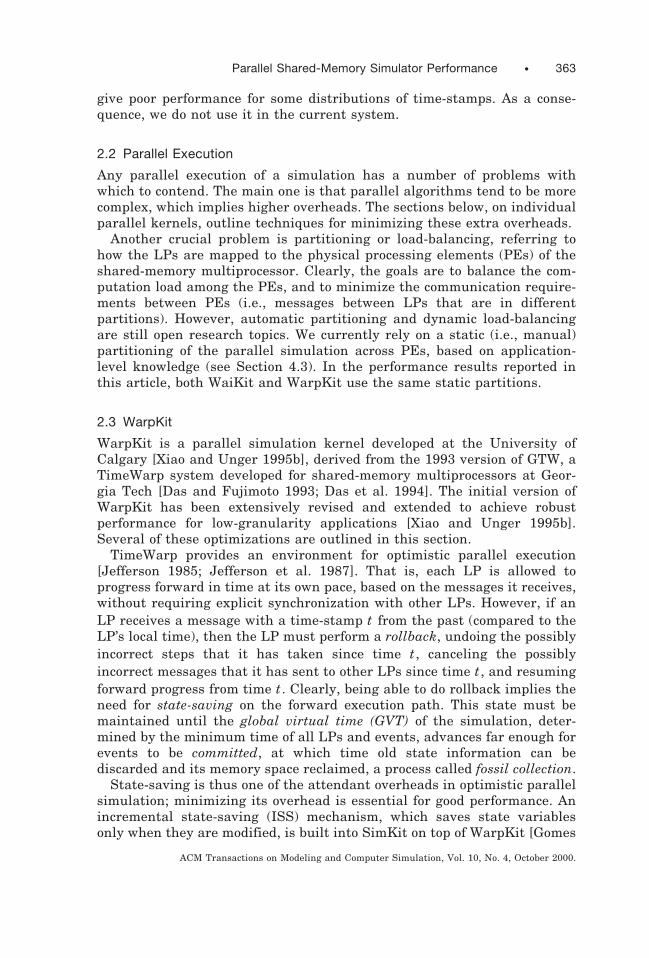
The Wnet benchmark topology, shown in Figure 3 along with traffic loadsfor scenarios Wnet-1 and Wnet-2, characterizes a regional ATM testbed inwestern Canada. This network connects five universities in three prov-inces. The network consists of 11 ATM switches, spanning a geographicdistance of approximately 800 kilometers. The backbone links in thenetwork have a transmission capacity of 45 Megabits per second (Mbps);other links are 155 Mbps.
The traffic load in the Wnet simulation model is chosen to representtypical traffic in the real Wnet testbed: JPEG video for distance educationbetween universities, TCP for file transfers between researchers and super-computer centers, Web users, and Ethernet traffic as a generator ofbackground traffic load between sites.
Three different levels of traffic load are defined on the Wnet model.Scenario Wnet-1 represents light load, with 12 traffic sources (10 Ethernet,2 MPEG). Scenario Wnet-2 represents medium load, with 25 traffic sources(2 deterministic, 2 Bernoulli, 10 Ethernet, 8 MPEG, 3 TCP). ScenarioWnet-3 is the same as Wnet-2, but with the addition of 4 Web trafficsources.
The Wnet benchmark scenarios are summarized in Table I. Each of thethree Wnet scenarios runs for 10 seconds of simulated time, producingapproximately 20 million simulation events.
4.2 NTN Scenarios
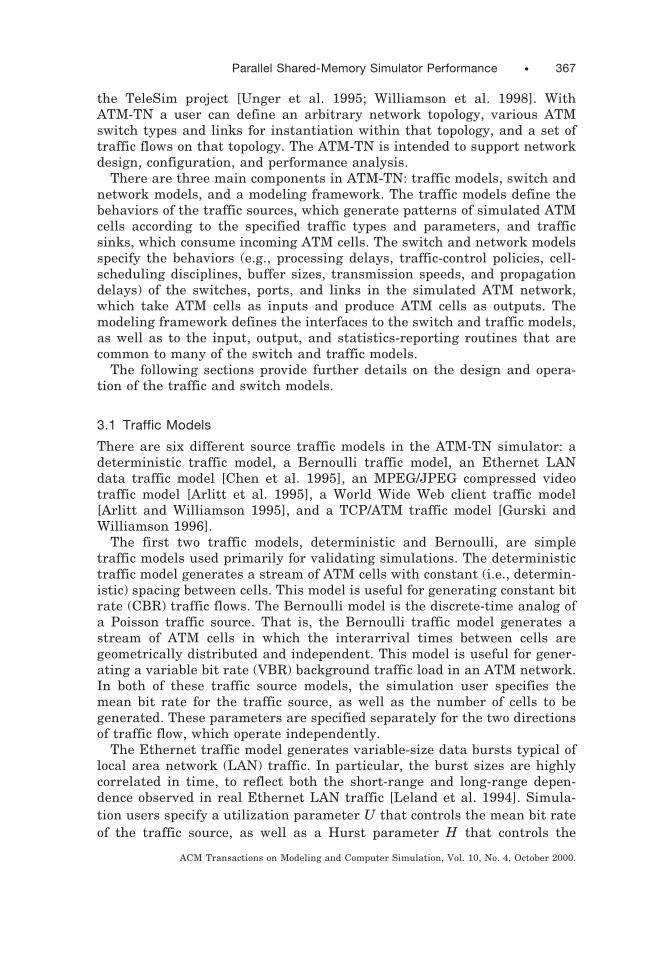
The NTN network topology, shown in Figure 4, represents the Canada-wideATM National Test Network (as of March 1996). The simulated networktopology has 54 ATM switches, and spans a geographic distance of approx-imately 3000 kilometers. The backbone of the network is 45 Mbps, andprovides connectivity between six regional ATM testbeds (one of which isWnet).
Parallel Shared-Memory Simulator Performance • 371
ACM Transactions on Modeling and Computer Simulation, Vol. 10, No. 4, October 2000.

Wne
t-2
Wne
t-1
UC
UA
->U
C E
th
UA
->U
C J
PE
G
UC
->U
A J
PE
GU
C->
UA
Eth
UA
HP
C->
UC
Eth
1
HP
C->
UC
Eth
2
UC
->H
PC
Eth
1U
C->
HP
C E
th2
UC
->U
A J
PE
GU
C->
HP
C E
th1
UC
->U
AJP
EG
UC
->U
ME
th UC
-.H
PC
Eth
2
UA
->U
C E
th
UM
->U
C E
th
HP
C->
UC
Eth
2H
PC
->U
C E
th1
UA
->U
C J
PE
G
CG
YR
EG
WP
G
UR
->U
S E
th
HP
C
ED
M
US
SK
T
UR
->U
S->
Eth
US
->U
R E
th
US
->U
R E
th
UM
UR
UM
->U
C E
thU
C->
UM
Eth
Det
erm
/Poi
s Tr
affic
LAN
Tra
ffic
MP
EG
Tra
ffic
TC
P T
raffi
c
Traf
fic S
ink
DS
3 45
Mbs
TAX
I 100
Mbs
ATM
Sw
itch
End
-nod
e
OC
3 15
5 M
bs
US
->H
PC
Eth
US
->H
PC
Poi
s
US
->U
M T
CP
US
->U
A J
PE
G
US
->U
R J
PE
GU
S->
UR
Eth
US
->U
C E
thU
S->
UR
MP
EG
HP
C->
US
Poi
s
UC
->U
SJP
EG
UC
->U
S E
thU
A->
US
Eth
UA
->U
S J
PE
G
UA
->U
M M
PE
G
UA
ED
M
CG
YH
PC
UC
RE
GW
PG U
MU
RSK
T
US
UM
->U
A M
PE
G
UC
->U
A E
thU
S->
UA
JP
EG
UA
->H
PC
TC
P
UA
->U
S E
th
UA
->U
C E
th
UA
->U
S J
PE
G
HP
C->
UM
Det
erm
HP
C->
US
Poi
s
UA
->H
PC
TC
P
UM
->H
PC
TC
P
UM
->H
PC
Det
erm
US
->H
PC
Poi
sU
R->
HP
C E
th
UR
->U
M E
th
UC
->U
R J
PE
G
US
->U
R E
thU
S->
UR
JP
EG
US
->U
R M
PE
GU
A->
UM
MP
EG
HP
C->
UM
Det
erm
UC
->U
M E
th
UR
->U
M E
th
UM
->H
PC
UM
->U
A
UM
->H
PC
TC
PU
A->
UC
Eth
UC
->U
R J
PE
G
UC
->U
S J
PE
G
UC
->U
M E
th
UC
->U
A E
th
UC
->U
S E
th
US
->U
C E
th
UR
->H
PC
Eth
US
->H
PC
Eth
Fig. 3. Simulation models for the Wnet ATM network benchmark.
372 • B. Unger et al.
ACM Transactions on Modeling and Computer Simulation, Vol. 10, No. 4, October 2000.

The NTN is a good example of a network with a high delay-bandwidthproduct. That is, the combination of high transmission speeds (45-155Mbps) and large end-to-end propagation delays (10-20 milliseconds) meansthat hundreds or thousands of ATM cells can be in transit at any time inthe network links. These types of network scenarios are of particular
LAN
Tra
ffic
MP
EG
Tra
ffic
Traf
fic S
ink
TC
P T
raffi
c
DS
3 45
Mbs
TAX
I 100
Mbs
OC
3 15
5 M
bs
ATM
Sw
itch
End
-nod
e
Rne
t
UB
C1
UB
C2
UB
C3
MP
R
SF
U
BC
TE
L
VA
NS
PH
VG
H
BC
CH
UN
ILA
RG
net
UW
O
UN
VH
BE
LL
FAN
VIC
H
SJH
RR
I
SAT
NR
C
OT
TU
CA
RL
CR
C
NO
R2
EW
N
KA
N
RID
BA
NK ALG
CA
LG
MIT
NO
R1
CR
C1
CR
C2
OC
RIn
et
GLB
RIS
Q
ST
F
AC
N
UD
L
AYL U
DS
MT
L
CT
I2C
TI1
BM
T
OS
T
CN
D
MC
G
CO
N
UD
Q
UD
M
Wne
t
Uof
A
HP
CC
Uof
C
CG
Y
Uof
M
RE
G
Uof
S SK
T
Uof
R
WP
G
ED
M
MA
RK
OT
T
EdT
el
Fig. 4. Simulation model for the NTN ATM network benchmark.
Parallel Shared-Memory Simulator Performance • 373
ACM Transactions on Modeling and Computer Simulation, Vol. 10, No. 4, October 2000.

interest to ATM networking researchers in evaluating, for example, theeffectiveness of feedback-based congestion control policies, the effectivenessof network traffic management on a national scale, and end-to-end qualityof service guarantees in large internetworks. These networks are alsochallenging to simulate, due to their memory-space and computationalrequirements (caused, for example, by a large number of traffic sources, alarge number of switches, large delay-bandwidth products, and very largeevent queue sizes). These are some of the motivating factors for includingthe NTN in our parallel simulation benchmarks.
The traffic loads we use on the NTN model are a hypothetical traffic mixfor the national network: MPEG/JPEG video streams, TCP transfers, andhighly bursty LAN data traffic. Approximately 75% of the traffic sourceshave their traffic sinks on the same regional network to model “communi-ties of interest.” The remaining traffic flows traverse the national back-bone.
Again, three different traffic loads (light, medium, and heavy) are usedfor this benchmark. All three scenarios have the same 355 traffic sources(62 Ethernet, 269 MPEG, and 24 TCP). However, different traffic loads areproduced by changing the parameters of the sources, rather than by addingtraffic sources, as was done with the Wnet benchmarks. This approachmakes the partitioning task easier on the large NTN benchmark, andmakes simulation comparisons across the three scenarios easier to under-stand. The first scenario, NTN-1, produces an average link utilization of30%. The second scenario, NTN-2, corresponds to an average load of 50%.The third scenario, NTN-3, corresponds to an average load of 80%. Even inthe lightly loaded NTN-1 and Wnet-1 there are “hot spots” where links aresaturated.
Another NTN scenario, NTN-0, contains 53 Ethernet, 30 MPEG, and 16TCP sources. This scenario was chosen to illustrate performance problemsin the WaiKit kernel when TCP sources are dominant.
The NTN benchmark scenarios are summarized in Table I. Each NTNscenario is run for 5 seconds of simulated time, producing 48-216 millionsimulation events.
Table I. Wnet and NTN Benchmark Scenario Summary
benchmarkscenario
number of traffic sourcesATM
switchnum.LPs
events~3 106!
time(sec)det bern ether mpeg web tcp
Wnet-1 0 0 10 2 0 0 11 181 22 10Wnet-2 2 2 10 8 0 3 11 173 18 10Wnet-3 2 2 10 8 4 3 11 173 18 10NTN-0 0 0 53 30 0 16 54 869 48 5NTN-1 0 0 62 269 0 24 54 1381 73 5NTN-2 0 0 62 269 0 24 54 1381 132 5NTN-3 0 0 62 269 0 24 54 1381 216 5
374 • B. Unger et al.
ACM Transactions on Modeling and Computer Simulation, Vol. 10, No. 4, October 2000.

4.3 Partitioning
Partitioning the Wnet and NTN benchmark scenarios was done manually,based on a prerun of the simulation and the load data collected in theprerun. The main target is to make the sum of the LP loads on eachpartition roughly equal. The load of an LP is the time it spends processingevents for the entire duration of a simulation run. While there are manyways to divide the LP loads into equal portions, other considerations areimportant for performing parallel execution.
Partitioning remains a trial-and-error procedure, because numerous fac-tors in a large irregular network model often interact in complex ways. Theeffect of these factors on execution is mainly determined by event bufferusage and rollback rates. Here, we discuss the major criteria used inpartitioning the benchmark scenarios (LP mapping, buffer cache locality,grouping source and sink LPs, minimizing message exchanges).
The LP is the basic element in parallel execution. The simulation kernelforces correct event ordering for each LP. Proper design of LPs in a modelwill affect the available parallelism. Generally, if there are two eventstreams that are unrelated, or at least not closely related, then separateLPs should be used for them. This approach may eliminate unnecessaryrollbacks for WarpKit, and improve lookaheads in the case of WaiKit. Inthis respect, the ATM-TN simulator used for parallel execution differsslightly from its original sequential version.
When a cell travels in the simulated network it is carried by an eventbuffer at each point where it stops for processing, and a new buffer is usedto carry it to the next point. If the cell remains on the same processor onthe way from source to sink, the buffers that carry it will stay on the sameprocessor. Thus, the assignment of LPs to processors should try to mini-mize the number of processors that a cell has to visit in order to reduceundesirable cache effects (i.e., cache misses).
Most of the LPs in ATM-TN have a message “fanout” of one; that is, foreach message received, one message will be sent to the next LP. The trafficsource and sink LPs are exceptions. Source LPs typically have a fanoutgreater than one (e.g., several cells in each traffic burst produced by theEthernet source model), and sink LPs typically have a fanout less than one(e.g., Ethernet sinks consuming incoming cells). Assigning source and sinkLPs of the same traffic flow to the same processor will balance the buffersconsumed at the source and returned at the sink, reducing buffer migrationbetween processors. This is especially good for open-loop traffic sources(e.g., Ethernet, MPEG), where sinks never send any messages. However,for closed-loop TCP traffic flows, where the sinks send acknowledgmentsback to the source, the source and sink LPs are best grouped together withthe LPs of the switches to which they are connected. Otherwise, cellsarriving at the sink require a different processor than the acknowledg-ments (or other sink-initiated cells) returning to the source. The result is ahigher chance of rollbacks. Furthermore, rollbacks at the start of message
Parallel Shared-Memory Simulator Performance • 375
ACM Transactions on Modeling and Computer Simulation, Vol. 10, No. 4, October 2000.

flow are particularly bad, as they tend to cascade, causing further rollbacksdownstream [Tay et al. 1998].
Another criterion is the reduction of message exchanges between proces-sors. For large scenarios with heavy traffic loads, such as NTN-3, “blockpartitioning” is better. Block partitioning divides the network into geo-graphic regions based on vicinity, under the assumption that most commu-nication is “local.” (The same idea is used in military and wireless networksimulations [Meyer and Bagrodia 1998; Zeng et al. 1998].) As a result, mostmessages in the model remain on the same processor. For models with fewswitches and light traffic loads, partitioning by traffic flows may yieldbetter performance, since messages originating from a source will traversefewer processors, thus reducing communication between processors as well.
The same partitions of all the benchmarks are used for both WarpKit andWaiKit experiments. A good partition for WaiKit is also a good partition forWarpKit. The reverse also turned out to be true, i.e., a good partition forWarpKit resulted in good performance for WaiKit. This strongly suggeststhat the dominant factor in partitioning lies with the characteristics of theapplication. The benefits of efficient buffer use are the same for bothkernels, and reduced rollbacks often translate into better lookaheads forWaiKit, as mentioned previously.
5. PERFORMANCE RESULTS
This section presents the results of kernel performance for the sevenbenchmark scenarios. All experiments were run on a dedicated SGI PowerChallenge shared-memory multiprocessor with 18 R8000 CPUs runningIRIX64 6.1. Section 5.1 discusses the statistical significance of the kernelperformance results presented in subsequent sections. Section 5.2 gives thesequential simulation performance results for the Wnet and NTN bench-marks. Section 5.3 presents the results for the WarpKit optimistic parallelsimulation kernel. Section 5.4 shows the results for the WaiKit conserva-tive parallel simulation kernel. Finally, Section 5.5 compares the perfor-mance of the different simulators for each benchmark scenario.
5.1 Validating Performance Results
The ATM-TN simulator has been used for studies of ATM traffic; TCP overATM performance, call-admission control and congestion control algo-rithms [Chen et al. 1995; Gurski and Williamson 1996; Patel and William-son 1997; Wang et al. 1999; Zoranovic and Williamson 1999]. The valida-tion of network model simulation results has been explored over severalyears at a number of levels, including individual LP event tracing, use ofsimple scenarios for which comparable analytic results can be calculated,and comparisons of simulation results with measurements collected withincarefully controlled network experiments. Here, in addition to model vali-dation, it is important that model simulation results are essentially identicalwhen executed on different kernels and on different numbers of processors.
376 • B. Unger et al.
ACM Transactions on Modeling and Computer Simulation, Vol. 10, No. 4, October 2000.

The ATM-TN has extensive statistics’ collection for all network compo-nents being simulated. A valid parallel simulation should produce the same(or very close) statistical results for all network components as the sequen-tial simulator, regardless of the kernel or the number of processors used.For the seven benchmark scenarios, all model simulation results areidentical when run sequentially on a single processor, or when executed inparallel on different numbers of processors. The only difference is the order
five sets of random seeds:
Simulated time duration in seconds
12
5 10 5020 100
11
10
8 80
10.5
11.5
95
90
100
Per
cent
age
of c
omm
itted
eve
nts
Ave
rage
per
eve
nt ti
me
in m
icro
-sec
onds
with WarpKit on 4 processors
Fig. 5. Stability of performance results for NTN-0.
five sets of random seeds:
Simulated time duration in seconds
5 10 5020 10080
95
90
100
14
13.5
13
12.5
10
12
Ave
rage
per
eve
nt ti
me
in m
icro
-sec
onds
Per
cent
age
of c
omm
itted
eve
nts
with WarpKit on 4 Processors
Fig. 6. Stability of performance results for NTN-1.
Parallel Shared-Memory Simulator Performance • 377
ACM Transactions on Modeling and Computer Simulation, Vol. 10, No. 4, October 2000.

of records (lines) in the output reports. Due to the asynchronous nature ofparallel execution, different components may report their statistics data atdifferent (real) times in each run. For Wnet-1 with WarpKit, the totalnumber of committed events (events correctly processed) is always exactlythe same for runs on different numbers of processors, which demonstratesthe stability of the WarpKit kernel. For other test scenarios, the totalnumber of events varies slightly (e.g., a difference of at most severalthousand events out of 20 to 200 million events). The reason for thesedifferent event counts is that Wnet-1 is a deterministic model in which notwo events for the same LP have identical timestamps, while the otherscenarios are nondeterministic. The latter occurs because the TCP modelcan generate many events with exactly the same timestamp (due to the factthat zero host-processing time is assumed). It is well known that nondeter-ministic models typically result in different event-processing orders forthose events with identical timestamps. This nondeterminism may or maynot affect the simulation results, depending on the application. In theexperiments reported here, no variation in simulation statistical resultsoccurred (within the precision of the statistics reported by the simulations).
The main focus of this article is on the execution speed of alternativesimulation kernels for a range of benchmark scenarios. Our primaryconcern in this section is the validity and stability of our measurement ofsimulation execution speed. For measuring kernel performance, we areinterested in the total execution time for a particular scenario. The simula-tion runs used to collect performance data are relatively short (e.g., 5-10seconds of simulated time) compared to those used in real ATM networksimulation studies (e.g., 10-1000 seconds). The primary reason for this isthe need to fit multiple runs into the weekly time periods during which wehave exclusive use of the entire SGI Power Challenge. However, these runlengths are adequate for comparing the performance of the three simula-tion kernels.
To justify our claim, we present the results of two performance stabilitytests. Figure 5 shows the results for NTN-0 with WarpKit on four proces-sors. Five sets of random number seeds are used. For each set of seeds, fivetest runs with increasing simulated time (5, 10, 20, 50, and 100 seconds)are carried out. The upper part of the graph gives the average time inmicroseconds spent on each event, which is used to measure the speed ofsimulation progress. The lower the per-event time, the faster the simula-tion. The lower part of the figure shows the percentage of committedevents. For example, a value of 80% means that out of every 10 processedevents, 8 events are correct, 2 events are erroneous and had been rolledback, that is, a 20% rollback rate. The graph indicates the inverse relation-ship between per-event time and percentage of committed events. Withincreasing simulation time duration, the percentage of committed eventsincreases and per-event time decreases. The decrease of per-event time ismore pronounced than the increase in the percentage of committed events,due to the extra cost of rollbacks. The variation in per-event time for
378 • B. Unger et al.
ACM Transactions on Modeling and Computer Simulation, Vol. 10, No. 4, October 2000.

different random seeds is less than 4%. We also observe that the degree ofvariability in the per-event time from one run to the next is not noticeablylower after 100 seconds of simulated time than it is after 5 seconds ofsimulated time; hence our choice of 5-second runs for the NTN scenarios.
Figure 6 gives the test results for NTN-1, which shows the same trend asthat for NTN-0. The variation in per-event time from one run to another forthis scenario is higher, but still less than 7%. The influence of rollback rateon per-event time is more dominant in this case. Another type of test is torepeatedly run the same simulation without any changes. As an example,the per-event times for 6 runs of NTN-1 (each for 5 seconds of simulatedtime) on 4 processors vary between 13.50 and 13.54, which is a variation of0.3%.
5.2 CelKit Performance Results
The performance results for the event-list-based Sequential Simulator(CelKit) are presented in Table II, which shows the per-event time inmicroseconds on the SGI Power Challenge for the 7 ATM-TN benchmarkscenarios. (The per-event time is defined as the total execution time dividedby the total number of (committed) events, for both sequential and parallelexecution.) The table gives the total wall-clock execution time for 5 or 10seconds of simulated time as well. The wall-clock time for sequentialexecution of the benchmarks ranges from about 4 minutes for the Wnetbenchmarks to 77 minutes for the NTN-3 model. The per-event time isapproximately 11.5 microseconds for all three Wnet benchmarks, while theper-event time grows slightly with the traffic load on the NTN benchmarks,up to 21.3 microseconds per simulation event in NTN-3. The growth islargely a result of the increase in the number of events on the event list andlarger memory required to run the simulation.
Table II also includes a column indicating the potential, or intrinsicparallelism, for each network scenario. The time it takes to run a simula-tion model sequentially is called the sequential execution time of the model.A model’s intrinsic parallelism is defined as the ratio of its sequentialexecution time over the least time needed to execute that model, assumingthere are always enough processors to enable the execution of any LP ready
Table II. Per-Event Time in Microseconds for CelKit Sequential Simulation Kernel (SGIPower Challenge R8000)
benchmark scenarioper-event execution
time in microsecondstotal execution time
in seconds potential parallelism
Wnet-1 11.50 253 11Wnet-2 11.43 206 15Wnet-3 11.32 204 19NTN-0 14.80 710 42NTN-1 18.75 1369 66NTN-2 20.32 2682 60NTN-3 21.30 4601 64
Parallel Shared-Memory Simulator Performance • 379
ACM Transactions on Modeling and Computer Simulation, Vol. 10, No. 4, October 2000.

to execute. The least time is determined by the user execution time alongthe model’s critical path. Events along the critical path have to be pro-cessed in sequence. The critical path is the path that takes the longest timeto process. No parallel execution can take less time than this time. Thevalue of intrinsic parallelism is calculated using a feature of CelKit. Itmeasures the total execution time along the critical path in the simulation.The critical path is discussed more completely in Xiao and Unger [1995b].The value given in the table is the total sequential time divided by thecritical path time. The resulting ratio is a rough measure of the bestrelative speedup possible for the parallel simulators on that particularproblem. The Wnet scenarios have potential speedups of 11 to 19, NTN-0 issomewhat larger at 42, and the 3 NTN scenarios are grouped at approxi-mately 60 to 66.
The per-event execution time for NTN-0 is substantially lower than otherNTN scenarios, due to its much lighter traffic load. The length of the eventlist increases with the traffic load as more events are generated andscheduled for processing. As a result, the cost of queue operations, which isthe major part of system overhead in a central event list-based sequentialkernel, increases significantly.
5.3 WarpKit Performance Results
Performance results for the WarpKit optimistic parallel simulation kernelare shown in Figure 7. The figure shows the relative speedup for theWarpKit simulator on the ATM-TN benchmarks as the number of proces-sors on the SGI Power Challenge is varied from 1 to 16. Relative speedup isthe ratio of the time required (for WarpKit) on one processor divided by thetime required (for WarpKit) using N processors (N $ 1). This kind ofresult is mainly useful for analyzing how well a particular algorithm scalesas the number of processors increases. Note that these results do notanswer the question of how well the algorithm performs compared to eithersequential or other parallel algorithms. (The latter comparisons are de-ferred to Section 5.5.)
The results in Figure 7 show that WarpKit achieves good relativespeedup as the number of processors increases. The results are alsoconsistent, in that at each number of processors, the speedup curves for thedifferent benchmark scenarios are nearly always in the same relativeorder, which implies that the relative performance is primarily determinedby the size, structure, traffic load, and partitioning of each problem. Theonly exception to this is at 8 processors, where Wnet-3 has slightly betterperformance than Wnet-2.
There is some evidence that similar ATM-TN simulation problems withmore traffic give better speedup. The sequence NTN-1, NTN-2, and NTN-3,for example, shows steadily increasing speedup (these scenarios differ onlyin their loads). The tendency is less clear for the other scenarios, however.The Wnet scenarios are likely to be limited by their potential parallelism ofless than 15 (for example, Wnet-1 achieves half of its potential on 16
380 • B. Unger et al.
ACM Transactions on Modeling and Computer Simulation, Vol. 10, No. 4, October 2000.
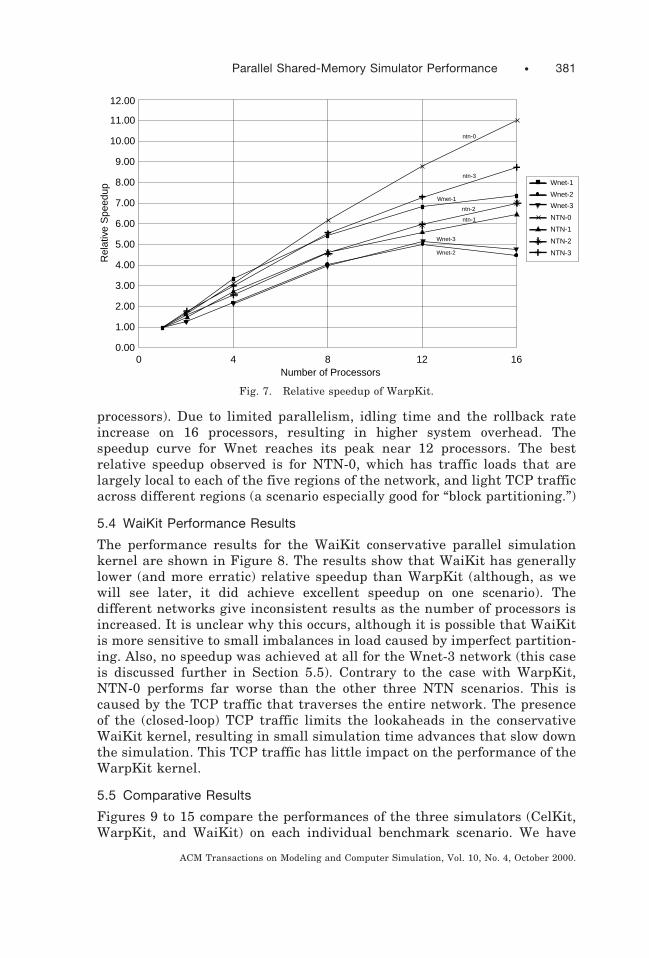
processors). Due to limited parallelism, idling time and the rollback rateincrease on 16 processors, resulting in higher system overhead. Thespeedup curve for Wnet reaches its peak near 12 processors. The bestrelative speedup observed is for NTN-0, which has traffic loads that arelargely local to each of the five regions of the network, and light TCP trafficacross different regions (a scenario especially good for “block partitioning.”)
5.4 WaiKit Performance Results
The performance results for the WaiKit conservative parallel simulationkernel are shown in Figure 8. The results show that WaiKit has generallylower (and more erratic) relative speedup than WarpKit (although, as wewill see later, it did achieve excellent speedup on one scenario). Thedifferent networks give inconsistent results as the number of processors isincreased. It is unclear why this occurs, although it is possible that WaiKitis more sensitive to small imbalances in load caused by imperfect partition-ing. Also, no speedup was achieved at all for the Wnet-3 network (this caseis discussed further in Section 5.5). Contrary to the case with WarpKit,NTN-0 performs far worse than the other three NTN scenarios. This iscaused by the TCP traffic that traverses the entire network. The presenceof the (closed-loop) TCP traffic limits the lookaheads in the conservativeWaiKit kernel, resulting in small simulation time advances that slow downthe simulation. This TCP traffic has little impact on the performance of theWarpKit kernel.
5.5 Comparative Results
Figures 9 to 15 compare the performances of the three simulators (CelKit,WarpKit, and WaiKit) on each individual benchmark scenario. We have
0 4 8 12 16Number of Processors
0.00
1.00
2.00
3.00
4.00
5.00
6.00
7.00
8.00
9.00
10.00
11.00
12.00
Wnet-3
NTN-0
NTN-1
NTN-2
NTN-3
Wnet-2
Wnet-1ntn-3
ntn-1
ntn-2
Wnet-1
Wnet-3
Wnet-2
ntn-0
Rel
ativ
e S
peed
up
Fig. 7. Relative speedup of WarpKit.
Parallel Shared-Memory Simulator Performance • 381
ACM Transactions on Modeling and Computer Simulation, Vol. 10, No. 4, October 2000.

separated the results in this way because each of the scenarios hasdifferent amounts of computation, potential parallelism, and partitioning.However, for a given number of processors the results should be directlycomparable. Each graph plots the total number of events per secondachieved against the number of processors for each of the three kernels. Forthe sequential simulator (CelKit), a single horizontal line has been addedat its uniprocessor performance point.
5.5.1 Wnet-1. For the Wnet-1 scenario, WaiKit achieves very good per-formance (see Figure 9). On one processor it is already faster than CelKit,and it improves from there. WaiKit reaches close to its best performance at8 processors, where it is over 4 times faster than CelKit. While WarpKitachieves good smooth relative speedup, it only performs better than CelKiton 4 and more processors. Wnet-1 is a special scenario because it has onlyEthernet and MPEG traffic sources. All traffic flows are thus unidirec-tional, and there are no loops in the traffic flows. As a result, the averagenumber of events executed each time an LP is scheduled in WaiKit ispotentially very high (in practice it is limited by available buffer space).This explains its very good performance, including why it can outperform asequential simulator. What it is effectively doing is avoiding the overheadsof event list insertion and removal by its simple scheduling algorithm.
5.5.2 Wnet-2. The Wnet-2 scenario has fewer LPs and events thanWnet-1, but a wider range of traffic source types. In particular, it includesTCP sources, which introduce feedback loops into the traffic flows. Thespeedup of both WaiKit and WarpKit behave erratically as the number ofprocessors is increased (see Figure 10). For WaiKit, the performance at 8processors seems anomalously low, but it achieves the best performance
8.00
7.00
6.00
5.00
4.00
3.00
2.00
1.00
0.00164 8 120
Number of Processors
ntn-1
ntn-2
ntn-3
ntn-0
Wnet-3
Wnet-2
Wnet-1
Wnet-3
NTN-0
NTN-1
NTN-2
NTN-3
Wnet-2
Wnet-1
Rel
ativ
e S
peed
up
Fig. 8. Relative speedup of WaiKit.
382 • B. Unger et al.
ACM Transactions on Modeling and Computer Simulation, Vol. 10, No. 4, October 2000.
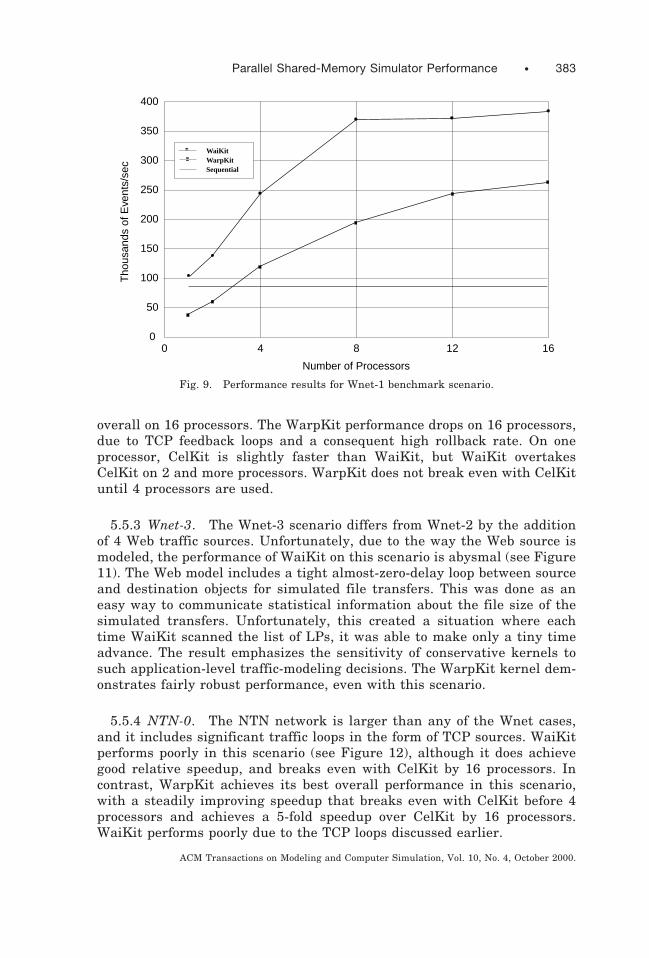
overall on 16 processors. The WarpKit performance drops on 16 processors,due to TCP feedback loops and a consequent high rollback rate. On oneprocessor, CelKit is slightly faster than WaiKit, but WaiKit overtakesCelKit on 2 and more processors. WarpKit does not break even with CelKituntil 4 processors are used.
5.5.3 Wnet-3. The Wnet-3 scenario differs from Wnet-2 by the additionof 4 Web traffic sources. Unfortunately, due to the way the Web source ismodeled, the performance of WaiKit on this scenario is abysmal (see Figure11). The Web model includes a tight almost-zero-delay loop between sourceand destination objects for simulated file transfers. This was done as aneasy way to communicate statistical information about the file size of thesimulated transfers. Unfortunately, this created a situation where eachtime WaiKit scanned the list of LPs, it was able to make only a tiny timeadvance. The result emphasizes the sensitivity of conservative kernels tosuch application-level traffic-modeling decisions. The WarpKit kernel dem-onstrates fairly robust performance, even with this scenario.
5.5.4 NTN-0. The NTN network is larger than any of the Wnet cases,and it includes significant traffic loops in the form of TCP sources. WaiKitperforms poorly in this scenario (see Figure 12), although it does achievegood relative speedup, and breaks even with CelKit by 16 processors. Incontrast, WarpKit achieves its best overall performance in this scenario,with a steadily improving speedup that breaks even with CelKit before 4processors and achieves a 5-fold speedup over CelKit by 16 processors.WaiKit performs poorly due to the TCP loops discussed earlier.
WaiKitWarpKitSequential
50
0
100
150
200
250
300
350
400
Number of Processors
0 4 8 12 16
Tho
usan
ds o
f Eve
nts/
sec
Fig. 9. Performance results for Wnet-1 benchmark scenario.
Parallel Shared-Memory Simulator Performance • 383
ACM Transactions on Modeling and Computer Simulation, Vol. 10, No. 4, October 2000.

5.5.5 NTN-1, NTN-2, and NTN-3. The NTN-1, NTN-2, and NTN-3networks are identical, except for the volume of traffic loads. Figures 13,14, and 15 show that the performance of the sequential kernel dropsslightly with increased load, due to the increase in the size of the event list.The performance of WaiKit and WarpKit is consistent across the threescenarios. In each case, WarpKit breaks even with CelKit between 2 and 4processors and proceeds to achieve its best performance at 16 processors.
Number of Processors
0 4 8 12 16
400
350
300
250
200
150
100
50
0
Tho
usan
ds o
f Eve
nts/
sec Sequential
WarpKitWaiKit
Fig. 10. Performance results for Wnet-2 benchmark scenario.
WaiKitWarpKitSequential
Number of Processors
4 8 12 1600
50
100
150
200
250
300
350
400
Tho
usan
ds o
f Eve
nts/
sec
Fig. 11. Performance results for Wnet-3 benchmark scenario.
384 • B. Unger et al.
ACM Transactions on Modeling and Computer Simulation, Vol. 10, No. 4, October 2000.

The overall performance of WarpKit also improves steadily with theincreased loads. WaiKit has more erratic performance, particularly be-tween 4 and 8 processors. However, it improves significantly as the loadincreases from NTN-1 (where WaiKit is significantly below WarpKit acrossthe full range of numbers of processors) to NTN-3 (where WaiKit actuallyoutperforms CelKit and WarpKit, in the 2-processor case only). Thisimprovement is to be expected, as the increasing load increases the averagenumber of events to be processed each time an LP is scheduled, thus
Number of Processors
0 4 8 12 160
50
100
150
200
250
300
350
400
Tho
usan
ds o
f Eve
nts/
sec
WaiKitWarpKitSequential
Fig. 12. Performance results for NTN-0 benchmark scenario.
WaiKitWarpKitSequential
150
0
50
100
200
250
300
400
350
0 4 8 12 16
Tho
usan
ds o
f Eve
nts/
sec
Number of Processors
Fig. 13. Performance results for NTN-1 benchmark scenario.
Parallel Shared-Memory Simulator Performance • 385
ACM Transactions on Modeling and Computer Simulation, Vol. 10, No. 4, October 2000.

reducing the overheads for WaiKit (recall that the lookaheads are static,based primarily on network topology).
6. SUMMARY AND CONCLUSIONS
This article presents a performance study comparing conservative andoptimistic parallel simulation kernels, as well as a sequential simulationkernel, on a set of large irregular ATM network benchmarks. The study
WaiKitWarpKitSequential
Number of Processors
Tho
usan
ds o
f Eve
nts/
sec
0 4 8 12 160
50
100
150
200
250
300
350
400
Fig. 14. Performance results for NTN-2 benchmark scenario.
Number of Processors
400
350
300
250
200
150
50
00 4 8 12 16
Tho
usan
ds o
f Eve
nts/
sec
WaiKitWarpKitSequential
100
Fig. 15. Performance results for NTN-3 benchmark scenario.
386 • B. Unger et al.
ACM Transactions on Modeling and Computer Simulation, Vol. 10, No. 4, October 2000.
evaluates two different parallel simulation kernels with respect to relativespeedup, and also absolute speedup compared to a sequential kernel, aswell as the sensitivity of simulator performance to the size, structure,topology, and traffic flow in the simulated networks.
Our experimental results show that parallel simulation can offer sub-stantial execution speedup for ATM network applications. While the appli-cation-level event granularity in a cell-level ATM simulator is small, thehigh delay-bandwidth products of real ATM networks translate into simu-lations with high potential parallelism. We show that within a circum-scribed and well-characterized domain (i.e., cell-level ATM networks), it ispossible to make effective use of parallelism. The major remaining barrierto the use of such a system (by users who are not expert in parallelism) isthe partitioning of the simulations across multiple PEs.
Our results also highlight the fragile nature of conservative parallelsimulation performance. In particular, we found that the conservativekernel is very susceptible to small changes in the modeling code, whichmakes it possible for it to give the best performance on a few scenarios andthe worst performance on others. The optimistic kernel, on the other hand,provides excellent relative speedup and more robust performance on thebenchmarks tested. However, its performance is limited by the implemen-tation overheads, which are actually higher than the grain of the modelcomputation for these low granularity applications.
It is worth noting what this work has not demonstrated. It has not shownthat arbitrary simulation problems can be executed in parallel by inexpertusers. The success of the system depends on careful attention to detail andthe influence of parallel execution at all levels of the system. This startedat the language interface (SimKit), which was constrained to use a logicalprocess decomposition and communication via messages, together with asimple lightweight set of calls. The ATM-TN model was engineered to fitthe LP decomposition by careful placement of parallel activities in differentLPs and by putting in the extra effort needed to work with the SimKitinterface (for example, by eschewing shared state). As described earlier, thetwo parallel kernels also include many careful optimizations to ensure lowoverheads. The relative importance of these is probably particular to theATM-TN problem. Different optimizations might be important for differentproblem classes.
The performance results presented in Section 5 depend on the underlyingshared memory platform. In particular, the absolute performance resultsdirectly depend on the SGI platform. However, we believe the comparativeresults and conclusions for SMP architectures are not sensitive to thespecific SGI platform. We have performed similar experiments on an8-processor SPARC SMP platform with similar results. In general, imple-menting kernels and kernel optimizations also has a significant impact onperformance—for example, implementations must consider cache perfor-mance.
The original intention was that the SimKit interface provide a transpar-ent portable interface independent of the underlying simulation kernel.
Parallel Shared-Memory Simulator Performance • 387
ACM Transactions on Modeling and Computer Simulation, Vol. 10, No. 4, October 2000.

This has generally been successful, but did manifest two problems. In thecase of WarpKit, it was necessary to extend this kernel to deal withevent-flow control issues, as well as add code for state-saving (although, inprinciple, we understand how to do state-saving efficiently and transpar-ently [Gomes 1996]). In the case of WaiKit, it was necessary to specify thechannel connectivity between LPs and to compute lookahead informationfor the channels. More work is also needed to improve modeling practiceand avoid small lookahead loops.
For future work, the two major problems are those of load-balancing andfurther reducing kernel-level overheads. For ATM-TN, dynamic load-bal-ancing is very difficult. The low per-event granularity means that littletime can be spent thinking about where work is to be done or on movingLPs around between processors. For example, the overheads for measuringactual execution times by LPs is too high to be useful. We believe thisproblem would be even harder in distributed memory architectures, due tothe extra complexity and overheads of LP migration in such an environ-ment (the cost of migration still exists in shared-memory systems—it is justhidden as cache-miss overheads). The success of LP-level rather thanevent-level scheduling in WaiKit points to one possible solution, namely todo the load-balancing at a larger grain size than that of events or even LPs.This is a promising idea that we explored in a new conservative algorithmand the TasKit simulation kernel that implements it [Xiao et al. 1999]. Theperformance of the new kernel has demonstrated dramatic improvement.(Comparisons of TasKit kernel performance will be presented in a subse-quent article.)
The second major problem is that of continuing to reduce the overheadsdue to parallel execution. WaiKit shows that it may be possible to do thisby paying careful attention to the grain size at which different overheadsoccur and by using simple algorithms on these larger grain sizes. Unfortu-nately, WaiKit also shows extreme sensitivity to the application-levelmodeling code; it has not yet been demonstrated that these problems can beovercome. Progress may require further violation of SimKit’s interface (forexample, by making channels and their lookahead explicitly accessible tousers), which makes the modeling problem even harder.
One interesting feature of these results is the general robustness andgood relative speedup of the WarpKit kernel. The problem is that it hashigh overheads which are difficult to overcome in a low-granularity appli-cation such as the ATM-TN. However, in other problem domains withhigher granularity (say over 100 m-sec per-event), TimeWarp is probably agood choice for obtaining speedup, although still requiring expert guidanceon issues such as model partitioning and event flow control.
ACKNOWLEDGMENTS
The authors wish to thank the many people who have directly contributedto the design, implementation, and use of the ATM-TN simulator in itscurrent form, and to its ongoing existence in our collaborative TeleSim
388 • B. Unger et al.
ACM Transactions on Modeling and Computer Simulation, Vol. 10, No. 4, October 2000.

research project. To name a few, these people include: Martin Arlitt, YingChen, Alan Covington, Adi Damian, Julie Doerksen, Mark Fox, SteveFranks, Pawel Gburzynski, Fabian Gomes, Remi Gurski, Tim Harrison,Xiaoming Li, Guang Lu, Theodore Ono-Tesfaye, Srinivasan Ramaswamy,Rob Simmonds, and Jiayun Zhu. In particular, Remi Gurski and TimHarrison were instrumental in establishing the Wnet and NTN benchmarkscenarios in ATM-TN.
REFERENCES
ARLITT, M., CHEN, Y., GURSKI, R., AND WILLIAMSON, C. 1995. Traffic modeling in the ATM-TNtelesim project: Design, implementation, and performance evaluation. In Proceedings of the1995 Summer Conference on Computer Simulation (SCSC’95, Ottawa, Ont.). 847–851.
ARLITT, M. AND WILLIAMSON, C. 1995. A synthetic workload model for internet mosaictraffic. In Proceedings of the 1995 Summer Conference on Computer Simulation (SCSC’95,Ottawa, Ont.). 852–857.
ARLITT, M. F. AND WILLIAMSON, C. L. 1997. Internet Web servers: workload characterizationand performance implications. IEEE/ACM Trans. Netw. 5, 5, 631–645.
ATM FORUM. 1996. Traffic management 4.0 specification. ATM Forum Technical Committee.AVRIL, H. AND TROPPER, C. 1995. Clustered time warp and logic simulation. In Proceedings of
the 9th Workshop on Parallel and Distributed Simulation (PADS ’95, Lake Placid, NY, Jun14-16). IEEE Computer Society Press, Los Alamitos, CA.
BAGRODIA, R. AND LIAO, W. 1994. Masie: A language for design of efficient discrete-eventsimulations. IEEE Trans. Softw. Eng. 20, 4 (Apr.), 225–238.
BLANCHARD, T. D., LAKE, T. W., AND TURNER, S. J. 1994. Cooperative acceleration: robustconservative distributed discrete event simulation. SIGSIM Simul. Dig. 24, 1 (July), 58–64.
BROWN, R. 1988. Calendar queues: a fast 0(1) priority queue implementation for thesimulation event set problem. Commun. ACM 31, 10 (Oct.), 1220–1227.
CAI, W., LETERTRE, E., AND TURNER, S. J. 1997. Dag consistent parallel simulation: apredictable and robust conservative algorithm. SIGSIM Simul. Dig. 27, 1, 178–181.
CAROTHERS, C. D., FUJIMOTO, R. M., AND LIN, Y.-B. 1995. A case study in simulating PCSnetworks using Time Warp. SIGSIM Simul. Dig. 25, 1 (July), 87–94.
CHANDY, K. M. AND MISRA, J. 1979. Distributed simulation: A case study in design andverification of distributed programs. IEEE Trans. Softw. Eng. 5, 5 (Sept.), 440–452.
CHEN, Y.-A. AND BAGRODIA, R. 1998. Shared memory implementation of a parallel switch-levelcircuit simulator. SIGSIM Simul. Dig. 28, 1, 134–141.
CHEN, Y., DENG, Z., AND WILLIAMSON, C. 1995. A model for self-similar Ethernet lan traffic:Design, implementation, and performance implications. In Proceedings of the 1995 SummerConference on Computer Simulation (SCSC’95, Ottawa, Ont.). 831–837.
CLEARY, J. G. AND TSAI, J.-J. 1996. Conservative parallel simulation of ATMnetworks. SIGSIM Simul. Dig. 26, 1, 30–38.
CROVELLA, M. E. AND BESTAVROS, A. 1996. Self-similarity in World Wide Web traffic: evidenceand possible causes. SIGMETRICS Perform. Eval. Rev. 24, 1, 160–169.
DAS, S. R. AND FUJIMOTO, R. M. 1993. A performance study of the cancelback protocol for TimeWarp. SIGSIM Simul. Dig. 23, 1 (July), 135–142.
DAS, S., FUJIMOTO, R., PANESAR, K., ALLISON, D., AND HYBINETTE, M. 1994. GTW: A time warpsystem for shared memory multiprocessors. In Proceedings of the 1994 Winter Conference onSimulation (WSC ’94, Lake Buena Vista, FL, Dec. 11–14), M. S. Manivannan and J. D. Tew,Eds. Society for Computer Simulation, San Diego, CA, 1332–1339.
FUJIMOTO, R. M. 1989. Time warp on a shared memory multiprocessor. In Proceedings of theInternational Conference on Parallel Processing (ICPP ’89, Aug.). Pennsylvania StateUniversity, University Park, PA, 242–249.
FUJIMOTO, R. M. 1990. Parallel discrete event simulation. Commun. ACM 33, 10 (Oct.),30–53.
Parallel Shared-Memory Simulator Performance • 389
ACM Transactions on Modeling and Computer Simulation, Vol. 10, No. 4, October 2000.

GARRETT, M. W. AND WILLINGER, W. 1994. Analysis, modeling and generation of self-similarVBR video traffic. SIGCOMM Comput. Commun. Rev. 24, 4 (Oct.), 269–280.
GOMES, F. 1996. Optimizing incremental state-saving and restoration. Ph.D. Dissertation.University of Calgary, Calgary, Canada.
GOMES, F., CLEARY, J., COVINGTON, A., FRANKS, S., UNGER, B., AND ZIAO, Z.-E. 1995. SimKit: ahigh performance logical process simulation class library in C1. In Proceedings of the 1995Winter Conference on Simulation (WSC ’95, Arlington, VA, Dec. 3–6), C. Alexopoulos and K.Kang, Eds. ACM Press, New York, NY, 706–713.
GURSKI, R. AND WILLIAMSON, C. 1996. TCP over ATM: Simulation model and performanceresults. In Proceedings of the 1996 IEEE International Conference on Computers andCommunications (Phoenix, AZ, Mar.). IEEE Computer Society Press, Los Alamitos, CA,328–335.
JEFFERSON, D. R. 1985. Virtual time. ACM Trans. Program. Lang. Syst. 7, 3 (July), 404–425.JEFFERSON, D., BECKMAN, B., AND WIELAND, F. 1987. Distributed simulation and the time
warp operating system. In Proceedings of the Eleventh ACM Symposium on OperatingSystem Principles (Austin, TX, Nov. 8-11), L. Belady, Chair. ACM Press, New York, NY.
LE GALL, D. 1991. MPEG: a video compression standard for multimedia applications.Commun. ACM 34, 4 (Apr.), 46–58.
LELAND, W. E., TAQQU, M. S., WILLINGER, W., AND WILSON, D. V. 1994. On the self-similarnature of Ethernet traffic (extended version). IEEE/ACM Trans. Netw. 2, 1 (Feb.), 1–15.
MARTINE, D., WILSEY, P., AND MCBRAYER, T. 1995. WARPED (version 0.5). University ofCincinnati, Cincinnati, OH.
MCCORMACK, W. AND SARGENT, R. G. 1981. Analysis of future event set algorithms for discreteevent simulation. Commun. ACM 24, 12 (Dec.).
MELAMED, B. 1992. TES modeling of video traffic. IEICE Trans. Fundam. Electron. Commun.Comput. Sci. E75-B, 1292–1300.
MEYER, R. AND BAGRODIA, R. 1998. Improving lookahead in parallel wireless networksimulation. In Proceedings of the Sixth International Symposium on Modeling, Analysis,and Simulation of Computer and Telecommunication Systems (MASCOTS ’98, Montreal,Que., July). 262–267.
MINZER, S. E. 1991. Broadband ISDN and asynchronous transfer mode (ATM). In BroadbandSwitching: Architectures, Protocols, Design, and Analysis, C. Chas, V. K. Konangi, and M.Sreetharan, Eds. IEEE Computer Society Press, Los Alamitos, CA, 81–89.
NICOL, D. M. 1996. Principles of conservative parallel simulation. In Proceedings of the 1996Winter Conference on Simulation (WSC ’96, Coronado, CA, Dec. 8–11), J. M. Charnes, D. J.Morrice, D. T. Brunner, and J. J. Swain, Eds. ACM Press, New York, NY, 128–135.
NICOL, D. AND HEIDELBERGER, P. 1996. On extending more parallelism to serialsimulators. SIGSIM Simul. Dig. 26, 1, 202–205.
PATEL, A. AND WILLIAMSON, C. 1997. Effective bandwidth of self-similar traffic sources:Theoretical and simulation results. In Proceedings of the IASTED Conference on AppliedModeling and Simulation (Banff, AB, Canada, July). 298–302.
PAXSON, V. AND FLOYD, S. 1995. Wide area traffic: the failure of Poisson modeling.IEEE/ACM Trans. Netw. 3, 3 (June), 226–244.
PHAM, C. D., BRUNST, H., AND FDIDA, S. 1998. Conservative simulation of load-balancedrouting in a large ATM network model. SIGSIM Simul. Dig. 28, 1, 142–149.
STEINMAN, J. 1992. SPEEDES: A unified approach to parallel simulation. In Proceedings ofthe 6th Workshop on Parallel and Distributed Simulation (PADS ’92). ACM Press, NewYork, NY.
STEVENS, W. R. 1994. TCP/IP Illustrated: The Protocols (Vol. 1). Addison-Wesley LongmanPubl. Co., Inc., Reading, MA.
SU, W. AND SEITZ, C. 1989. Variants of the Chandy-Misra-Bryant distributed discrete-eventsimulation algorithm. In Proceedings of the Conference on Distributed Simulation (Miami, FL).
TANENBAUM, A. 1996. Computer Networks. 3rd ed. Prentice-Hall, New York, NY.TAY, S. C., TEO, Y. M., AND AYANI, R. 1998. Performance analysis of time warp simulation
with cascading rollbacks. SIGSIM Simul. Dig. 28, 1, 30–37.
390 • B. Unger et al.
ACM Transactions on Modeling and Computer Simulation, Vol. 10, No. 4, October 2000.
UNGER, B. W., GOMES, F., ZHONGE, X., GBURZYNSKI, P., ONO-TESFAYE, T., RAMASWAMY, S.,WILLIAMSON, C., AND COVINGTON, A. 1995. A high fidelity ATM traffic and networksimulator. In Proceedings of the 1995 Winter Conference on Simulation (WSC ’95, Arlington,VA, Dec. 3–6), C. Alexopoulos and K. Kang, Eds. ACM Press, New York, NY, 996–1003.
WALLACE, G. K. 1991. The JPEG still picture compression standard. Commun. ACM 34, 4(Apr.), 30–44.
WANG, Y., WILLIAMSON, C., AND DOERKSEN, J. 1999. CAC performance with self-similar traffic:Simulation study and performance results. In Proceedings of the Seventh InternationalSymposium on Modeling, Analysis, and Simulation of Computer and TelecommunicationSystems (MASCOT ’99, Baltimore, MD, Oct.). 102–111.
WIELAND, F., BLAIR, E., AND ZUKAS, T. 1995. Parallel discrete-event simulation (PDES): a casestudy in design, development, and performance using SPEEDES. SIGSIM Simul. Dig. 25, 1(July), 103–110.
WILLIAMSON, C., UNGER, B., AND XIAO, Z. 1998. Parallel simulation of ATM networks: Casestudy and lessons learned. In Proceedings of the Second Canadian Conference on Broad-band Research (CCBR ’98, Ottawa, Ont., June). 78–88.
XIAO, Z., GOMES, F., UNGER, B., AND CLEARY, J. 1995. A fast asynchronous GVT algorithm forshared memory multiprocessor architecture. In Proceedings of the 9th Workshop on Paralleland Distributed Simulation (PADS ’95, Lake Placid, NY, Jun 14-16). IEEE ComputerSociety Press, Los Alamitos, CA.
XIAO, Z. AND UNGER, B. 1995a. Notes on parallelizing ATM-TN cell-level simulation models.Tech. rep. 98-629-20. University of Calgary, Calgary, Canada.
XIAO, Z. AND UNGER, B. 1995b. Report on WarpKit: Performance study and improvement.Tech. rep. 98-628-19. University of Calgary, Calgary, Canada.
XIAO, Z., UNGER, B., SIMMONDS, R., AND CLEARY, J. 1999. Scheduling critical channels inconservative parallel discrete event simulation. In Proceedings of the 13th Workshop onParallel and Distributed Simulation (PADS ’99, Atlanta, GA, May). IEEE Computer SocietyPress, Los Alamitos, CA, 20–28.
ZENG, X., BAGRODIA, R., AND GERLA, M. 1998. GloMoSim: a library for parallel simulation oflarge-scale wireless networks. SIGSIM Simul. Dig. 28, 1, 154–161.
ZORANOVIC, M. AND WILLIAMSON, C. 1999. Performance and robustness testing of explicit-rateABR flow control schemes. In Proceedings of the Seventh International Symposium onModeling, Analysis, and Simulation of Computer and Telecommunication Systems (MAS-COT ’99, Baltimore, MD, Oct.). 11–20.
Received: May 1999; revised: April 2000; accepted: April 2000
Parallel Shared-Memory Simulator Performance • 391
ACM Transactions on Modeling and Computer Simulation, Vol. 10, No. 4, October 2000.