Embed Size (px)
Citation preview
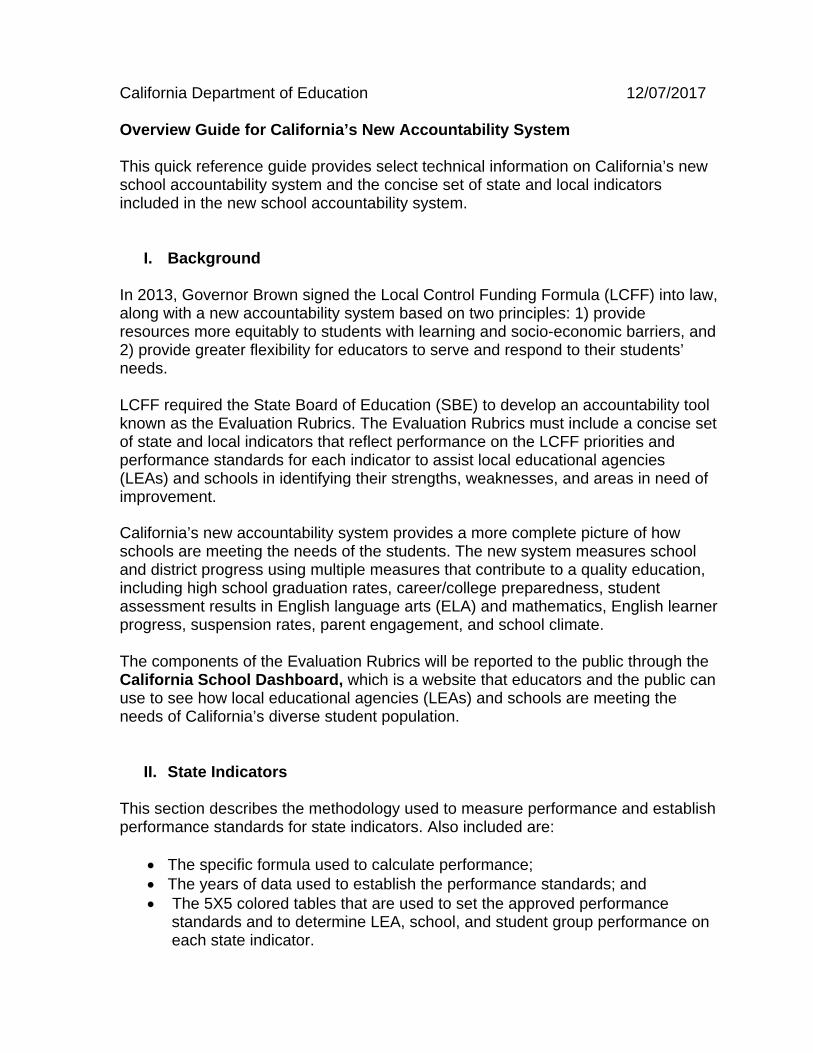
California Department of Education 12/07/2017 Overview Guide for California’s New Accountability System This quick reference guide provides select technical information on California’s new school accountability system and the concise set of state and local indicators included in the new school accountability system.
I. Background In 2013, Governor Brown signed the Local Control Funding Formula (LCFF) into law, along with a new accountability system based on two principles: 1) provide resources more equitably to students with learning and socio-economic barriers, and 2) provide greater flexibility for educators to serve and respond to their students’ needs. LCFF required the State Board of Education (SBE) to develop an accountability tool known as the Evaluation Rubrics. The Evaluation Rubrics must include a concise set of state and local indicators that reflect performance on the LCFF priorities and performance standards for each indicator to assist local educational agencies (LEAs) and schools in identifying their strengths, weaknesses, and areas in need of improvement.
California’s new accountability system provides a more complete picture of how schools are meeting the needs of the students. The new system measures school and district progress using multiple measures that contribute to a quality education, including high school graduation rates, career/college preparedness, student assessment results in English language arts (ELA) and mathematics, English learner progress, suspension rates, parent engagement, and school climate. The components of the Evaluation Rubrics will be reported to the public through the California School Dashboard, which is a website that educators and the public can use to see how local educational agencies (LEAs) and schools are meeting the needs of California’s diverse student population.
II. State Indicators
This section describes the methodology used to measure performance and establish performance standards for state indicators. Also included are:
The specific formula used to calculate performance; The years of data used to establish the performance standards; and The 5X5 colored tables that are used to set the approved performance
standards and to determine LEA, school, and student group performance on each state indicator.

2
The resource document includes the following sections related to state indicators:
Methodology for Measuring Performance Chronic Absence Suspension Rate English Learner Progress Indicator Graduation Rate College/Career Indicator Academic Indicator (English Language Arts and Mathematics Assessments)
The California Department of Education prepared a technical manual with full technical details on California’s new accountability system (http://www.cde.ca.gov/ta/ac/cm/documents/dashboardguidespring17.pdf) . This technical manual includes tables showing how distribution of statewide performance relates to the cut points for Status and Change for each state indicator that will be available this spring.
3
Methodology for Measuring Performance
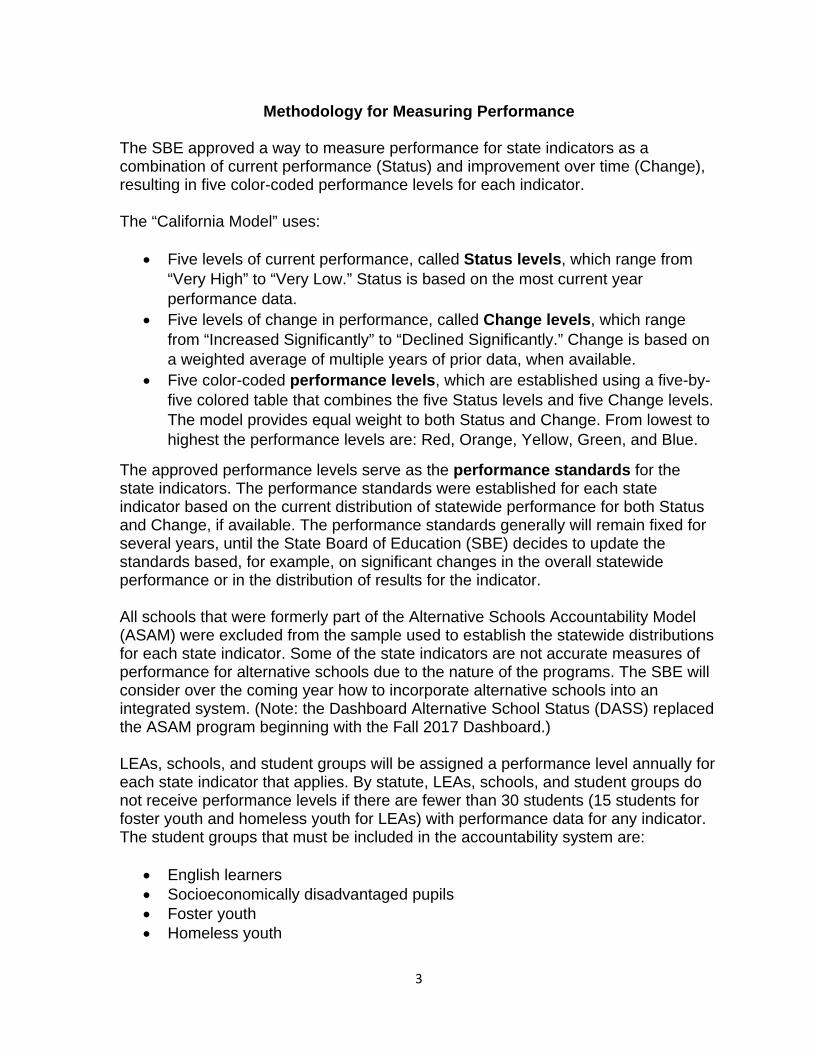
The SBE approved a way to measure performance for state indicators as a combination of current performance (Status) and improvement over time (Change), resulting in five color-coded performance levels for each indicator. The “California Model” uses:
Five levels of current performance, called Status levels, which range from “Very High” to “Very Low.” Status is based on the most current year performance data.
Five levels of change in performance, called Change levels, which range from “Increased Significantly” to “Declined Significantly.” Change is based on a weighted average of multiple years of prior data, when available.
Five color-coded performance levels, which are established using a five-by-five colored table that combines the five Status levels and five Change levels. The model provides equal weight to both Status and Change. From lowest to highest the performance levels are: Red, Orange, Yellow, Green, and Blue.
The approved performance levels serve as the performance standards for the state indicators. The performance standards were established for each state indicator based on the current distribution of statewide performance for both Status and Change, if available. The performance standards generally will remain fixed for several years, until the State Board of Education (SBE) decides to update the standards based, for example, on significant changes in the overall statewide performance or in the distribution of results for the indicator. All schools that were formerly part of the Alternative Schools Accountability Model (ASAM) were excluded from the sample used to establish the statewide distributions for each state indicator. Some of the state indicators are not accurate measures of performance for alternative schools due to the nature of the programs. The SBE will consider over the coming year how to incorporate alternative schools into an integrated system. (Note: the Dashboard Alternative School Status (DASS) replaced the ASAM program beginning with the Fall 2017 Dashboard.) LEAs, schools, and student groups will be assigned a performance level annually for each state indicator that applies. By statute, LEAs, schools, and student groups do not receive performance levels if there are fewer than 30 students (15 students for foster youth and homeless youth for LEAs) with performance data for any indicator. The student groups that must be included in the accountability system are:
English learners Socioeconomically disadvantaged pupils Foster youth Homeless youth
4
Students with disabilities Racial/ethnic groups, which include:
o American Indian/Native Alaskan o Asian o Black/African-American o Filipino o Hispanic/Latino o Native Hawaiian/Pacific Islander o Two or more races o White
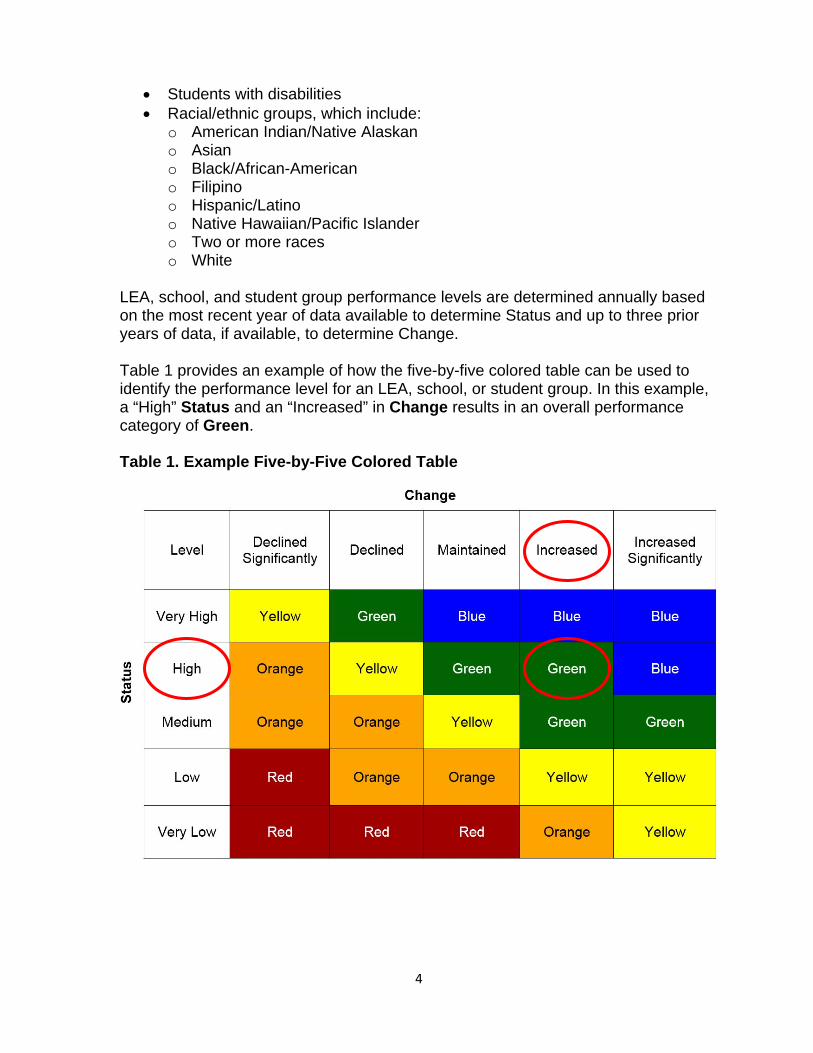
LEA, school, and student group performance levels are determined annually based on the most recent year of data available to determine Status and up to three prior years of data, if available, to determine Change. Table 1 provides an example of how the five-by-five colored table can be used to identify the performance level for an LEA, school, or student group. In this example, a “High” Status and an “Increased” in Change results in an overall performance category of Green.
Table 1. Example Five-by-Five Colored Table

5
Chronic Absence
The SBE has not yet approved performance standards for Chronic Absence. State data on chronic absence became available for the first time in fall 2017. The SBE will consider setting the Status Cut scores for Chronic Absence at their March 2018 meeting.
6
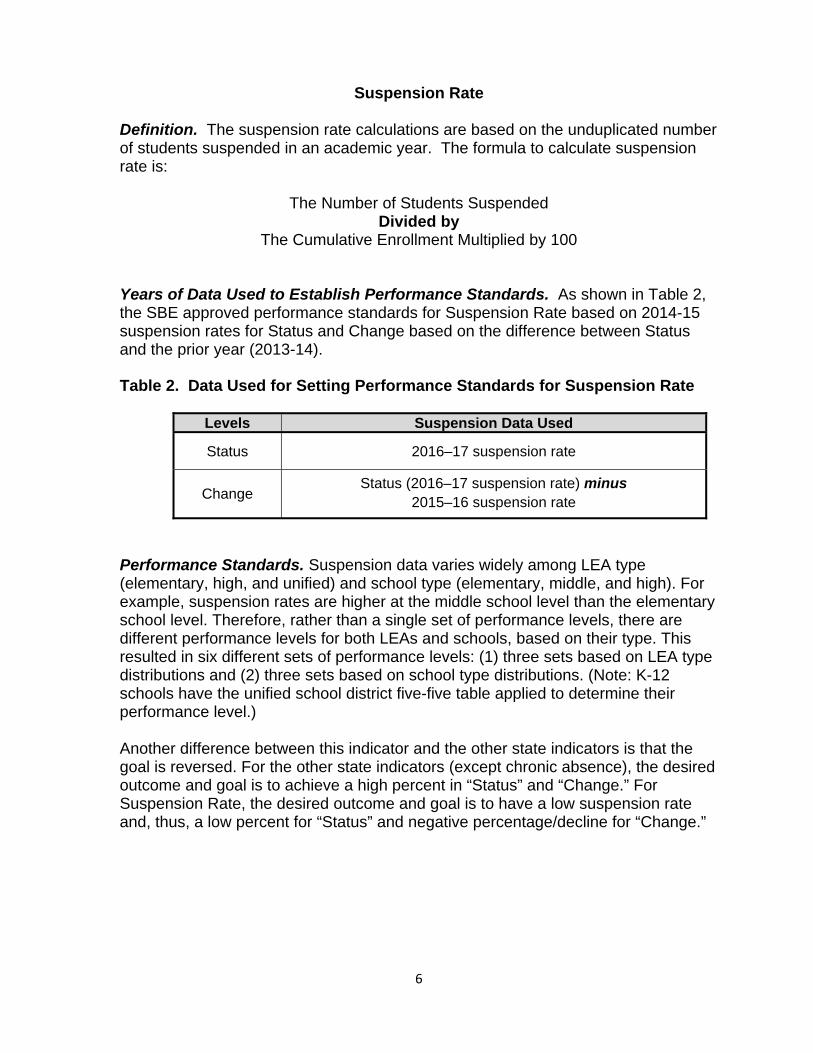
Suspension Rate Definition. The suspension rate calculations are based on the unduplicated number of students suspended in an academic year. The formula to calculate suspension rate is:
The Number of Students Suspended Divided by
The Cumulative Enrollment Multiplied by 100
Years of Data Used to Establish Performance Standards. As shown in Table 2, the SBE approved performance standards for Suspension Rate based on 2014-15 suspension rates for Status and Change based on the difference between Status and the prior year (2013-14).
Table 2. Data Used for Setting Performance Standards for Suspension Rate
Levels Suspension Data Used
Status 2016–17 suspension rate
Change Status (2016–17 suspension rate) minus
2015–16 suspension rate
Performance Standards. Suspension data varies widely among LEA type (elementary, high, and unified) and school type (elementary, middle, and high). For example, suspension rates are higher at the middle school level than the elementary school level. Therefore, rather than a single set of performance levels, there are different performance levels for both LEAs and schools, based on their type. This resulted in six different sets of performance levels: (1) three sets based on LEA type distributions and (2) three sets based on school type distributions. (Note: K-12 schools have the unified school district five-five table applied to determine their performance level.)
Another difference between this indicator and the other state indicators is that the goal is reversed. For the other state indicators (except chronic absence), the desired outcome and goal is to achieve a high percent in “Status” and “Change.” For Suspension Rate, the desired outcome and goal is to have a low suspension rate and, thus, a low percent for “Status” and negative percentage/decline for “Change.”
7
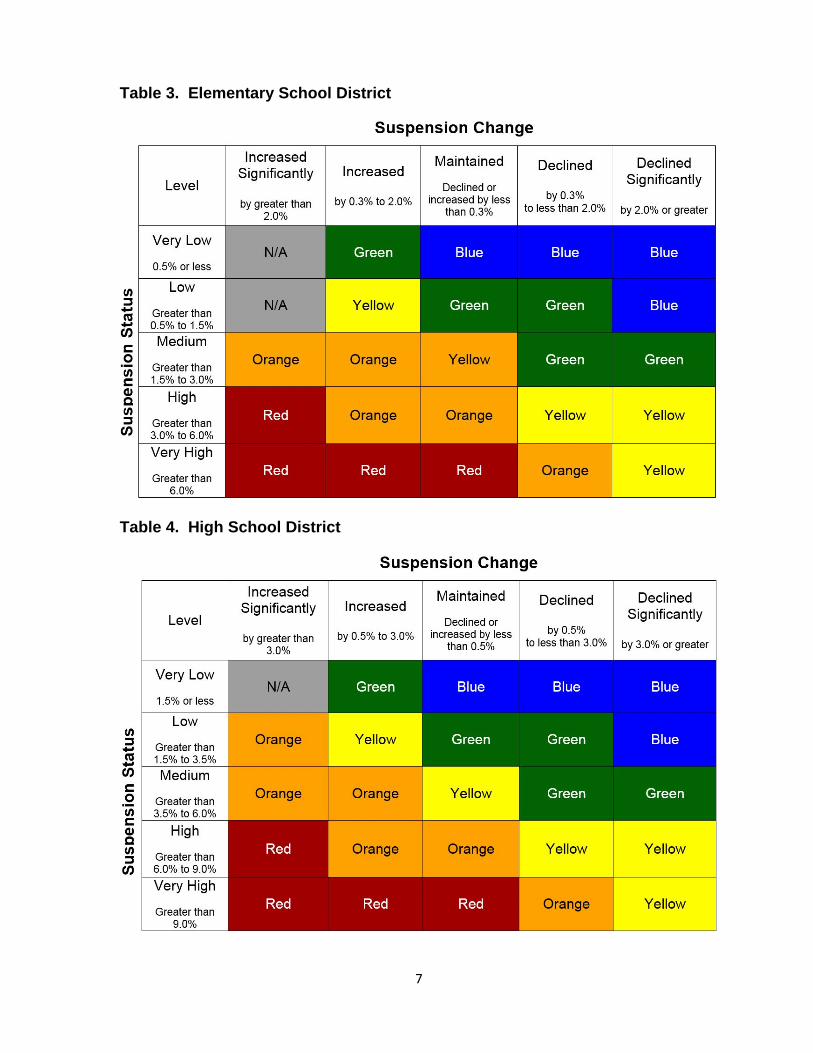
Table 3. Elementary School District
Table 4. High School District
8
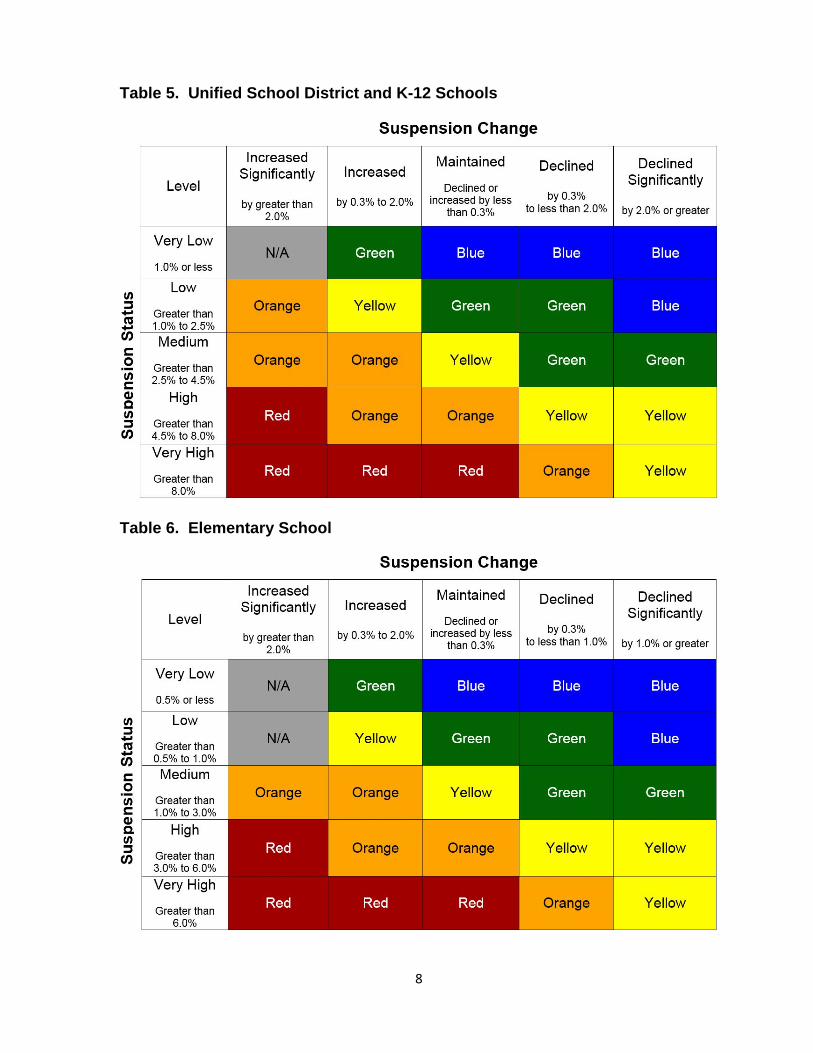
Table 5. Unified School District and K-12 Schools
Table 6. Elementary School

9
Table 7. Middle School
Table 8. High School
10
English Learner Progress Indicator Definition. The SBE approved an English Learner Progress Indicator (ELPI) that measures the percent of English learners (ELs) who are making progress toward language proficiency. The ELPI combines the number of ELs who make progress from year to year on the California English Language Development Test (CELDT), the number of Long-Term English Learners (LTEL) who make progress from year to year, and the number of English learners who are reclassified in the prior year. The formula to calculate the EL Progress Indicator is below:
Annual CELDT Takers Who Increased at least 1 CELDT Level Plus
Annual CELDT Takers Who Maintained English Proficiency in the Early Advanced/ Advanced English Levels
Plus English Learners Who Were Reclassified in the Prior Year
Plus LTEL CELDT Takers Who Increase at Least 1 CELDT Level
Divided by Total Number of Annual CELDT Takers in the Current Year
Plus English Learners Who Were Reclassified in the Prior Year
Note: The CELDT has five overall performance levels: Beginning, Early Intermediate, Intermediate, Early Advanced, and Advanced. For purposes of the EL Progress Indicator, however, the Intermediate performance level is divided into two levels, Intermediate and High Intermediate, for a total of six possible levels. ELs who advance at least one level from prior year to current year are included in the numerator of the EL Progress Indicator calculation. English learners who performed Early Advanced/Advanced English Proficient in the prior year and score Early Advanced/Advanced English Proficient in the current year will also be included in the numerator of the EL Progress Indicator calculation. ELs who were reclassified (or Reclassified Fluent English Proficient [RFEP]) in the prior year will also be included in the numerator of the EL Progress Indicator calculation.
Years of Data Used to Establish Performance Standards. As shown in Table 9 below, the performance standards for the EL Progress Indicator using the most current data available for status and the preceding year of data for Change.

11
Table 9. Data Used for Setting Performance Standards for EL Progress Indicator
Levels EL Progress Indicator Data Used
Status
Annual CELDT Takers Who Increased at least 1 CELDT Level Between the 2016 and 2017 CELDT plus
Annual CELDT Takers Who Maintained English Proficiency in the Early Advanced/ Advanced English Levels
Between the 2016 and 2017 CELDT plus
ELs Who Were Reclassified in 2015–16
divided by
Total Number of 2017 Annual CELDT Takers plus ELs Who Were Reclassified in 2015–16
Change Difference in Status from Current Year to Prior Year
Performance Standards. The performance standards for this indicator are shown in Table 10. The performance standards are based on the statewide distribution of LEA performance. Table 10. English Learner Progress Indicator Performance Standards
12
Graduation Rate
Definition. This indicator is based on the four-year cohort graduation rate. It applies only to LEAs and schools that have 30 or more students in the four-year graduation cohort. A graduation cohort is a group of high school students who could potentially graduate during a four-year time period (grade nine through grade twelve).
The formula to calculate the four-year graduation cohort for the class of 2016 is below: Number of students who earn a regular high school diploma by the end of 2015–16
cohort
Divided by
Number of first-time grade nine students in 2012–13 plus students who transfer in, minus students who transfer out, emigrate, or die during school years
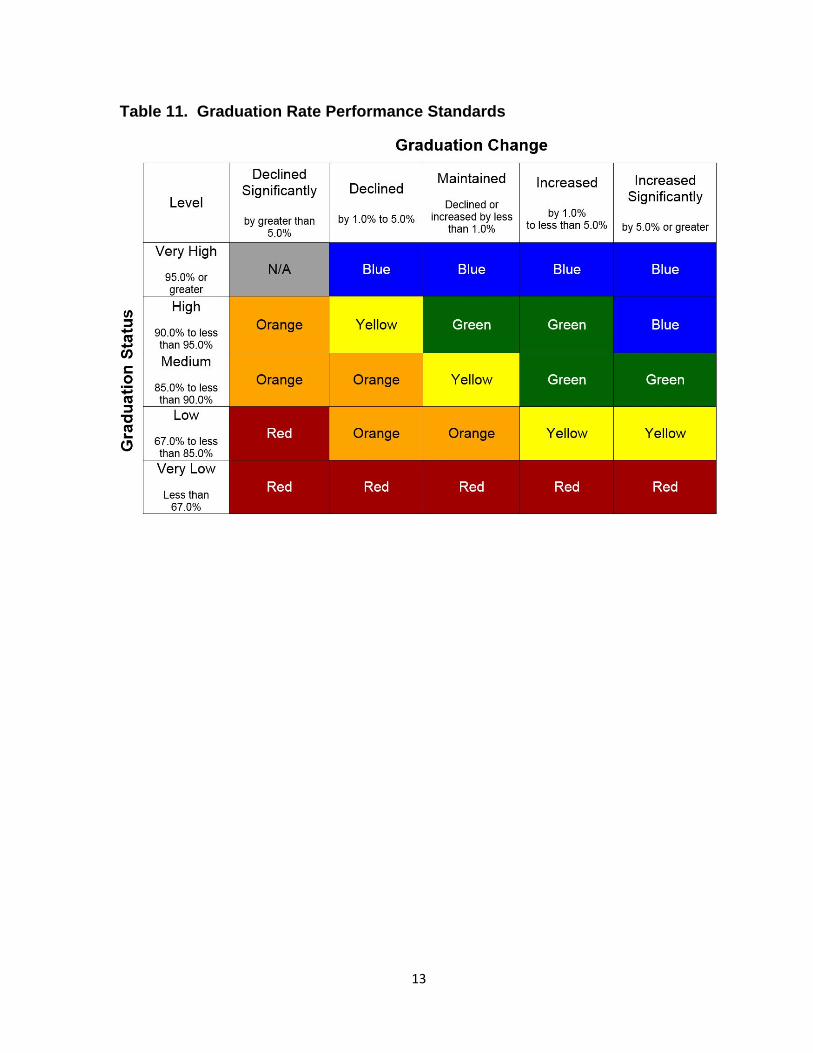
2012–13, 2013–14, 2014–15, and 2015–16. Students who earn a Special Education Certificate of Completion or a general equivalency diploma are not counted as high school graduates but are included in the denominator. Years of Data Used to Establish Performance Standards. The performance standards for Graduation Rate, based on the 2016 cohort rate for Status, and a weighted average of the 2013, 2014 and 2015 cohort rates for Change. Performance Standards. The performance standards for this indicator are shown in Table 11. The performance standards are based on the statewide distribution of LEA performance.
13
Table 11. Graduation Rate Performance Standards

14
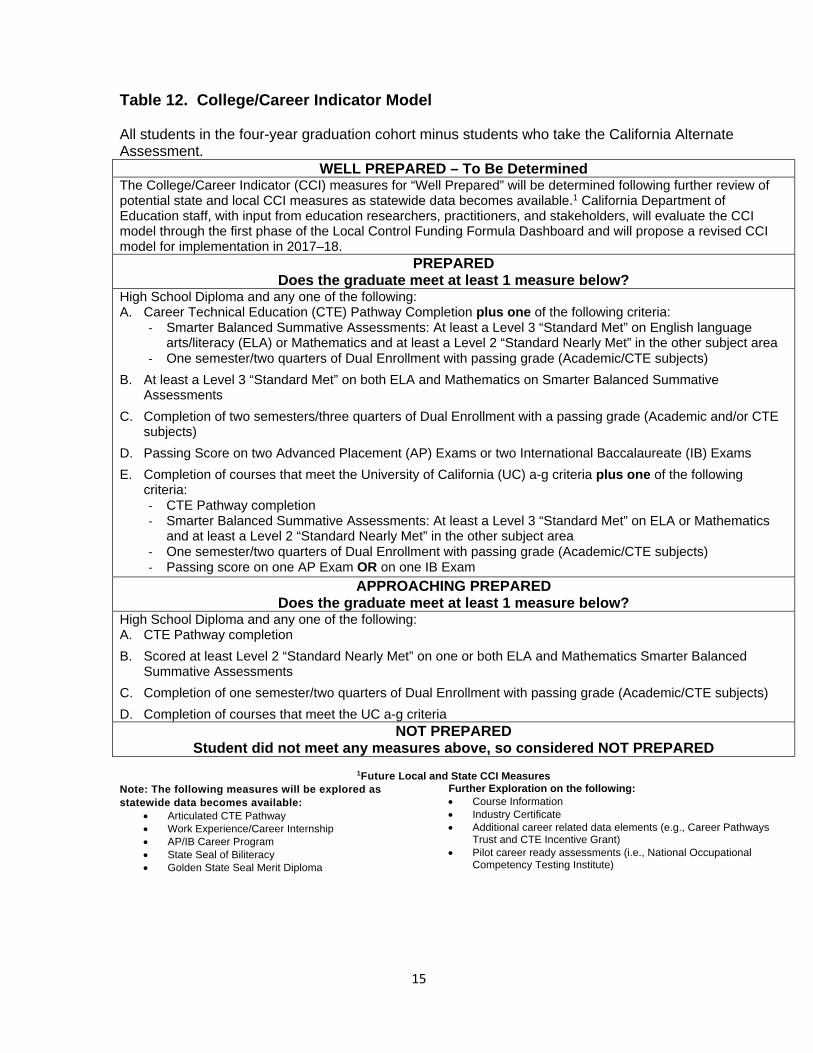
College/Career Indicator Definition. The SBE approved a College/Career Indicator (CCI) model, which is show in Table 12 below. LEA, school, and student group performance on the CCI is measured as the percentage of graduates in the four-year graduating cohort who are “Prepared.” The model includes four levels of readiness, but only three levels are currently defined, due to the absence of valid and reliable career criteria for the “Well Prepared” performance level. The criteria for the “Well Prepared” performance level will be developed when additional data on career readiness becomes available.
15
Table 12. College/Career Indicator Model All students in the four-year graduation cohort minus students who take the California Alternate Assessment.
WELL PREPARED – To Be Determined The College/Career Indicator (CCI) measures for “Well Prepared” will be determined following further review of potential state and local CCI measures as statewide data becomes available.1 California Department of Education staff, with input from education researchers, practitioners, and stakeholders, will evaluate the CCI model through the first phase of the Local Control Funding Formula Dashboard and will propose a revised CCI model for implementation in 2017–18.
PREPARED Does the graduate meet at least 1 measure below?
High School Diploma and any one of the following: A. Career Technical Education (CTE) Pathway Completion plus one of the following criteria:
‐ Smarter Balanced Summative Assessments: At least a Level 3 “Standard Met” on English language arts/literacy (ELA) or Mathematics and at least a Level 2 “Standard Nearly Met” in the other subject area
‐ One semester/two quarters of Dual Enrollment with passing grade (Academic/CTE subjects)
B. At least a Level 3 “Standard Met” on both ELA and Mathematics on Smarter Balanced Summative Assessments
C. Completion of two semesters/three quarters of Dual Enrollment with a passing grade (Academic and/or CTE subjects)
D. Passing Score on two Advanced Placement (AP) Exams or two International Baccalaureate (IB) Exams
E. Completion of courses that meet the University of California (UC) a-g criteria plus one of the following criteria: ‐ CTE Pathway completion ‐ Smarter Balanced Summative Assessments: At least a Level 3 “Standard Met” on ELA or Mathematics
and at least a Level 2 “Standard Nearly Met” in the other subject area ‐ One semester/two quarters of Dual Enrollment with passing grade (Academic/CTE subjects) ‐ Passing score on one AP Exam OR on one IB Exam
APPROACHING PREPARED Does the graduate meet at least 1 measure below?
High School Diploma and any one of the following: A. CTE Pathway completion
B. Scored at least Level 2 “Standard Nearly Met” on one or both ELA and Mathematics Smarter Balanced Summative Assessments
C. Completion of one semester/two quarters of Dual Enrollment with passing grade (Academic/CTE subjects)
D. Completion of courses that meet the UC a-g criteria NOT PREPARED
Student did not meet any measures above, so considered NOT PREPARED
1Future Local and State CCI Measures Note: The following measures will be explored as statewide data becomes available:
Articulated CTE Pathway Work Experience/Career Internship AP/IB Career Program State Seal of Biliteracy Golden State Seal Merit Diploma
Further Exploration on the following: Course Information Industry Certificate Additional career related data elements (e.g., Career Pathways
Trust and CTE Incentive Grant) Pilot career ready assessments (i.e., National Occupational
Competency Testing Institute)
16
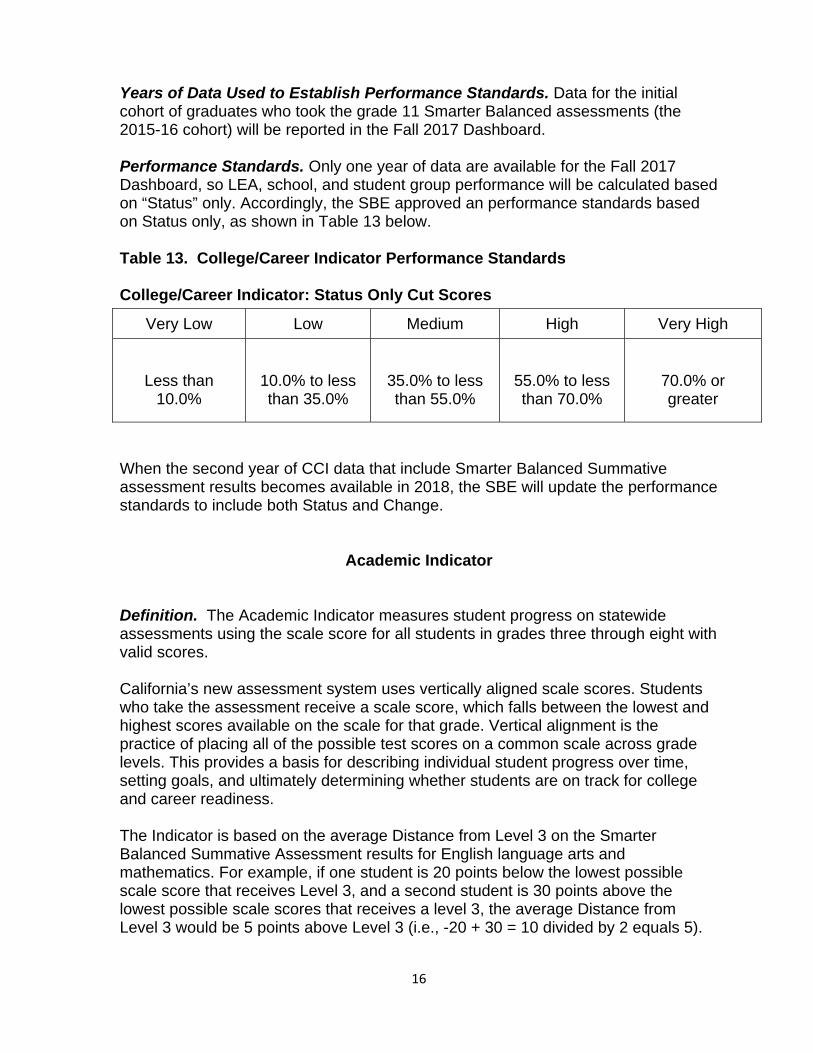
Years of Data Used to Establish Performance Standards. Data for the initial cohort of graduates who took the grade 11 Smarter Balanced assessments (the 2015-16 cohort) will be reported in the Fall 2017 Dashboard. Performance Standards. Only one year of data are available for the Fall 2017 Dashboard, so LEA, school, and student group performance will be calculated based on “Status” only. Accordingly, the SBE approved an performance standards based on Status only, as shown in Table 13 below. Table 13. College/Career Indicator Performance Standards College/Career Indicator: Status Only Cut Scores
When the second year of CCI data that include Smarter Balanced Summative assessment results becomes available in 2018, the SBE will update the performance standards to include both Status and Change.
Academic Indicator Definition. The Academic Indicator measures student progress on statewide assessments using the scale score for all students in grades three through eight with valid scores. California’s new assessment system uses vertically aligned scale scores. Students who take the assessment receive a scale score, which falls between the lowest and highest scores available on the scale for that grade. Vertical alignment is the practice of placing all of the possible test scores on a common scale across grade levels. This provides a basis for describing individual student progress over time, setting goals, and ultimately determining whether students are on track for college and career readiness. The Indicator is based on the average Distance from Level 3 on the Smarter Balanced Summative Assessment results for English language arts and mathematics. For example, if one student is 20 points below the lowest possible scale score that receives Level 3, and a second student is 30 points above the lowest possible scale scores that receives a level 3, the average Distance from Level 3 would be 5 points above Level 3 (i.e., -20 + 30 = 10 divided by 2 equals 5).
Very Low Low Medium High Very High
Less than
10.0%
10.0% to less than 35.0%
35.0% to less than 55.0%
55.0% to less than 70.0%
70.0% or greater
17
When the Spring 2017 Dashboard was released, the Change cut scores for the Academic Indicator were based on only two years of available data: 2015 and 2016. The Change distribution for these data reflected positive skewness (i.e., over 80 percent of LEAs had positive Change). However, once the 2017 Smarter Balanced Summative Assessments results were reviewed, the Change distribution reflected more symmetry (i.e., 45 percent of LEAs had positive Change). When the current Change (2016 and 2017) was applied against the five-by-five colored table, the results revealed both dramatic upward and downward swings. As a result, November 2017 SBE meeting, the SBE approved the following changes to the Academic Indicator at the November 2017 meeting: New Change Cut Scores: The SBE re-evaluated the Change cut scores
using the process of setting cut scores for all state indicators. After reviewing multiple cut score options and results, the SBE determined that the Change cut scores should be revised to be more symmetrical to align with the cut scores established for the other indicators. For instance at the “Maintained” level:
o The range is now between less than -3 to less than +3 whereas the original cut scores had the range at: Less than -1 to less than +7 for ELA Less than -1 to less than +5 for mathematics
The SBE-approved new Change cut scores for both ELA and mathematics and are referenced in Appendix A.
Revised Status Cut Scores for Mathematics: The Status cut points for the “High” and “Medium” levels for mathematics only were adjusted to ensure that LEAs and schools cannot receive a “High” Status if they have a negative DF3.
Revised Five-by-Five Colored Table: The SBE approved new color designations for the five-by-five colored table to bring more stability. The approved revisions limits each row in the five-by-five colored table to two performance level (colors). (The former five-by-five colored table had three or more performance levels for each row.) Since each row now only has two colors, LEAs and schools that maintain their Status will always be one of two colors regardless of their Change. As a result, a school with a “Very High” Status can only move from Blue to Green if it declines. A school will a “Very Low” Status can only move from Red to Orange if it increases. Therefore, a school with a Red performance level must obtain a Low Status to move to a Yellow performance level (e.g., move from -85 DF3 to -70 DF3).
18
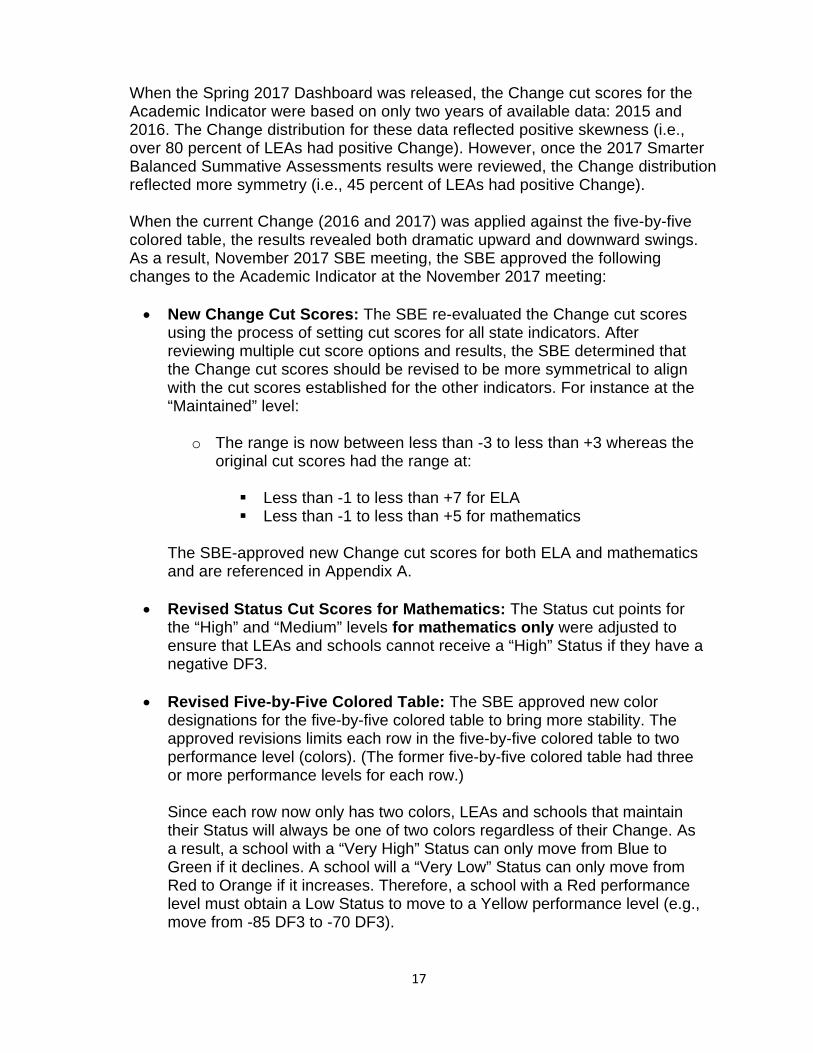
Performance Standards. The performance standards for this indicator are shown in Tables 14 and 15. The performance standards are based on the statewide distribution of LEA performance. Table 14. ELA Academic Indicator Performance Standards
19
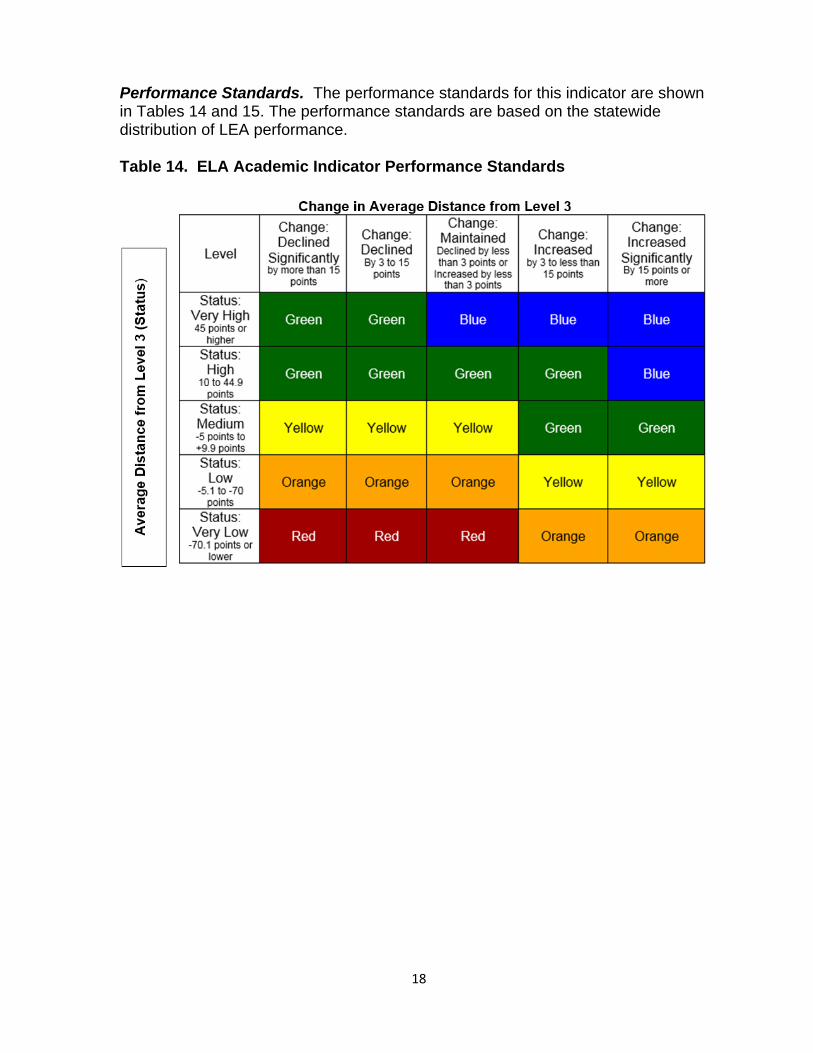
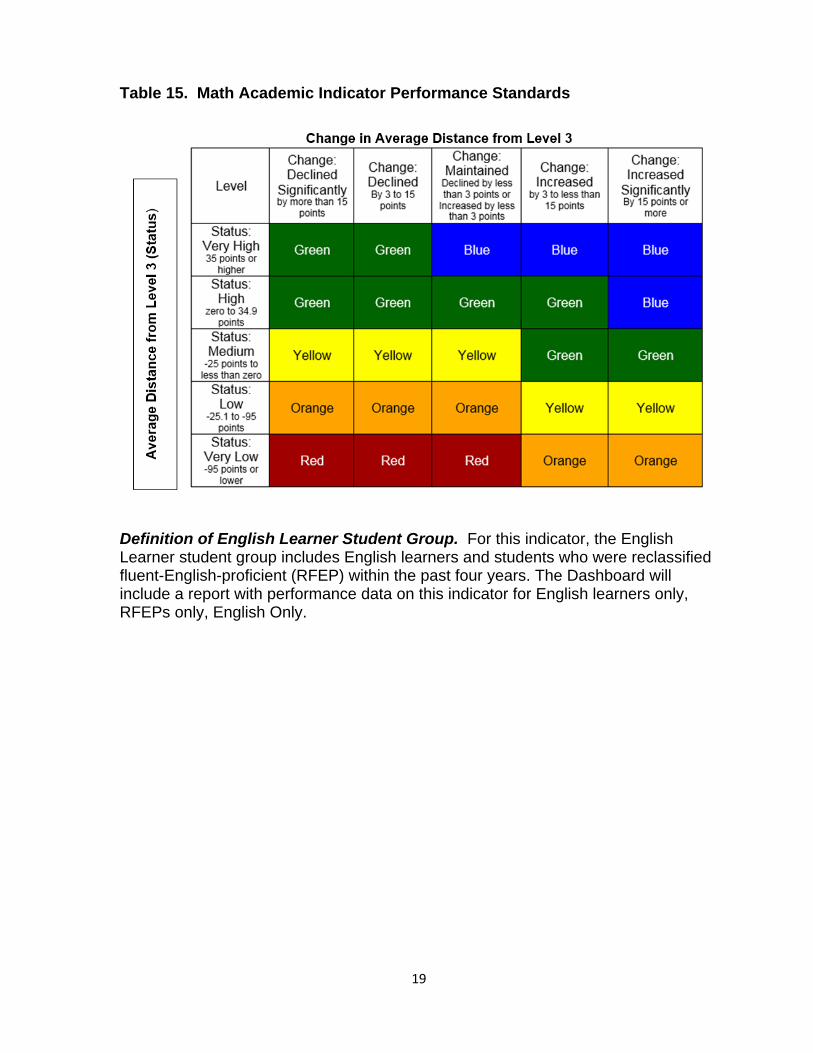
Table 15. Math Academic Indicator Performance Standards
Definition of English Learner Student Group. For this indicator, the English Learner student group includes English learners and students who were reclassified fluent-English-proficient (RFEP) within the past four years. The Dashboard will include a report with performance data on this indicator for English learners only, RFEPs only, English Only.

20
III. Local Performance Indicators
This section describes the methodology used to measure performance and establish performance standards for local performance indicators, the standards for each local performance indicator, and the self-reflection tools that LEAs will use as evidence that they have Met the standards for the local performance indicators. The resource document includes the following sections:
Methodology for Measuring Performance Approved Performance Standards Approved Self-Reflection Tools

21
Methodology for Measuring Performance
The SBE approved standards for the local performance indicators that support LEAs in measuring and reporting their progress within the relevant LCFF priority. For each local performance indicator, the approved standard involves:
(1) measuring LEA progress on the local performance indicator based on locally available information, and
(2) reporting the results to the LEA’s local governing board at a regularly scheduled meeting of the local governing board and to stakeholders and the public through the Dashboard.
LEAs determine whether they have [Met, Not Met, or Not Met for More than Two Years] the standard for each applicable local performance indicator. LEAs make this determination by using self-reflection tools included in the Dashboard, which will allow them to measure and report their progress through the Dashboard user interface. By meeting the standard, LEAs will collect and reflect on locally available information relevant to progress on that LCFF priority, which will support local planning and improvement efforts.
22
Approved Performance Standards
The SBE approved performance standards for all local performance indicators. The approved standards are below. Appropriately Assigned Teachers, Access to Curriculum-Aligned Instructional Materials, and Safe, Clean and Functional School Facilities (Priority 1) Standard: LEA annually measures its progress in meeting the Williams settlement requirements at 100% at all of its school sites, as applicable, and promptly addresses any complaints or other deficiencies identified throughout the academic year, as applicable; and provides information annually on progress meeting this standard to its local governing board at a regularly scheduled meeting of the local governing board and to stakeholders and the public through the Dashboard. Implementation of State Academic Standards (Priority 2) Standard: LEA annually measures its progress implementing state academic standards and reports the results to its local governing board at a regularly scheduled meeting of the local governing board and to stakeholders and the public through the Dashboard. Parent Engagement (Priority 3) Standard: LEA annually measures its progress in (1) seeking input from parents in decision making and (2) promoting parental participation in programs, and reports the results to its local governing board at a regularly scheduled meeting of the local governing board and to stakeholders and the public through the Dashboard. School Climate (Priority 6) Standard: LEA administers a local climate survey at least every other year that provides a valid measure of perceptions of school safety and connectedness, such as the California Healthy Kids Survey, to students in at least one grade within the grade span(s) that the LEA serves (e.g., K-5, 6-8, 9-12), and reports the results to its local governing board at a regularly scheduled meeting of the local governing board and to stakeholders and the public through the Dashboard. Coordination of Services for Expelled Students – COE Only (Priority 9) Standard: COE annually measures its progress in coordinating instruction as required by Education Code Section 48926 and reports the results to its local governing board at a regularly scheduled meeting of the local governing board and to stakeholders and the public through the Dashboard.
Coordination of Services for Foster Youth – COE Only (Priority 10) Standard: COE annually measures its progress in coordinating services for foster youth and reports the results to its local governing board at a regularly scheduled meeting of the local governing board and to stakeholders and the public through the Dashboard.
23
Self-Reflection Tools
For each local performance indicator, LEAs will use the self-reflection tool included in the Dashboard to support their determination of whether they have Met the performance standard. The self-reflection tools are designed support LEAs in measuring their progress on the local performance indicators. The self-reflection tools are also embedded in the web-based Dashboard system, which will assist LEAs in reporting the results to their local governing boards and to the public and stakeholders. The approved self-reflection tools are included below. Appropriately Assigned Teachers, Access to Curriculum-Aligned Instructional Materials, and Safe, Clean and Functional School Facilities (Priority 1) LEAs will provide the information below:
Number/percentage of misassignments of teachers of English learners, total teacher misassignments, and vacant teacher positions:
Number/percentage of students without access to their own copies of
standards-aligned instructional materials for use at school and at home:
Number of identified instances where facilities do not meet the “good repair” standard (including deficiencies and extreme deficiencies):
Note: The requested information are all data elements that are currently required as part of the School Accountability Report Card (SARC). In the future, for LEAs that use the California Department of Education’s SARC template, this information will be auto-populated within the web-based Dashboard system. LEAs that do not use the California Department of Education’s SARC template will input this information in the web-based Dashboard system.
24
Implementation of State Academic Standards (Priority 2) LEAs may provide a narrative summary of their progress in the implementation of state academic standards based on locally selected measures or tools (Option 1). Alternatively, LEAs may complete the optional reflection tool (Option 2). OPTION 1: Narrative Summary In the narrative box provided on the Dashboard, identify the locally selected measures or tools that the LEA is using to track its progress in implementing the state academic standards adopted by the state board and briefly describe why the LEA chose the selected measures or tools. Additionally, summarize the LEA’s progress in implementing the academic standards adopted by the State Board of Education, based on the locally selected measures or tools. The adopted academic standards are:
English Language Arts (ELA) – Common Core State Standards for ELA English Language Development (ELD) (Aligned to Common Core State
Standards for ELA ) Mathematics – Common Core State Standards for Mathematics Next Generation Science Standards History-Social Science Career Technical Education Health Education Content Standards Physical Education Model Content Standards Visual and Performing Arts World Language
25
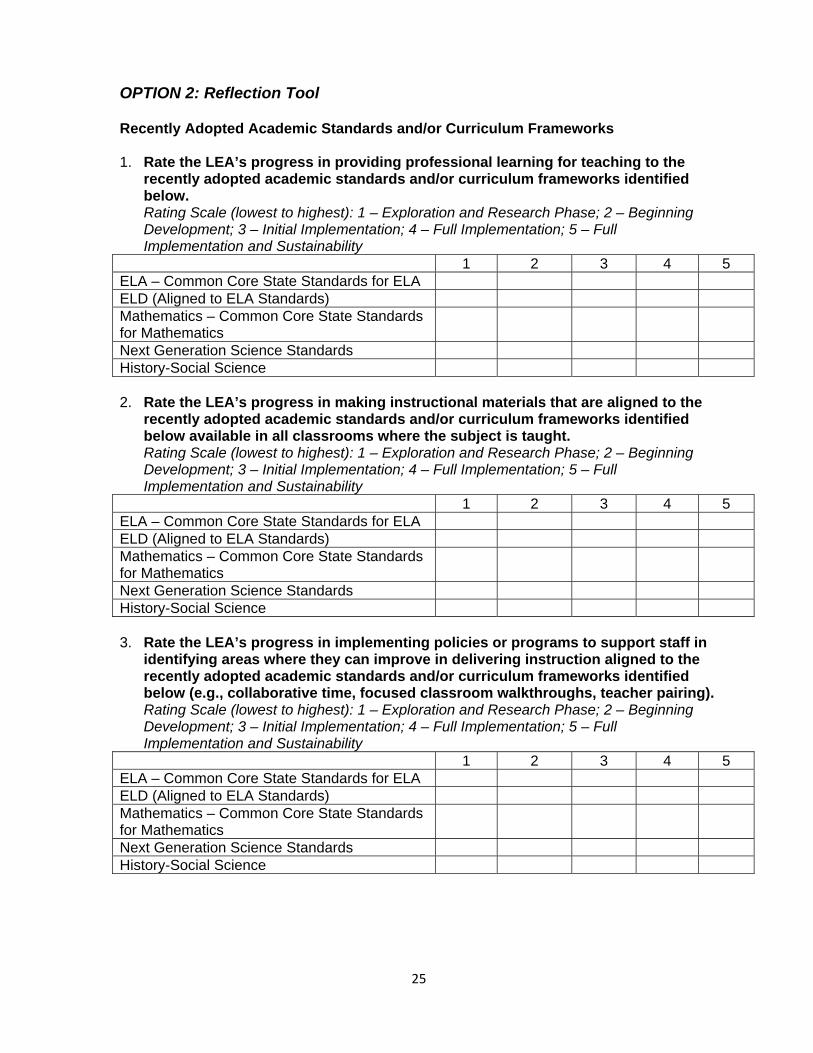
OPTION 2: Reflection Tool Recently Adopted Academic Standards and/or Curriculum Frameworks 1. Rate the LEA’s progress in providing professional learning for teaching to the
recently adopted academic standards and/or curriculum frameworks identified below. Rating Scale (lowest to highest): 1 – Exploration and Research Phase; 2 – Beginning Development; 3 – Initial Implementation; 4 – Full Implementation; 5 – Full Implementation and Sustainability
1 2 3 4 5 ELA – Common Core State Standards for ELA ELD (Aligned to ELA Standards) Mathematics – Common Core State Standards for Mathematics
Next Generation Science Standards History-Social Science 2. Rate the LEA’s progress in making instructional materials that are aligned to the
recently adopted academic standards and/or curriculum frameworks identified below available in all classrooms where the subject is taught. Rating Scale (lowest to highest): 1 – Exploration and Research Phase; 2 – Beginning Development; 3 – Initial Implementation; 4 – Full Implementation; 5 – Full Implementation and Sustainability
1 2 3 4 5 ELA – Common Core State Standards for ELA ELD (Aligned to ELA Standards) Mathematics – Common Core State Standards for Mathematics
Next Generation Science Standards History-Social Science 3. Rate the LEA’s progress in implementing policies or programs to support staff in
identifying areas where they can improve in delivering instruction aligned to the recently adopted academic standards and/or curriculum frameworks identified below (e.g., collaborative time, focused classroom walkthroughs, teacher pairing). Rating Scale (lowest to highest): 1 – Exploration and Research Phase; 2 – Beginning Development; 3 – Initial Implementation; 4 – Full Implementation; 5 – Full Implementation and Sustainability
1 2 3 4 5 ELA – Common Core State Standards for ELA ELD (Aligned to ELA Standards) Mathematics – Common Core State Standards for Mathematics
Next Generation Science Standards History-Social Science
26
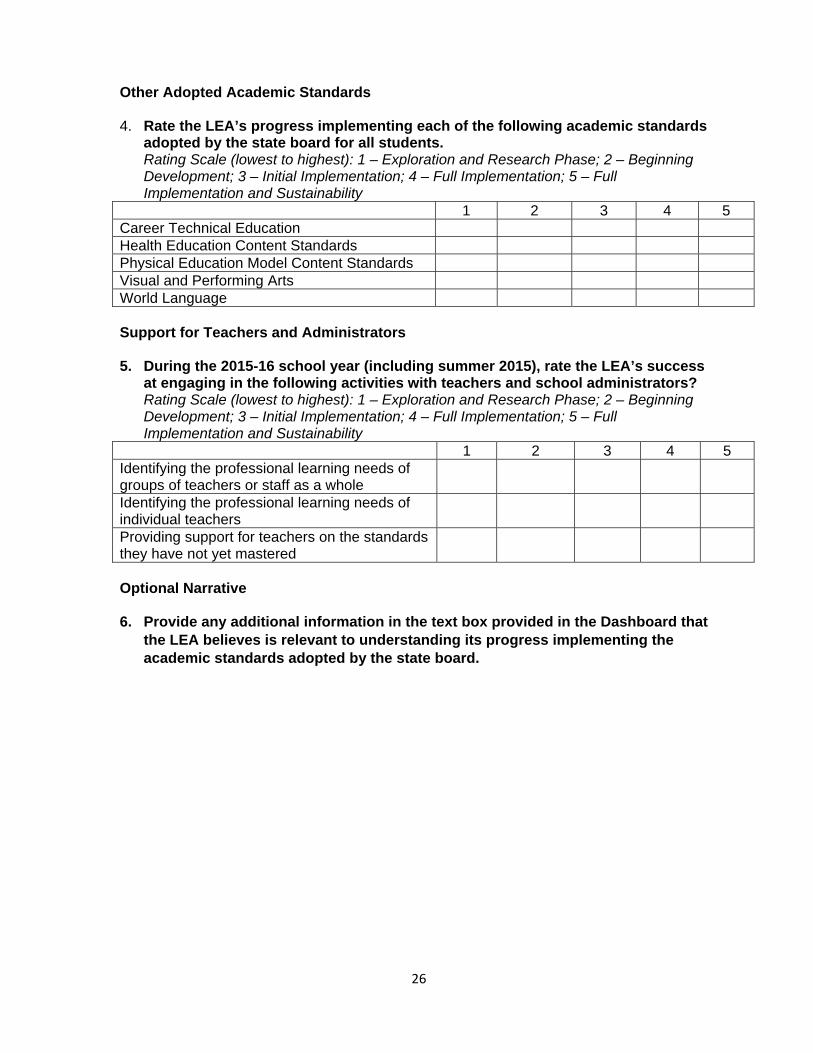
Other Adopted Academic Standards 4. Rate the LEA’s progress implementing each of the following academic standards
adopted by the state board for all students. Rating Scale (lowest to highest): 1 – Exploration and Research Phase; 2 – Beginning Development; 3 – Initial Implementation; 4 – Full Implementation; 5 – Full Implementation and Sustainability
1 2 3 4 5 Career Technical Education Health Education Content Standards Physical Education Model Content Standards Visual and Performing Arts World Language Support for Teachers and Administrators 5. During the 2015-16 school year (including summer 2015), rate the LEA’s success
at engaging in the following activities with teachers and school administrators? Rating Scale (lowest to highest): 1 – Exploration and Research Phase; 2 – Beginning Development; 3 – Initial Implementation; 4 – Full Implementation; 5 – Full Implementation and Sustainability
1 2 3 4 5 Identifying the professional learning needs of groups of teachers or staff as a whole
Identifying the professional learning needs of individual teachers
Providing support for teachers on the standards they have not yet mastered
Optional Narrative 6. Provide any additional information in the text box provided in the Dashboard that
the LEA believes is relevant to understanding its progress implementing the academic standards adopted by the state board.
27
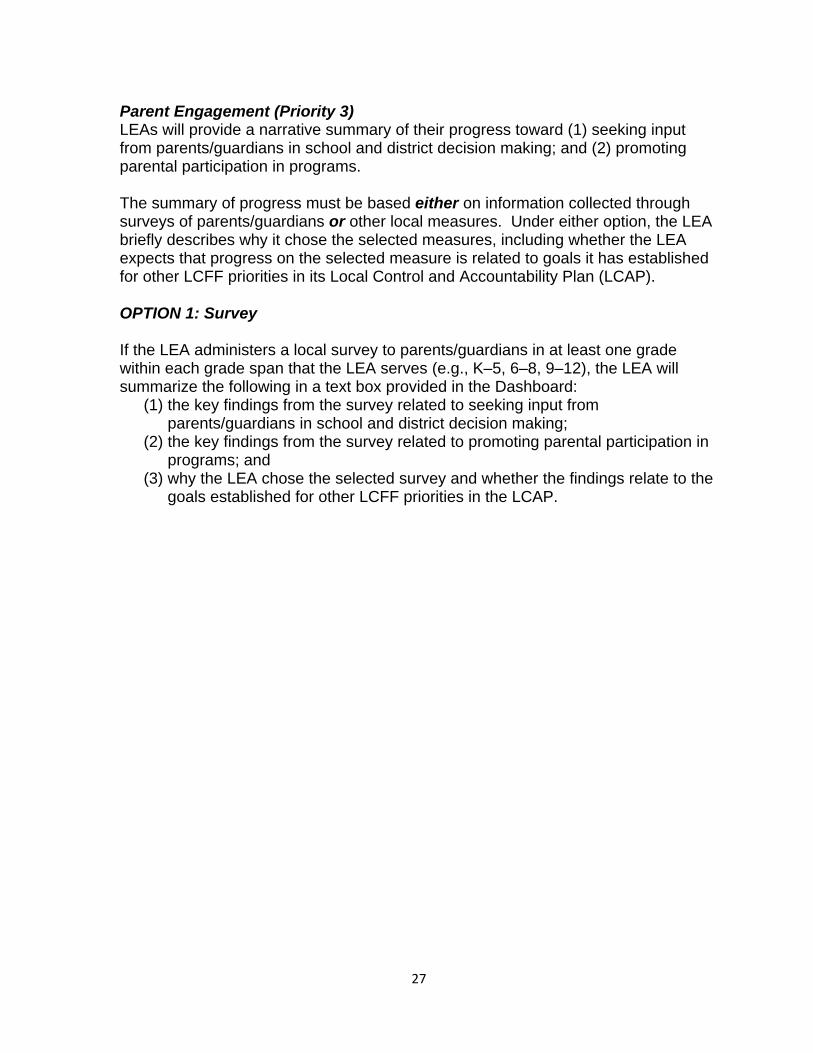
Parent Engagement (Priority 3) LEAs will provide a narrative summary of their progress toward (1) seeking input from parents/guardians in school and district decision making; and (2) promoting parental participation in programs. The summary of progress must be based either on information collected through surveys of parents/guardians or other local measures. Under either option, the LEA briefly describes why it chose the selected measures, including whether the LEA expects that progress on the selected measure is related to goals it has established for other LCFF priorities in its Local Control and Accountability Plan (LCAP). OPTION 1: Survey If the LEA administers a local survey to parents/guardians in at least one grade within each grade span that the LEA serves (e.g., K–5, 6–8, 9–12), the LEA will summarize the following in a text box provided in the Dashboard:
(1) the key findings from the survey related to seeking input from parents/guardians in school and district decision making;
(2) the key findings from the survey related to promoting parental participation in programs; and
(3) why the LEA chose the selected survey and whether the findings relate to the goals established for other LCFF priorities in the LCAP.

28
OPTION 2: Local Measures Summarize in a text box provided in the Dashboard the following:
(1) the LEA’s progress on at least one measure related to seeking input from parents/guardians in school and district decision making;
(2) the LEA’s progress on at least one measure related to promoting parental participation in programs; and
(3) why the LEA chose the selected measures and whether the findings relate to the goals established for other LCFF priorities in the LCAP.
Examples of measures that LEAs could select are listed below.
A. Seeking Input in School/District Decision Making 1. Measure of teacher and administrator participation in professional
development opportunities related to engaging parents/guardians in decision making.
2. Measure of participation by parents/guardians in trainings that also involve school/district staff to build capacity in working collaboratively.
3. Measure of parent/guardian participation in meetings of the local governing board and/or advisory committees.
B. Promoting Participation in Programs
1. Measure of whether school sites have access to interpretation and translation services to allow parents/guardians to participate fully in educational programs and individual meetings with school staff related to their child’s education.
2. Measure of whether school sites provide trainings or workshops for parents/guardians that are linked to student learning and/or social-emotional development and growth.
3. Measure of whether school and district staff (teachers, administrators, support staff) have completed professional development on effective parent/guardian engagement in the last two school years.
29
School Climate (Priority 6) LEAs will provide a narrative summary of the local administration and analysis of a local climate survey that captures a valid measure of student perceptions of school safety and connectedness in at least one grade within the grade span (e.g., K–5, 6–8, 9–12) in a text box provided in the Dashboard. Specifically, LEAs will have an opportunity to include differences among student groups, and for surveys that provide an overall score, such as the California Healthy Kids Survey, report the overall score for all students and student groups. This summary may also include an analysis of a subset of specific items on a local survey that is particularly relevant to school safety and connectedness.
30
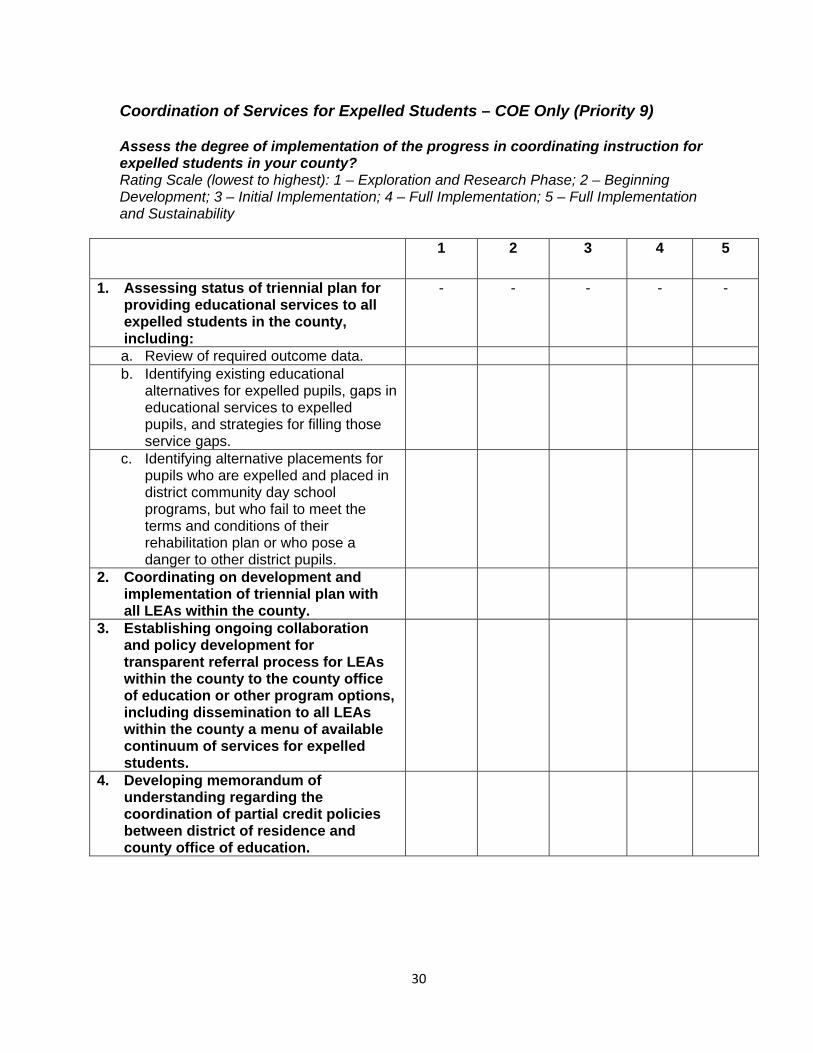
Coordination of Services for Expelled Students – COE Only (Priority 9) Assess the degree of implementation of the progress in coordinating instruction for expelled students in your county? Rating Scale (lowest to highest): 1 – Exploration and Research Phase; 2 – Beginning Development; 3 – Initial Implementation; 4 – Full Implementation; 5 – Full Implementation and Sustainability
1 2 3 4 5
1. Assessing status of triennial plan for providing educational services to all expelled students in the county, including:
- - - - -
a. Review of required outcome data. b. Identifying existing educational
alternatives for expelled pupils, gaps in educational services to expelled pupils, and strategies for filling those service gaps.
c. Identifying alternative placements for pupils who are expelled and placed in district community day school programs, but who fail to meet the terms and conditions of their rehabilitation plan or who pose a danger to other district pupils.
2. Coordinating on development and implementation of triennial plan with all LEAs within the county.
3. Establishing ongoing collaboration and policy development for transparent referral process for LEAs within the county to the county office of education or other program options, including dissemination to all LEAs within the county a menu of available continuum of services for expelled students.
4. Developing memorandum of understanding regarding the coordination of partial credit policies between district of residence and county office of education.

31
Coordination of Services for Foster Youth – COE Only (Priority 10) Assess the degree of implementation of coordinated service program components for foster youth in your county? Rating Scale (lowest to highest): 1 – Exploration and Research Phase; 2 – Beginning Development; 3 – Initial Implementation; 4 – Full Implementation; 5 – Full Implementation and Sustainability
1 2 3 4 5
1. Establishing ongoing collaboration and supporting policy development, including establishing formalized information sharing agreements with child welfare, probation, Local Education Agency (LEAs), the courts, and other organizations to support determining the proper educational placement of foster youth (e.g., school of origin versus current residence, comprehensive versus alternative school, and regular versus special education).
2. Building capacity with LEA, probation, child welfare, and other organizations for purposes of implementing school-based support infrastructure for foster youth intended to improve educational outcomes (e.g., provide regular professional development with the Foster Youth Liaisons to facilitate adequate transportation services for foster youth).
3. Providing information and assistance to LEAs regarding the educational needs of foster youth in order to improve educational outcomes.
4. Providing direct educational services for foster youth in LEA or county-operated programs provided the school district has certified that specified services cannot be provided or funded using other sources, including, but not limited to, Local Control Funding Formula, federal, state or local funding.
5. Establishing ongoing collaboration and supporting development of policies and procedures that facilitate expeditious transfer of records, transcripts, and other relevant educational information.
6. Facilitating the coordination of post-secondary opportunities for youth by engaging with systems partners, including, but not limited to, child welfare transition planning and independent living services, community colleges or universities, career technical education, and workforce development providers.
7. Developing strategies to prioritize the needs of foster youth in the community, using community-wide assessments that consider age group, geographical area, and identification of highest needs students based on academic needs and placement type.
8. Engaging in the process of reviewing plan deliverables and of collecting and analyzing LEA and COE level outcome data for purposes of evaluating effectiveness of support services for foster youth and whether the investment in services contributes to improved educational outcomes for foster youth.