Embed Size (px)
Citation preview

BRACKEN DARRELL
President and CEO
OUTLOOK &
STRATEGY

FORWARD-LOOKING STATEMENTS This presentation includes forward-looking statements within the meaning of the U.S. federal securities laws, including, without limitation, statements regarding: projected
return, innovation, growth, growth methods, product category sales and growth, optimizing operations, operational improvements and opportunities, costs, design, design focus,
market drivers, capabilities, strengths, strategies, consumer satisfaction, sales and channel opportunities, inventory, investments, gross margin, f iscal year 2017 and f iscal year
2018 sales growth and operating income, f iscal year 2018 tax rate and other outlook assumptions, long-term business model, sustainability of growth and business model,
capital allocation f ramework, acquisitions, dividends, share repurchases, return of f ree cash f low to shareholders, earnings per share and roadmap for increasing earnings per
share. These statements are subject to risks and uncertainties that may cause actual results and events to dif fer materially, including without limitation: if our product of ferings,
marketing activities and investment prioritization decisions do not result in the sales, prof itability or prof itability growth we expect, or when we expect it; the demand of our
customers and our consumers for our products and our ability to accurately forecast it; if we fail to innovate and develop new products in a timely and cost-ef fective manner for
our new and existing product categories; if we do not successfully execute on our growth opportunities or our growth opportunities are more limited than we expect; if sales of
PC peripherals are less than we expect; the ef fect of pricing, product, marketing and other initiatives by our competitors, and our reaction to them, on our sales, gross margins
and prof itability; if our products and marketing strategies fail to separate our products f rom competitors’ products; if we do not fully realize our goals to lower our costs and
improve our operating leverage; if there is a deterioration of business and economic conditions in one or more of our sales regions or product categories, or signif icant
f luctuations in exchange rates. These and other risks and uncertainties are detailed in Logitech’s f ilings with the Securities and Exchange Commission, including its Quarterly
Report on Form 10-Q for the f iscal quarter ended December 31, 2016 and its Annual Report on Form 10-K for the f iscal year ended March 31, 2016, available at www.sec.gov,
under the caption Risk Factors and elsewhere. Logitech does not undertake any obligation to update any forward-looking statements to ref lect new information or events or
circumstances occurring af ter the date of this presentation.
To facilitate comparisons to Logitech’s historical results, we have included non-GAAP adjusted measures in this presentation, which exclude primarily share-based
compensation expense, amortization of intangible assets, purchase accounting ef fect on inventory, acquisition-related costs, change in fair value of contingent consideration for
business acquisition, restructuring charges (credits), gain (loss) on equity-method investment, investigation and related expenses, non-GAAP income tax adjustment, and other
items detailed under “Supplemental Financial Information” in our quarterly earnings press release and posted to our website at http://ir.logitech.com. Historical GAAP and
corresponding non-GAAP measures are provided with our earnings releases and presentations in the Investors section of our website. We also present percentage sales
growth in constant currency (“CC”) to show performance unaf fected by f luctuations in currency exchange rates. Percentage sales growth in constant currency is calculated by
translating prior period sales in each local currency at the current period’s average exchange rate for that currency and comparing that to current period sales. Logitech believes
this information will help investors to evaluate its current period performance, outlook and trends in its business. For historical f inancials provided in this presentation,
reconciliation between non-GAAP amounts and GAAP amounts is provided on the Investors page of our website, together with this presentation and with our earnings releases.
With respect to f inancial outlook, most of the excluded amounts pertain to events that have not yet occurred and are not currently possible to estimate with a reasonable degree
of accuracy. Therefore, no reconciliation to GAAP amounts has been provided for non-GAAP outlook.

SOME WOULD SAY
“WE’VE COME
A LONG WAY”

RE-IGNITED SALES GROWTH
Comparisons are YoY and based on net retail sales in constant currency

TRIPLED NON-GAAP OPERATING PROFITS
FY13 non-GAAP operating prof its include Lifesize

CREATED A MORE POWERFUL PORTFOLIO
New categories represent sales f rom tablets & accessories, mobile speakers,
Jaybird, gaming, video collaboration, and home control
Mix represents mix of products whose sales are growing double-digit YoY and
in constant currency

BUILDING A REPUTATION FOR DESIGN

BIG COMPANY START-UPS
A UNIQUE TECHNOLOGY PLAYER

GREW BEHIND PCs
PC

GREW BEHIND PCs
PC

GREW BEHIND PCs
PC PC

CLOUD IS THE NEW MARKET DRIVER
SMART
HOME
VIDEO
CONFERENCING
MUSIC
GAMING

CLOUD IS THE NEW MARKET DRIVER
SMART
HOME
VIDEO
CONFERENCING
MUSIC
GAMING
ADJACENCIES
MARKET GROWTH
SHARE GAIN

ADJACENCIES
CLOUD IS THE NEW MARKET DRIVER
MUSIC
GAMING
VIDEO
CONFERENCING
SMART
HOME
MARKET GROWTH
SHARE GAIN

BUILDING 5 CAPABILITIES

BIG COMPANY
START-UPS
OPERATIONS CAPABILITY MANUFACTURING IS A COMPETITIVE ADVANTAGE
Ensure confidentiality
More difficult projects
Low-cost manufacturing

DESIGN CAPABILITY STRATEGIC & CREATIVE DESIGN BECOMING A STRENGTH
DESIGN EXPERIENCES
THAT ARE LOVED BY PEOPLE
CREATING
DESIGN AS A BEHAVIOR

ENGINEERING CAPABILITY STRONG AND EXPANDING
HARDWARE
SOFTWARE
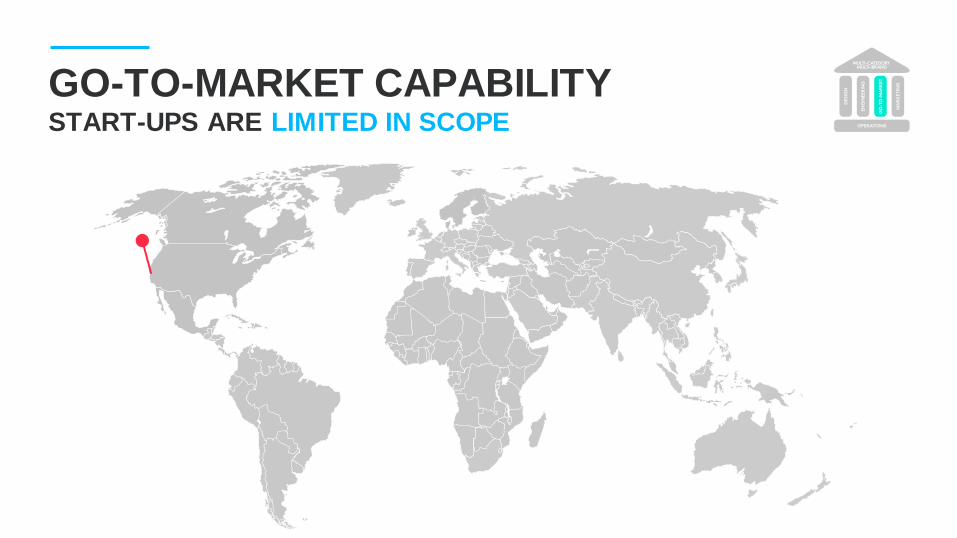
GO-TO-MARKET CAPABILITY START-UPS ARE LIMITED IN SCOPE

GO-TO-MARKET CAPABILITY START-UPS ARE LIMITED IN SCOPE

GO-TO-MARKET CAPABILITY START-UPS ARE LIMITED IN SCOPE

GO-TO-MARKET CAPABILITY WE “PUNCH ABOVE OUR WEIGHT”

MARKETING CAPABILITY BRAND BUILDING - THE OLD WAY…
TELEVISION PRINT BILLBOARDS SPONSORSHIP

MARKETING CAPABILITY BRAND BUILDING - THE NEW WAY

OP
ER
AT
ION
S
DE
SIG
N
HA
RD
WA
RE
SO
FT
WA
RE
GO
-TO
-MK
T
MA
RK
ET
ING
SCORECARD


![Looking back and looking forward[1]](https://img.dokumen.tips/doc/110x75/5559ad0dd8b42aa4288b511b/looking-back-and-looking-forward1.jpg)